Embed Size (px)
Citation preview

EN 1 EN
Department of Agriculture Fisheries and Food Agriculture House, Kildare Street, Dublin 2, Ireland
The Marine Institute, Fisheries Science Services,
Rinville, Oranmore, Galway, Ireland
An Bord Iascaigh Mhara (Irish Sea Fisheries Board), Crofton Road, Dun Laoghaire, Co Dublin, Ireland
EU Council Regulation 199/2008 Concerning the establishment of a community framework for the collection, management and use of data in the fisheries sector and support for scientific advice regarding the Common Fisheries Policy
National Programme 2009-2010 IRELAND
( Version 1)
15th October 2008
EN 2 EN
I. General framework.................................................................................................................. 4
II. Organisation of the National Programme .............................................................................. 4
II.A National organisation and co-ordination............................................................................ 4
II.B International co-ordination................................................................................................. 7
II.C Regional co-ordination........................................................................................................ 7
III. Module of evaluation of the fishing sector................................................................... 8
III.A General description of the fishing sector ........................................................................... 8
III.B Economic variables ........................................................................................................... 9
III.B.1 Data acquisition.........................................................................................................9 III.B.2 Data quality ..............................................................................................................15 III.B.3 Regional coordination.............................................................................................15 III.B.4 Derogations and non-conformities........................................................................15
III.C Biological - metier-related variables................................................................................ 16
III.C.1 Selection of metiers to sample..............................................................................16 III.C.2 Data acquisition.....................................................................................................21 III.C.4 Regional co-ordination...........................................................................................25 III.C.5 Derogations and non-conformities.......................................................................25
III.D Biological - Recreational fisheries ................................................................................. 26
III.D.1 Data acquisition...................................................................................................26 III.D.2 Data quality..............................................................................................................26 III.D.3 Regional co-ordination...........................................................................................27 III.D.4 Derogations and non-conformities.......................................................................27
III.E Biological - stock-related variables.................................................................................. 28
III.E.1 Selection of stocks to sample.................................................................................28 III.E.2 Data acquisition.......................................................................................................28 III.E.3 Data quality..........................................................................................................30 III.E.4 Regional co-ordination.......................................................................................30 III.E.5 Derogations and non-conformities...................................................................31
III.F Transversal variables .................................................................................................. 32
III.F.1 Capacity....................................................................................................................32 III.F.2 Effort............................................................................................................................34 III.F.3 Landings.....................................................................................................................35
III.G Research surveys at sea.............................................................................................. 37
IV. Module of the evaluation of the economic situation of the aquaculture and processing industry....................................................................................................................... 47
IV.A Collection of data concerning the aquaculture ................................................................ 47
IV.A.1 General description of the aquaculture sector .................................................47 IV.A.2 Data acquisition......................................................................................................48 IV.A.3 Data quality.............................................................................................................51
EN 3 EN
IV.A.4 Regional coordination...........................................................................................52 IV.A.5 Derogations and non-conformities ......................................................................52
IV.B. Collection of data concerning the processing industry................................................... 52
IV.B.1 Data acquisition......................................................................................................52 IV.B.2 Data quality .............................................................................................................55 IV.B.3 Regional coordination............................................................................................55 IV.B.4 Derogations and non-conformities.......................................................................55
V. Module of evaluation of the effects of the fishing sector on the marine ecosystem.. 56
VI. Module for management and use of the data ..................................................................... 57
VI.A Management of the data .................................................................................................. 57
VI.B Use of the data ................................................................................................................. 59
VII. Follow-up of STECF recommendations ........................................................................... 60
VIII. List of derogations ........................................................................................................... 63
IX. List of acronyms and abbreviations ................................................................................... 64
X. Comments, suggestions and reflections ............................................................................... 66
XI. References .......................................................................................................................... 67
XII. Annexes............................................................................................................................. 68
Annex 1 Discard Protocols ....................................................................................................... 68
Annex 2 Bi- lateral Agreements ................................................................................................ 71
Annex 3 Sample numbers required to achieve target precision levels for the length and age composition of commercial catches ........................................................................... 74
Annex 4 Sample numbers required to achieve target precision levels length-, weight-, sexratio - and maturity-at-age .................................................................................................. 78
Annex 5 Irish Deepwater Survey (Pilot Survey) ...................................................................... 80
Annex 6 Herring Recruitment Survey (Pilot survey) ............................................................... 82
XIII. Figures ............................................................................................................................. 84

EN 4 EN
I. General framework The Marine Institute has been delegated responsibility by its parent government department, Department of Agriculture Fisheries and Food (DAFF) to organise and co-ordinate Irelands obligations under the DCR and the MI has therefore compiled this document as the National Programme for Ireland 2009-2010. This programme addresses the following EU Commission Regulation (199/2008/EC) (adopting a multi annual community programme pursuant to Council regulation (EC) No 199/2008 establishing a community framework for the collection, management and use of data in the fisheries sector and support for scientific advice regarding the Common Fisheries Policy), The general framework follows that provided in previous years following the guidelines and uses the standard tables for submissions as provided by STECF in 2008. This NP for 2009-2010 incorporates the new regulation and outlines the new procedures that are necessary including concurrent sampling, collection of data for the Aquaculture section and Ecosystem indicators. A detailed analysis was carried out on the logbook data to select the metiers to sample. The affects on the current programme will be significant as the effort needed to sample concurrently across all of the metiers selected will be very resource hungry as outlined in the WKISCON meeting January 2008. In terms of discard sampling no major changes are envisaged as Ireland was already using a metier based sampling programme. Ireland will continue to participate at the relevant Regional Co-ordination Meetings (RCM) where international co-ordination on sampling will be discussed and agreed amongst member states. II. Organisation of the National Programme
II.A National organisation and co-ordination National Correspondent Dr Frank O Brien, The Marine Institute, Fisheries Science Services, Rinville, Oranmore, Galway, IRELAND Phone 00353 91 387200 Fax 00353 91 387201 E Mail [email protected]

EN 5 EN
Contact Details of all other relevant Government Departments /Institutes.
• Department of Agriculture Fisheries and Food ( DAFF)
DAFF is the main governmental department with responsibility for sea fisheries policy and management. The Dept. of Agriculture Fisheries and Food, Sea Fisheries Unit, Clonakilty, Co. Cork. Phone : 00353 23 59500 Fax. 00353 23 59508 [email protected] www.agriculture.gov.ie
• The Marine Institute (MI)
The MI is a semi state marine research organisation charged by DAFF with the collection of scientific data and the provision of scientific advice for the fisheries sector. The Marine Institute Rinville, Oranmore. Co. Galway Phone: 00353 91387200 Fax : 00353 91387201 www.marine.ie
• An Board Iascaigh Mhara (BIM – The Irish Sea Fisheries Board)
BIM is a semi state sea fisheries development agency charged by DAFF with the collection of economic data for the DCR on the fisheries, aquaculture and processing sector PO Box 12 Crofton Road. Dun Laoghaire Co. Dublin. Phone : +353 1 2144100 Fax : +353 1 2144119 www.bim.ie
EN 6 EN
• Department of Communications Environment and Natural Resources (DCENR)
DCENR is the main governmental department with responsibility for Natural Resources including Inland Fisheries which cover the areas relating to eels, salmon and recreational fishing.
The Dept. of Communications Environment and Natural Resources, Sea Fisheries Policy, 29 – 31 Adelaide Road, Dublin 2. Phone : 00353 1 6782000 Fax : 00353 1 6782449 www.dcenr.gov.ie
• Sea Fisheries Protection Agency (SFPA)
SFPA have the responsibility for control and enforcement and the provision of VMS data (Module VI)
Clonakilty HQ West Cork Technology Park, Clonakilty, Co. Cork. Phone: 353 23 59300 Fax: 353 23 59720 www.sfpa.ie
• Central Fisheries Board (CTB) The Central Fisheries Board have responsibility for Recreational Fisheries (Section III.D.) Central Fisheries Board, Swords Business Campus, Swords, Co. Dublin, IRELAND. Phone: + 353 1 8842 600 Fax: + 353 1 8360 060 www.cfb.ie
National co-ordination meetings for the Data Collection Regulation will be held between the main participating agencies (Marine Institute and Bord Iascaigh Mhara). The main aims will be to ensure that all of the relevant documentation is up to date; all submissions are on time and the programmes correctly implemented. These will occur once a year or more frequently if required.
EN 7 EN
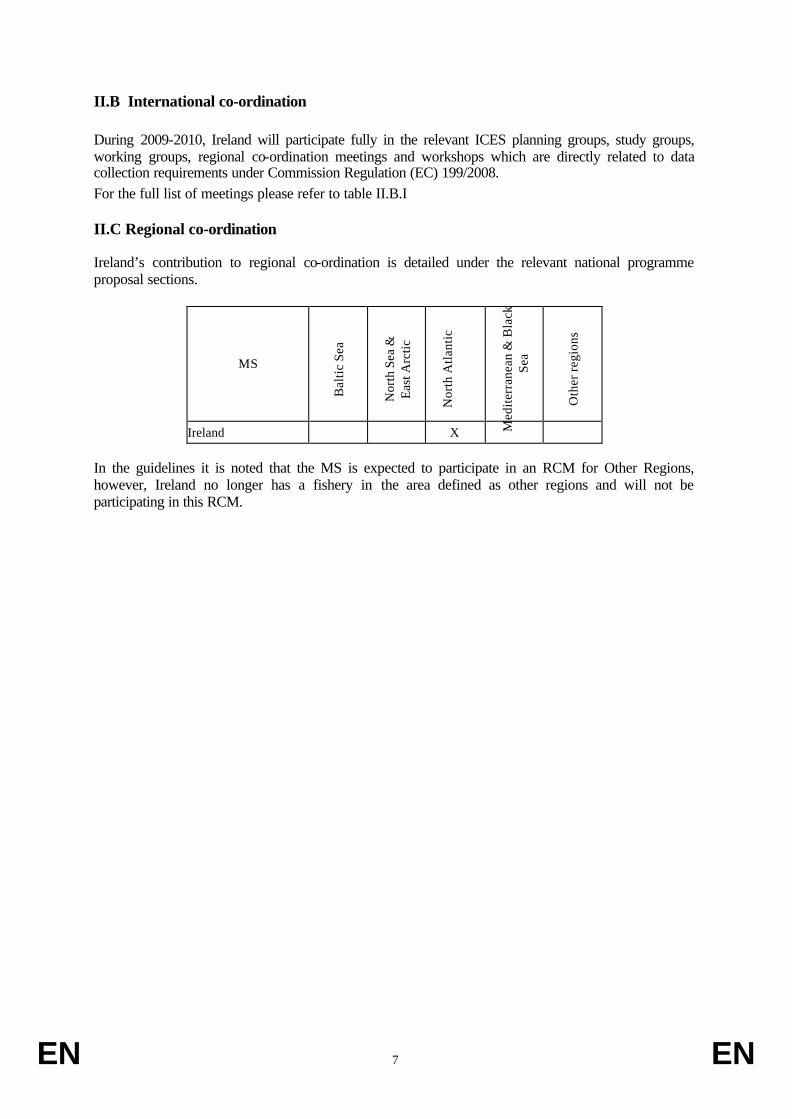
II.B International co-ordination During 2009-2010, Ireland will participate fully in the relevant ICES planning groups, study groups, working groups, regional co-ordination meetings and workshops which are directly related to data collection requirements under Commission Regulation (EC) 199/2008. For the full list of meetings please refer to table II.B.I II.C Regional co-ordination Ireland’s contribution to regional co-ordination is detailed under the relevant national programme proposal sections.
MS
Bal
tic S
ea
Nor
th S
ea &
E
ast A
rctic
Nor
th A
tlant
ic
Med
iterr
anea
n &
Bla
ck
Sea
Oth
er re
gion
s
Ireland X
In the guidelines it is noted that the MS is expected to participate in an RCM for Other Regions, however, Ireland no longer has a fishery in the area defined as other regions and will not be participating in this RCM.
EN 8 EN
III. Module of evaluation of the fishing sector III.A General description of the fishing sector The Irish fishing fleet consists of a little over 1,400 vessels and is divided into 5 segments; polyvalent, pelagic trawl, specific bivalve, aquaculture and beam trawl. Inshore vessels (<10m) are also sampled under the DCR and are included in the polyvalent, specific bivalve and aquaculture segments. There are about 6,000 people working in the fishing fleet associated activities. The majority of Irish fishing, data collection and sampling activity is concentrated the ICES Sub-areas around Ireland VI and VII where Irish vessels are engaged in demersal, pelagic, industrial, deep water and tuna-like fishes (Table III A 1). The pelagic fishery targeting mackerel and horse mackerel also operates in the II, IIIa, IV. Some pelagic landings in those fisheries are landed in the UK–Scotland and Norway where scientists in those countries sample them. There are minor demersal and deepwater fisheries in II and IV where Ireland has a small share of an EC quota for cod and other species in Norwegian waters. The Irish European eel fishery is a relatively small inland and estuarine fishery (total annual declared catch of approximately 120t). A national vessel decommissioning scheme was introduced in 2008 and is anticipated to remove 47 vessels from the register. The decommissioning programme is aimed at vessels older than 10 years and greater than 18m, premium rates have been applied to vessels engaged in the pelagic and whitefish fisheries. At present, it is unclear whether this will have any impact on the design of the national sampling programme, as the final list of vessels eligible for decommissioning has not yet been finalised. However, it is expected that the majority of vessels being removed are currently engaged in the targeted fishery for Nephrops or mixed fish and Nephrops. It is also expected that the scheme will have a significant impact on the number of beam trawlers in the Irish fleet, reducing the number of vessels in this segment by an estimated 70% from a current level of ~15 vessels.

EN 9 EN
III.B Economic variables Baltic Sea (ICES areas III b-d), North Sea (ICES areas IIIa, IV and VIId) and Eastern Arctic (ICES areas I and II), and North Atlantic (ICES areas V-XIV and NAFO areas)
III.B.1 Data acquisition
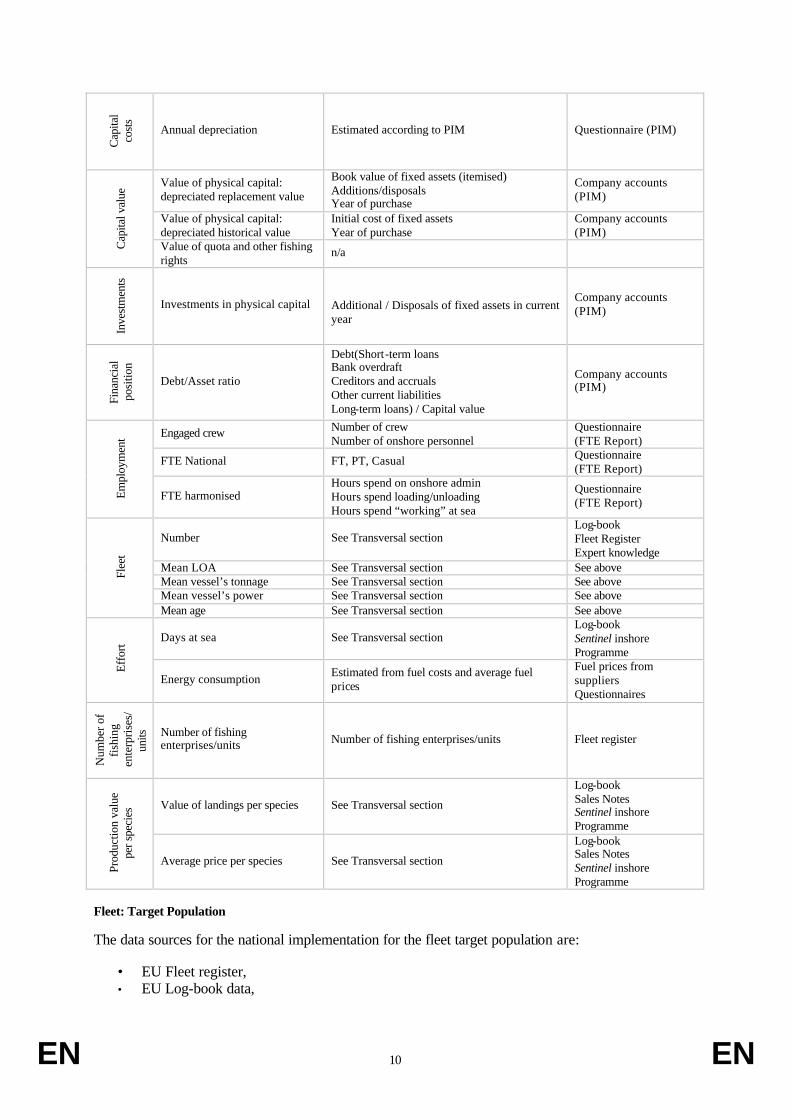
The following economic parameters will be collected to fulfil the requirements of Appendix VI of Commission Decision (2008XXX/EC).
Variable group Variable
Economic Parameters To be collected in 2009 & 2010
Data source
Gross value of landings See Transversal section Log-book Sentinel inshore Programme
Income from leasing out quota or other fishing rights n/a
Direct subsidies n/a
Inco
me
Other income Non fishing income Company accounts Wages and salaries of crew Crew share out Company accounts
Pers
onne
l co
sts
Imputed value of unpaid labour Estimated value of owners own labour / family members Questionnaire
Ener
gy
cost
s
Energy costs Fuel and oil (bulk) Company accounts
Rep
airs
and
m
aint
enan
ce
cost
s
Repair and maintenance costs Repairs and maintenance Company accounts
Variable costs
Filters/gloves/lube oil Provisions Handling fees Commission Transport Ice Dues & levies Other variable costs
Company accounts
Non-variable costs
Insurance Loan Interest Bank interest and charges Accountancy and audit Subs and donations Motor and travel expenses Legal fees Telephone, postage & stationary Other non-variable costs
Company accounts
Oth
er o
pera
tiona
l cos
ts
Lease/rental payments for quota or other fishing rights
n/a
EN 10 EN
Cap
ital
cost
s Annual depreciation Estimated according to PIM Questionnaire (PIM)
Value of physical capital: depreciated replacement value
Book value of fixed assets (itemised) Additions/disposals Year of purchase
Company accounts (PIM)
Value of physical capital: depreciated historical value
Initial cost of fixed assets Year of purchase
Company accounts (PIM)
Cap
ital v
alue
Value of quota and other fishing rights
n/a
Inve
stm
ents
Investments in physical capital Additional / Disposals of fixed assets in current year
Company accounts (PIM)
Fina
ncia
l po
sitio
n
Debt/Asset ratio
Debt(Short-term loans Bank overdraft Creditors and accruals Other current liabilities Long-term loans) / Capital value
Company accounts (PIM)
Engaged crew Number of crew Number of onshore personnel
Questionnaire (FTE Report)
FTE National FT, PT, Casual Questionnaire (FTE Report)
Empl
oym
ent
FTE harmonised Hours spend on onshore admin Hours spend loading/unloading Hours spend “working” at sea
Questionnaire (FTE Report)
Number See Transversal section Log-book Fleet Register Expert knowledge
Mean LOA See Transversal section See above Mean vessel’s tonnage See Transversal section See above Mean vessel’s power See Transversal section See above
Flee
t
Mean age See Transversal section See above
Days at sea See Transversal section Log-book Sentinel inshore Programme
Effo
rt
Energy consumption Estimated from fuel costs and average fuel prices
Fuel prices from suppliers Questionnaires
Num
ber o
f fis
hing
en
terp
rises
/un
its Number of fishing
enterprises/units Number of fishing enterprises/units Fleet register
Value of landings per species See Transversal section
Log-book Sales Notes Sentinel inshore Programme
Prod
uctio
n va
lue
per s
peci
es
Average price per species See Transversal section
Log-book Sales Notes Sentinel inshore Programme
Fleet: Target Population The data sources for the national implementation for the fleet target population are:
• EU Fleet register, • EU Log-book data,
EN 11 EN
The target population is the “commercial fishing fleet” as recorded in the EU Fleet Register on the first day of the reference year. Consequently, the 2009 data collection programme will collect 2008 economic data from fleet segments based on the EU register as it was on the 1st January 2008. Similarly, the 2010 programme will be based on the fleet register on the 1st January 2009. However, to provide a sampling frame in advance of this date for the 2010 programme, the fleet register - as it was on the 18th August 2008, with the additional removal of 48 vessels approved for decommissioning has been used to estimate the sampling requirements. Active Vessels: For vessels > 10 meters, only those with at least one entry in the EU log-book of that vessel, in the reference year, will be deemed active. This analysis will be done once the log-book data are available for a particular reference year, approximately 3 months after the end of the calendar year. For vessels < 10 meters, an estimate of inactivity will be conducted each year using all available sources, including previous survey responses, the national inshore sentinel programme (see Section III.F) for vessels < 10 meters and expert knowledge. Fleet: Segmentation Fleet segmentation by Region (Non-transversal variables) Appendix III segmentation is used for collecting all non-transversal economic parameters. The following data sources have been used to segment the fleet:
• EU Fleet Register from 01/01/2008 and 18/08/2008, • EU log-book activity records for vessels active in 2007 (>10 meters), • Expert knowledge of fishing activities, • Recorded fishing activity from previous economic surveys.
In accordance with Appendix III of Commission Decision (2008XXX/EC), the fleet segments are defined by the vessel’s overall length (LOA) and the main fishing methods engaged in the previous calendar year. The target population and planned sample numbers are provided in tables III.B.1 and III.B.2.
Fleet clustering: A total of 14 fleet segments have been clustered with adjacent size classes, based on the fact that there are fewer than 10 vessels in at least one of the segments. There are a total of 7 clusters, as outlined in table III.B.2. The reason for this clustering is to protect the identities of individual vessels in small samples, and to ensure adequate coverage of all identified fleet segments, where compliance is not mandatory. In accordance with the National Programme guidelines, clustered segments take the same name as the segment contributing the greatest number of vessels. Fishing Activity (Metier) by Region (Transversal variables) Transversal economic variables will be collected at the metier level, as stipulated in Appendix IV and defined in Appendix V of Commission Decision (2008/XXX/EC).Refer to Section III.F for further details. Data sources The data sources for the economic variables of the fleet are:
• Sales notes data, • End of year accountant’s reports, • Voluntary questionnaire information returned by vessel owners targeted in the annual
economic survey, • Voluntary questionnaire information from face-to-face interviews with vessel owners,
EN 12 EN
• Mandatory questionnaire information returned by vessel owners applying for EU/National grant aid,
• Data from vessel owners from a national sentinel vessel programme (to collect both transversal and non-transversal economic data from vessels in the inshore sector where log-book declarations are not mandatory).
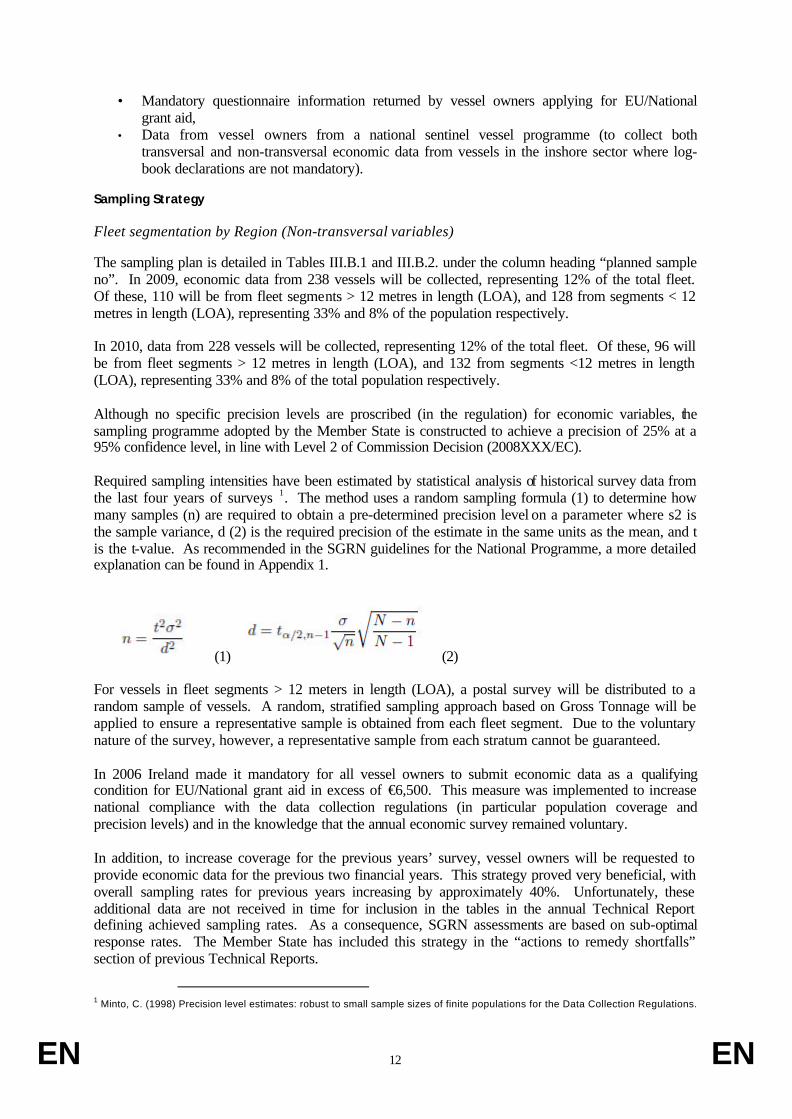
Sampling Strategy Fleet segmentation by Region (Non-transversal variables) The sampling plan is detailed in Tables III.B.1 and III.B.2. under the column heading “planned sample no”. In 2009, economic data from 238 vessels will be collected, representing 12% of the total fleet. Of these, 110 will be from fleet segments > 12 metres in length (LOA), and 128 from segments < 12 metres in length (LOA), representing 33% and 8% of the population respectively. In 2010, data from 228 vessels will be collected, representing 12% of the total fleet. Of these, 96 will be from fleet segments > 12 metres in length (LOA), and 132 from segments <12 metres in length (LOA), representing 33% and 8% of the total population respectively. Although no specific precision levels are proscribed (in the regulation) for economic variables, the sampling programme adopted by the Member State is constructed to achieve a precision of 25% at a 95% confidence level, in line with Level 2 of Commission Decision (2008XXX/EC). Required sampling intensities have been estimated by statistical analysis of historical survey data from the last four years of surveys 1. The method uses a random sampling formula (1) to determine how many samples (n) are required to obtain a pre-determined precision level on a parameter where s2 is the sample variance, d (2) is the required precision of the estimate in the same units as the mean, and t is the t-value. As recommended in the SGRN guidelines for the National Programme, a more detailed explanation can be found in Appendix 1.
(1) (2) For vessels in fleet segments > 12 meters in length (LOA), a postal survey will be distributed to a random sample of vessels. A random, stratified sampling approach based on Gross Tonnage will be applied to ensure a representative sample is obtained from each fleet segment. Due to the voluntary nature of the survey, however, a representative sample from each stratum cannot be guaranteed. In 2006 Ireland made it mandatory for all vessel owners to submit economic data as a qualifying condition for EU/National grant aid in excess of €6,500. This measure was implemented to increase national compliance with the data collection regulations (in particular population coverage and precision levels) and in the knowledge that the annual economic survey remained voluntary. In addition, to increase coverage for the previous years’ survey, vessel owners will be requested to provide economic data for the previous two financial years. This strategy proved very beneficial, with overall sampling rates for previous years increasing by approximately 40%. Unfortunately, these additional data are not received in time for inclusion in the tables in the annual Technical Report defining achieved sampling rates. As a consequence, SGRN assessments are based on sub-optimal response rates. The Member State has included this strategy in the “actions to remedy shortfalls” section of previous Technical Reports.
1 Minto, C. (1998) Precision level estimates: robust to small sample sizes of finite populations for the Data Collection Regulations.
EN 13 EN
Following advice and input from the industry, the timing of the annual survey is now scheduled to coincide with the final date for submission of statutory tax returns for the previous financial year. This is intended to encourage the active participation of fishermen and their accountant’s in providing the relevant data at a single and convenient time of the year. Fishing Activity (Metier) by Region (Transversal variables) Transversal economic variables will be collected at the metier level, as stipulated in Appendix IV and defined in Appendix V of Commission Decision (2008/XXX/EC) using a National Sentinel Vessel Programme described below. The Sampling Strategy for this programme is detailed in Section III.F. National Sentinel Vessel Programme (Vessels < 12 meters length - LOA) In compliance with Chapter II (B) (1) of Commission Regulation (199/2008/EC) - defining the eligibility of establishing pilot surveys to evaluate precision and cost effectiveness of sampling programmes – the Member State will collect transversal economic parameters on a daily basis from vessels < 12 meters in length (LOA) in a national sentinel vessel programme. This is justified on the basis that it is not currently possible to define quantitative targets for a sampling programme for transversal parameters within metiers containing an inshore component; specifically for vessels <10 metres LOA and where official declarations of their landings are not required. In accordance with Article 11(4) of Council Regulation (EC) No 199/2008 – defining the eligibility of self-sampling aboard Community fishing vessels – vessel owners participating in the sentinel programme will record their daily landings, effort and price data in a ‘sentinel record book’, specifically designed to capture these data, for a full calendar year. Additionally, and to enhance the cost-effectiveness of this programme;
• Non-transversal economic parameter will also be collected, again on a daily basis, by vessels < 12 meters (LOA) participating in the sentinel programme.
• Non-operational economic parameters will also be collected at the end of the reference year. These data will be collected using a survey and an exit interview from the sentinel programme.
• Biological (length composition) and discard information will be collected on a daily basis by vessels participating in the sentinel programme to complement the data on biological variables in these metiers.
Those vessels accepted into the sentinel programme will be remunerated to the amount of €1000 per vessel per annum. Remuneration is based on an average of 180 days at sea per year, and an estimated 30 - 40 minutes to record the data in the supplied sentinel record book. When the additional time commitment required from each participating vessel owner for direct contact with survey personnel, to complete the exit interview required at the end of the programme and to provide non-operation data are included, the total commitment comes to some 115 hours per year. Using the national minimum wage in Ireland (currently €8.65 per hour for adults over the age of 18) the total annual cost amounts to 115 hours at €8.65 per hour or €1,000. This remuneration is deemed the minimum necessary to attract eligible fishermen to the programme and to ensure accurate and reliable data are recorded. The national sentinel vessel programme is submitted as an eligible expenditure under Article 7(2) (a) of the Commission Regulation (EC) No…/.., “laying down detailed rules for the implementation of Council Regulation (EC) No 861/2006 as regards the expenditure incurred by Member States for the collection and management of the basic fisheries data”, under the at-sea-monitoring of commercial and recreational fisheries as referred to in Article 11 of Regulation (EC) No 199/2008. Entry to the programme will be awarded in accordance with the applicable rules on public tendering and in conformity with Community Directives on public procurement procedures, as stated in Annex I (f) of the aforementioned regulation.
EN 14 EN
Parameter Estimation: Fleet segmentation by Region (Non-transversal variables) Estimation of capital value and capital costs In accordance with Appendix VI of Commission Decision (2008 XXX/EC), the Perpetual Inventory Method (PIM) will be applied to estimate capital value and costs for each of the fleet segments in Table III.B.1. The following input parameters (required by the STECF model) will be estimated;
• Selected capacity unit, • Price per capacity unit, • Share in total investment , • Government bonds, • Market rate for loans.
Capacity indicators and capital value will be estimated for all vessels on the register, regardless of their activity. The following sources will be used to estimate the input parameters to the PIM model:
• Questions on fixed assets, investments, and depreciation from the annual economic survey, • EU fleet register, • EU log-book data • Sentinel vessel programme, • Central Statistics Office (CSO), • Economic and Social Research Institute (ESRI).
Estimation of Employment In accordance with Appendix VI, a harmonised FTE will be estimated for each of the fleet segments in Table III.B.1. For vessels >10 meters in length (LOA), operational data from log-book submissions will be used in the estimation of fishing time on a trip-by-trip basis. In addition, there are several questions on the annual economic survey forms that deal specifically with hours worked, both at sea and on land-based activities associated with fishing. The recommendations of the FTE study will be followed in their entirety. Fuel efficiency of fish capture The fuel efficiency of fish capture is defined in Appendix XIII of Commission Decision (2008/XXX/EC) as the ratio between value of landings and cost of fuel, and must be estimated by quarter and by metier. The inshore components will be estimated from the following data collected on a daily basis under the sentinel vessel programme;
• Landings per species, • Price per species, • Fuel costs, • Fuel prices.
These data, will be raised to the total active population of vessels <10 metres in length (LOA) and will be included in their respective national metier, by quarter. Fuel costs received from vessels >10 meters length (LOA), targeted in the annual economic survey, will be apportioned equally on an effort basis to their relevant metiers and quarters, and raised to the active population. Effort will be based on a log-book analysis that will apportion each fishing trip to a particular metier (see Section III.F for more details) Data availability: For non-transversal variables collected through the annual economic survey, data for a particular reference year will be fully validated and available approximately 15 months from the end of the reference year: data for a particular reference year is collected at the start of November of the following year (to coincide with the final submission date for tax returns for the previous year). A
EN 15 EN
three month period follows before all data is received from those targeted in the survey, with an additional two months for data procession, and validation before the data is ready for transmission. Economic data from fleet segments < 12 metres, both transversal and non-transversal, will be collected daily and will be available approximately three months from the end of the reference year, allowing for data processing and validation.
III.B.2 Data quality
Sampling methods and measures of data quality, in terms of target precision or percentage coverage, are detailed in table III.B.3 for each of the parameters and the fleet segments. There are no required precision levels specified in the new regulations. The sampling intensity for the current sampling programme is based on an analysis of the variance of historic, operational data, as these have proved to be the most uniform, with the aim of achieving a precision of 25% at a 95% confidence level, in line with Level 2 of Commission Decision (2008/XXX/EC). Variances within fixed costs have proved much higher than expected and, as such, quality will be measured at a coverage rate, commensurate with the target precision for the non-operational parameters. The Member State will seek further statistical advice on this aspect of the National Programme. A general improvement in the quality of data received from vessel owners has been realised with the introduction of the following measures over the last three years;
• Ensuring that a qualified accountant signs off on the financial aspects of the survey, • Timing the survey to the coincide with the end-of-year submission of tax returns to ensure all
figures are already checked for the Revenue Commissioner’s Office, • Requesting full, end-of-year, accountant’s reports.
Data for the 2009/2010 National Programme will be submitted electronically via interactive PDF forms to a centralised database, with pre-validation necessary before the accountants can successfully submit the forms. A secondary validation process will be performed on the data once received, and any erroneous data will be followed up directly with the vessel owners or their accountants by survey personnel. Similarly, any erroneous data supplied by vessel owners, contracted under the sentinel vessel programme, will be queried and rectified by survey personnel, as and when it arises, or at the exit interview stage of the programme. The template supplied on the DCR website for the calculation of capital value and depreciation will be used as recommended in the National Programme guidelines. The harmonised FTE of 2000 hours will also be used to ensure comparability between Member States datasets.
III.B.3 Regional coordination
The Member State will participate at the relevant Regional Coordination Meetings (RCM). However, as all fleets are covered in the National Programme in terms of economic parameters, there are no direct responsive actions required from the Member State from previous RCM recommendations.
III.B.4 Derogations and non-conformities
None

EN 16 EN
III.C Biological - metier-related variables
North Atlantic ( ICES areas V-XIV and NAFO areas) and North Sea ( ICES areas IIIa,IV and VIId and Eastern Arctic ( ICES I and II) III.C.1 Selection of metiers to sample Irish logbook and vessel register data from 2006 and 2007 were used for the allocation of fishing trips to the matrix given in Commission Decision (2008/XXX/EC) Appendix IV (1-5), and their subsequent ranking according to landings, effort and first sale value. Data was taken from the Integrated Fisherie s Information System (IFIS) database, supplied by the Department of Agriculture, Fisheries, and Food (DAFF) Irish metier groupings for the reference period 2006-2007 were aggregated according to level 6 of the Nantes matrix given in Commission Decision (2008/XXX/EC) C Appendix IV (1-5). These Irish metiers were statistically defined using a combination of multivariate methods, primarily Principal Component Analysis, Multiple Correspondence Analysis, and clustering, of landings and vessel characteristics at the fishing trip level for all Irish vessels 10 meters or greater in overall length. A list of these Irish metiers and their related definition are detailed below including the specifications. For fishing trips not qualifying for one of these metiers, per trip species landed weights were allocated to a species category (cephalopods, crustaceans, deepwater, demersal, molluscs, Nephrops, small pelagic, or large pelagic). Landed weight within each category was then converted into a percentage of the total from the trip. Fishing trips were subsequently assigned to a level 5 target assemblage based on the following species composition rules: • Molluscs: >=50% mollusc
And, <50% cephalopod, crustacean, deepwater, demersal, small pelagic, and large pelagic, And, < the relevant area defined percentage of Nephrops resulting in crustacean classification
• Crustaceans: >=50% crustacean or >= an area defined percentage of Nephrops Or, >=25
crustaceans and >=25 Nephrops And, <50% cephalopod, deepwater, demersal, mollusc, small pelagic, and large pelagic
• Demersal fish: >=50% demersal
And, <50% cephalopod, crustacean, deepwater, mollusc, small pelagic, and large pelagic And, < the relevant area defined percentage of Nephrops resulting in crustacean classification
• Mixed crustaceans and demersal fish: >=25% crustacean and >=25% demersal Or, >=25%
Nephrops and >=25% demersal And, <50% crustacean, demersal, mollusc, and large pelagic, And, <25% cephalopod, deepwater, and small pelagic And, < the relevant area defined percentage of Nephrops resulting in crustacean classification
• Mixed cephalopods and demersal fish: >=25% cephalopod and >=25% demersal Or, >=50%
cephalopod and <25% demersal And, <50%, demersal, mollusc, and large pelagic, And, <25% crustacean, deepwater, Nephrops, and small pelagic

EN 17 EN
• Small pelagic fish: >=50% small pelagic
And, <50% cephalopod, crustacean, deepwater, demersal, mollusc, and large pelagic And, < the relevant area defined percentage of Nephrops resulting in crustacean classification
• Deepwater: >=50% deepwater
And, <50% cephalopod, crustacean, demersal, mollusc, small pelagic, and large pelagic And, < the relevant area defined percentage of Nephrops resulting in crustacean classification
• Mixed pelagic and demersal fish: >=25% small pelagic and >=25% demersal
And, <50%, demersal, mollusc, small pelagic, and large pelagic, And, <25% cephalopod, crustacean, deepwater, and Nephrops
• Mixed demersal and deep-water species: >=25% deepwater and >=25% demersal
And, <50%, deepwater, demersal, mollusc, and la rge pelagic, And, <25% cephalopod, crustacean, Nephrops, and small pelagic
• Finfish: >=50% deepwater Or, >=50% demersal Or, >=50% small pelagic Or, >=50% large
pelagic And, <50% crustacean, mollusc, and Nephrops And, <25% cephalopod
• Large pelagic fish: >=50% large pelagic
And, <50% cephalopod, crustacean, deepwater, demersal, mollusc, Nephrops, and, small pelagic
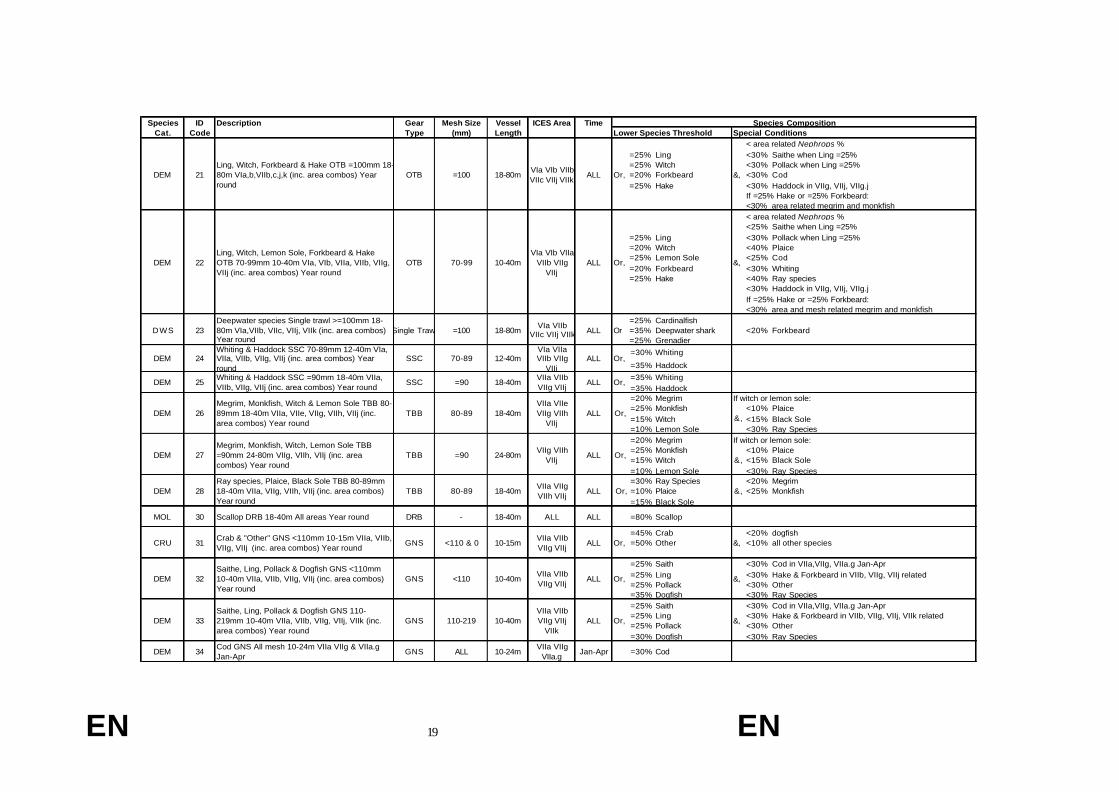
Table III.C.1 contains all metiers where trips have been allocated to level 6 of the matrix (for both the North Atlantic, and the North Sea and Eastern Arctic), detailing whether the landings, effort and value of each occurs within the top 90% of Irish totals. The following tables a show the descriptions of Irish Metiers, derived from multivariate analysis of Irish =10m vessel activity during 2003 The table details the metier code, name and the conditions of each metier in relation to species composition, quarter, gear, vessel length, mesh size ranges and ICES area.

EN 18 EN
<80% Nephrops<30% Monkfish<30% Megrim
<65% Nephrops<30% Monkfish<30% Megrim
<30% Monkfish<30% Megrim<30% Monkfish<30% Megrim
=30% Megrim <80% VIIb related Nephrops=30% Monkfish <65% VIIg related Nephrops
<50% VIIc or VIIk related Nephrops=30% Megrim <20% Forkbeard=30% Monkfish <25% Hake
< area related Nephrops %<30% Monkfish<30% Megrim<30% Whiting< area related Nephrops %
=40% Plaice <30% Megrim=40% Ray species <30% Monkfish
<30% Haddock VIIg, VIIj & VIIg.j<30% Pollack<25% Cod
=40% Plaice <45% Nephrops=40% Ray species <30% Pollack
<30% Cod
Species Cat.
DEM
DEM
DEM
DEM
CRU
CRU
CRU
CRU
CRU
CRU
< mesh related cod (25% 70-99mm, 30% 100-119mm)
9
13
12
3
8
7
14
2
5
4
ALL Or, &,
Or, &,
Plaice & Ray species OTB 100-119mm 15-40m VIIa (inc. area combos) Year round
OTB 100-119 15-40m VIIa
Haddock &,
Plaice & Ray species OTB 70-99mm 10-40m VIa,VIIa, VIIb, VIIg, VIIj (inc. area combos) Year round
OTB 70-99 10-40mVIa VIIa VIIb VIIg
VIIjALL
ALL =30%
Or, &,
Haddock OTB All mesh sizes 10-40m VIIg, VIIj & VIIg.j Year round
OTB ALL 10-40mVIIg VIIj
VIIg.j
Megrim & Monkfish OTB =100mm 15-80m VIIj (inc. area combos) Year round
OTB11 =100 15-80m VIIj ALL
ALL Or,
Nephrops &,
Megrim & Monkfish OTB 70-99mm 10-80m VIa, VIIb, VIIg, VIIj (inc. area combos) Year round
OTB10 70-99 10-80mVIa,VIIb VIIg,VIIj
All =35%
=40% Nephrops
Mixed Nephrops OTB 70-119mm 10-40m VIIj (inc. area combos) Year round
OTB 70-119 10-40m VIIj
12-40m VIa AllMixed Nephrops OTB 70-119mm 12-40m VIa (inc. area combos) Year round
OTB 70-119
NephropsQ2-4 =50%
Nephrops &,
Clean Nephrops OTB 70-119mm 18-40m VIIc & VIIk (inc. VIIc,j,k combos) Quarter 2-4
OTBCRU 70-119 18-40m VIIc VIIk
Mixed Nephrops OTB 70-119mm 10-40m VIIg (no area combos) Year round
OTB6
Nephrops
Nephrops
70-119 10-40m VIIg All =40%
All
All
=65%
15-40m VIIb &,
Clean Nephrops OTB 70-119mm 10-40m VIIg (no area combos) Year round
OTB 70-119 10-40m VIIg
Mixed Nephrops OTB 70-119mm 15-40m VIIb (inc. area combos) Year round
OTB 70-119
=80% Nephrops
=45%
Nephrops
Clean Nephrops OTB 70-119mm 15-40m VIIb (inc. area combos) Year round
OTB 70-119 15-40m VIIb All
=45% Nephrops <80%AllMixed Nephrops OTB 70-89mm 12-40m VIIa (inc. area combos) Year round
OTB 70-89 12-40m VIIa
=80% Nephrops70-89 12-40m VIIa AllClean Nephrops OTB 70-89mm 12-40m VIIa (inc. area combos) Year round
OTB1
Species CompositionLower Species Threshold Special Conditions
Mesh Size (mm)
Vessel Length
ICES Area TimeDescription Gear Type
ID Code
DEM
CRU
CRU
EN 19 EN
< area related Nephrops %=25% Ling <30% Saithe when Ling =25%=25% Witch <30% Pollack when Ling =25%=20% Forkbeard <30% Cod=25% Hake <30% Haddock in VIIg, VIIj, VIIg.j
If =25% Hake or =25% Forkbeard:<30% area related megrim and monkfish< area related Nephrops %<25% Saithe when Ling =25%
=25% Ling <30% Pollack when Ling =25%=20% Witch <40% Plaice=25% Lemon Sole <25% Cod=20% Forkbeard <30% Whiting=25% Hake <40% Ray species
<30% Haddock in VIIg, VIIj, VIIg.j If =25% Hake or =25% Forkbeard:<30% area and mesh related megrim and monkfish
=25% Cardinalfish=35% Deepwater shark=25% Grenadier
=30% Whiting
=35% Haddock
=35% Whiting=35% Haddock=20% Megrim If witch or lemon sole:=25% Monkfish <10% Plaice=15% Witch <15% Black Sole=10% Lemon Sole <30% Ray Species=20% Megrim If witch or lemon sole:=25% Monkfish <10% Plaice=15% Witch <15% Black Sole=10% Lemon Sole <30% Ray Species=30% Ray Species <20% Megrim=10% Plaice <25% Monkfish=15% Black Sole
=45% Crab <20% dogfish=50% Other <10% all other species
=25% Saith <30% Cod in VIIa,VIIg, VIIa.g Jan-Apr=25% Ling <30% Hake & Forkbeard in VIIb, VIIg, VIIj related=25% Pollack <30% Other=35% Dogfish <30% Ray Species=25% Saith <30% Cod in VIIa,VIIg, VIIa.g Jan-Apr=25% Ling <30% Hake & Forkbeard in VIIb, VIIg, VIIj, VIIk related=25% Pollack <30% Other=30% Dogfish <30% Ray Species
DEM
DEM
DWS
MOL
CRU
DEM ALLLing, Witch, Forkbeard & Hake OTB =100mm 18-80m VIa,b,VIIb,c,j,k (inc. area combos) Year round
OTB21
70-99 10-40mVIa VIb VIIa
VIIb VIIg VIIj
=100 18-80mVIa VIb VIIb VIIc VIIj VIIk
Single Trawl23
ALL Or,
=100 18-80mVIa VIIb
VIIc VIIj VIIk ALL
Ling, Witch, Lemon Sole, Forkbeard & Hake OTB 70-99mm 10-40m VIa, VIb, VIIa, VIIb, VIIg, VIIj (inc. area combos) Year round
OTB
Or
&,
&,
=80% Scallop
Or,
Deepwater species Single trawl >=100mm 18-80m VIa,VIIb, VIIc, VIIj, VIIk (inc. area combos) Year round
33
27
26
34
28
24
- 18-40m ALL ALL
GNS31
Scallop DRB 18-40m All areas Year round DRB30
<110 & 0 10-15mVIIa VIIb VIIg VIIj
ALL
<110Saithe, Ling, Pollack & Dogfish GNS <110mm 10-40m VIIa, VIIb, VIIg, VIIj (inc. area combos) Year round
GNS32
GNS ALL 10-24mVIIa VIIg
VIIa.g
10-40mVIIa VIIb VIIg VIIj
VIIk
Or,
18-40mVIIa VIIb VIIg VIIj
ALL Or,
&,
&,
Cod
SSC25
ALLWhiting & Haddock SSC 70-89mm 12-40m VIa, VIIa, VIIb, VIIg, VIIj (inc. area combos) Year round
SSC 70-89 12-40mVIa VIIa VIIb VIIg
VIIj
=90
ALL
ALL
ALL
Jan-Apr
Or,
=30%
TBB 80-89 18-40m Or,VIIa VIIe VIIg VIIh
VIIj
24-80mVIIg VIIh
VIIj=90
10-40mVIIa VIIb VIIg VIIj
Or,
Ray species, Plaice, Black Sole TBB 80-89mm 18-40m VIIa, VIIg, VIIh, VIIj (inc. area combos) Year round
TBB 80-89 18-40mVIIa VIIg VIIh VIIj
Or,
ALL
Saithe, Ling, Pollack & Dogfish GNS 110-219mm 10-40m VIIa, VIIb, VIIg, VIIj, VIIk (inc. area combos) Year round
GNS ALL Or,110-219
&,
Forkbeard<20%
&,
Or, &,
22
&,
Megrim, Monkfish, Witch, Lemon Sole TBB =90mm 24-80m VIIg, VIIh, VIIj (inc. area combos) Year round
TBB
Megrim, Monkfish, Witch & Lemon Sole TBB 80-89mm 18-40m VIIa, VIIe, VIIg, VIIh, VIIj (inc. area combos) Year round
Whiting & Haddock SSC =90mm 18-40m VIIa, VIIb, VIIg, VIIj (inc. area combos) Year round
Cod GNS All mesh 10-24m VIIa VIIg & VIIa.g Jan-Apr
Crab & "Other" GNS <110mm 10-15m VIIa, VIIb, VIIg, VIIj (inc. area combos) Year round
DEM
DEM
DEM
DEM
Species Cat.
DEM
DEM
DEM
Species CompositionID Code
Description Gear Type
Mesh Size (mm)
Vessel Length
ICES Area TimeLower Species Threshold Special Conditions

EN 20 EN
<45% Crab<25% Saith
=30% Other <25% Ling=30% Ray Species <25% Pollack
<30% Cod in VIIa,VIIg, VIIa.g Jan-Apr<30% Hake & Forkbeard in VIIb, VIIg, VIIj related
=30% Hake
=30% Forkbeard
=60% Crab <20% dogfish=50% Other <10% all other species
Special ConditionsID
CodeDescription Gear
TypeMesh Size
(mm)Vessel Length
ICES Area Time Species CompositionSpecies Cat.
SPF
40Cod longlining 24-40m I & IIb (inc. area combos) Nov-Apr
LONGLINE - 24-40m I IIb Nov-Apr =60% Cod
=80% Herring47Herring Pair Trawl 32-54mm 15-80m Non-VIa areas (inc. area combos) Jul-Feb
Pair Trawl Non VIa Jul-Feb
38
37
32-54 15-80m
24-80mMid-Water
Mid-Water <70 18-80m
ALLHake & Forkbeard GNS All mesh 10-40m VIIb, VIIc, VIIg, VIIj, VIIk (inc. area combos) Year round
GNS ALL
ALL 10-40mVIIa VIIb VIIg VIIj
=90%
Or,
Lower Species Threshold
&,Or,
Or, &,
=95% Sprat
=80%
=90%
Apr-Aug
=80%
Feb-Mar
Ray species & "Other" GNS All mesh 10-40m VIIa, VIIb, VIIg, VIIj (inc. area combos) Apr-Aug
GNS
VIa, VIIa, VIa.VIIa
ALLWhelk FPO 10-24m VIa, VIIa, VIa.VIIa Year round
FPO
10-40mVIIb VIIc VIIg VIIj
VIIk
10-40m ALL ALL
- 10-24m
Crab & "Other" FPO 10-40m All areas Year round
FPOCRU -
51
50
46
45
35
36
Sprat Otter Trawl 16-54mm 10-40m VIa, VIIa & VIa.VIIa Oct-Feb
Tuna Trawl All mesh sizes 15-40m VIIj VIIk, VIIIa, VIIIb, VIIIc, VIIId (inc. area combos) Jul-Oct
Blue Whiting Mid-water trawl 32-54mm 24-80m VIb, VIIc, VIIk, XII (inc. area combos) Feb-Mar
44
Mackerel Mid-water trawl <70mm 15-80m VIa (inc N. & S.), VIIb, VIIj (inc. area combos) Oct-May
42
Tuna
VIa VIIa VIa.VIIa
Oct-Feb
15-40mVIIj VIIk
VIIIa VIIIb VIIIc VIIId
Jul-Oct
10-40mOtter Trawl
<55 15-80m
ALL
HerringOct-Mar =80%
Oct-Jan
Horse Mackerel Mid-water trawl 32-69mm 24-80m VIa, VIIb & VIa.VIIb Sep-Mar
Mid-Water 32-69 24-80mVIa VIIb VIa.VIIb
Sep-Mar
Trawl
Herring PTM <55mm 15-80m VIa (inc. N. & S.) Oct-Mar
PTM
VIb VIIc VIIk XII
43 <55 24-80m IVaMackerel Mid-water trawl <55mm 24-80m IVa Oct-Jan
Mid-Water
VIa
32-54
16-54
Mackerel
Blue Whiting
=75%
Horse Mackerel
VIa VIIb VIIj Oct-May =70% Mackerel
Whelk
SPF
SPF
MOL
DEM
DEM
SPF
SPF
SPF
LPF
SPF
DEM
EN 21 EN
III.C.2 Data acquisition
Within the North Atlantic, two metiers have been merged for sampling purposes (Table III.C.2), mid-water otter trawls and mid-water pair trawls for small pelagic fish. The majority of Irish effort directed towards small pelagic fish within the North Atlantic is carried out by mid-water pair trawls, although both gear types occur within the top 90% of landings/effort/value. Two groups of metiers have been merged for sampling purposes within North Sea and Eastern Arctic. Small pelagic fish directed mid-water other trawls and mid-water pair trawls in area IV, and small pelagic fish directed mid-water other trawls and mid-water pair trawls in areas I and II (Table III.C.2). As within the North Atlantic, mid-water pair trawls account for the majority of effort directed toward small pelagic fish. Within these North Sea and Eastern Arctic merged metiers, only mid-water pair trawls are ranked within the top 90%. Investigation into the length frequencies of each of the four main species targeted by Ireland, namely herring, mackerel, horse mackerel and blue whiting, show great similarity between the two gear types, supporting the merging of these metiers for sampling. Distribution of sampling effort between metiers: The total planned number of sampling trips per metier is described in table III.C.3. Sampling effort is divided between at sea sampling and market sampling. Approximately 55% of the annual sampling effort will be directed towards at sea sampling to concurrent sampling Scheme 1 for the OTB, TBB and SCC metiers. For the PTM there is a greater effort allocated to sampling landings in the market. Sampling for length requires a greater precision from landings than discards. Therefore, there should be a greater effort directed towards landings sampling. The total numbers of at the market sampling events is less than the total number of at sea sampling events for Ireland for the demersal fleet. However Ireland collects length information from the landings whilst concurrently sampling discards at sea . Therefore the total effort directed at landings sampling by Ireland is the sum of at sea sampling and at the market sampling events. Concurrent -at- sea: All of Irelands fishing trips are less that two weeks in duration and will be sampled on a monthly basis, some adjustments have been made due to the seasonality of some fisheries, namely the OTB_CRU in VIIc, VIIfgh and VIIa, where there is greater effort in the summer months and the sampling effort has been reassigned to reflect this. OTB_DEF_in VIb operates for six months of the year and planned sampling levels reflect this seasonality. Sampling effort in metier 31, 37, 38 (Table III.C.1) and in the <10m vessels will be allocated mainly to the period March to October to reflect the seasonal pattern of activity. Sampling of the <10m sector will be through sub-contract. The MI employs third level students to undertake various project work during the summer months. Five students will be sub-contracted to sample the <10m fleet in Ireland. This fleet fishes mainly with pots and dredges and target crustaceans and bivalves. Historically Ireland’s discard sampling programme has been metier based and complies with the metier based sampling rules within the new DCR. To satisfy the concurrent sampling requirements within the DCR changes in at sea sampling protocols will be made. The MS will continue to collect biological data on discards and will include additional length measurements of the retained landings to sampling scheme 1. Descriptions of all Discard protocols are found in Annex 1

EN 22 EN
Self sampling of Nephrops catch (landings and discards) has been occurring for Nephrops metiers in the Western Irish Sea, Aran and Celtic Sea stocks since the beginning of the data time series. This will be maintained. In addition, the use of vessels for self sampling of landings, will be extended to two other metiers, VIa and VIb OTB_DEF. In early 2009 a sampling scheme will be implemented where vessels will be contracted to measure landings concurrently at sea on selected fishing trips. The number of trips to be sampled are described in Table III.C.3. Data will be collected to comply with concurrent scheme 1. A workshop will be held with the selected vessels in order to train the various personnel in the protocols for collection of samples. A co-ordinator will be assigned to quality control the resulting data. A self sampling programme will also be undertaken for metier 37 (Table III.C.1) for 15 vessels operating in Area VIa targeting brown crab (Cancer pagurus). A combination of questionnaire, voluntary logbook data and on board sampling of catch will be used to obtain information on catch and discards composition, fishing location, fishing effort and gear soak times. Targets for sampling are 200 crabs per vessel per quarter in the case of landings and 100 crabs per vessel per month in the case of discards. Concurrent at the Market: The residual number of sampling trips will be carried out ashore using MI staff and contracted assistance. Concurrent sampling in the markets will be carried out to comply with concurrent sampling scheme 2. Other [Market stock specific sampling] Additional non concurrent (stock specific) sampling will carried out by Port Contract Samplers. Since the 1980’s the Marine Institute has employed ‘Port Contract Samplers’ (PCS). PCS are located at the ports of Kilmore Quay, Dunmore East, and Greencastle and thus provide extensive coverage over the whole country. The task of the PCS is to measure demersal fish, elasmobranchs and provide local information on the fishing fleets and general fishing patterns in their particular area. Going forward the PCS will continue to provide some measurements for stock based assessments but will also be used to help Marine Institute staff to fulfil the requirements for Concurrent Sampling. The main emphasis of their non-concurrent sampling will be to provide additional measurements on recovery species. Sampling levels by stock There is no obvious link between the metier-related approach and table III.C.4 and it is not clear for which species in the landings the precision targets apply. Therefore it was assumed that table III.C.4. applies to the same stocks as those given in table III.E.3. Headings in table III.c.4: Fishing ground - The stock area is given in this column instead of the fishing ground to avoid over-complicating the table. No. of fish required to achieve the precision target - This cannot be estimated as the precision depends mostly on the number of samples, not the total number of fish measured (see Appendix 2). Therefore this column has been left blank. From individual samples, a minimum of 3-5 times the number of length classes in the sample will be measured (if available) (see B1.3.1.b of Council Decision (2008/XXX/EC) Planned number of fish to be measured at the national level – This is based on previous sampling levels.
EN 23 EN
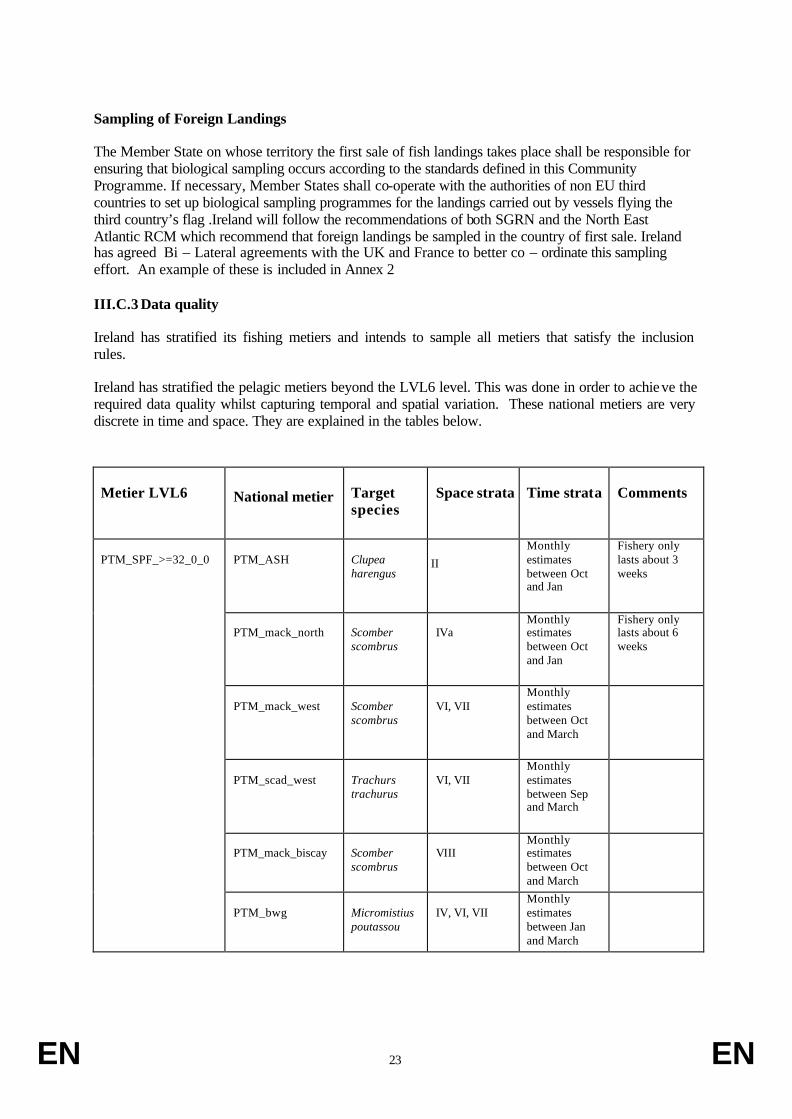
Sampling of Foreign Landings The Member State on whose territory the first sale of fish landings takes place shall be responsible for ensuring that biological sampling occurs according to the standards defined in this Community Programme. If necessary, Member States shall co-operate with the authorities of non EU third countries to set up biological sampling programmes for the landings carried out by vessels flying the third country’s flag .Ireland will follow the recommendations of both SGRN and the North East Atlantic RCM which recommend that foreign landings be sampled in the country of first sale. Ireland has agreed Bi – Lateral agreements with the UK and France to better co – ordinate this sampling effort. An example of these is included in Annex 2 III.C.3 Data quality Ireland has stratified its fishing metiers and intends to sample all metiers that satisfy the inclusion rules. Ireland has stratified the pelagic metiers beyond the LVL6 level. This was done in order to achieve the required data quality whilst capturing temporal and spatial variation. These national metiers are very discrete in time and space. They are explained in the tables below. Metier LVL6
National metier
Target species
Space strata
Time strata
Comments
PTM_ASH
Clupea harengus
I II
Monthly estimates between Oct and Jan
Fishery only lasts about 3 weeks
PTM_mack_north
Scomber scombrus
IVa
Monthly estimates between Oct and Jan
Fishery only lasts about 6 weeks
PTM_mack_west
Scomber scombrus
VI, VII
Monthly estimates between Oct and March
PTM_scad_west
Trachurs trachurus
VI, VII
Monthly estimates between Sep and March
PTM_mack_biscay
Scomber scombrus
VIII
Monthly estimates between Oct and March
PTM_SPF_>=32_0_0
PTM_bwg
Micromistius poutassou
IV, VI, VII
Monthly estimates between Jan and March

EN 24 EN
PTM_Her_north
Clupea harengus
VIa
Monthly estimates between Oct and March
PTM_Her_I sea
Clupea harengus
VIIaN
Monthly estimates between Aug and Oct
PTM_Her_cs
Clupea harengus
VIIaS, VIIg,j
Monthly estimates between Aug and March
PTM_spr Sprattus sprattus
VI, VII Yearly estimates between Oct and March
Fishery is spasmodic
The FPO_CRU metier discretely targets a number of species with different gears in Area VI and VII. These fisheries are largely single species discrete fisheries using fishery specific types of pots (FPO). This metier is therefore disaggregated to its component fisheries to increase precision of the biological data. The DRB_MOL metier is also disaggregated by gear type (Level 4 DRB and HMD) into component fisheries which target single species. Each gear type targets two species; DRB_Scallop, DRB_Surf clam, HMD_Cockle and HMD_Razor clam. Table . Disaggregation of potting metier beyond LVL6. FPO type is disaggregated to 4 sub-types. Metier LVL6
National metier
Target species
Space strata
Time strata
Comments
FPO_Cru Cru_FPO1_Shrimp Pink shrimp (Palaemon)
VIa, VIIb,j,g,f
Monthly Seasonal Aug-Mar
FPO_Cru Cru_FPO2_Crab Brown crab (Cancer)
VIa Monthly
FPO_Cru Cru_FPO2_Crab_Lobster Brown crab (Cancer) and lobster (Homarus)
VIa, VIIa,b,j,g,f
Monthly
FPO_Cru Cru_FPO2_ Lobster Lobster (Homarus)
VIa, VIIa,b,j,g,f
Monthly
FPO_Cru Cru_FPO3_ Spider Spider crab (Maja)
VIIj Monthly Seasonal fishery
FPO_Cru Cru_ FPO4_Velvet Velvet crab (Necora)
VIIa,b,j Monthly
EN 25 EN
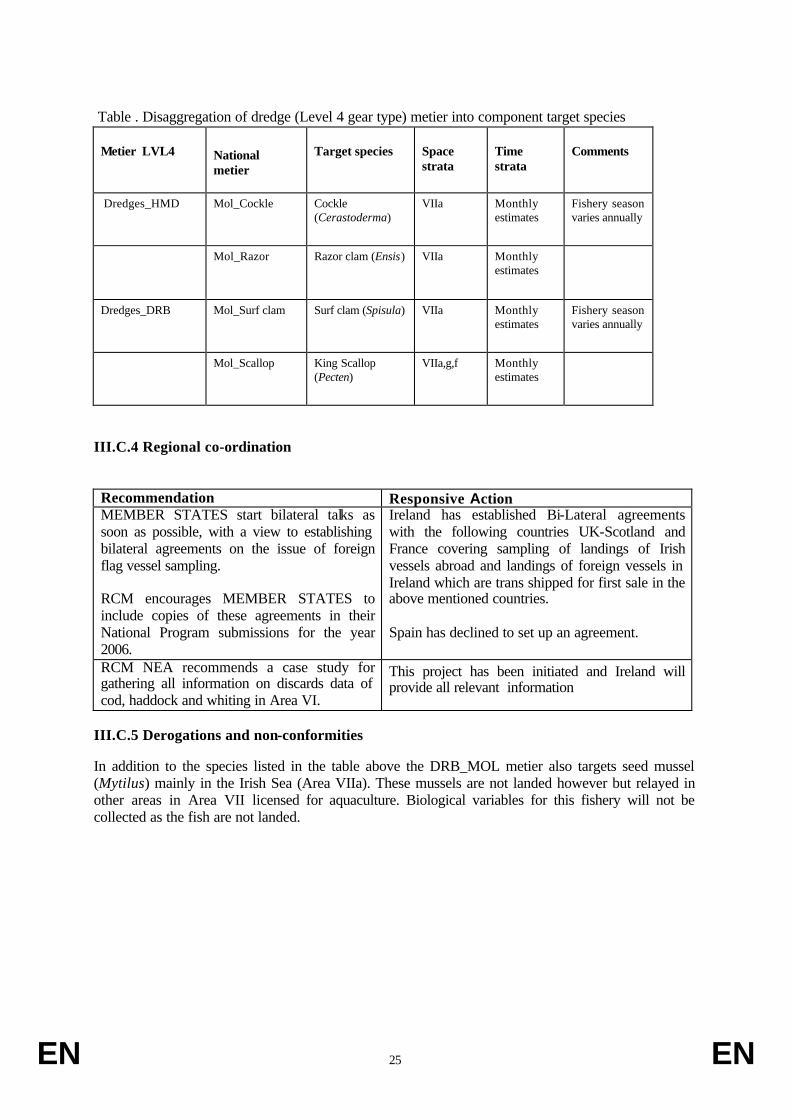
Table . Disaggregation of dredge (Level 4 gear type) metier into component target species
Metier LVL4
National metier
Target species
Space strata
Time strata
Comments
Dredges_HMD Mol_Cockle Cockle (Cerastoderma)
VIIa Monthly estimates
Fishery season varies annually
Mol_Razor Razor clam (Ensis) VIIa Monthly estimates
Dredges_DRB Mol_Surf clam Surf clam (Spisula) VIIa Monthly estimates
Fishery season varies annually
Mol_Scallop King Scallop (Pecten)
VIIa,g,f Monthly estimates
III.C.4 Regional co-ordination
Recommendation Responsive Action MEMBER STATES start bilateral talks as soon as possible, with a view to establishing bilateral agreements on the issue of foreign flag vessel sampling. RCM encourages MEMBER STATES to include copies of these agreements in their National Program submissions for the year 2006.
Ireland has established Bi-Lateral agreements with the following countries UK-Scotland and France covering sampling of landings of Irish vessels abroad and landings of foreign vessels in Ireland which are trans shipped for first sale in the above mentioned countries. Spain has declined to set up an agreement.
RCM NEA recommends a case study for gathering all information on discards data of cod, haddock and whiting in Area VI.
This project has been initiated and Ireland will provide all relevant information
III.C.5 Derogations and non-conformities
In addition to the species listed in the table above the DRB_MOL metier also targets seed mussel (Mytilus) mainly in the Irish Sea (Area VIIa). These mussels are not landed however but relayed in other areas in Area VII licensed for aquaculture. Biological variables for this fishery will not be collected as the fish are not landed.
EN 26 EN
III.D Biological - Recreational fisheries North Atlantic ( ICES areas V-XIV and NAFO areas) Recreational fisheries in Ireland occur in freshwater and at sea. Salmon and Eel are targeted in freshwater and in estuarine waters. In the marine environment shore based and sea-based angling targets a wide range of species including cod.
III.D.1 Data acquisition
Cod Since 2006 the Marine Institute (MI) has developed a voluntary data acquisition programme, in collaboration with the Central Fisheries Board (CFB), with the sea angling charter vessels and with angling clubs to collect landings, effort and size and age distribution of cod captured in the recreational fishery. This will continue. Eel Recreational eel fishing is only carried out by a minority of rod anglers and there is no legal, or voluntary, declaration of catch which is small. Length and age composition of the recreational catch of eels will not be sampled. Salmon There are approximately 150 salmon rivers in Ireland. All recreational fisheries take place in freshwater. The recreational catch and quota in 2007 was 19,388 salmon and 44,637 salmon respectively. There are 53 rivers which will have an identifiable surplus over the Conservation Limit and a harvest fishery proceeded in 2008. In addition, there are 13 rivers with 2 Sea Winter or “spring salmon” stocks where there will be a surplus over the 2SW Conservation Limit and therefore a harvest of spring fish is possible. In addition there are approximately 70 small rivers where the annual average rod catch has been less than 10 salmon since 2001. The combined rod catch from these rivers is less than 0.5% of the current estimated national rod catch. Each fisherman must record all details of their catch in their logbook immediately after tagging the fish to include a description of the fish i.e. one or two sea winter, river and effort even if the fish is released. A sample of fish are measured.
III.D.2 Data quality
Cod Volume of Landings and effort Recreational fishermen fish for cod either from the shore or from sea angling vessels. The data will be derived from sea angling vessels. It is not currently possible to quantify recreational angling activity in Ireland that is not conducted from a sea angling vessel. Some data are collected but raising metrics for the shore angling sector are unknown. In the recreational vessel sector the total catch per vessel per day and per angler per day (rod day) will be detailed in a logbook distributed to approximately 100 vessels by the Central Fisheries Board. This is an ongoing programme that extends back to the 1980s. Data quality has improved in latter years. Data will be reported on a spatial scale consistent with the cod management units in VIIa, VIa, VIIe-k and VIIb-c. The data is digitised at finer spatial resolution and can be reported by statistical rectangle if required. Data are collected whenever vessels are active. The activity is weighted towards summer months. The total number of sea angling vessels is known from the register of passenger licences held by the Marine Section of the Dept. of Transport. A list of registered vessels is also held and published by the Central Fisheries Board. Sample data can be raised
EN 27 EN
to fleet level based on the proportion of the total fleet sampled. Sampling effort is high and covers over 75% of the fleet. Length and age composition Length composition data of cod landed by sea angling vessels are collected on vessels using a self sampling programme in combination with observers. So called ‘cod cards’ are distributed to the same vessels completing logbooks. This was initiated in 2006 as part of a pilot study. Length composition data will be reported on a spatial scale consistent with the cod management units. Data are collected whenever vessels are active. Salmon As the recreational fishery is licensed the volume of landings as recorded in logbooks provides an estimate of the total recreational catch. Length composition of the catch originates from voluntary data provided by recreational fishermen in the logbook and from private fishery owners who monitor the number and size of fish captured in their rivers. There are no specific sampling or precision targets associated with this process.
III.D.3 Regional co-ordination
The Wild Salmon and Sea Trout Tagging Scheme is administered by the Central and the seven Regional Fisheries Boards (Eastern, Southern, South Western, Shannon, Western, North Western and Northern Regional Fisheries Boards). Cross boarder collaboration with the Loughs Agency (an inter-government agency between Ireland and the UK) occurs in the case of the river Foyle, while inter-governmental collaboration also exists between the UK and Ireland in the case of the River Erne.
III.D.4 Derogations and non-conformities
None
EN 28 EN
III.E Biological - stock-related variables North Atlantic ( ICES areas V-XIV and NAFO areas) and North Sea ( ICES areas IIIa,IV and VIId and Eastern Arctic ( ICES I and II)
III.E.1 Selection of stocks to sample
Interpretation of stock definitions Appendix VII of Commission Decision (2008/XXX/EC) lists the stocks for which biological samples are to be collected. Most entries in the table contain more than one ICES Division which might be separated by a comma, a forward slash or a separate row. Neither the Commission Regulation nor the SGRN guidelines offer guidance on the definition of stocks in the table, but it is interpreted as follows: Divisions that are separated by commas are interpreted as being part of the one stock. Divisions that are separated by a forward slash or a separate row of the table are interpreted as belonging to separate stocks. In Tables III.E.1, III.E.2 and III.E.3 each stock is presented in a separate row to avoid confusion. Combined species The landings of some species in Appendix VII are reported as groups of species (e.g. anglerfishes, megrims, rays & skates). Where it was not possible to apportion these landings to individual species, the combined landings are reported. Selection of stocks to sample Sampling will take place for all stocks highlighted in yellow in Table III.E.1. Most parameters will be sampled on an annual basis as can be seen from Table III.E.2. Sampling targets are given in Table III.E.3.
III.E.2 Data acquisition
For the purpose of stock assessment, parameter estimates of length and weight-at-age should be representative the commercial catches. On the other hand, parameters like sex ratio and maturity should be representative of the stock. For these reasons, length and weight-at-age data are mainly collected from commercial sources while sex ratio and maturity data are mainly collected on surveys. Data on sex ratio and maturity should only be collected from commercial data if it can be shown that the commercial samples are unbiased (WKMOG 2008) and can therefore only be used if:
- The population dynamics of the stock are well known - There are no strong spatial trends in the stock - The commercial catches fully select the ages for which sex ratio or maturity are estimated
Most pelagic stocks meet at least some of these criteria, therefore sex ratio and maturity data are collected from commercial samples for herring, blue whiting, mackerel and horse mackerel. Additional sampling (particularly of small individuals) takes place on surveys. The externally visible maturity state of crab and lobster will be routinely recorded; however this is of limited use for maturity assessment. Therefore a detailed maturity sampling programme will take place every three years examining the internal sex organs from purchased samples. For species that can be accurately aged, all parameters will be referenced to age, for other species parameters will be referenced to length. The table on the next page summarises the data acquisition for the species that will be sampled.
EN 29 EN
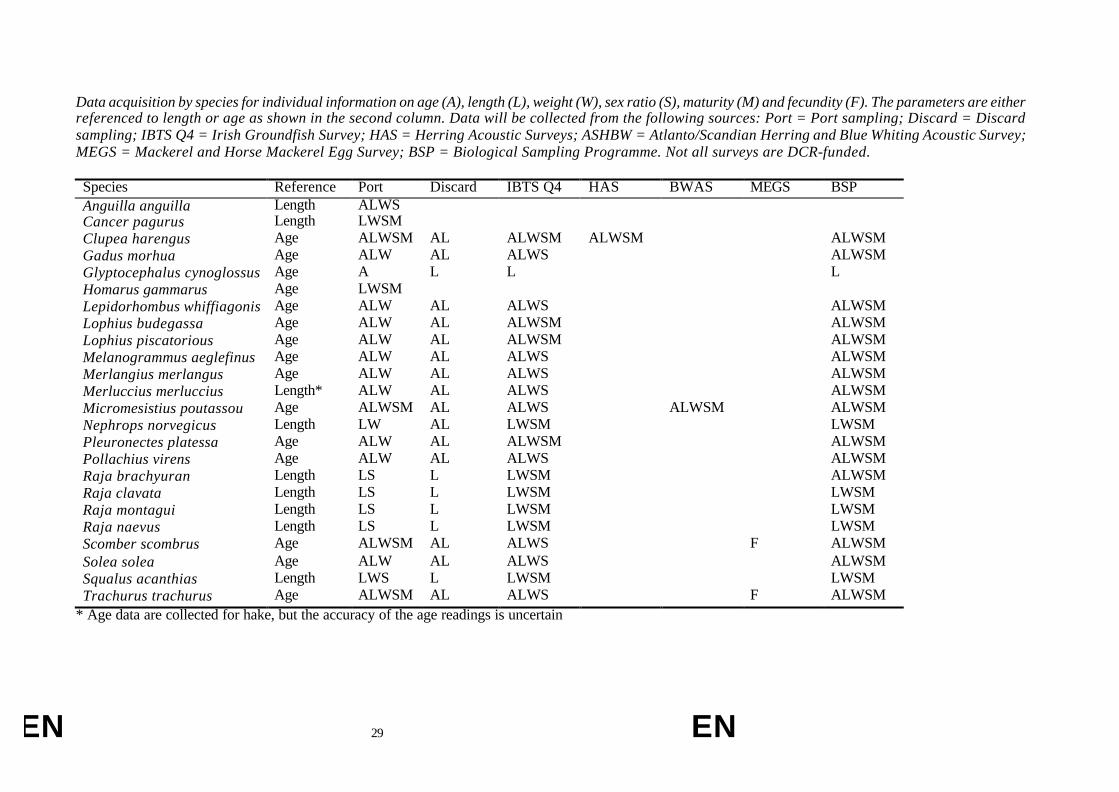
Data acquisition by species for individual information on age (A), length (L), weight (W), sex ratio (S), maturity (M) and fecundity (F). The parameters are either referenced to length or age as shown in the second column. Data will be collected from the following sources: Port = Port sampling; Discard = Discard sampling; IBTS Q4 = Irish Groundfish Survey; HAS = Herring Acoustic Surveys; ASHBW = Atlanto/Scandian Herring and Blue Whiting Acoustic Survey; MEGS = Mackerel and Horse Mackerel Egg Survey; BSP = Biological Sampling Programme. Not all surveys are DCR-funded. Species Reference Port Discard IBTS Q4 HAS BWAS MEGS BSP Anguilla anguilla Length ALWS Cancer pagurus Length LWSM Clupea harengus Age ALWSM AL ALWSM ALWSM ALWSM Gadus morhua Age ALW AL ALWS ALWSM Glyptocephalus cynoglossus Age A L L L Homarus gammarus Age LWSM Lepidorhombus whiffiagonis Age ALW AL ALWS ALWSM Lophius budegassa Age ALW AL ALWSM ALWSM Lophius piscatorious Age ALW AL ALWSM ALWSM Melanogrammus aeglefinus Age ALW AL ALWS ALWSM Merlangius merlangus Age ALW AL ALWS ALWSM Merluccius merluccius Length* ALW AL ALWS ALWSM Micromesistius poutassou Age ALWSM AL ALWS ALWSM ALWSM Nephrops norvegicus Length LW AL LWSM LWSM Pleuronectes platessa Age ALW AL ALWSM ALWSM Pollachius virens Age ALW AL ALWS ALWSM Raja brachyuran Length LS L LWSM ALWSM Raja clavata Length LS L LWSM LWSM Raja montagui Length LS L LWSM LWSM Raja naevus Length LS L LWSM LWSM Scomber scombrus Age ALWSM AL ALWS F ALWSM Solea solea Age ALW AL ALWS ALWSM Squalus acanthias Length LWS L LWSM LWSM Trachurus trachurus Age ALWSM AL ALWS F ALWSM
* Age data are collected for hake, but the accuracy of the age readings is uncertain
EN 30 EN
III.E.3 Data quality
Data coverage Data coverage is in accordance with the specifications set out in Appendix VII of the regulation. Sample numbers required to achieve desired precision levels Annex 3 and 4 describe the precision levels of historic samples. For age sampling it is not possible to achieve precision level 3 as specified without sampling excessively large numbers of fish, which would not be cost-effective. Annex 3 concludes that an annual sample size of 1000-2000 individuals per stock appears to be a reasonable target for estimating the age composition of the commercial catch. Annex 4 concludes that reasonable targets for estimating sex ratio and maturity would be in the order of 100 individuals per age class, so these targets vary from less than 400 for short-lived species to nearly 3000 for species with a large number of age classes in the population. The national sampling targets that are specified in table III.E.3 are a compromise between the target precision levels, the relevance of the data for stock assessment, the cost and availability of samples. It is expected that precision level 2 (but not level 3) can be achieved for the majority of the stocks that are of significant commercial importance. Sampling targets at the regional level will be provided by the relevant RCM in the future and are currently unavailable. Anguilla anguilla 200 eels will be measured for each sample. For brown eel, a single sample is taken from those management units with estimated yields of less than 10 tonnes and three samples are taken from management units with estimated yields in excess of 20 tonnes. In total this requires measurement of 2,400 eels (approximately 240kg). Silver eels will be sampled in an almost identical way apart from those management units that do not contain a silver eel fishery. Weight and Age: 175 individuals will be weighed and aged within each management unit every three years. For yellow eels, owing to the importance and the diverse nature of the fisheries present within the Management Units yielding substantial tonnages (>20t), three samples each will be taken. For the Management Units yielding less than 10 tonnes per annum only one sample will be taken. Silver eels will be sampled in an almost identical way apart from those management units that do not contain a silver eel fishery.
III.E.4 Regional co-ordination
The table below lists all relevant RCM recommendations and the responsive action taken by Ireland Recommendation Responsive Action RCM NEA 2005 “Other biological Parameters” RCM NEA recommends seeking multilateral agreements to overcome the obligation to provide data for species by member states that have small catches of these species.
It was agreed that each country would continue to sample stocks with small catches with the option of pooling the data. Sampling designs were standardised with those of surrounding countries.
RCM NEA 2005 “Other biological Parameters” RCM NEA recommends providing aggregated maturity data to the assessment working groups on a yearly basis for those stocks that are sampled on a routine basis yearly, in a format agreed by the working group.
Ireland has provided maturity data to stock assessment working groups annually since 2005.

EN 31 EN
RCM NEA 2006 “Review of previous recommendations” The RCM NEA has identified areas where the quality and or cost-effectiveness of data collection could be improved under regional cooperation (ALKs, sexual maturity in the short term).
Ireland has agreed with the UK (E&W) to annually select target stocks for which maturity will be assessed jointly
RCM NEA 2006 “Other biological parameters” RCM NEA recommends a sampling design oriented for the proper area and season to obtain maturity data, intensifying the maturity sampling in the period of sexual activity.
Ireland follows the recommendations on sampling design from WKMAT (2007) which include sampling for maturity during the spawning season
RCM NEA 2006 “Other biological parameters” The RCM NEA notes the comments of the RCM NSEA that the forthcoming workshop (Lisbon, January 2007) dealing with the methodological approach in setting up the most effective sampling programme for maturity should provide the basis for an effective data collection programme
Ireland follows the recommendations on sampling design from WKMAT (Lisbon, 2007)
RCM NEA 2007 “coordinating otolith sampling” RCM NEA recommends a case study for elaborating a spatial ALK for sole in VIIa and reflection on task sharing for discussion in the 2008 RCM NEA
Ireland has sent the requested data to the UK ( L/F and ALK) and is awaiting further details at the RCM
III.E.5 Derogations and non-conformities
The exemption rules listed under III.B2.5 of Commission Regulation 199/2008/EC have been applied to the stocks in Appendix VII of the Commission Regulation. Stocks exempted from sampling are highlighted in grey in table III E.1. Derogations are not requested for all stocks for which the exemption rules apply as sampling some of these stocks is considered of importance for stock assessment and management. The table below lists the stocks that will be sampled even though the exemption rules apply.
Species Stock Landings TAC share Lophius budegassa VIIb-k, VIIIabd 2023 <10 Lophius piscatorious VIIb-k, VIIIabd 2023 <10 Merlangius merlangus VIa <200 >10 Merlangius merlangus VIIa <200 >10 Merluccius merluccius IIIa, IV, VI, VII, VIIIab 1071 <10 Micromesistius poutassou I-IX, XII, XIV 51897 <10 Pleuronectes platessa VIIfg <200 >10 Pleuronectes platessa VIIbc <200 >10 Pleuronectes platessa VIIh-k <200 >10 Solea solea VIIa <200 >10 Solea solea VIIfg <200 <10 Solea solea VIIbc <200 >10 Solea solea VIIhjk <200 >10
Anguilla anguilla The DCR requires 5 eels to be aged per cm. This is being interpreted as a guide to sample size rather than a requirement to sample 5 individuals within each length class. The length distribution of the Irish stock is highly uneven and it is not considered feasible (in light of the size of the fisheries and the nature of the sales structure) to attempt to achieve the latter. For instance, based on the commercial catch length distribution in 2008, it is estimated that 2000 individuals would be required to provide 5 individuals up to 65cm. Ireland intends to age approximately1000 individuals.

EN 32 EN
III.F Transversal variables Baltic Sea (ICES areas III b-d), North Sea (ICES areas IIIa, IV and VIId) and Eastern Arctic (ICES areas I and II), and North Atlantic (ICES areas V-XIV and NAFO areas)
III.F.1 Capacity
III.F.1.1 Data acquisition
Fleet capacity data is collated on the Irish Register of Sea Fishing. The register is updated quarterly. Data include vessel length (LOA), KWS, GTs, age and segment to which the vessel is registered. Gears deployed by each vessel will be obtained from logbook data. Specific actions for vessels < 12m LOA Fleet Segmentation Appendix IV segmentation is used for collecting all transversal economic parameters. The following data sources have been used to segment the inshore fishing fleet (less than 12 meters in length - LOA) into their main fishing metier:
• EU Fleet Register (from 18/08/2008), • Expert knowledge, • Recorded fishing activity from previous economic surveys, • National metier analysis.
This segmentation is common to sections III.F.2 (Effort) and III.F.3 (Landings). Data Sources The data sources that will be used to estimate capacity variables for the inshore fleet are:
• National Sentinel vessel programme, • EU Fleet Registers (01/01/2009 and 01/01/2010), • Expert knowledge of fishing activity.
These data sources are common to sections III.F.2 (Effort) and III.F.3 (Landings).
Sampling Strategy Transversal variables will be collected from a total of 100 vessels under the sentinel vessel programme, using a stratified sampling strategy to target the major fisheries from each of the 5 required metiers. The following sample rates will be achieved: Metier Targeted Fishery Sample Size Coverage VII Crustaceans Potters Mixed Crab/Lobsters 15 c.7% Lobster 16 c. 6% Shrimps 13 c. 6% Spider Crabs 3 c. 15% SUB-TOTAL 47 VI Crustaceans Potters Crabs 5 c. 15% Mixed Crab/Lobsters 10 c. 8%

EN 33 EN
Shrimps 4 c. 40% SUB-TOTAL 19 VIIa Mollusc Potters Whelks 8 c. 20% VIIa Mollusc Dredgers Razor Clams 6 c. 30% Cockles 6 c. 15% Surf clams 3 c. 60% Scallops 3 c. 65% SUB-TOTAL 18 VII f-k Gillneters Demersal spp. 8 c. 25% Total 100 c. 11% Data will be collected from all vessels for the reference year(s). Each vessel owner will fill in a daily log-book with details of effort, landings, prices, costs, and biological length measurements where applicable. This sampling strategy is common to sections III.F.2 (Effort) and III.F.3 (Landings).
III.F.1.2 Data Quality
Specific actions for vessels < 12 meters A total of 11% of the active fleet will be sampled under the national sentinel vessel programme. As this is the first year collecting transversal data at the metier level and at the higher temporal resolution, it is not possible to provide target precision levels. An analysis of variance to calculate the precision of all transversal parameters in each of the metiers will be conducted at the end of the first reference year, and the results will be used to assess the sampling requirements for the following year. The population coverage is deemed sufficient to cover all major fisheries within the required metiers. A quality procedure will be followed for the collection, entry, storage, and validation of all sentinel data. This will include automated checks on economic parameters to ensure they are within acceptable limits, and random checks on data entered by personnel, employed specifically for this purpose. Data will be stored in a computerised system developed specifically for this programme, and the identities of participants and the primary data will be password protected. Only aggregated data will be used for reporting purposes. Approximately 30% of vessels will be cross-checked by observers collecting biological variables at sea. Any erroneous data identified will be followed up directly with the vessel owners by survey personnel. A final validation of data will be conducted at the end of year by means of an exit interview with all participants, and feedback on survey procedures will help assist with improving the survey for future years. An activity profile for each target fishery will be produced, based on effort data collected from the 100 vessels. These profiles, in conjunction with expert knowledge, will be used to estimate the total number of vessels fishing in a particular metier for a given reference year. Number of vessels A vessel may fish in several metiers in a given reference year. If a vessel has at least one entry in the sentinel vessel log-book for a particular metier, it will be included in the vessel count for that metier. The total number of vessels active in a metier will be estimated by building up activity profiles of target fisheries within metiers and applying the results to non-

EN 34 EN
sentinel vessels in the same fisheries. In the case of vessels <10m expert knowledge will be applied to the raising procedure from the sentinel vessel programme. In addition, certain vessels will be licensed to only fish within certain metiers, which will increase the accuracy of the final estimates. For example, polyvalent potting vessels will be confined to the potting metiers, and specific vessel will be confined to the dredging metier. These vessels represent 30% and 7% of the <12 meter fleet respectively. GT, kW, Vessel Age Fishing capacity data will be taken from the fleet registers as they are on the 1st of January of the reference year. Capacity indicators from inactive vessels will not be included when reporting at the metier level (B1), but will be reported as inactive at the fleet level, in accordance with Appendix III. Capacity indicators will be collected exhaustively from the fleet register.
III.F.1.3 Regional co-ordination
None
III.F.1.4 Derogations and non-conformities
None
III.F.2 Effort
III.F.2.1 Data acquisition
The following effort based transversal variables can be provided from the logbook at the appropriate stratification level and units for all Irish vessels >10m: Number of vessels, Days at sea, Hours fished, Fishing days, kW * Fishing Days, GT * Fishing days, Number of trips, Gear type, Number of fishing operations. Specific actions for vessels under 10 meters The following economic parameters will be collected from all sentinel vessels under 10m LOA, to fulfil the requirements of Appendix VIII of Commission Decision (2008/XXX/EC)
Variable Gears Economic Parameters To be collected in 2009 & 2010 Data source
Days at sea All Fishing trip dates Sentinel Log-book
Hours Fished Dredges and Trawls Daily fishing time (hrs) Daily Steaming time (hrs)
Sentinel Log-book
Fishing days All Daily fishing records Sentinel Log-book
kW * Fishing Days Dredges and Trawls Daily fishing records * kW of vessel
Sentinel Log-book EU Fleet Register
GT * Fishing Days Dredges and Trawls Daily fishing records * GT of vessel
Sentinel Log-book EU Fleet Register
Number of trips
All Daily fishing records Sentinel Log-book
Number of rigs
Multi rig (level 4) n/a n/a
Number of fishing operations
Purse Seine n/a n/a
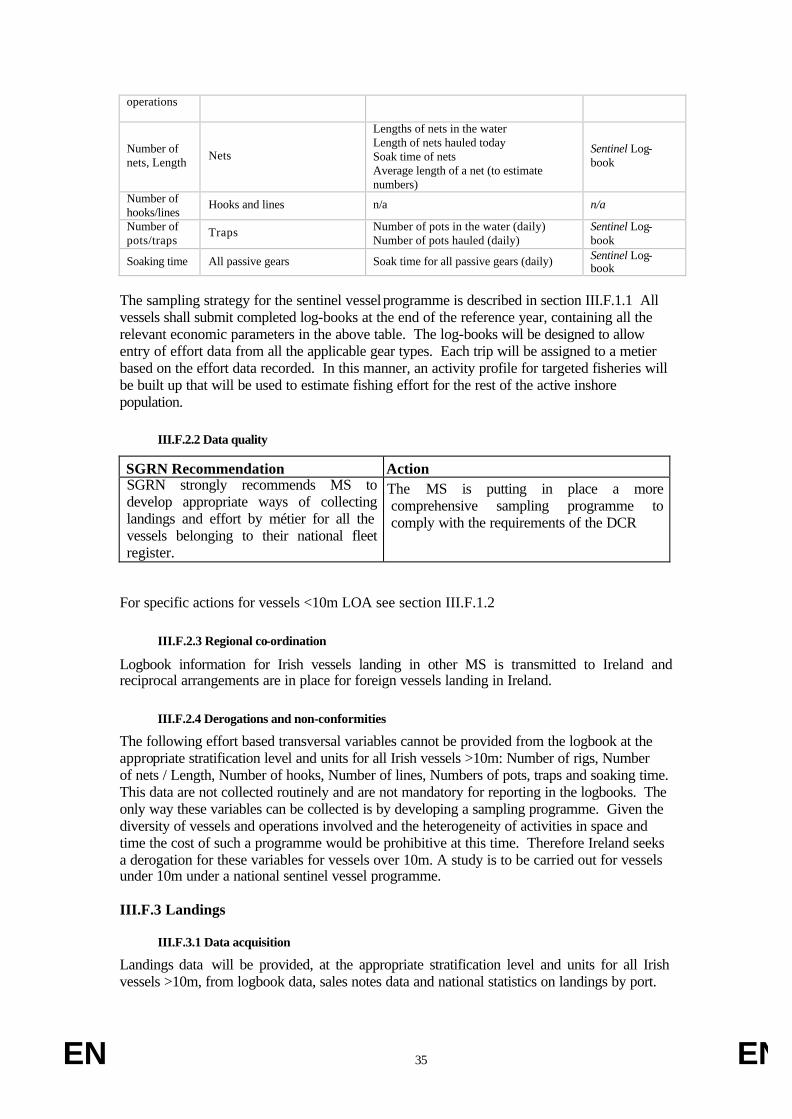
EN 35 EN
operations
Number of nets, Length Nets
Lengths of nets in the water Length of nets hauled today Soak time of nets Average length of a net (to estimate numbers)
Sentinel Log-book
Number of hooks/lines
Hooks and lines n/a n/a
Number of pots/traps
Traps Number of pots in the water (daily) Number of pots hauled (daily)
Sentinel Log-book
Soaking time All passive gears Soak time for all passive gears (daily) Sentinel Log-book
The sampling strategy for the sentinel vessel programme is described in section III.F.1.1 All vessels shall submit completed log-books at the end of the reference year, containing all the relevant economic parameters in the above table. The log-books will be designed to allow entry of effort data from all the applicable gear types. Each trip will be assigned to a metier based on the effort data recorded. In this manner, an activity profile for targeted fisheries will be built up that will be used to estimate fishing effort for the rest of the active inshore population.
III.F.2.2 Data quality
SGRN Recommendation Action SGRN strongly recommends MS to develop appropriate ways of collecting landings and effort by métier for all the vessels belonging to their national fleet register.
The MS is putting in place a more comprehensive sampling programme to comply with the requirements of the DCR
For specific actions for vessels <10m LOA see section III.F.1.2
III.F.2.3 Regional co-ordination
Logbook information for Irish vessels landing in other MS is transmitted to Ireland and reciprocal arrangements are in place for foreign vessels landing in Ireland.
III.F.2.4 Derogations and non-conformities
The following effort based transversal variables cannot be provided from the logbook at the appropriate stratification level and units for all Irish vessels >10m: Number of rigs, Number of nets / Length, Number of hooks, Number of lines, Numbers of pots, traps and soaking time. This data are not collected routinely and are not mandatory for reporting in the logbooks. The only way these variables can be collected is by developing a sampling programme. Given the diversity of vessels and operations involved and the heterogeneity of activities in space and time the cost of such a programme would be prohibitive at this time. Therefore Ireland seeks a derogation for these variables for vessels over 10m. A study is to be carried out for vessels under 10m under a national sentinel vessel programme.
III.F.3 Landings
III.F.3.1 Data acquisition
Landings data will be provided, at the appropriate stratification level and units for all Irish vessels >10m, from logbook data, sales notes data and national statistics on landings by port.
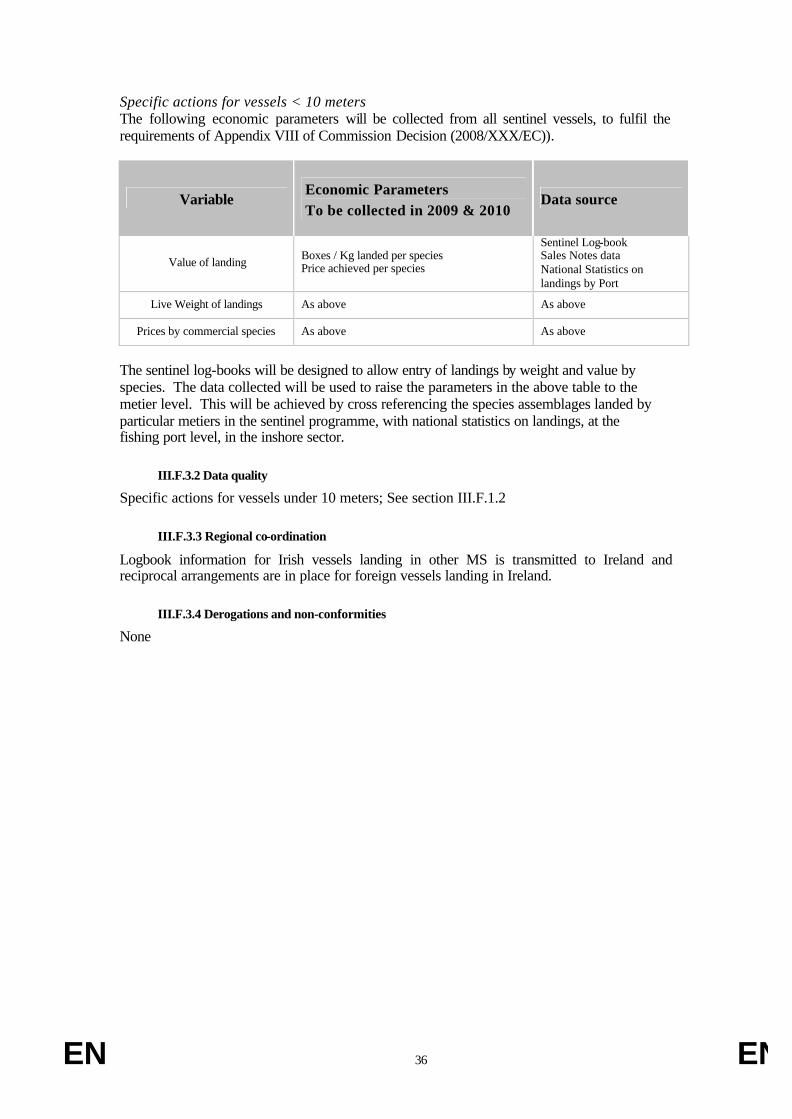
EN 36 EN
Specific actions for vessels < 10 meters The following economic parameters will be collected from all sentinel vessels, to fulfil the requirements of Appendix VIII of Commission Decision (2008/XXX/EC)).
Variable Economic Parameters To be collected in 2009 & 2010
Data source
Value of landing Boxes / Kg landed per species Price achieved per species
Sentinel Log-book Sales Notes data National Statistics on landings by Port
Live Weight of landings As above As above
Prices by commercial species As above As above
The sentinel log-books will be designed to allow entry of landings by weight and value by species. The data collected will be used to raise the parameters in the above table to the metier level. This will be achieved by cross referencing the species assemblages landed by particular metiers in the sentinel programme, with national statistics on landings, at the fishing port level, in the inshore sector.
III.F.3.2 Data quality
Specific actions for vessels under 10 meters; See section III.F.1.2
III.F.3.3 Regional co-ordination
Logbook information for Irish vessels landing in other MS is transmitted to Ireland and reciprocal arrangements are in place for foreign vessels landing in Ireland.
III.F.3.4 Derogations and non-conformities
None
EN 37 EN
III.G Research surveys at sea Ireland meets the criteria for research surveys as defined in Appendix IX of Commission Decision (2008/XXX/EC). Ireland participates in several ICES expert groups that deal with the coordination and organisation of these surveys. These groups are as follows: IBTS Working Group (International bottom trawl surveys) PGHERS (Co-ordinates herring surveys) PGNAPES (Co-ordinates blue whiting and Atlanto-Scandian herring surveys) WGMEGS (Co-ordinates mackerel and horse mackerel egg surveys) WGNEPHSURV (Co-ordinates Nephrops underwater television surveys) PGNEACS (Co-ordinates North east Atlantic Continental Slope Survey) In 2009-2010, the Irish Marine Institute plans to conduct or participate in the following surveys:
• International Ecosystem Survey in the Nordic Sea ( Participation only) • Western IBTS Fourth Quarter Groundfish Survey • Blue Whiting Survey • International Mackerel and Horse Mackerel Egg Survey • Spawning Herring Acoustic Survey • Pre Spawning Herring Acoustic Survey • Nephrops UWTV Survey Irish Sea • Nephrops UWTV Survey Aran Grounds • Nephrops UWTV Survey Celtic Sea
Proposed Pilot Surveys
• Irish Deepwater Survey (2009) Annex 5 • Herring Recruitment Survey Annex 6
111.G.1.1 Planned Surveys
• International Ecosystem Survey in the Nordic Sea (Participation only)
Aim: The aim of the survey is to provide fishery independent indices of abundance on Atlanto-Scandian Herring (ASH) and Blue Whiting to the Northern Pelagic and Blue Whiting Fisheries Working Group (NPBWWG). It also provides ecosystem data on the Norwegian and Barents Seas to other working groups. Data Collection: Spatial coverage extends from approximately 62° to 73° N and between 5° W and 10° W and includes extensive hydrographic data. Ireland receives a share of the TAC for both stocks and sends one Scientist on the southern leg of the survey. Data Storage: The survey data is stored in the international ICES PGNAPES database for ASH and Blue Whiting.

EN 38 EN
Ecosystem indicators The International Ecosystem Survey in the Nordic Sea satisfies the criteria listed in relation to ecosystem indicators 1, 2, 3 and 4. Ireland plans to send one scientist to participate in this survey. For survey map please refer to the Danish NP Proposal
III.G.2.1 Modifications in the surveys
No changes or modification to the survey design are foreseen.
111.G.1.2 Planned Surveys
• Western IBTS Fourth Quarter Groundfish Survey
Aim: The Western IBTS Fourth Quarter Groundfish Survey collects data on the distribution, relative abundance and biological parameters of commercial stocks in VIaS, VIIb, VIIgN & VIIjN After commissioning of a new research vessel in 2003 the current time series was initiated and built on two independent existing time series. As with the older time series, survey planning is presented at the International Bottom Trawl Working Group (IBTS) and sampling protocols adhere to the prescribed IBTS manual. Sampling is carried according to a depth stratified semi-random design where 25% of stations are allocated randomly. Data acquired from the Irish seabed mapping programme as well information from commercial fisherman is then used to source suitable fishing location within 10nmi of these random locations. The remaining 75% of stations are selected at random from the survey database of clear tows, ensuring a minimum of 10nmi between stations. As with the other IBTS coordinated surveys in the Western Area, a narrow corridor of overlap is designed in to the survey area to facilitate ongoing comparison of survey trends between this survey and it’s neighbouring IBTS surveys. This survey is, however, the important and only link in coverage between the Scottish survey to the north, Spanish Porcupine survey to the west, UK to the east and south, as well as French survey in the central and southern Celtic Sea. Three intercalibration exercises have taken place between the Spanish Porcupine Survey and this survey, as we as earlier calibration studies with the neighbouring French and Scottish groundfish surveys as part of the IPROSTS EU Study Contract 98-057. Data collection: The target species are sampled for length, sex ratio, weight, age and maturity. The currently utilised survey assessment indices are for haddock, whiting, plaice and sole. Data is also collected and provided for other demersal stocks (i.e. cod, white & black anglerfish, megrim, lemon sole, hake, saithe, ling, blue whiting and a number of elasmobranchs) as well as several pelagics (herring, horse mackerel and mackerel).

EN 39 EN
In addition to sampling of target species, the entire catch is sorted and quantified to as close to species level as is consistently possible, given the resources. This data has been utilised in a number of ecosystem as well and biological and environmental impact studies. This Survey also continues to contribute data to a number of oceanographic datasets such as EUROGOOS as well as marine habitat classification programmes such as INFOMAR Data storage: At present the survey data is captured directly into Microsoft Access with subsequent transfer to SQLServer. Functionality is in place within the current SQLServer database to output data formatted for transfer to DATRAS and this is in progress. Ecosystem indicators This Survey satisfies the criteria listed in relation to ecosystem indicators 1, 2, 3 and 4. Planned survey stations are shown in Figure 1
III.G.2.2 Modifications in the surveys
No changes or modification to the survey design are foreseen.
III.G.1.3 Planned surveys
• Blue Whiting Survey Survey Aims The aim of the survey is to provide an estimate of relative abundance to the Working Group of Widely Distributed stocks (WGWIDE) and to compile a global time series of estimates that can be used to tune the assessment of this stock.
• Collect acoustic data on spawning and post spawning aggregations of Blue Whiting (Micromesistius poutassou) along the northern migration pathway from key spawning areas in target sub areas 1 and 2b and 2a (PGNAPES defined)
• Determine an age stratified estimate of relative abundance and biomass of blue whiting within the survey area
• Collect biological samples from directed trawling on insonified fish echotraces to determine age structure and maturity state of survey stock
• Collect physical oceanography data as horizontal and vertical profiles from a deployed sensor array
• Conduct a abundance and distribution survey of marine mammals and seabirds Data collection: Acoustic data is collected during the survey using a Simrad ER60 scientific echosounder operating over four frequencies (18, 38, 120 & 200kHz). All hydrographic data collected during vertical CTD casts is collected using a SeaBird 911 CTD unit. Biological data collected during the survey in the form of length, weight, sex, maturity and age data from target species collected during fishing operations is stored on an Access database and up loaded to a Sequel Server database at the Institute. All survey data is stored in raw and processed formats. Data Storage
EN 40 EN
All survey data is stored both by the Marine Institute and in a web based International survey database for all survey participants. Within the Marine Institute all survey data are stored in 3 formats; electronically on a Sequel Server database platform and as two hard copies (DVD and High capacity storage tapes) one of which is stored offsite. The international database contains data collected in all aspects of the survey (acoustic, biological and hydrographic). This database is coordinated and managed through ICES PGNAPES by the Faeroes. Access to the online database is via http://oracle.frs.fo/apex Ecosystem indicators The Blue Whiting survey satisfies the criteria listed in relation to ecosystem indicators 1, 2, 3 and 4. Planned survey stations are shown in Figure 2 RCM Recommendation
Action taken
RCM NEA 2007 “Regional coordination” Dates of the blue whiting surveys must be announced by the Dutch and Irish national correspondents to the other respective national correspondents and the correspondent laboratories. This information should also be made available on the website
This information is presented in August for the following year’s surveys for all participant nations through the ICES PGNAPES Report. A request for participation is circulated to all national correspondents at the start of the survey yea.
Survey Cruise track is shown in Figure 2
III.G.2.3 Modifications in the surveys
No changes or modification to the survey design are foreseen.
III.G.1.4. Planned surveys
• International Mackerel and Horse Mackerel Egg Survey Ireland participates in the International Mackerel and Horse Mackerel Egg Survey that is coordinated by ICES every three years. The Aim of this survey programme is to assess the spawning stock biomass of the Mackerel and Horse Mackerel stocks in the North-eastern Atlantic. Plankton samples are collected using a Gulf VII plankton sampler. Mackerel and Horse Mackerel eggs are extracted and quantified to calculate an annual egg production. Adult samples are collected for the analysis of fecundity and subsequently egg production and fecundity estimates are used to calculate the spawning stock biomass for the assessment working group. All protocols are in accordance with the ICES WGMEGS. The international survey program covers the Eastern Atlantic from Gibraltar to the north coast of Scotland between January and July and works on a sampling grid with a resolution of ½° latitude * ½° longitude. Ireland conducts two surveys between 48N and 58N

EN 41 EN
The 2010 ICES international mackerel and horse mackerel egg survey is split into a number of sampling periods, allowing full coverage of the expected spawning areas in the south and in the western area. Norway, Scotland, Netherlands, Germany and Ireland will cover the western survey area, from the Bay of Biscay to the North of Scotland, between February and July. Spain and Portugal will cover the southern spawning area west of Portugal, Cadiz, Galicia and the Cantabrian Sea. The Irish mackerel egg survey data is stored in a series of spreadsheets and forwarded to the data coordinator in FRS- Scotland where it is held on the international egg survey database. Ecosystem indicators The Mackerel Egg satisfies the criteria listed in relation to ecosystem indicators 1, 2, 3 and 4. Planned survey stations are shown in Figure 3.
III.G.2.4 Modifications in the surveys
No changes or modification to the survey design are foreseen.
III.G.1.5 Planned surveys
• Spawning Herring Acoustic Survey Survey Aims The aim of the survey is to provide an estimate of relative abundance to the HAWG and to compile a time series of estimates that can be used to tune the assessment of this stock.
• Collect acoustic data on pre-spawning and spawning aggregations of herring (Clupea harengus) within key spawning areas in the Celtic Sea.
• Determine an age stratified estimate of relative abundance of herring within the survey area (ICES Divisions VIIb, VIIj, VIIg and VIIaS)
• Collect biological samples from directed trawling on insonified fish echotraces to determine age structure and maturity state of the herring stock
• Collect ancillary information on secondary pelagic species such as sprat and pilchard to determine biomass and abundance within the survey area
• Collect physical oceanography data as horizontal and vertical profiles from a deployed sensor array.
• Survey by visual observations marine mammals and seabird abundance and distribution during the survey
Data collection: Acoustic data is collected during the survey using a Simrad ER60 scientific echosounder operating over four frequencies (18, 38, 120 & 200kHz). All hydrographic data collected during vertical CTD casts is collected using a SeaBird 911 CTD unit. Biological data collected during the survey in the form of length, weight, sex, maturity and age data from target species collected during fishing operations is stored on an Access database and up loaded to a Sequel Server database at the Institute. All survey data is stored in raw and processed formats. Data storage All survey data is stored both by the Marine Institute and in a web based International survey database for all survey participants. Within the Marine Institute all survey data are stored in 3 formats; electronically on a Sequel Server database platform and as two hard copies (DVD and High capacity storage tapes) one of which is stored offsite. A web based International

EN 42 EN
survey database (FishFrame) is used by all survey participants. This database contains data collected in all aspects of the survey (acoustic, biological and hydrographic). This database is coordinated and managed through ICES PGHERS. The online database is managed by the Danish and is available through http://dmz-web08.dfu.min.dk/NorthSea/FishFrame/ Ecosystem indicators The spawning herring survey satisfies the criteria listed in relation to ecosystem indicators 1, 2, 3 and 4. Planned survey stations are shown in Figure 4.
III.G.2.5 Modifications in the surveys
No changes or modification to the survey design are foreseen.
III.G.1. 6 Planned surveys
• Pre Spawning Herring Acoustic Survey Survey Aims The aim of the survey is to provide an estimate of relative abundance to the HAWG and to extend the tuning series used in the assessment.
• Collect acoustic data on pre-spawning and spawning aggregations of herring (Clupea harengus) within summer feeding areas to the west and north of Ireland.
• Determine an age stratified estimate of relative abundance of herring within the survey area (ICES Divisions VIaS and VIIb)
• Collect biological samples from directed trawling on insonified fish echotraces to determine age structure and maturity state of survey stock
• Collect physical oceanography data as horizontal and vertical profiles from a deployed sensor array.
• Sighting survey of marine mammals and seabirds encountered during the survey Data collection: Acoustic data is collected during the survey using a Simrad ER60 scientific echosounder operating over four frequencies (18, 38, 120 & 200kHz). All hydrographic data collected during vertical CTD casts is collected using a SeaBird 911 CTD unit. Biological data collected during the survey in the form of length, weight, sex, maturity and age data from target species collected during fishing operations is stored on an Access database and up loaded to a Sequel Server database at the Institute. All survey data is stored in raw and processed formats. Data storage All survey data is collected and stored both by the Marine Institute and in a web based International survey database (FishFrame) for all survey participants. This database contains data collected in all aspects of the survey (acoustic, biological and hydrographic). This database is coordinated and managed through ICES PGHERS. The online database is managed by the Danish and is available through http://dmz-web08.dfu.min.dk/NorthSea/FishFrame/ Ecosystem indicators The pre-spawning herring survey satisfies the criteria listed related to ecosystem indicators 1, 2, 3 and 4.
EN 43 EN
Planned survey stations are shown in Figure 5 III.G.2.6 Modifications in the surveys
This survey is now undertaken during the summer feeding phase and is carried out as a southwards continuation with the west of Scotland summer survey. The combination of these two surveys now allows for synoptic survey coverage of the Malin Shelf Stock Complex (as identified by the WESTHER project) for stock assessment purposes.
III.G.1. 7 Planned surveys
• Nephrops UWTV Survey Irish Sea
The main aims of the survey are to collect Nephrops burrow density estimates from a randomised fixed (3.5 nmi) grid of stations in the Western Irish Sea. Data Collection. Typically this amounts to around 140 UWTV stations although this may vary slightly (+-5%) depending on the randomisation. At each site 10 minutes of geo-referenced and “field of view calibrated” video footage is collected. This footage is reviewed independently by two trained and “calibrated” Nephrops burrow counters to obtain quality assured average minute by minute burrow counts. These data are in turn used to estimate the abundance and spatial distribution of Nephrops burrows over the ground. The results feed into the stock assessment and scientific management advice for this stock. Ancillary information on Nephrops activity, behaviour and fishing impacts is also collected. Environmental conditions are also monitored using a sledge mounted CTD at each deployment location. The survey design and protocols are described more fully in the WKNEPHTV 2007 report http://www.ices.dk/iceswork/wgdetailacfm.asp?wg=WKNEPHTV. Calibration footage and training protocols follow the recommendations of WKNEPHBID 2008 http://www.ices.dk/reports/LRC/2008/WKNEPHBID/directory.asp The data collected, validated and stored at sea in a specifically designed Access database. Following QA and QC procedures the data are uploaded to SQL database in the Marine Institute. The worked up results are transmitted to the relevant ICES Working Group (WGNSDS). This survey provides fishery independent information on the abundance of Nephrops. The results together with those collected in an associated AFBI trawl survey can be used to define the conservations status of that stock (indicator 1). Planned survey stations are shown in Figure 6 RCM Recommendation
Action taken
RCM NEA 2005 “Regional coordination” It was the recommendation of this RCM that the EU Commission be approached to support a workshop that would carry out an inter-calibration exercise in relation to identifying and counting Nephrops burrows from underwater TV survey data
Ireland supported this action and actively participated in WKNEPHTV 2007 and WKNEPBID 2008. Ireland continues to support co-ordination and development of UWTV surveys and their use in the assessment and advisory process.
EN 44 EN
III.G.2.7 Modifications in the surveys
No changes or modification to the survey design are foreseen.
III.G.1.8 Planned surveys
• Nephrops UWTV Survey Aran Grounds
The main aims of the survey are to collect Nephrops burrow density estimates from a randomised fixed (2.25 nmi) grid of stations in the Aran Grounds. Data Collection. Typically this amounts to around 65 UWTV stations although this may vary slightly (+-5%) depending on the randomisation. Indicator stations are also surveyed at 9 sites in Galway Bay and off Slyne Head. At each site 10 minutes of geo-referenced and “field of view calibrated” video footage is collected. This footage is reviewed independently by two trained and “calibrated” Nephrops burrow counters to obtain quality assured average minute by minute burrow counts. These data are in turn used to estimate the abundance and spatial distribution of Nephrops burrows over the ground. The results feed into the stock assessment and scientific management advice for this stock. Ancillary information on Nephrops activity, behaviour and fishing impacts is also collected. In addition 5 beam trawls are carried out to provide Nephrops for length, weight, sex and maturity sampling. Environmental conditions are also monitored using a sledge mounted CTD at each deployment location. The survey design and protocols are described more fully in the WKNEPHTV 2007 report http://www.ices.dk/iceswork/wgdetailacfm.asp?wg=WKNEPHTV. Calibration footage and training protocols follow the recommendations of WKNEPHBID 2008 http://www.ices.dk/reports/LRC/2008/WKNEPHBID/directory.asp The data collected, validated and stored at sea in a specifically designed Access database. Following QA and QC procedures the data are uploaded to SQL database in the Marine Institute. The worked up results are transmitted to the relevant ICES Working Group (WGHMM). This survey provides fishery independent information on the conservation status of Nephrops (indicator 1). Planned survey stations are shown in Figure 7
III.G.2.8 Modifications in the surveys
No changes or modification to the survey design are foreseen.

EN 45 EN
III.G.1.9 Planned surveys
• Nephrops UWTV Survey Celtic Sea
The main aims of the survey are to collect Nephrops burrow density estimates from a randomised fixed (3.5 nmi) grid of stations in the Celtic Sea deep area. Data Collection. Typically this amounts to around 100 UWTV stations although this may vary slightly (+-5%) depending on the randomisation. Indicator stations are also surveyed at 15 other sites in the Celtic Sea. At each site 10 minutes of geo-referenced and “field of view calibrated” video footage is collected. This footage is reviewed independently by two trained and “calibrated” Nephrops burrow counters to obtain quality assured average minute by minute burrow counts. These data are in turn used to estimate the abundance and spatial distribution of Nephrops burrows over the ground. The results feed into the stock assessment and scientific management advice for this stock. Ancillary information on Nephrops activity, behaviour and fishing impacts is also collected. In addition 7 beam trawls are carried out to provide Nephrops for length, weight, sex and maturity sampling. Environmental conditions are also monitored using a sledge mounted CTD at each deployment location. The survey design and protocols are described more fully in the WKNEPHTV 2007 report http://www.ices.dk/iceswork/wgdetailacfm.asp?wg=WKNEPHTV. Calibration footage and training protocols follow the recommendations of WKNEPHBID 2008 http://www.ices.dk/reports/LRC/2008/WKNEPHBID/directory.asp The data collected, validated and stored at sea in a specifically designed Access database. Following QA and QC procedures the data are uploaded to SQL database in the Marine Institute. The worked up results are transmitted to the relevant ICES Working Group (WGHMM). This survey provides fishery independent information on the conservation status of Nephrops (indicator 1). Planned survey stations are shown in Figure 8
III.G.2.9 Modifications in the surveys
No changes or modification to the survey design are foreseen. RCM Recommendations RCM Recommendation
Responsive action
RCM NEA recommends that all fishing operations sampled on-board research vessels be flagged when the sorting process does not operate on the complete catch (subsampling from total catch for species distinction).
Ireland always sorts the entire catch on its surveys

EN 46 EN
Ireland will manage and analyse all of the relevant resulting data sets from the DCR process and make these data available to ICES STECF and other expert groups. This is in accordance with Council Regulation EC (199/2008) Article 18 ‘where member states shall make detailed and aggregated data available to support scientific analysis as (a) a basic for advice to fisheries management including RAC’s and (b) in the interest of policy development with stakeholders and (c) for scientific publication’
EN 47 EN
IV. Module of the evaluation of the economic situation of the
aquaculture and processing industry IV.A Collection of data concerning the aquaculture
IV.A.1 General description of the aquaculture sector
In 2006, the overall total production volume in both the shellfish and finfish sector was 57,422 tonnes, an 8.6% decrease in production compared with that of 2005. The most significant reductions in volume occurred in the salmon and bottom mussel industries where recorded decreases in production were 18.8% and 20.1% respectively. Despite these declines there were significant increases in the volumes of rope mussel (10.3%) and re-laid rope mussel seed (54.2%), pacific/gigas oysters (12%), clams (52.2%) and freshwater trout (8.1%). The combined value of all shellfish harvested was Euro 63.3 million and Euro 61.4 million for the finfish sector. In 2006, the total value of production in the aquaculture sector was Euro 124.7 million compared with Euro 110.2 million in 2005, a 13% increase in value. Ireland has a relatively diverse aquaculture sector operating across a number of different sub sectors. The main species produced in Ireland are blue mussel (Mytlus edulis), native oyster (Ostrea edulis), Pacific (gigas) oyster (Crassostrea gigas), salmon (Salmo salar) and rainbow trout (Oncorhynchus mykiss). In Ireland, all aquaculture operations must be licensed under the Fisheries (Amendment) Act 1997 by the Minster for the Department of Agriculture, Fisheries and Food (DAFF). Licences are issued on a site-by-site basis, which means that one aquaculture producer may hold several licences. In 2006, a total of 264 farmers were active in the sector, operating 523 aquaculture licences around the coast of Ireland, with an additional 181 licences lapsed or due for renewal by the end of 2006 (total of 704 licences). The majority of the licences were for shellfish farming with a breakdown of 43% and 38% for oysters and mussels respectively. An overview of the typologies of aquaculture present in Ireland are provided in table IV.A.1 Comparison with the fisheries sector In 2006, the fisheries sector total production was 271,872 tonnes, a 7.4% decrease in production compared with that of 2005. The total value of production in the fisheries sector was €203.3 million compared with €181.6 million in 2005, a 27% increase in value.

EN 48 EN
IV.A.2 Data acquisition
The following economic parameters will be collected to fulfil the requirements of Appendix X of Commission Decision (2008/XXX/EC)
Var
iabl
e gr
oup
Variable Economic Parameters To be collected in 2009 & 2010
Data source
Turnover Total invoice value, excluding VAT, of sales made during the year (SBS 12 11 0)
Census
Subsidies operating subsidies Questionnaire
Turn
over
Other income Other aquaculture income Questionnaire
Wages and salaries of staff
Total remuneration payable by an employer to an employee in return for work done by the later during the accounting period, including the value of any social contributions, income taxes etc. payable by the employee (SBS 13 32 0)
Questionnaire
Pers
onne
l cos
ts
Imputed value of unpaid labour Unpaid labour
Hours per year Relationship to enterprise
Questionnaire
Ener
gy
cost
s Energy costs Light, heat and power used during the accounting period. Questionnaire
Livestock costs Cost of raw material (fish and eggs) Questionnaire
Raw
mat
eria
l co
sts Feed costs Cost of fish feed etc. Questionnaire
Rep
airs
and
m
aint
enan
ce
cost
s
Repairs and maintenance Repairs and maintenance Questionnaire
Oth
er
oper
atio
nal c
osts
Other operational costs
All other operating costs, such as marketing and distribution costs and administration costs. Excludes wages and salaries, light, heat & power, depreciation, purchases of raw materials.
Questionnaire
Depreciation of capital Depreciation for year Questionnaire
Cap
ital c
osts
Financial costs, net I Financial costs, net Questionnaire
Extra
ordi
nary
co
sts,
net
Extraordinary costs, net Extraordinary costs, net Questionnaire

EN 49 EN
Cap
ital v
alue
Total value of assets
Fixed Assets (by category) Net Book Value Additions Disposals Depreciation
Questionnaire N
et
Inve
stm
ents
Net Investments
Fixed Assets Net Book Value Additions Disposals Depreciation
Questionnaire
Deb
t
Debt
Short-term loans Bank overdraft Creditors and accruals Other current liabilities Long-term loans
Questionnaire
Livestock Volume of raw material (fish and eggs) Questionnaire
Raw
mat
eria
l vo
lum
e
Fish Feed Volume of fish feed etc. Questionnaire
Vol
ume
of S
ales
Volume of sales Per species Census
Number of persons employed Total employed Census
Empl
oym
ent
FTE National As per Study No Fish/2005/14 Census
Num
ber o
f En
terp
rises
By size Category 1 – 10 11 – 49 50 – 249 > 250
Number employed per enterprise Census
Target Population The data source for the national implementation for the target population is:
• Annual census on production volumes and value in the aquaculture sector. The target population is all licensed fish farming enterprises operating in the Member State, as defined by NACE code 05.02 “Fish Farming”. The 2009 programme will collect economic data on the sector from 2008, and likewise, the 2010 national programme will collect data pertaining to 2009. This is necessary as the financial data will only be available from the company accounts in the following financial year. Segmentation Appendix XI segmentation is used for collecting all economic parameters on the aquaculture sector. The following data sources have been used to segment the fleet:
• Annual mandatory census on production volumes and value, and employment, • Expert knowledge.
In accordance with Appendix XI of Commission Decision (2008/XXX/EC) the segments are defined by the target species and farming techniques. The target population and planned sample numbers are provided in tables IV.A.2 and IV.A.3.

EN 50 EN
Data sources The data sources for the national implementation for the economic variables of the processing industry sector are:
• Annual mandatory census on production volumes and value, and employment, • Annual voluntary survey on costs and labour.
Sampling Strategy The sampling plan is detailed in Table IV.A.2 and IV.A.3 under the headings “planned sample number”, “planned sample rate” and “sampling method”, for each of the segments. A: Parameters collected via mandatory census
The Member State will exhaustively collect the following economic parameters for all segments identified in table IV.A.1 in an annual census of the aquaculture sector:
• Turnover by species, • Volume of sales by species, • Employment, • Number of enterprises.
B: Parameters collected via voluntary survey
In addition, the Member State will survey a total of 6 segments (representing 95% of the production value) and collect those economic parameters defined in Appendix X of Commission Decision (2008/XXX/EC) These are not collected in the annual census described in (A) above. A total of 228 enterprises are active in the 6 segments addressed by this survey, and represent 86% of the total number of enterprises in the aquaculture sector. The remaining 36 operate in segments that have 5 or fewer enterprises. Due to the low number of enterprises in these segments, and their low level of turnover, these segments will be excluded from this survey. This position will be reviewed after the first year of the National Programme. An overall sampling rate of 20% of the target population is deemed sufficient to get a representative sample of enterprises in this sector. In this manner, a total of 46 enterprises will be surveyed. The sampling intensity will be reviewed at the end of the first year of the National Programme, based on an analysis of the variance within each of the parameters collected.
Parameter Estimation Estimation of unpaid labour An estimation of unpaid labour, in any, by family members or other will be ascertained from the annual costs and labour survey. Estimation of capital value

EN 51 EN
Capital value will be estimated from the value of the current fixed tangible assets as reported in the annual costs and labour survey. Net book value, additions, disposals and depreciation will be requesting for each of the following asset category:
• Land and buildings, • Production farms and machinery, • Other farm machinery and inventory, • Farms under construction, • Other fixed assets.
In addition, details of value of stock and financial assets will be requested. Estimation of capital costs Capital costs will be estimated from the value of the current fixed tangible assets and the preferred method of depreciation for the different asset categories. This information will be requested on the annual costs and labour survey. Data availability: For cost and labour variables collected through the voluntary annual survey, data for a particular reference year will be fully validated and available approximately 15 months from the end of the reference year. Data for a particular reference year is collected at the start of November of the following year (to coincide with the final submission date for tax returns for the previous year). A three month period follows before all data is received from those targeted in the survey, with an additional two months for data procession, and validation before the data are ready for transmission. Production and employment data will be available 8 months after the end of that calendar year: data for a particular reference year is collected at the start of January of the following year. A three to six month period follows before all census forms are received, with an additional 2 months for data processing, and validation before the data are ready for transmission.
IV.A.3 Data quality
There are no stated precision requirements for collecting data in the aquaculture sector. As such, the Member State is using percentage coverage of the segments as a measure of quality for parameters not collected exhaustively. Farms selected for the voluntary costs and labour survey will be contacted in advance to inform them of the survey; this will be followed up by site visits to interview the owners and assist with filling out the survey questionnaire, if required. Certain data collected via questionnaire and/or interview from companies will be validated, where possible, against their published end-of-year abridged accounts. Data collected shall be treated as confidential and shall not be disclosed in any format whereby the companies or individuals can be identified. All primary data shall by stored electronically in a secure database, and be protected under the terms of the Data Protection Acts.
EN 52 EN
IV.A.4 Regional coordination
The Member State will participate at the relevant Regional Coordination Meetings (RCM). There are no direct responsive actions required from the Member State from previous RCM recommendations. The Member State is aware of the low attendances of economists at RCM and the need for more participation at these meetings. As such, the Member State will endeavour to ensure Ireland is represented at future meetings.
IV.A.5 Derogations and non-conformities
None IV.B. Collection of data concerning the processing industry
IV.B.1 Data acquisition
The following economic parameters will be collected to fulfil the requirements of Appendix XII of Commission Decision (2008/XXX/EC)
Var
iabl
e gr
oup
Variable Economic Parameters To be collected in 2009 & 2010
Data source
Turnover Total invoice value, excluding VAT, of sales made during the year (SBS 12 11 0)
Abridged Accounts Company Register
Subsidies operating subsidies Abridged Accounts Questionnaire
Turn
over
Other income Total Financial income, extraordinary income
Abridged Accounts Questionnaire
Wages and salaries of staff
Total remuneration payable by an employer to an employee in return for work done by the later during the accounting period, including the value of any social contributions, income taxes etc. payable by the employee (SBS 13 32 0)
Abridged Accounts Questionnaire
Pers
onne
l cos
ts
Imputed value of unpaid labour Unpaid labour
Hours per week Relationship to enterprise
Interview Questionnaire
Ener
gy
cost
s Energy costs Light, heat and power used during the accounting period.
Abridged Accounts Questionnaire
Raw
m
ater
ial
cost
s
Purchase of fish and other new material for production
The value of primary and secondary material that is used to produce a product (fish bought in).
Abridged Accounts Questionnaire
Oth
er
oper
atio
nal
cost
s
Other operational costs
All other operating costs, such as marketing and distribution costs and administration costs. Excludes wages and salaries, light, heat & power, depreciation, purchases of raw materials.
Abridged Accounts Questionnaire

EN 53 EN
materials.
Depreciation of capital Depreciation for year Abridged Accounts Questionnaire
Cap
ital c
osts
Financial costs, net Interest costs of capital Government Bond interest rate
Extra
ordi
nary
co
sts,
net
Extraordinary costs, net Extraordinary costs, net Abridged Accounts Questionnaire
Cap
ital v
alue
Total value of assets
Fixed Assets Net Book Value Additions Disposals Depreciation
Abridged Accounts (Balance Sheet) Questionnaire
Net
In
vest
men
ts
Net Investments
Fixed Assets Net Book Value Additions Disposals Depreciation
Abridged Accounts (Balance Sheet) Questionnaire
Deb
t
Debt
Short-term loans Bank overdraft Creditors and accruals Other current liabilities Long-term loans
Abridged Accounts Questionnaire
Number of persons employed Total employed Company Register
Empl
oym
ent
FTE National As per Study No Fish/2005/14 Company Register
Num
ber
of
Ente
rpris
es By size Category
1 – 10 11 – 49 50 – 249 > 250
Number employed per enterprise Company Register
Target Population The data source for the national implementation for the target population is the: National database of registered processing companies in the seafood sector. The target population is all licensed fish processing companies operating in the Republic of Ireland, as defined by NACE code 15.20 “Processing and preserving of fish and fish products”. The 2009 programme will collect economic data on the sector from 2008, and likewise, the 2010 national programme will collect data pertaining to 2009. This is necessary as the financial data will only be available from the company accounts in the following financial year. For enterprises that carry out fish processing, but not as a main activity, the total number of enterprises and their turnover attributed to fish processing will be collected for the first year of the 2009/2010 National Programme.

EN 54 EN
Segmentation As segmentation levels are not specified in the new data collection regulations for the processing industry sector, the Member State will adopt the recommendation of the SGRN-08-01 report on the implementation of the new data collection regulations (in draft format), and segment the sector on employment size category, as indicated by the “number of enterprises” economic variable in Appendix XII of Commission Decision (2008/XXX/EC) In previous years, the Member State segmented the sector based on a turnover threshold. This approach is no longer permissible under the new regulations. Data sources The data sources for the national implementation for the economic variables of the processing industry sector are:
• Abridged Company accounts, • Data submitted voluntarily by processing enterprises, • Interviews with selected enterprises.
Sampling Strategy The sampling plan is detailed in Table IV.B.1 and IV.B.2 under the headings “planned sample no”, “planned sample rate” and “sampling method”, for each of the enterprise size categories. On the 1st October 2008, using total number employed, there were 117 companies in the “= 10” category size, 52 in the “11 – 49” category, and 12 in the “50 – 249” category, representing 26%, 49% and 25% of turnover in the sector respectively. A survey sampling rate of 15% in the “= 10” category, 25% in the “11 – 49” category, and 30% in the “50 – 249” category is deemed sufficient coverage to get a good representative sample of the sector. This represents a total of 36 companies, or 20% of the population. As all processing companies are limited liability (ltd) companies they are required to publish abridged accounts on an annual basis. The Member State will carry out an analysis of these audited accounts through the Companies Registration Office (CRO). Any parameters that cannot be estimated from these accounts will be collected via a questionnaire and/or fact-finding interview with enterprises selected in the sampling frame. Parameter Estimation Estimation of unpaid labour An estimation of unpaid labour, in any, by family members or other will be ascertained by direct interview with the individual enterprises. Estimation of employment Employment will be collected in term of total engaged in the sector by enterprise, and a national FTE based on the average industrial working week of 40 hours with 20 days annual leave and 9 public holidays. This equates to 230 working days, or 1840 hours annually. This compares with 2000 hours as recommended for a harmonised EU FTE, as stated in Study No FISH/2005/14 “Calculation of labour including FTE (full-time equivalents) in fisheries. Estimation of capital costs Capital costs will be estimated from the value of the current fixed tangible assets and the preferred method of depreciation for different asset categories. In the first instance, the abridged company accounts will be examined to these parameters. In cases where the information is not in the public domain, companies selected for the survey will be requested to supply details on both capital value and costs.

EN 55 EN
Data availability: Data for a particular reference year data shall be available 15 months after the end of that calendar year. This is necessary as the abridged accounts generally will not be available until after 31st October of the following year, to coincide with the final submission date for income tax returns for the previous financial year.
IV.B.2 Data quality
There are no stated precision requirements for collecting data in the processing industry sector. As such, the Member State is using the percentage coverage of the size categories as the measure of quality. For some parameters, a census will be conducted from publicly available sources. These include turnover, and employment statistics. The format of the abridged accounts of companies vary significantly in the detail supplied, necessitating the Member State to request additional information from those companies selected in the sampling frame where the data are lacking in the published accounts. This is currently run on a voluntary basis, and hence the quality of the data is dependent on compliance within the industry. Certain data collected via questionnaire and/or interview from companies will be validated, where possible, against their published end-of-year abridged accounts. Data collected shall be treated as confidential and shall not be disclosed in any format whereby the companies or individuals can be identified. All primary data shall by stored electronically in a secure database, and be protected under the terms of the Data Protection Acts.
IV.B.3 Regional coordination
The Member State shall participate at the relevant Regional Coordination Meetings (RCM). There are no direct responsive actions required from the Member State from previous RCM recommendations. The Member State is aware of the low attendances of economists at RCM and that there is a need for more participation at these meetings. As such, the Member State will endeavour to ensure Ireland is represented at future meetings.
IV.B.4 Derogations and non-conformities
None

EN 56 EN
V. Module of evaluation of the effects of the fishing sector on the
marine ecosystem Data for the Indicators for this module will be collected by survey.
• The Western IBTS Fourth Quarter Groundfish Survey will collect data for Indicators 1- 4 in waters up to 200m deep from Divisions VI and VII, with the exception of VIIa and VIIf. (Years 2003-Present)
• The Spawning Herring Acoustic Survey will collect data for Indicators 1-4 from VIIb, VIIj, VIIg and VIIaS in Q4 each year.
• The Pre-spawning Herring Acoustic survey will collect data for Indicators 1-4 in VIa and VIIb in Q2 annually.
• The Blue Whiting Acoustic Survey will collect data for Indicators 1- 4 in VIa and VIb in March-April each year. This survey is co-ordinated by PGNAPES and the final survey area may change depending on other international involvement.
• Underwater TV surveys will collect information on Conservation Status of Fish Species (Indicator 1) in VIIb (Aran survey – Q2) , VIIa (Irish Sea survey – Q3), and VIIg (Celtic Sea Survey – Q3). (Years 2002-Present)
The Marine Institute will be granted access to VMS data by SFPA for the purposes of the DCR. Currently, vessel position data at collected hourly or every two hours for all Irish vessels over 15 m. This frequency can be increased to half hourly for the purposes of the DCR. It has already proven possible to link daily VMS positional data with logbook information for the Irish fleet thus allowing all positional data to be classified to level 6. The distribution of fishing activities, aggregation of fishing activities and areas not impacted by mobile bottom gears can be mapped and provided as required. Ireland will manage and analyse all of the relevant resulting data sets from the DCR process and make these data available to ICES STECF and other expert groups. This is in accordance with Council Regulation EC (199/2008) Article 18 ‘where member states shall make detailed and aggregated data available to support scientific analysis as (a) a basic for advice to fisheries management including RAC’s and (b) in the interest of policy development with stakeholders and (c) for scientific publication’
EN 57 EN
VI. Module for management and use of the data VI.A Management of the data Data from port sampling is warehoused in the STOCKMAN system, which is a client-server relational database in SQL2005 with a VB6 graphical user interface (GUI). This database also houses data on biological variables collected under Module IIIE. In the past the port sampling information stored in Stockman has been collected by stock gear and area, however from 2009 this information will be collected at the vessel trip level as required from the metier based sampling programme. Discard sampling, has been collected on a fleet basis and will continue to be collected as such. This data is housed an Access 2000 databases on the Marine Institute’s network. Transversal information is collected via Logbooks. The logbooks information is the responsibility of the SFPA (Sea Fisheries Protection Authority), this Oracle database is managed and housed under the Irish governments data warehouse. A view of this database is maintained on the Marine Institute’s network. This view is housed in a secure SQL Server 2000 database. Survey information is stored on individual databases. The IBTS groundfish survey and acoustic surveys are stored on SQL server databases, and these automatically generate output to internationally coordinated survey databases such as that in PGNAPES, PGHERS and Datras. Socio-economic data are stored in a SQL Server 2005 database, located on a secure server within the BIM network. Access to this database is strictly controlled and limited to personnel directly involved in the collection and management of these data. Development will continue in 2009/2010 to ensure that the database schema is updated to allow for storage of any additional economic parameters collected in the 2009/2010 National Programme. The thrust of the data management programme is to consolidate data where possible, and centralise on more robust and secure enterprise-wide databases while continuing to enhance and further develop the suite of analysis and reporting tools available. Significant progress has been made over recent years to consolidate the range of databases and data management solutions for fisheries datasets. Data archiving is now formalised, and the integration of survey datasets is well underway. In 2009 it is envisaged to merge the Discard and Stockman Databases as these both contain biological information on landings, which from 2009, will be collected on the same metier basis. Further development of the Socio-economic database will commence in 2009 to update the database to facilitate the generation of metadata, as required under article 13(b) of Council Regulation (EC) No. 199/2008. This will be in the form of summary data views to key tables in the database. The database currently contains all economic parameters as defined in Appendix XVII and XIX of Commission Regulation (EC) No. 1639/2001. This will be updated in 2009 to incorporate changes to existing economic parameters in the fisheries and processing sectors, as defined in Appendix VI and XII of Commission Regulation (199/2008/EC), and will include additional tables to store economic parameters on the aquaculture industry, Data exchange to the EU is currently via Excel templates as supplied by the JRC. The data is pre-validated prior to submission by the import procedures (described below), but undergo additional validation and quality checks. A feasibility study to supply data from the MI servers to JRC directly via Apache web services was conducted, and should the JRC require data via this route Ireland will be able to rapidly implement a solution. The key shortcoming to supplying data via this route currently (to meet the format of STECF requests for data) is

EN 58 EN
the manual integration required between the Logbooks and Stockman databases. It is envisaged to commence this integration in 2009. A table with a description of the major properties of the databases is shown below. Quality control and validation procedures. Data on biological variables from port sampling are collected according to documented SOP’s. These SOP’s cover areas such as data quality and checking and are follow closely PGCCDBS (2008) discussions regarding international best practice. At the database front end there are validation procedures ensuring the integrity of data entered from biological sampling events. The database itself has a dedicated DBA (data base administrator) who checks for inputs on a regular interval for range date and sum cross checks. The data on transversal variables such as vessel level information on catch effort and landings is housed in the logbooks database. This data is gathered by the Sea Fisheries Protection Authority (SFPA) directly from vessel logsheets which have to be completed by law (for vessels greater than 10m). The data is entered to a government level database called IFIS (Irish Fisheries Information System), which is an Oracle database system. Views of this data required for the DCR are generated dynamically and downloaded periodically across a secure web interface using Oracle discoverer. This interface has 3 security layers including a final fob generated 128bit keycode. Downloads from IFIS are uploaded to the MI logbooks database using SQL server DTS packages. This allows for a further layer of validation and quality (range) checking of the data. The DBA also administers the logbooks database ensuring a consistent quality assured data resource. From 2009 socio-economic data from the annual DCR economic survey will be submitted electronically, in XML format, via interactive PDF forms. Initial validation will occur on submission of the form data. For example, if certain mandatory fields are not filled in, or if balance sheet figures do not match, the users will not be allowed to submit the forms electronically. Increasingly, data quality has been a key driver in deciding the format of the annual economic survey forms. To this end, two separate forms are submitted for each vessel; a financial form that mirrors an end-of-year accountant’s report, and a non-financial form, which contains data on fishing activity and crew structure. The financial form must be submitted and signed off by a qualified accountant. The survey is timed to coincide with the final submission date for mandatory self-assessment tax returns to the Office of the Revenue Commissioners, thus ensuring that the required financial data are both readily available, and validated and processed in advance by the vessel’s accountant. The vessel owner completes the non-financial form. Ireland is currently developing a program that automatically imports the XML data into the Socio-economic database. A key part of this process will be defining validation procedures, to check and validate the data on the fly as it is imported to the database. Data errors will be captured on upload and will be followed up by direct contact with the vessel owner or accountant. Ireland plans to create a secured web based work space in 2009, where information relating to the DCR will be shared between BIM and the MI. In the first instance this workspace will contain all details and supporting documentation relating to the NP. The workspace will also contain all the relevant documentation relating to the data holdings in the 2 Institutes. This information is currently housed on separate servers which are not shared across the Institutes. Currently co-ordination between BIM and the MI is maintained through regular contact.
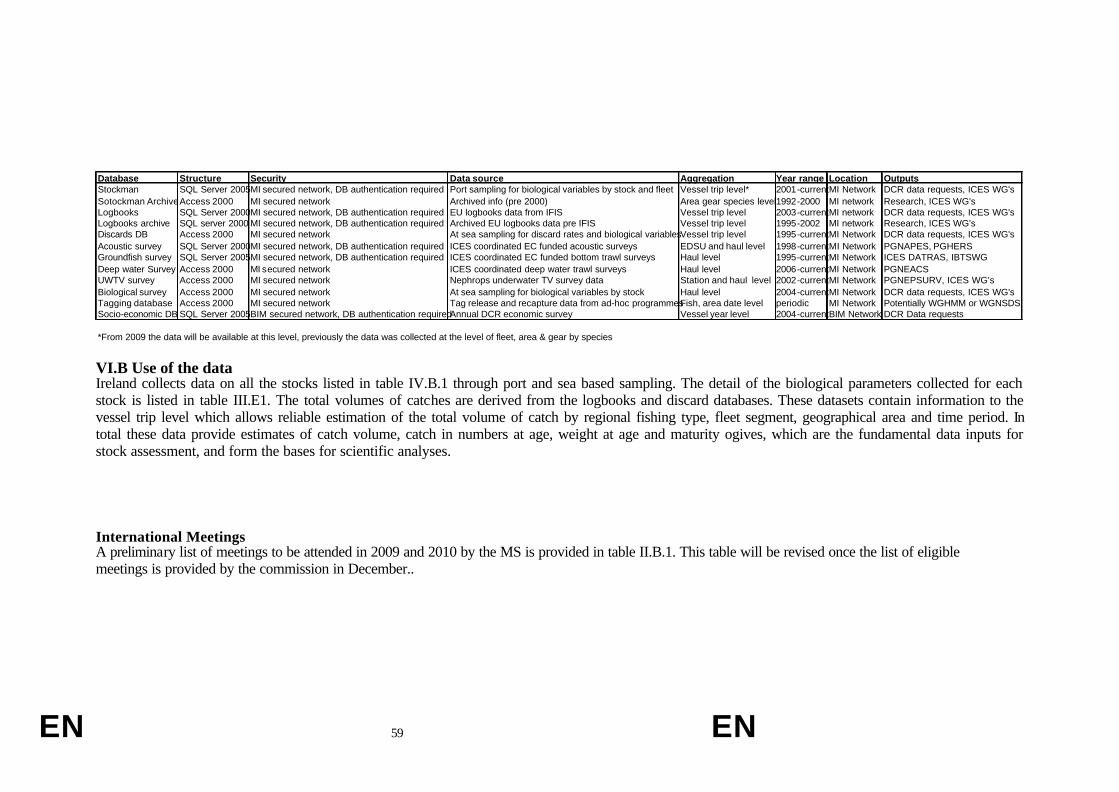
EN 59 EN
Database Structure Security Data source Aggregation Year range Location Outputs Stockman SQL Server 2005 MI secured network, DB authentication required Port sampling for biological variables by stock and fleet Vessel trip level* 2001-current MI Network DCR data requests, ICES WG's Sotockman Archive Access 2000 MI secured network Archived info (pre 2000) Area gear species level 1992-2000 MI network Research, ICES WG's Logbooks SQL Server 2000 MI secured network, DB authentication required EU logbooks data from IFIS Vessel trip level 2003-current MI network DCR data requests, ICES WG's Logbooks archive SQL server 2000 MI secured network, DB authentication required Archived EU logbooks data pre IFIS Vessel trip level 1995-2002 MI network Research, ICES WG's Discards DB Access 2000 MI secured network At sea sampling for discard rates and biological variables Vessel trip level 1995-current MI Network DCR data requests, ICES WG's Acoustic survey SQL Server 2000 MI secured network, DB authentication required ICES coordinated EC funded acoustic surveys EDSU and haul level 1998-current MI Network PGNAPES, PGHERS Groundfish survey SQL Server 2005 MI secured network, DB authentication required ICES coordinated EC funded bottom trawl surveys Haul level 1995-current MI Network ICES DATRAS, IBTSWG Deep water Survey Access 2000 MI secured network ICES coordinated deep water trawl surveys Haul level 2006-current MI Network PGNEACS UWTV survey Access 2000 MI secured network Nephrops underwater TV survey data Station and haul level 2002-current MI Network PGNEPSURV, ICES WG's Biological survey Access 2000 MI secured network At sea sampling for biological variables by stock Haul level 2004-current MI Network DCR data requests, ICES WG's Tagging database Access 2000 MI secured network Tag release and recapture data from ad-hoc programmes Fish, area date level periodic MI Network Potentially WGHMM or WGNSDSSocio-economic DB SQL Server 2005 BIM secured network, DB authentication required Annual DCR economic survey Vessel year level 2004-current BIM Network DCR Data requests *From 2009 the data will be available at this level, previously the data was collected at the level of fleet, area & gear by species VI.B Use of the data Ireland collects data on all the stocks listed in table IV.B.1 through port and sea based sampling. The detail of the biological parameters collected for each stock is listed in table III.E1. The total volumes of catches are derived from the logbooks and discard databases. These datasets contain information to the vessel trip level which allows reliable estimation of the total volume of catch by regional fishing type, fleet segment, geographical area and time period. In total these data provide estimates of catch volume, catch in numbers at age, weight at age and maturity ogives, which are the fundamental data inputs for stock assessment, and form the bases for scientific analyses. International Meetings A preliminary list of meetings to be attended in 2009 and 2010 by the MS is provided in table II.B.1. This table will be revised once the list of eligible meetings is provided by the commission in December..

EN 60 EN
VII. Follow-up of STECF recommendations Recommendations from SGRN for the 2006 NP
Actions Taken
Data on U10m:SGRN insists that the outcome of the pilot programme be used to set up routine sampling programmes under Module D for the fleet segment < 10 m from 2007 onwards
Ireland now has a comprehensive sampling programme and it is described in the 2009-2010 NP
Regarding Western IBTS, Ireland states that some new modifications in agreement with ICES IBTS Working Group has been applied to this survey, including 4 additional survey days for inter-calibration purposes. SRGN agreed with the approch
Ireland is continuing to comply with the recommendations of IBTS
Ireland affirms that it will continue with pilot surveys (National Funded) in 2006 year to assess the annual value of economic parameters specified in Appendix XIX. However, no details are offered with respect to the calculation of the parameters itself, and the time-disaggregation.
Details on the collection of economic parameters from the processing sector were provided in the National Programme and Technical Reports of subsequent years.
The sampling levels are based on the average of landing for the years 1999-2001, and not over the most recent three years. If Ireland is using the most recent data to increase the budget (third paragraph, page 20 of the NSP) is not easy to understand why these data is not used for sampling effort calculations. STECF recommended that an updated table be supplied
Ireland inserted the correct revised table
Vessel segmentation will not fully be done according to Appendix III of Regulation. The offshore fleet will be segmented based on the overall length, however, inshore fleet will be segmented based on the number of pots fished.
Ireland inserted the correct revised table

EN 61 EN
Recommendations from SGRN for 2007 NP
Actions taken
Regarding vessels of < 10 m, a pilot survey will be carried out for boats using passive gears in 2006. This survey will try to deliver data with the precision level of 2. However, it is not stated whether there is a pilot survey for boats <10 m using other gears. SGRN (STECF, 2006) informed us that Ireland is planning a pilot survey for the fishing fleet and that SGRN is insisting that this programme must include routinely sampling for boats < 10 m
SGRN was informed that for the 2007 NP the MS is carrying out the provisions of the Regulation by collecting data on boats < 10m using processor sales slips and fishing calendars
Regarding the Aran Nephrops Survey, no survey classified as Priority 2 is identified with such a name in Appendix XIV of Regulation 1639/2001 or in the amended revision (Regulation 1581/2004). Ireland states that this survey has been in operation since 2002 and now has an established time-series (5 years) and requests the inclusion as a Priority 2 survey from 2007 onwards.
Ireland removed this survey from the programme and sought to get it included in the list of new survey in the new regulation 199/2008
Pleuronectes platessa seems to be over-sampled in the EP. SGRN recommends MSs to use the precision analysis of previous year's sampling to establish their sampling plan in the NP proposal. Incorrect species naming in regulation
I Ireland is now sampling to this recommendation and is sampling the correct species
SGRN reminds the MS that the coverage of data collection by segment should be as set out in Appendix III to the DCR.
The Irish fleet segmentation is clearly defined in Table 10.1 of the 2007 National Programme and conforms to the fleet segmentation of Appendix III of Regulation 1639/2001.
SGRN recommends that MS follows the provisions of the DCR. On the collection of economic data
The Member State is committed to following the all provisions of the DCR
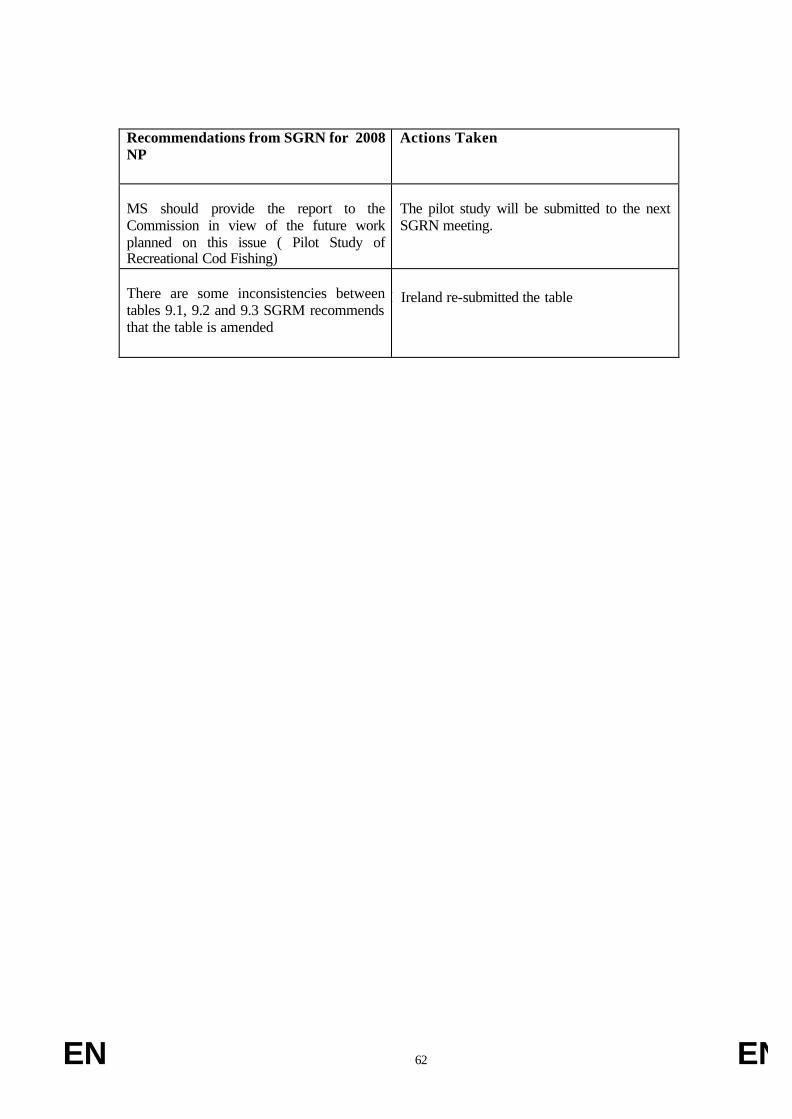
EN 62 EN
Recommendations from SGRN for 2008 NP
Actions Taken
MS should provide the report to the Commission in view of the future work planned on this issue ( Pilot Study of Recreational Cod Fishing)
The pilot study will be submitted to the next SGRN meeting.
There are some inconsistencies between tables 9.1, 9.2 and 9.3 SGRM recommends that the table is amended
I Ireland re-submitted the table
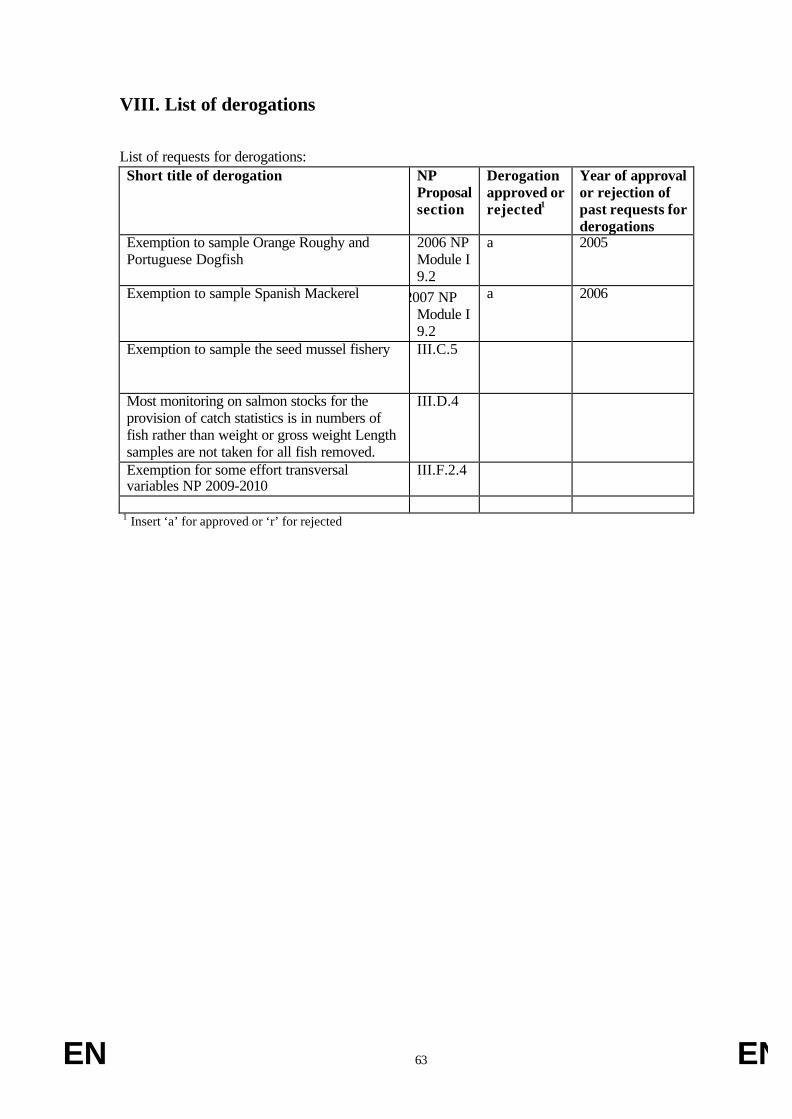
EN 63 EN
VIII. List of derogations List of requests for derogations: Short title of derogation NP
Proposal section
Derogation approved or rejected1
Year of approval or rejection of past requests for derogations
Exemption to sample Orange Roughy and Portuguese Dogfish
2006 NP Module I 9.2
a 2005
Exemption to sample Spanish Mackerel 2007 NP Module I 9.2
a 2006
Exemption to sample the seed mussel fishery III.C.5
Most monitoring on salmon stocks for the provision of catch statistics is in numbers of fish rather than weight or gross weight Length samples are not taken for all fish removed.
III.D.4
Exemption for some effort transversal variables NP 2009-2010
III.F.2.4
1 Insert ‘a’ for approved or ‘r’ for rejected
EN 64 EN
IX. List of acronyms and abbreviations Acoustic surveys Acoustic surveys use sound waves emitted from a "transducer" to estimate the density of plankton and fish shoals. The transducer is attached to a drop keel on the survey vessel, which is linked to an echo sounder in the vessel which records the shoals of fish as "marks" on a screen or paper trace. The density of these marks is used to calculate total biomass of a stock. Age The number of years of life completed, here indicated by an Arabic numeral, followed by a plus sign if there is any possibility of ambiguity (age 5, age 5+). BIM An Bord Iascaigh Mhara, The Irish Sea Fisheries Board, charged with responsibility for development of the fishing and aquaculture industries in Ireland. (see www.bim.ie ) Brown (yellow) eel Fully pigmented eel, yellow or brown colour. A largely sedentary life stage with small eyes and a soft body. It occurs in both coastal waters and freshwaters. By-catch Refers to discarded catch (see Discards) plus incidental catch not purposely targeted by the fishermen. CFB Central Fisheries Board (www.cfb.ie ) CPUE /Catch Per Unit of Effort The catch of fish, in numbers or in weight, taken by a defined unit of fishing effort. Also called catch per effort, fishing success, or availability. DAFF Department of Agriculture Fisheries and Food (see www.daff.gov.ie ) DCENR Department of Communications Energy and Natural resources (see www.dcenr.gov.ie) DCR / Data Collection Regulation EU Council Regulations 1543/2000, 1639/2001, 199/2008 established a community framework for the collection and management of the data needed to conduct the common fisheries policy. Each member state must collect data on the biology of the fish stocks, on the fleets and their activities and on economic and social issues Discard Discards are defined as that part of the catch returned to the sea as a result of economic, legal or other considerations. Discard rate The percentage (or proportion) of the total catch which is discarded. FAT Fisheries Assessment Technician – regionally-based sea-going staff employed by FSS. Fishing Effort The total fishing gear in use for a specified period of time. When two or more kinds of gear are used, they must be adjusted to some standard type Glass eel Small eel (approximately 70mm), less than one year post metamorphosis. Continental shelf waters to lower reaches of rivers. Body form as in adult, largely transparent but with localised pigment Groundfish Species of demersal fish dwelling on, or close to the sea floor, as targeted in the annual Western IBTS 4th quarter survey around the Irish coast. IBTS International Bottom Trawl Survey Working group ICES International Council for the Exploration of the Seas –Ireland shares the Total Allowable Catches TACs for many stocks we exploit with our European Union partners. Because of this international dimension many stocks need to be assessed in international fora such as ICES. ICCAT International Commission for the Conservation of Atlantic Tuna Marine Institute The Marine Institute is Ireland's national agency with the following general functions : "to undertake, to co-ordinate, to promote and to assist in marine research and development and to provide such services related to marine research and development, that in the opinion of the Institute will promote economic development and create employment and protect the environment." Marine Institute Act, 1991 (see www.marine.ie )

EN 65 EN
IFIS Integrated Fisheries Information System .Database held by DAFF with landings, effort and first sale value of fish species FSS / Fisheries Science Services – One of seven service areas of the Marine Institute, FSS’s mission is to assess, research and advise on the marine fisheries resource in Irish waters LA Laboratory Analyst. MS Member State. Nemesys Nephrops measuring system. NP National Programme. NPBWWG Northern Pelagic and Blue Whiting Fisheries Working Group RCM Regional Co-ordination Meetings. PGCCDBS, Planning group commercial catch discards and Biological sampling PGHERS ICES Planning Group for Herring Surveys PGNAPES ICES Planning Group on North East Atlantic Pelagic Ecosystem Surveys PGNEACS ICES Planning Group on the North-east Atlantic Continental Slope Survey Recovery Plan This is a multi-annual plan to recover seriously depleted stock. The plans generally involve agreed Harvest Control Rules, Technical Measures, Effort Controls and various control and enforcement measures. Recruitment The amount of fish added to the exploitable stock each year due to growth and/or migration into the fishing area. For example, the number of fish that grow to become vulnerable to the fishing gear in one year would be the recruitment to the fishable population that year. This term is also used in referring to the number of fish from a year class reaching a certain age. For example, all fish reaching their second year would be age 2 recruits. Sample A proportion or a segment of a fish stock which is removed for study, and is assumed to be representative of the whole. The greater the effort, in terms of both numbers and magnitude of the samples, the greater the confidence that the information obtained is a true reflection of the status of a stock (level of abundance in terms of numbers or weight, age composition, etc.) SFPA Sea Fisheries Protection Agency Silver (bronze) eel A non-feeding life-stage of eel migrating from freshwater or coastal waters to the ocean. Silver or bronze colour: length rarely less than 25 cm. Eyes large, body firm. STECF The Scientific Technical and Economic Committee on Fisheries was established by the European Commission and comprises fisheries scientists and economists from the Member States. The role of STECF is to advise the European Commission on scientific, technical and economic issues related to the management of fisheries resources that are exploited worldwide by members of the European Union. STO Scientific and Technical Officer Stock A "stock" is a population of a species living in a defined geographical area with similar biological parameters (e.g. growth, size at maturity, fecundity etc.) and a shared mortality rate. A thorough understanding of the fisheries biology of any species is needed to define these biological parameters. SSB / Spawning stock biomass The total weight of all sexually mature fish in the population. The size of SSB for a stock depends on abundance of year classes, the exploitation pattern, the rate of growth, fishing and natural mortality rates, the onset of sexual maturity and environmental conditions. STOCKMAN A custom developed relational database which houses the Marine Institute Fisheries Science Services sampling data. TAC / Total Allowable Catch is the total regulated catch from a stock in a given time period, usually a year.
EN 66 EN
TL Team Leader WKAGME Workshop on Anglerfish and Megrim WKDRP Workshop on Discard Raising Procedures WGMEGS ICES Working Group on Mackerel and Horse Mackerel Egg Surveys (WGMEGS) WKMSMAC Workshop on sexual maturity staging of mackerel and horse mackerel X. Comments, suggestions and reflections Inconsistencies in the regulation Appendix VII of Commission Regulation 199/2008/EC lists the stocks for which biological samples are to be collected. Most entries in the table contain more than one ICES Division which might be separated by a comma, a forward slash or a separate row. Neither the Commission Regulation nor the SGRN guidelines offer guidance on the definition of stocks in the table. Previously, Divisions that are separated by commas were interpreted as being part of the one stock. Divisions that are separated by a forward slash or a separate row of the table are interpreted as belonging to separate stocks. It is unclear whether there is a difference between stocks that are separated by a slash and stocks that are separated by a separate row in the table. It is also unclear how in Appendix VII the entry for herring in the North East Atlantic should be interpreted: VIa/VIaN/VIaS, VIIbc/VIIa/VIIj. Presumably VIa should not appear as one stock. Precision levels Although the required precision levels are specified in the regulation, it is unclear how the precision of an age or length composition should be defined as these are not estimates of a single number. The Irish interpretation of this is provided in Annex 3 Numbers of personnel for working groups In the Fin forms it states that for Stock Assessment Working Groups: travel cost and per diem for up to 2 experts per Member State will be allowed. ACOM in September 2008 has proposed to merge WGSSDS, WGNSDS and the Nephrops stocks in VII previously in WGHMM in 2009 to WGCELT. Historically Ireland has sent 2 members to each of these working groups, however, now it will be necessary to send up to five people to service this larger working group. Ireland suggests that commission’s criteria for funding should be related to number of stocks co-ordinated and assessed by a country in a meeting. Urgency: Timing of National Programme Evaluation It is extremely important for the EU to progress the evaluation of MS National Programmes as quickly as possible. Any undue delay in the process could result in specialised staff losses and affect the programme implementation. We would request that decisions or indeed decisions in principal be communicated as a matter of urgency to Ireland if at all possible. Financial Forms Ireland has included indicative personnell names in its’ financial forms for 2009 and 2010, some of these will probably change during the course of the programme.
EN 67 EN
XI. References WESTHER: A Multidisciplinary approach to the identification of herring (Clupea harengus L.) stock components west of the British Isles using biological tags and genetic markers. Q5RS-2002-01056. WKISCON: 2007/2/ACOM31 The Joint STECF/ICES Workshop on Implementation Studies on Concurrent Length Sampling Gerritsen H, Lordan C (2006) Gutted to round-weight conversion factors for anglerfish (Lophius piscatorius) and (Lophius budegassa). Irish Fisheries Bulletin 26. 8pp. ISSN:1649 5055 Council regulation (EC) no 1100/2007 establishing measures for the recovery of the stock for European Eel Efron, B. and Tibshirani, R.J., 1993. An introduction to the bootstrap. Chapman & Hall. CRC, 436pp. pp. Gerritsen, H.D. and McGrath, D., 2007. Precision estimates and suggested sample sizes for length frequency data. Fish Bull, 105(1): 116-120. ICES, 2007. Report of the herring assessment working group for the area south of 62oN. ICES CM 2008/ACOM:02. 601 pp. STECF-SGRN, 2007. STECF Sub-group on Research Needs (SGRN). Review of list of surveys at sea (Appendix XIV of EU Commission Regulation N°1581/2004) with their priorities. Commission Staff Working Paper 2007:01. 25 pp. WKMOG (2008) Report of the Workshop on Maturity Ogive Estimation for Stock Assessment (WKMOG). ICES CM2008/ACOM:33. 3-6 June 2008. Lisbon, Portugal. Anon 1996 Manual for International Bottom Trawl Surveys (Revision V) Addendum to ICES CM 1996/H:1 ICES 2007. Report of the Workshop on the use of UWTV surveys for determining abundance in Nephrops stocks throughout European waters. ICES CM: 2007/ACFM: 14 Ref: LRC, PGCCDBS. ICES 2008. Report of the Workshop and training course on Nephrops Burrow Identification (WKNEPHBID). ICES CM: 2008/LRC: 03 Ref: ACOM. Minto, C. (1998) Precision level estimates: robust to small sample sizes of finite populations for the Data Collection Regulations.

EN 68 EN
XII. Annexes Annex 1 Discard Protocols Irish Pelagic Observer Scheme Protocol Recording Forms The trip summary should be filled in at the end of each voyage. Please note that the gear details and landings of all species are now summarised along with numbers measured only, fish collected for otoliths etc. Vessel name is never recorded. Trip code shows the port code, sequence of trips and year: PEL/KBG/07/1. The activity sheet should be updated approximately every four - six hours or when an activity changes. There is no requirement to complete the sheets during down time. Record statistical rectangle, for example 32E4. The haul chronological is where fishing activities are summarised. Try and give a breakdown of the discard composition by species. It should be possible to estimate this from the sample composition. Record hauls where the fish are taken by the partner as zero and note quantity etc in comments. For each time the net is shot the haul record should be completed.. Complete the form as far as possible and record any other vessel activities, catches, fish behaviour, skippers comments etc. Use extra columns if necessary, for the same haul. The activities of the other vessels operating in the vicinity must be recorded on a daily basis on the vessel ID form, including where possible, nationality, registration number and gear. The by-catch/captures/sightings sheet is for whales, seals, turtles and seabirds. Record by-catch with haul number. Sightings do not need haul number, just a rectangle. Sampling For each haul, measured only samples should be obtained of both the landings and any discards. Because of the nature of the fishery there should be plenty of time to do this and for each component a minimum of 2 baskets for herring/blue whiting or four baskets for mackerel/scad should give reasonable length frequency distributions but this can be adjusted as necessary. Length frequencies should be recorded for all species present in the samples. Discards: Slippage should be recorded if it takes place. It is necessary to try to get a sample of slipped fish, for measurements and for ageing. Record the length distribution of all other species found in the discard sample. Estimates of the catch (tonnes) should be obtained from the deck engineers, record as weight landed on measured only sheet for that haul ie total of measured only sheets = total weight landed and/or discarded for that trip. It is useful to know the vessel’s pumping rate as this gives a guide to the amount of fish being brought onboard. One discard aged sample per trip, of herring, mackerel, horse mackerel and blue whiting is needed. Use the aged sheet and collect 10 fish per centimetre of length, from discards across all hauls. These fish should be frozen on longer trips. For landings, please contact Eugene Mullins (086 8339791) to see if a sample (random 15 kg) is required. Leave the right side of the sheet for the age reader to fill in ashore.

EN 69 EN
Catch = Landings + Discards Landings = Fish pumped into tanks and landed at the quay Discards = Slipped fish (likely to be the most important) +
Fish lost in burst bags + Meshed fish + Fish spilled from deck, separator etc. + Fish that escape through grids + Other fish not landed
Irish demersal/Nephrops Discard sampling protocols STANDARD OPERATING PROCEDURES FOR A DEMERSAL DISCARD TRIP 1.PRIOR TO DISEMBARKATION: The FAT should inform FSS/Discard Sampling Co-ordinator the date and time of departure and predicted date and time of return, aswell as the vessel details. Check that all equipment is ready and organised. 2.ONCE ABOARD: The FAT should familiarise himself with the operations of the ship. The main priority at sea is data collection, which begins as soon as the first haul is deployed. All data pertaining to the Haul is collected and recorded on the HAUL SHEET. Once the haul has been completed and is being lowered into the hopper/pound, an estimation of the bulk catch must be obtained. This is done either by the skipper or the FAT depending on the level of experience. The bulk catch is usually estimated in 40 kg box equivalents. As this is just an estimate it is important to get this information as accurate as possible. The discards should now be sampled. 3.DISCARD SAMPLING Obtain a random box (40kg) of discards from the sorting pound or the conveyor belt. The length composition of all species present should be recorded (MEASURED ONLY SHEET). Ensure at all times that the discard sample is representative of the discards taken in the catch. Fill the box to 9 inches in height (a 12inch ruler can be used). Measure the fish discards and record, keeping aside those fish that are to be aged (see bullet point below). Demersal species are measured to the nearest cm below and pelagic (sprat and herring only) to the nearest half cm below. In order to collect information on the age and weight of the commercially discarded species, a selection of five individuals per 1cm length group, per species is made per ICES Division, gear type and quarter. These fish are stored in 40 kg boxes for la ter examination in the port laboratories. Species to be aged are cod, whiting, haddock, plaice, black sole, megrim, saithe,L. budegassa, L. piscatorius and hake. A tally of this information is recorded on the QUARTERLY OTOLITH TALLY SHEET-. These fish are aged back at MI HQ and the fish details are recorded on the AGED DATA SHEETS. When all of the fish discards have been measured and those for ageing set aside, the box will contain all of the non-fish discards. Estimate the non-fish discards content of the box by measuring the height of the remaining contents and converting into the percentage of the box taken up by non-fish discards. Non-fish discards are defined as seaweed, dead shells, stones, crabs, jelly fish, squid and rubbish. Where the fishing trip is a non-Nephrops fishing trip discarded prawns are also included in the Non-fish discards. Sand / muck in discard sample: this is not to be included in the non fish discards. This is usually not a problem but on, for example, a beam trawl trip, the bulk catch is estimated by the skipper on the basis of what the nets look like when they are hauled aboard. State in the

EN 70 EN
comments section the amount of the bulk that sand / muck makes up. The composition of non-fish discards and the proportion of non-fish discards is recorded for every haul. 4.LANDINGS SAMPLING For every haul where discards are measured, landings should be measured. Measure and record landings samples on the MEASURED ONLY SHEET. It is important to sample discards and landings from the same haul. For hauls where discards samples are not taken these landings form these hauls can be measured concurrently 5. Commercial Landings Tally Record the commercial landings tally on the COMMERCIAL LANDINGS TALLY SHEET. This information is usually obtained from the skipper or one of the deckhands responsible for keeping account of what was landed. A conversion factor must be applied for fish that have been gutted (see REFERENCE TABLES). Ensure that the correct conversion factors for gutted to round landings is used. Once the total landings sum has been obtained, record it in the Total Landings box of the HAUL SHEET. Check for negative discards at this point. 6. ON RETURN TO PORT At the end of each trip, the CRUISE REPORT form must be completed. Once all the data sheets have been completed the data can be entered onto the FATS Discard Database as outlined in the Discard Database Manual. A readable copy of the data sheets should be made and sent to the Discard Sampling Co-ordinator. As outlined in the Discard Database Manual all excel files should be outputted and sent to the Discard Database administrator. STANDARD OPERATING PROCEDURES FOR A NEPHROPS DISCARD TRIP Steps 1,2,4-6 should be followed as outlined in Discard Demersal Sampling SOP above . The major difference in this protocol is with respect to the one box discard sample and whether or not there are Nephrops heads present in the one box sample. If there are no heads present then proceed with Step 3 as described above. If there are heads then use the following procedure. . i) Take out heads from 1 box sample ii) Estimate sample size left ie. 0.85 of a box iii) Measure all fish. iv) Give as accurate an estimate as possible of the volume occupied by NFD of the 0.85 box sample. Write in this % NFD on the measured only sheet v) Write 0.85 box in Quantity section in the measured only sheet. See Example Below
CRUISE CODE Haul No.
Quantity* 0.85 Units BOX Presentation R Type D % NFD 10
( 4 & 5 ) MEASURED ONLY SHEET Page No.
Notes The bulk catch on a Nephrops trip is estimated in kg. The weight of a box of prawns is estimated to be 35kg. Therefore the weight of the bulk (kg)=35kg*No. of Boxes If baskets are used then it is 22kg per basket. If the bulk catch is shovelled onto the table a more accurate estimate of the bulk catch can be obtained.

EN 71 EN
Annex 2 Bi-lateral Agreements
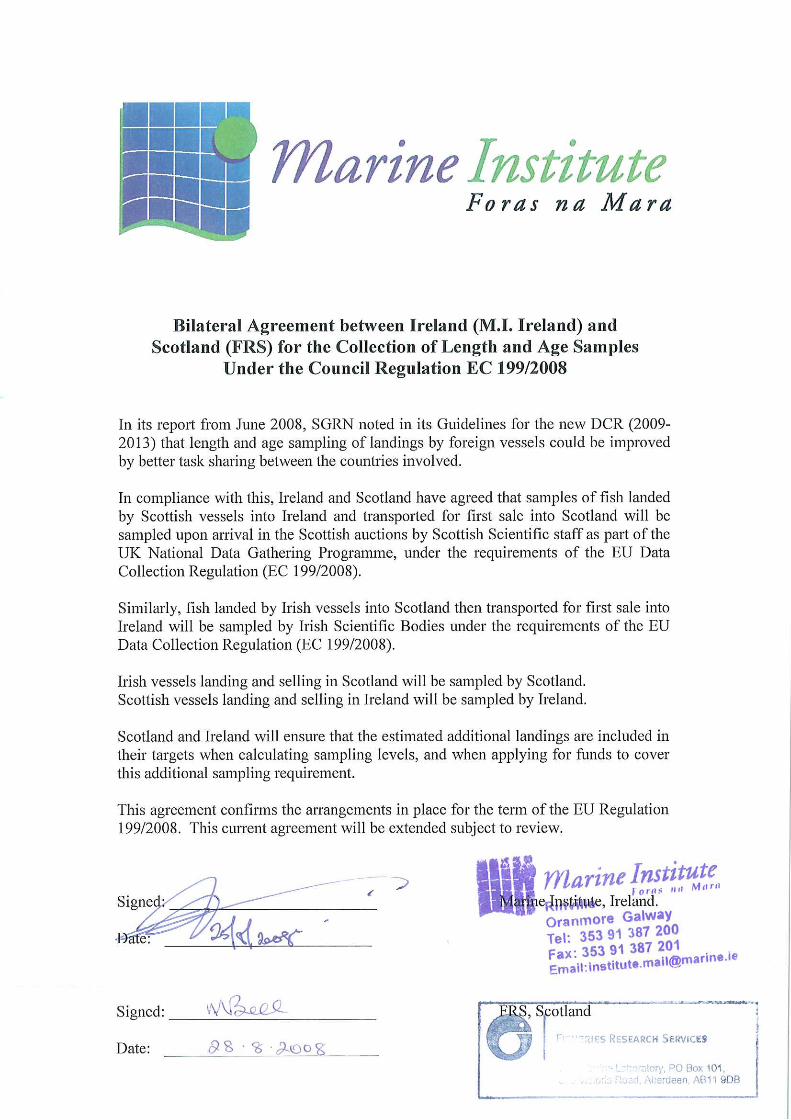

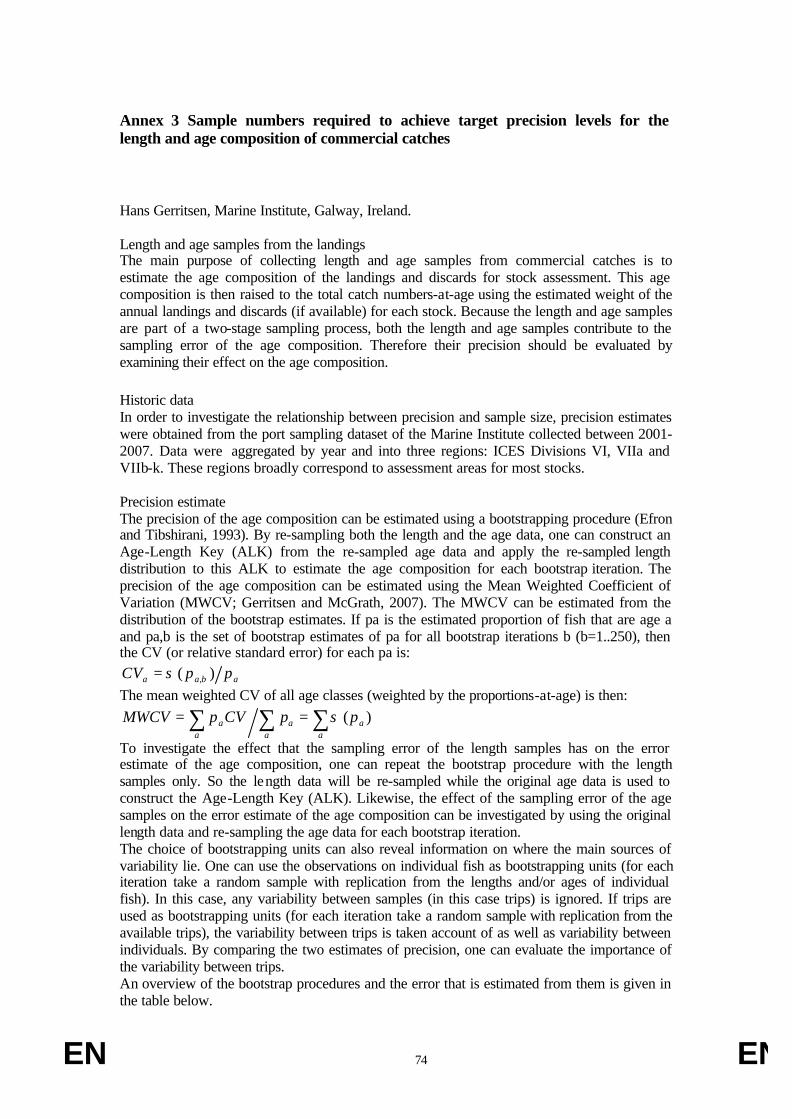
EN 74 EN
Annex 3 Sample numbers required to achieve target precision levels for the length and age composition of commercial catches Hans Gerritsen, Marine Institute, Galway, Ireland. Length and age samples from the landings The main purpose of collecting length and age samples from commercial catches is to estimate the age composition of the landings and discards for stock assessment. This age composition is then raised to the total catch numbers-at-age using the estimated weight of the annual landings and discards (if available) for each stock. Because the length and age samples are part of a two-stage sampling process, both the length and age samples contribute to the sampling error of the age composition. Therefore their precision should be evaluated by examining their effect on the age composition.
Historic data In order to investigate the relationship between precision and sample size, precision estimates were obtained from the port sampling dataset of the Marine Institute collected between 2001-2007. Data were aggregated by year and into three regions: ICES Divisions VI, VIIa and VIIb-k. These regions broadly correspond to assessment areas for most stocks. Precision estimate The precision of the age composition can be estimated using a bootstrapping procedure (Efron and Tibshirani, 1993). By re-sampling both the length and the age data, one can construct an Age-Length Key (ALK) from the re-sampled age data and apply the re-sampled length distribution to this ALK to estimate the age composition for each bootstrap iteration. The precision of the age composition can be estimated using the Mean Weighted Coefficient of Variation (MWCV; Gerritsen and McGrath, 2007). The MWCV can be estimated from the distribution of the bootstrap estimates. If pa is the estimated proportion of fish that are age a and pa,b is the set of bootstrap estimates of pa for all bootstrap iterations b (b=1..250), then the CV (or relative standard error) for each pa is:
abaa ppCV )( ,σ= The mean weighted CV of all age classes (weighted by the proportions-at-age) is then:
∑∑∑ ==a
aa
aa
a ppCVpMWCV )(σ
To investigate the effect that the sampling error of the length samples has on the error estimate of the age composition, one can repeat the bootstrap procedure with the length samples only. So the length data will be re-sampled while the original age data is used to construct the Age-Length Key (ALK). Likewise, the effect of the sampling error of the age samples on the error estimate of the age composition can be investigated by using the original length data and re-sampling the age data for each bootstrap iteration. The choice of bootstrapping units can also reveal information on where the main sources of variability lie. One can use the observations on individual fish as bootstrapping units (for each iteration take a random sample with replication from the lengths and/or ages of individual fish). In this case, any variability between samples (in this case trips) is ignored. If trips are used as bootstrapping units (for each iteration take a random sample with replication from the available trips), the variability between trips is taken account of as well as variability between individuals. By comparing the two estimates of precision, one can evaluate the importance of the variability between trips. An overview of the bootstrap procedures and the error that is estimated from them is given in the table below.

EN 75 EN
Bootstrap procedure Estimated error Resample individual length observations Use original age data to construct ALK Length sampling error within trips Resample length frequency distributions by trip Use original age data to construct ALK
Length sampling error within and between trips
Use original length data Resample individual age observations Age sampling error within trips Use original length data Resample age samples by trip
Age sampling error within and between trips
Resample length frequency distributions by trip Resample age samples by trip
Length and age sampling error within and between trips
Sampling targets for individuals or trips If the main source of error is due to variability between individuals, it might be possible to set a target sample number of individuals in order to achieve a certain precision level. However, if the main source of variability is between trips, then targets should be set as the number of trips sampled. By comparing the sampling error within trips with the total sampling error (between and within), one can evaluate the relative importance of between-sample variability. Figure 1 shows both types of error estimates for the length samples as well as the age samples. The length sampling error between trips greatly under-estimates the total length sampling error for all species examined. This indicates that variability between trips is the main component of the uncertainty; variability between individuals only accounts for 10-20% of the total error. Therefore it is not possible to define precision targets for length samples in terms of the total number of fish measured. Instead the total number of trips sampled should be set as a target. For the age samples, the variability within samples generally accounts for at least half the total error. For cod, haddock and megrim, the MWCV estimated by re-sampling individual age observations under-estimates the total MWCV to a greater extent than species like plaice, horse mackerel and mackerel. This suggests that the age-length structure of cod varies more between trips than that of plaice. However, in general, it appears that the variability between individuals (within samples) accounts for a considerable proportion of the total error. Therefore it might be possible to set targets based on the number of individuals to be aged in order to achieve a certain precision level. However, these samples should obviously not all come from a small number of trips. Sampling targets Figure 2 shows that, for the length samples, precision level 2 (CV of 12.5%) is generally reached if samples from 40 or more trips were measured per year. This would indicate that a quarterly sampling target of 10 length samples would be reasonable. Figure 2 also indicates that it does not appear possible to achieve precision level 3 for age sampling without excessive cost. Precision level 3 was not reached in any of the historic samples. The precision improves rapidly up to around 1000-2000 individuals aged, after which the sample size only appears to have a minor effect on the precision level. Interaction between age and length samples The Data Collection Regulation specifies target precision levels for the length and age samples separately. However, the errors of the length and age samples interact to produce the total error in the age composition. By examining this interaction one can evaluate the relative importance of the sampling targets for age and length. Figure 3 shows the precision levels of the historic samples versus the sampling levels. The number of length samples and the
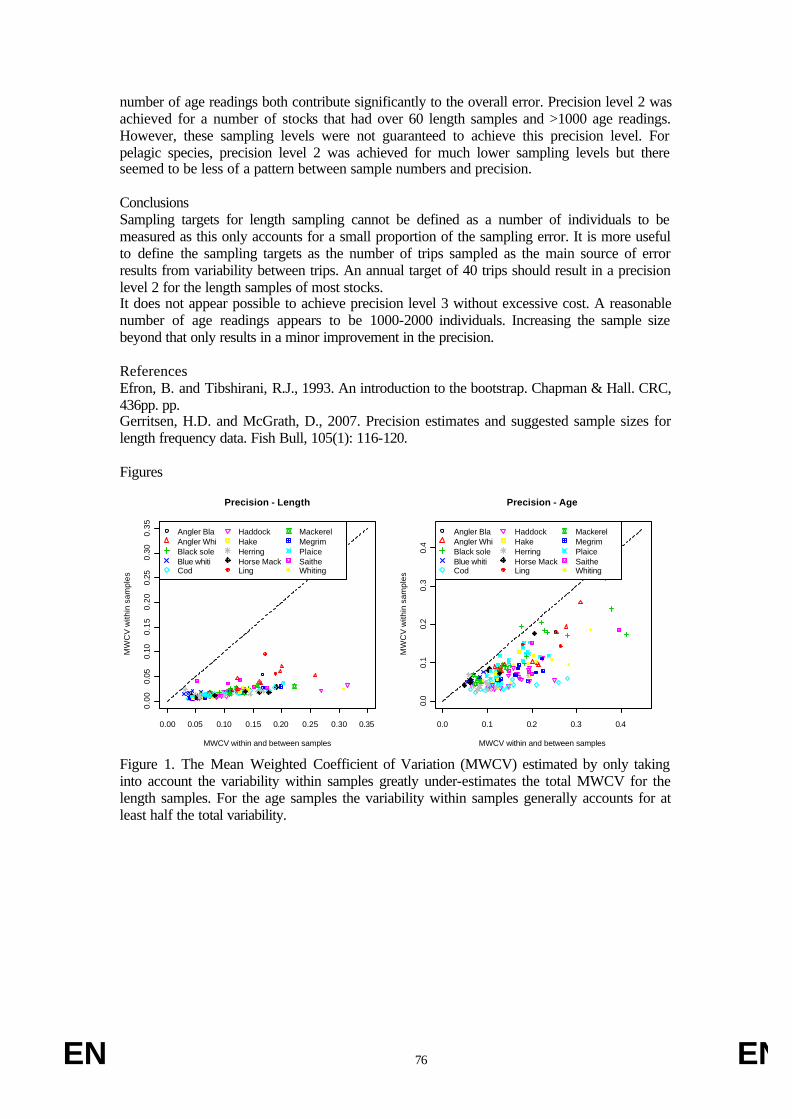
EN 76 EN
number of age readings both contribute significantly to the overall error. Precision level 2 was achieved for a number of stocks that had over 60 length samples and >1000 age readings. However, these sampling levels were not guaranteed to achieve this precision level. For pelagic species, precision level 2 was achieved for much lower sampling levels but there seemed to be less of a pattern between sample numbers and precision. Conclusions Sampling targets for length sampling cannot be defined as a number of individuals to be measured as this only accounts for a small proportion of the sampling error. It is more useful to define the sampling targets as the number of trips sampled as the main source of error results from variability between trips. An annual target of 40 trips should result in a precision level 2 for the length samples of most stocks. It does not appear possible to achieve precision level 3 without excessive cost. A reasonable number of age readings appears to be 1000-2000 individuals. Increasing the sample size beyond that only results in a minor improvement in the precision. References Efron, B. and Tibshirani, R.J., 1993. An introduction to the bootstrap. Chapman & Hall. CRC, 436pp. pp. Gerritsen, H.D. and McGrath, D., 2007. Precision estimates and suggested sample sizes for length frequency data. Fish Bull, 105(1): 116-120. Figures
0.00 0.05 0.10 0.15 0.20 0.25 0.30 0.35
0.00
0.05
0.10
0.15
0.20
0.25
0.30
0.35
Precision - Length
MWCV within and between samples
MW
CV
with
in s
ampl
es
Angler BlaAngler WhiBlack soleBlue whitiCod
Haddock Hake Herring Horse MackLing
Mackerel Megrim Plaice Saithe Whiting
0.0 0.1 0.2 0.3 0.4
0.0
0.1
0.2
0.3
0.4
Precision - Age
MWCV within and between samples
MW
CV
with
in s
ampl
es
Angler BlaAngler WhiBlack soleBlue whitiCod
Haddock Hake Herring Horse MackLing
Mackerel Megrim Plaice Saithe Whiting
Figure 1. The Mean Weighted Coefficient of Variation (MWCV) estimated by only taking into account the variability within samples greatly under-estimates the total MWCV for the length samples. For the age samples the variability within samples generally accounts for at least half the total variability.
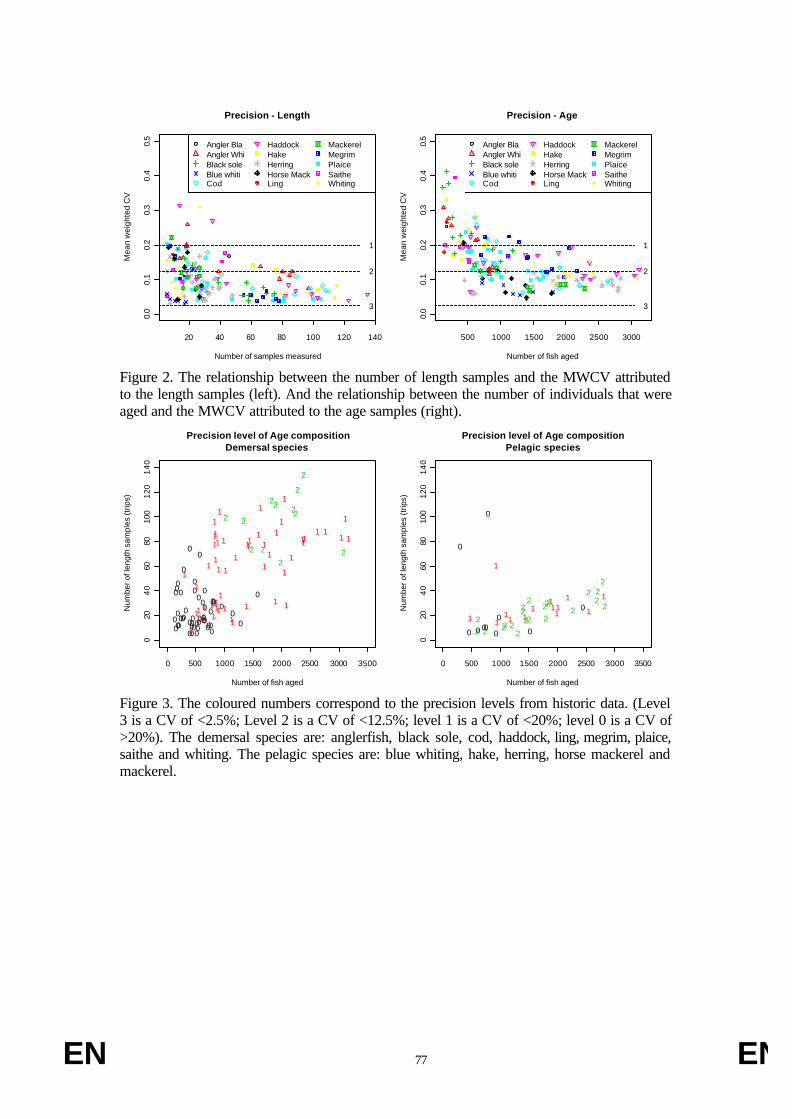
EN 77 EN
20 40 60 80 100 120 140
0.0
0.1
0.2
0.3
0.4
0.5
Precision - Length
Number of samples measured
Mea
n w
eigh
ted
CV
Angler BlaAngler WhiBlack soleBlue whitiCod
Haddock Hake Herring Horse MackLing
Mackerel Megrim Plaice Saithe Whiting
3
2
1
500 1000 1500 2000 2500 3000
0.0
0.1
0.2
0.3
0.4
0.5
Precision - Age
Number of fish aged
Mea
n w
eigh
ted
CV
Angler BlaAngler WhiBlack soleBlue whitiCod
Haddock Hake Herring Horse MackLing
Mackerel Megrim Plaice Saithe Whiting
3
2
1
Figure 2. The relationship between the number of length samples and the MWCV attributed to the length samples (left). And the relationship between the number of individuals that were aged and the MWCV attributed to the age samples (right).
0 500 1000 1500 2000 2500 3000 3500
020
40
6080
100
120
14
0
Precision level of Age compositionDemersal species
Number of fish aged
Num
ber o
f len
gth
sam
ples
(trip
s)
1
10
1
0
0
1
0
1
01
1
0
1
0
1
0
1
00
2
10
1
0
1
0
0
2
0
0
0
0
1
0
1
0
1
1
1
1
11
1
1
2
0
0
2
0
0
2
0
10
10
1
10
1
00 0
1
11
1
0
0
0
1
0
0
1
1
0
1
1
10
2
0
1
0
1
1
1
1
0
1
0
0
1
2
0
2
1
1
1
1
0
1
0
0 1
2
1
2
1
0
2
0
2
0 500 1000 1500 2000 2500 3000 3500
020
40
6080
100
120
14
0
Precision level of Age compositionPelagic species
Number of fish aged
Num
ber o
f len
gth
sam
ples
(trip
s)
1 1
0
1
0
2
2
1
12
2
1
0
11
2
2
02
12 2
20
2
0 10
1
2 2
2
112
0
2
02
2
0
22
2
1
2
Figure 3. The coloured numbers correspond to the precision levels from historic data. (Level 3 is a CV of <2.5%; Level 2 is a CV of <12.5%; level 1 is a CV of <20%; level 0 is a CV of >20%). The demersal species are: anglerfish, black sole, cod, haddock, ling, megrim, plaice, saithe and whiting. The pelagic species are: blue whiting, hake, herring, horse mackerel and mackerel.
EN 78 EN
Annex 4 Sample numbers required to achieve target precision levels length-, weight-, sexratio - and maturity-at-age
Hans Gerritsen, Marine Institute, Galway, Ireland. The precision of parameters like length-, weight- sexratio- and maturity-at-age is not related to the number of age samples alone. The error due to the length samples and the error due to between-station variability in the parameters are also likely to play a significant role. Nevertheless, the precision generally does improve with increasing sample numbers as can be seen from bootstrapped precision estimates from stocks sampled on Q1 and Q4 groundfish surveys in waters around Ireland (Figure 1). Precision levels were estimated from the 2.5% and 97.5% quantiles of the bootstrapped estimates. Precision level 3 (a precision of plus or minus 5% for a 95% confidence level) can generally be achieved for length-at-age samples: 50-100 samples per age class usually result in a precision level of 5% or less (Figure 1). Weight-at-age is consistently estimated with lower precision than length-at-age and precision level 3 is rarely achieved, even at very high sample sizes. Maturity-at-age and the sexratio-at-age are generally estimated with lower precision still and it is unlikely that any of these parameters can be estimated with a precision level of 5% for all age classes at a reasonable cost. Nearly all species display similar patterns although monkfish and horse mackerel tend to have better precision levels than most other species while plaice tend to have worse precision levels for the same sample numbers. For all parameters (length, weight, sex and maturity) the precision improves rapidly with increasing sample size up to around 50 samples per age class while sample sizes of more than 100 per age class rarely result in greatly improved precision. A target of 100 individuals per age class is in line with the target for estimating ecosystem indicator 4 in appendix XIII of Commision Regulation 199/2008/EC. Therefore, a minimum of 100 samples per age class might be advisable, even if precision level 3 is not achievable for all parameters and all age classes.. At the time of sampling, the age of the fish is unknown. Therefore, historic age compositions of the catch are needed to predict the required overall sample size. These age compositions are quite variable between years and areas but, in general, higher sample numbers would be needed for long-lived species than for short-lived species. The table below gives an indication of the overall sample numbers required to achieve at least 100 samples in all age classes for which sampling is required (age classes accounting for at least 90% of the catch). In conclusion: it is possible to give some guidance on the sample size required to achieve pre-defined precision levels but it is not cost-effective to attempt to achieve level 3 precision for all age classes for all parameters.

EN 79 EN
0 100 200 300 400 500
010
2030
4050
Length-at-age
Sample numbers per age class
Pre
cisi
on le
vel (
%)
3
2
1
CODDGSHADHERHKEHOM
LINMACMEGMONPLEPOK
SOLWAFWHBWHG
0 100 200 300 400 500
010
2030
4050
Weight-at-age
Sample numbers per age class
Pre
cisi
on le
vel (
%)
3
2
1
0 100 200 300 400 500
010
2030
4050
Sexratio-at-age
Sample numbers per age class
Pre
cisi
on le
vel (
%)
3
2
1
0 100 200 300 400 500
010
2030
4050
Matuirty-at-age
Sample numbers per age class
Pre
cisi
on le
vel (
%)
3
2
1
Figure 1. The estimated precision level by age class (95% confidence limits as a proportion of the parameter estimate) achieved for a variety of stocks sampled on Q1 and Q4 groundfish surveys around Ireland. The dashed lines indicate precision levels 1, 2 and 3. Maturity estimates were only available from the Q1 surveys. COD=cod, DGS=spurdog, HAD=haddock, HER=herring, HKE=hake, HOM=horse mackerel, LIN=ling, MEG=megrim, MON=white monkfish, PLE=plaice, POK=saithe, SOL=black sole, WAF=black anglerfish; WHB=blue whiting, WHG=whiting. Table 1. The average number of individuals that need to be sampled in order to achive at least 100 samples per age class
Species
Target sample total number to reach 100 samples per age class
Whiting 360 Haddock 370 Blue whiting 490 Cod 560 Megrim 890 Plaice 960 Monkfish 1290 Black sole 1920 Horse mackerel 2940

EN 80 EN
Annex 5 Irish Deepwater Survey (Pilot Survey)
ICES were asked by the EU to create a planning group to review existing deepwater surveys in the Northeast Atlantic , and to look at incorporating those surveys into a single coordinated NEA slope survey. This group, PGNEACS, the Planning Group for Northeast Atlantic Continental Slope Survey, met in January 2008. Following the review the group proposed a single coordinated survey from Area VI, west of Scotland, to Area VII, Bay of Biscay, by Ireland, Scotland and France. Portugal would provide abundance data from a longline survey in Area IXa. The Irish deepwater survey therefore meets all the criteria needed for inclusion in the DCR and to avail of funding. The surveys are internationally coordinated, the data will provide abundance indices for commercial deepwater stocks, and the data is internationally available. This data will be hosted on the DATRAS database.
Irish Deepwater Survey Aim: The aim of the survey is to collect abundance indices and biological data on the deepwater and slope fishery in Sub Areas VI and VII (Figure 1). Ireland ran deepwater surveys in sub-area VI and VII from 2006-2008. In each of these years there was co-ordination with the Scottish deepwater survey, and an overlap of coverage with in Area VI so that each country’s vessels could intercalibrate. This intercalibration scheme has ended. The Planning Group on North-East Atlantic Continental Slope Surveys (PGNEACS) now co-ordinates deepwater surveys in the ICES area. It is expected that internationally co-ordinated surveys between Scotland, Ireland, Norway, France and possibly Spain and Portugal will begin in 2011. It has been recommended that the Irish survey move southwards to ensure greater coverage of the slope area. This will require a pilot survey in 2009 to find clear towing areas, as safe areas are not known towards the southern end of sub-area VII, particularly in water >800m. Data Collection: Data will be collected to provide abundance indices for the main deepwater commercial species. Additional data will be collected to describe the deepwater ecosystem including the taxonomic analysis of other species and the collection of environmental parameters. Fishing will be undertaken by demersal trawling on depth transects across the continental slope and protocols are in agreement with the methods used on the UK deepwater survey. Data Storage: Irish survey data are held on Microsoft Access databases and are reported to the ICES working group on deepwater ecosystems (WGDEC), the working group on elasmobranch fishes (WGEF), and the working group on the assessment of deepwater fish (WGDEEP). PGNEACS has recommended the data be stored on the DATRAS database, and ICES has provisionally agreed to this.

EN 81 EN
Figure1 Irish Deepwater Survey Proposed survey Stations
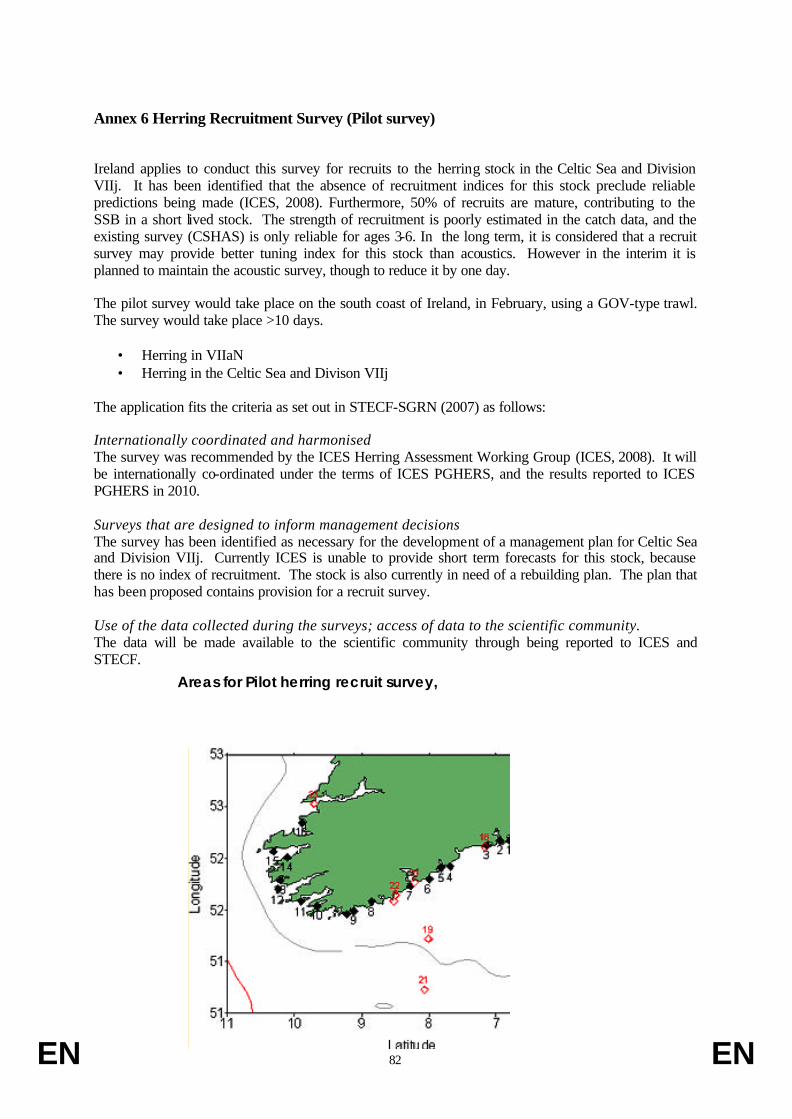
EN 82 EN
Annex 6 Herring Recruitment Survey (Pilot survey) Ireland applies to conduct this survey for recruits to the herring stock in the Celtic Sea and Division VIIj. It has been identified that the absence of recruitment indices for this stock preclude reliable predictions being made (ICES, 2008). Furthermore, 50% of recruits are mature, contributing to the SSB in a short lived stock. The strength of recruitment is poorly estimated in the catch data, and the existing survey (CSHAS) is only reliable for ages 3-6. In the long term, it is considered that a recruit survey may provide better tuning index for this stock than acoustics. However in the interim it is planned to maintain the acoustic survey, though to reduce it by one day. The pilot survey would take place on the south coast of Ireland, in February, using a GOV-type trawl. The survey would take place >10 days.
• Herring in VIIaN • Herring in the Celtic Sea and Divison VIIj
The application fits the criteria as set out in STECF-SGRN (2007) as follows: Internationally coordinated and harmonised The survey was recommended by the ICES Herring Assessment Working Group (ICES, 2008). It will be internationally co-ordinated under the terms of ICES PGHERS, and the results reported to ICES PGHERS in 2010. Surveys that are designed to inform management decisions The survey has been identified as necessary for the development of a management plan for Celtic Sea and Division VIIj. Currently ICES is unable to provide short term forecasts for this stock, because there is no index of recruitment. The stock is also currently in need of a rebuilding plan. The plan that has been proposed contains provision for a recruit survey. Use of the data collected during the surveys; access of data to the scientific community. The data will be made available to the scientific community through being reported to ICES and STECF.
Areas for Pilot herring recruit survey,
References

EN 83 EN
ICES, 2007. Report of the herring assessment working group for the area south of 62oN. ICES CM 2008/ACOM:02. 601 pp. STECF-SGRN, 2007. STECF Sub-group on Research Needs (SGRN). Review of list of surveys at sea (Appendix XIV of EU Commission Regulation N°1581/2004) with their priorities. Commission Staff Working Paper 2007:01. 25 pp.

EN 84 EN
XIII. Figures
Figure 1. IGFS map of proposed stations
-6°
-6°
-8°
-8°
-10°
-10°
-12°
-12°
56° 56°
54° 54°
52° 52°
Legend
IGFS 2007

EN 85 EN
Figure 2. Cruise track extension. Blue whiting acoustic survey 2009/2010.
-20 -19 -18 -17 -16 -15 -14 -13 -12 -11 -10 -9 -8 -7 -6 -5 -4 -3 -2 -1 0
Longitude
51
51.5
52
52.5
53
53.5
54
54.5
55
55.5
56
56.5
57
57.5
58
58.5
59
59.5
60
60.5
61
61.5
62
Latit
ude
Depth contours 200-1000m
Figure 3 Cruise track extension. Spawning Herring Acoustic Survey 2009/2010
-12 -11 -10 -9 -8 -7 -6
Longitude
50.5
51.5
52.5
Lati
tude
Total survey track = 3,159nmi
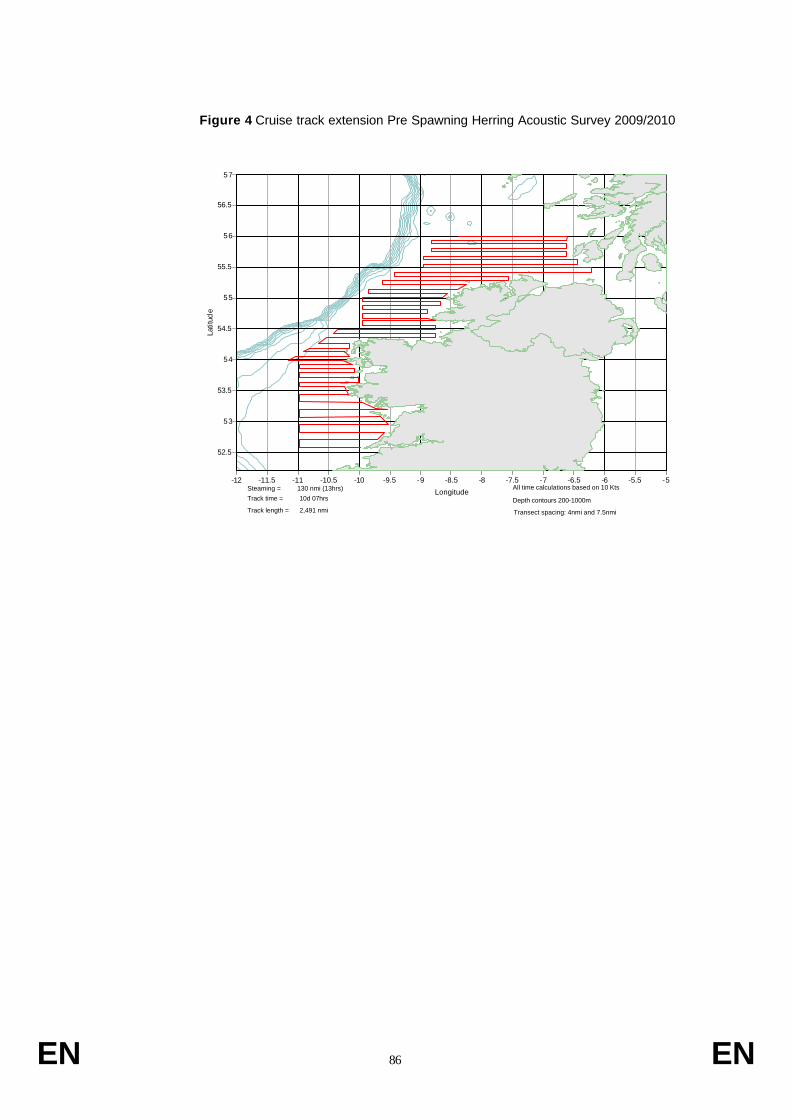
EN 86 EN
Figure 4 Cruise track extension Pre Spawning Herring Acoustic Survey 2009/2010
Transect spacing: 4nmi and 7.5nmiTrack length = 2,491 nmi
Track time = 10d 07hrs
Steaming = 130 nmi (13hrs) All time calculations based on 10 Kts
Depth contours 200-1000m
-12 -11.5 -11 -10.5 -10 -9.5 -9 -8.5 -8 -7.5 -7 -6.5 -6 -5.5 -5
Longitude
52.5
53
53.5
54
54.5
55
55.5
56
56.5
57
Latit
ude

EN 87 EN
Fiqure 5. International Mackerel and Horse Mackerel Egg Survey 2010 ( Proposed stations for whole survey Irelands involvement will be decided at WGMEGS 2009)
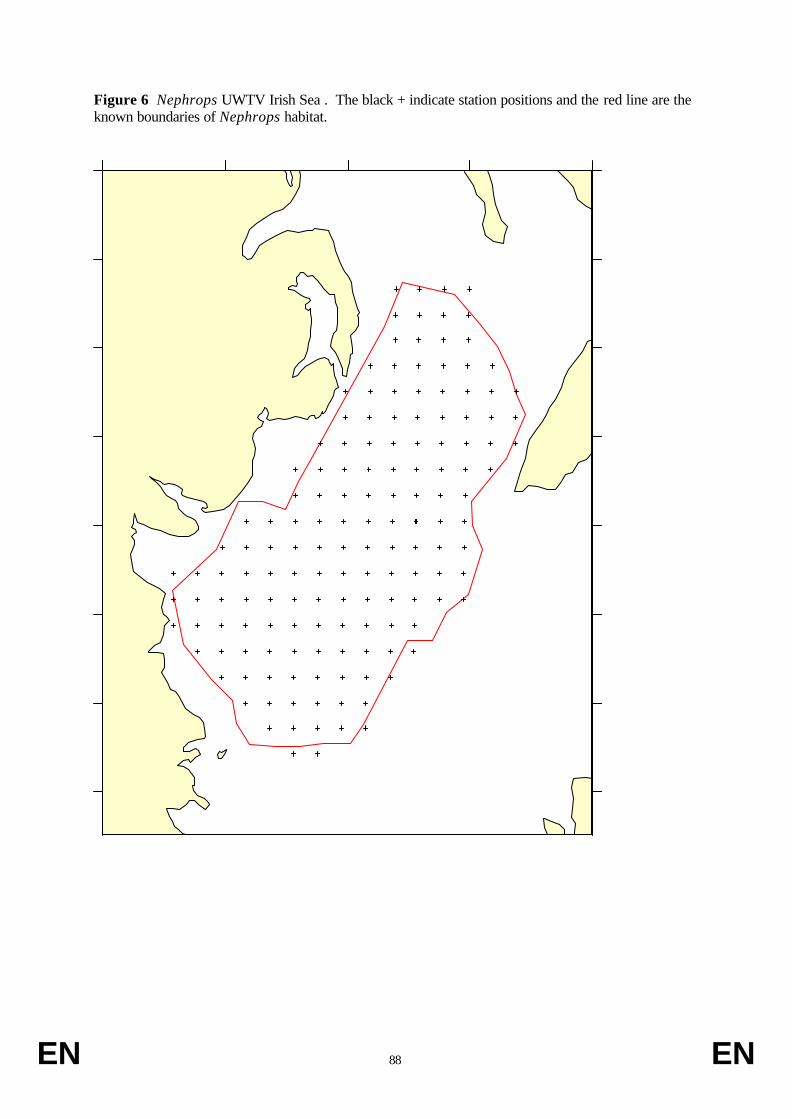
EN 88 EN
Figure 6 Nephrops UWTV Irish Sea . The black + indicate station positions and the red line are the known boundaries of Nephrops habitat.

EN 89 EN
Figure 7. Nephrops UWTV Aran Grounds. The black + indicate station positions and the red line are the known boundaries of Nephrops habitat.
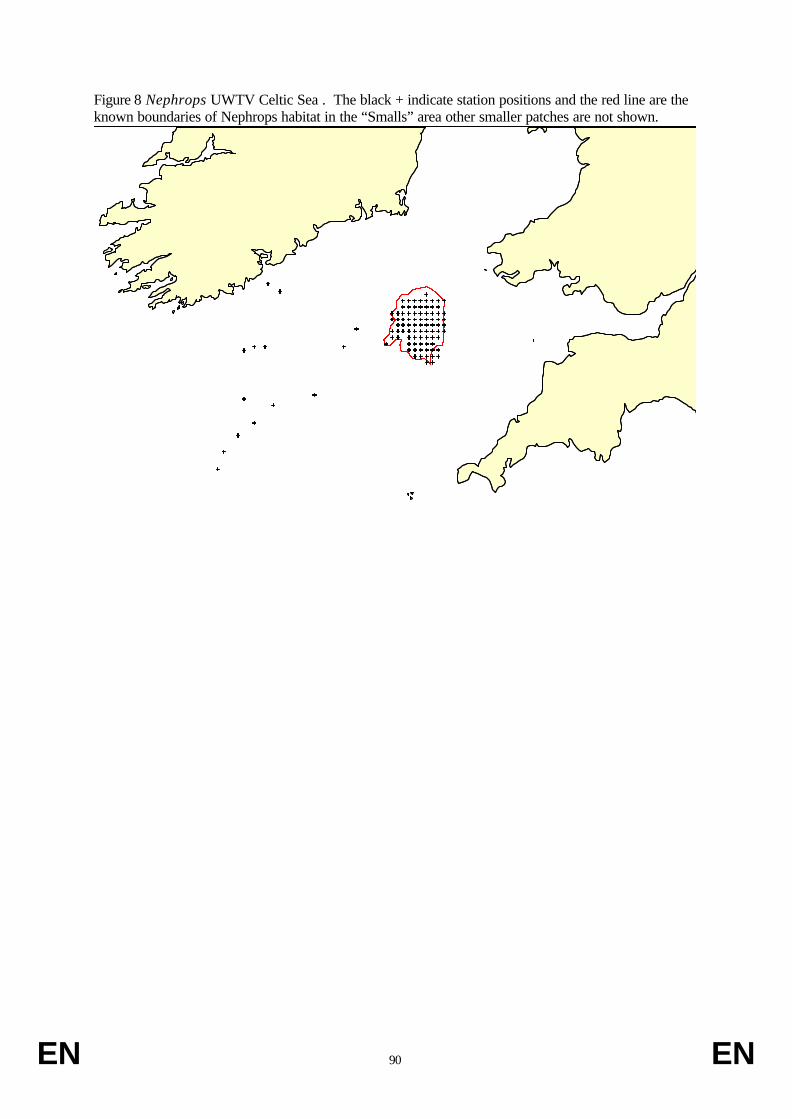
EN 90 EN
Figure 8 Nephrops UWTV Celtic Sea . The black + indicate station positions and the red line are the known boundaries of Nephrops habitat in the “Smalls” area other smaller patches are not shown.

EN 91 EN