Embed Size (px)
Citation preview
Howard High’sSTEM FAIR PROJECT GUIDELINES
All students in Biology GT and Chemistry GT classes at Howard High are required to complete a STEM Fair Project in hopes that it will challenge each student to use the scientific method to design, investigate, implement, and evaluate a real-world science application. Participating in a STEM Fair Project should help you put into practice some of the science and math that you have previously learned. It should also help you learn much more about a science topic that you are interested in. At the completion of this project, you will have the opportunity to communicate what you have learned through participation in the annual Howard High School STEM Fair. Below are guidelines that you should pay close attention to during the process of completing your STEM Fair Project.
ORIGINALITY: You are expected to DESIGN your own experiment. You are permitted to utilize various resources to generate ideas, but are not permitted to copy any project found on a website or completed previously by you or another student (i.e. friend or sibling). You may work on an extension of a project that you have previously completed, however it is expected that you would bring in the previous project to discuss the extension with your teacher. You should be familiar with all HCPSS policies and consequences in regards to properly citing references and plagiarism.
DOCUMENTATION: You will be expected to document all aspects of your project by keeping all relevant materials in a STEM Fair Folder. Information on how to properly maintain a project folder can be found on page 4. You are also required to TAKE PICTURES of yourself physically completing the project. These pictures can be stored in the folder and used for creating visual evidence on the final display board.
PARTNERS: You may work with a partner, however you must make the decision carefully (you need to consider if you will be able to work with this individual over the summer). If you choose to complete a partner project you must complete a project that studies two independent variables instead of just one. Each student in the pair will submit his/her own assignment, and will be expected to maintain his/her own lab folder.
MATERIALS & EQUIPMENT: The science department will not be able to provide materials or equipment for students to complete STEM projects. Please take this into consideration when selecting a topic and planning the experimental design.
MENTORS: Since you will have the summer to complete data collection, you may want to consider working with a mentor from a local scientific organization. If you do decide to work with a mentor, you will have to properly document the role of the mentor and the time you spent with them. Your teacher will provide you with more information.
SAFETY: Projects involving ANY safety hazards must be supervised by a QUALIFIED adult sponsor and you must follow ALL International Science and Engineering Fair (ISEF) rules. ISEF is the organization that regulates high school science fair projects and you can learn more about their established rules by going to:
http://www.sciserv.org/isef/about/rules_regulations.asp.
Safety hazards include, but are not limited to, hazardous chemicals or controlled substances, working with vertebrates, culturing bacteria, and using human or animal tissue. A project will not be approved if it seems like it will not be conducted in a safe manner.
1
SUBMITTING ASSIGNMENTSYou will be expected to complete and submit sections of your project at specified points throughout the process to make sure that you are on the proper track in completing the project. For each section, you will be given resource information on how to complete the section and a rubric on how it will be evaluated. All work done in completion of this project will be kept in a lab folder (see the next page for information on how to maintain a lab folder). Your teacher will inform you of the due dates for each section in a timely manner. If the assignment is submitted late, 10% of the grade will be deducted each day it is late.
You will receive feedback on each assignment from your teacher. Failure to meet the requirements for each section will prevent you from moving on to the next section. You will be expected to make the suggested corrections and resubmit the assignment until the requirements are met.
Listed below are the stages of the STEM Fair Project that must be completed in order:
STAGE 1: Topic SelectionSTAGE 2: Background ResearchSTAGE 3: IntroductionSTAGE 4: Experimental DesignSTAGE 5: Collection and Analysis of DataSTAGE 6: ConclusionsSTAGE 7: Summarizing Experiment (Abstract)STAGE 8: Presentation of Project
MAINTAINING A LAB FOLDER
You will maintain a lab folder to document every aspect of this project. It is a detailed account of EVERY PHASE OF YOUR PROJECT, from the initial brainstorming to the final research report.
Here are a few pointers that are easy to follow and should help keep you organized.
1. You will be provided with a two-pocket folder with fasteners. 2. Label your folder with your name, teacher’s name, period, and email address in a prominent location.3. Make all entries in pen. Use a black, or blue, non-erasable ink pen.4. You will be provided with a project checklist. This will be the first item in your folder and will act as
a table of contents.5. Number the pages in your folder in the upper right corner as you use them or insert pages.6. Always DATE every entry, just like a journal. Entries should be brief and concise.7. Insert any worksheets or assignments in the proper order (by date of completion). This includes
assignments/rubrics that have been turned in and returned with feedback, notes, reflections, etc.8. Any mistakes made should be CROSSED OUT with a single line, not erased or whited-out.9. Always include any changes made to procedures, mishaps, failures, or mistakes.10. Include ANY and ALL observations made during your experiment. In other words, record ALL data
directly into your folder.
2
STAGE 1: TOPIC SELECTIONDUE DATE:
SELECTING A HIGH SCHOOL LEVEL PROJECTThe STEM Fair is different at the high school level from what you may have experienced in middle school. You are now asked to investigate a phenomenon using a more sophisticated approach – you conduct research as an actual scientist might. This means trying to understand the underlying “why” for a question you are trying to answer rather than just finding out “if” the answer to a question is true.
For example, in middle school you may have asked “which laundry detergent works best?” You could still be interested in the same area of science, but now you need to take this to a more specific level. This means trying to understand what causes the effect you observed, and you’ll probably need to be more specific in your investigation. Appropriate questions for a high school project are “how does the concentration of enzymes affect the ability of a laundry detergent to remove an organic stain,” or “how does the phosphate concentration of a laundry detergent affect permeability of natural cotton material?” In both cases you are looking at the chemistry of laundry detergent, and in both cases you are looking for a measurable correlation between two variables.
These correlations are a key ingredient in doing “real science” because they give you predictive power. If you simply test, for example, two vacuum cleaners and find that one is better, you can say nothing about the next model that comes along. If, however, you do a careful study of brush size or horsepower versus cleaning ability, then you can predict which other vacuum cleaners will do well. This predictive power is a key element in an acceptable scientific hypothesis.
Students must also take into consideration what type of data will be collected. Data collected in a high school level project should be quantitative (measurable) and not subjective. This means that you will be expected to employ mathematical methods for data analysis. This includes producing and interpreting computer-generated charts and graphs, and determining if your results are statistically valid for the experiment you have done. You are also expected to do a very detailed error analysis to describe possible systematic, measurement, or random errors that affect the results of your experiment. Both of these topics are discussed in this packet and may be addressed in class.
For a look at samples of appropriate high school level science fair projects, go to http://www.sciencebuddies.org/science-fair-projects/competitions_index.shtml
BRAINSTORMINGAfter the table of contents, this should be the first section of your folder. Make sure to write down any and ALL thoughts that you have as they come to you and include any worksheets you may have filled out.
Wondering where to begin? Start by simply observing the world around you. The best topics are sparked by curiosity. The more compelling you find your topic, the more engaged you will be for the duration of the project. It would also be helpful to read about the latest trends and discoveries in the Science and Technology sections of the newspaper.
When it comes to brainstorming your topic, start big, then narrow it down. Remember, your topic must be narrow enough to be testable and measurable. It also must be manageable and capable of being mastered in a relatively short period of time. When you start brainstorming, come up with a list of questions about things
3
you’ve always wondered about, or things you’re suddenly curious about. Then do some preliminary research to refine your questions. Give your questions the “Three-Minute Test” and seriously think about them. Can you think of some way to get an answer? Would it be an experiment that you can actually do? After the three minutes, do you feel bored? Frustrated? Then go back to your preliminary research and think of another question. Or, are you excited? Ready to do what needs to be done? Barely even noticed three minutes went by? Then you probably have a good question!
Unoriginal topics will not receive a grade better than a “C.” Examples include: How do different substances affect the growth of plants? How do different colors of light affect the growth of plants? How is popcorn popping affected by brand, temperature, etc.? The effect of music on memory. The effect of temperature on plastic wrap. Which battery works best?
For additional brainstorming help go to www.sciencebuddies.org/science-fair-projects/project_ideas.shtmland complete the provided ‘Topic Wizard’ survey to get you started in finding a topic and question of study.
TYPICAL STEM FAIR CATEGORIESYou might find it helpful to start the brainstorming process if you have an idea of some general STEM Fair areas. The following are the categories in which projects will be placed at the STEM Fair:Animal Biology Behavioral & Social Sciences Microbiology Plant Biology ChemistryEarth and Space Science Computer Science Technology Environmental Science Mathematics Physics
THINGS TO CONSIDER
Howard High School is NOT permitted to distribute any materials or equipment to students. There are many online resources to students looking to purchase necessary materials. For example:
www.sciencebuddies.org/science-fair-projects/project_supplies.shtmlwww.teachersource.comwww.stevespanglerscience.comwww.kelvin.comwww.scientificsonline.comwww.amazon.com
Remember that you will need enough materials to run 10 trials
Students are not permitted to disrupt class time to collect data. If you need a sample of students to conduct your data collection, it should be done outside of class time.
SUBMITTING YOUR PROPOSALYou will fill out the topic proposal form given to you by your teacher. Please make sure to thoroughly read over it and fill it out completely. Your teacher will either approve your topic and allow you to move on, or will return the form back to you with comments and ask you to resubmit it. Until your teacher approves your topic, you will not be allowed to move on to the next stage of the project.
4
STAGE 2: Background researchDUE DATE:
CONDUCTING BACKGROUND RESEARCHResearch notes are an important part of an investigation, and will help you stay focused. Research should be done continuously throughout the project, even at the end when drawing conclusions. Background research is important because it should:
1. Explain relevant concepts related to the project and previous studies on the topic.2. Help students to create an appropriate and technically correct experimental technique.3. Allow students to generate enough background knowledge to generate a hypothesis.4. Provide information that students will use to write an introduction section for the research paper.5. Allow students to explain results obtained from experimentation.
When conducting background research, you must be thorough and should consider finding information on the following aspects of the topic:
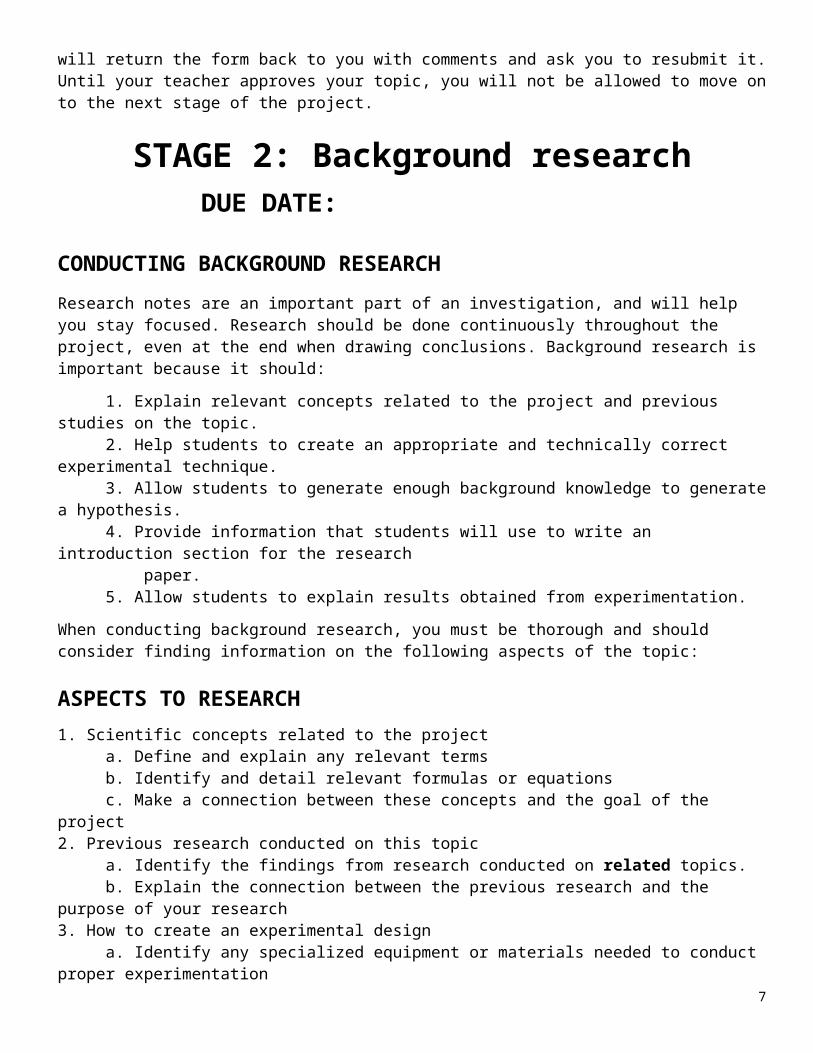
ASPECTS TO RESEARCH1. Scientific concepts related to the project a. Define and explain any relevant terms b. Identify and detail relevant formulas or equations c. Make a connection between these concepts and the goal of the project2. Previous research conducted on this topic a. Identify the findings from research conducted on related topics. b. Explain the connection between the previous research and the purpose of your research3. How to create an experimental design a. Identify any specialized equipment or materials needed to conduct proper experimentation b. Explain any techniques used to carry out the experiment and for gathering data.
FINDING AND EVALUATING PROPER SOURCES FOR RESEARCHYou must use reliable, relevant sources to collect background research. Scientific journals (peer reviewed) and journal databases are considered the BEST resource for background research.
You may also use websites whose authorship is clearly evident and whose authors are considered experts in the field. Websites with domains .org, .gov, and .edu are usually reliable sources. Wiki’s (such as Wikipedia) and Blogs are NEVER considered reliable, nor are sites such as yahoo answers, eHow, liveSTRONG, or sparknotes. Resources should also come from recent publications (within the past year or two).
For this project, students must use at least FOUR DIFFERENT RESOURCES. At least one MUST be from an ACADEMIC (peer-reviewed) JOURNAL, and at least one MUST be from a SCIENTIFIC JOURNAL (articles will present an experiment following the same scientific method format – abstract, introduction , experimental design, data, conclusion, etc. ).
5
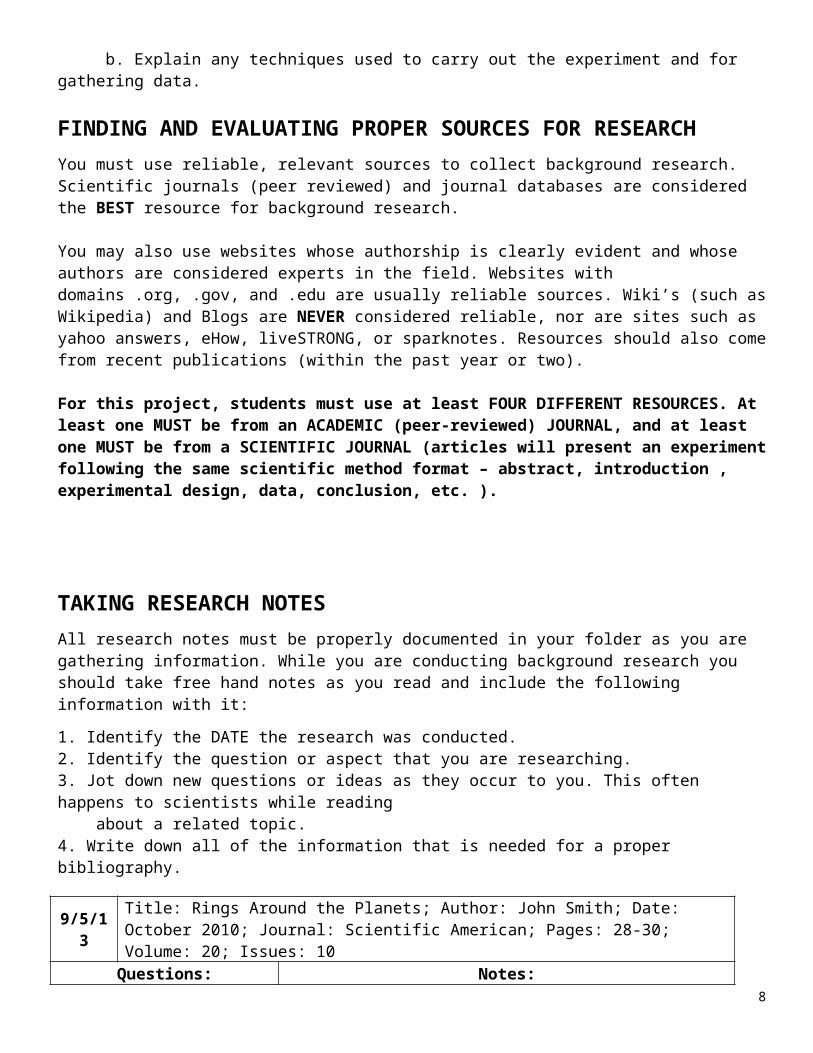
TAKING RESEARCH NOTES All research notes must be properly documented in your folder as you are gathering information. While you are conducting background research you should take free hand notes as you read and include the following information with it:
1. Identify the DATE the research was conducted.2. Identify the question or aspect that you are researching.3. Jot down new questions or ideas as they occur to you. This often happens to scientists while reading about a related topic. 4. Write down all of the information that is needed for a proper bibliography.
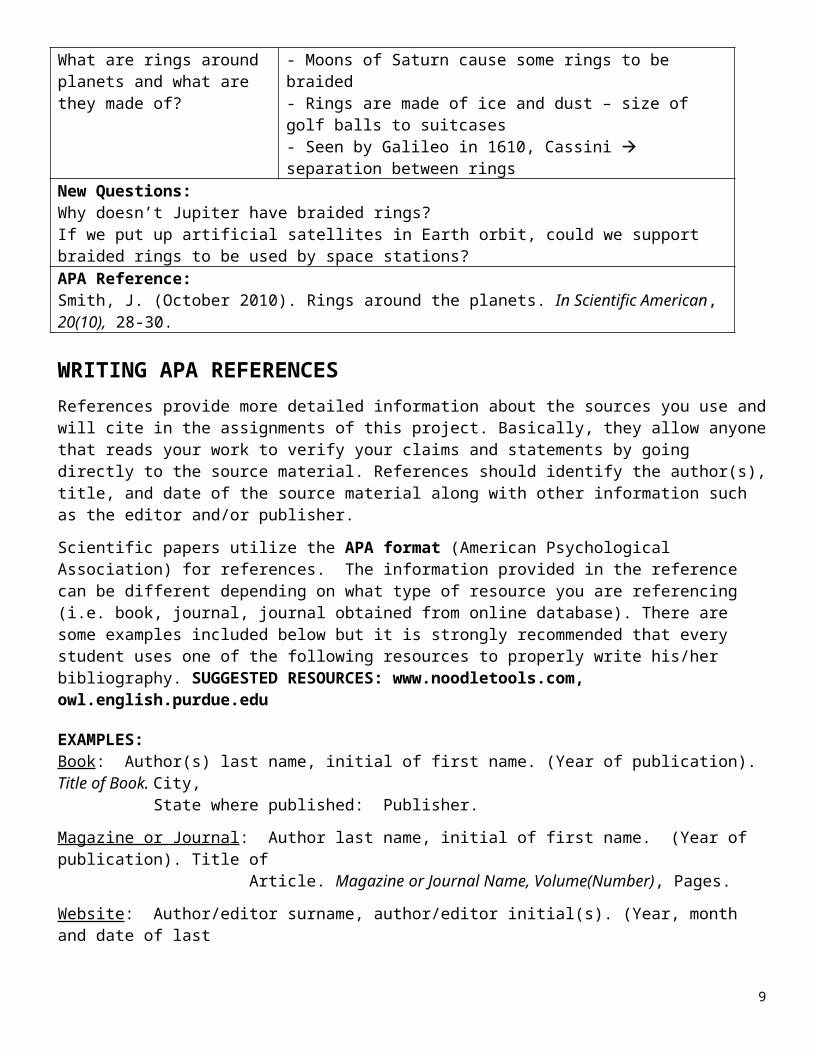
9/5/13 Title: Rings Around the Planets; Author: John Smith; Date: October 2010; Journal: Scientific American; Pages: 28-30; Volume: 20; Issues: 10Questions:
What are rings around planets and what are they made of?
Notes:- Moons of Saturn cause some rings to be braided- Rings are made of ice and dust – size of golf balls to suitcases- Seen by Galileo in 1610, Cassini separation between rings
New Questions:Why doesn’t Jupiter have braided rings?If we put up artificial satellites in Earth orbit, could we support braided rings to be used by space stations?APA Reference:Smith, J. (October 2010). Rings around the planets. In Scientific American, 20(10), 28-30.
WRITING APA REFERENCESReferences provide more detailed information about the sources you use and will cite in the assignments of this project. Basically, they allow anyone that reads your work to verify your claims and statements by going directly to the source material. References should identify the author(s), title, and date of the source material along with other information such as the editor and/or publisher.
Scientific papers utilize the APA format (American Psychological Association) for references. The information provided in the reference can be different depending on what type of resource you are referencing (i.e. book, journal, journal obtained from online database). There are some examples included below but it is strongly recommended that every student uses one of the following resources to properly write his/her bibliography. SUGGESTED RESOURCES: www.noodletools.com, owl.english.purdue.edu
EXAMPLES:Book: Author(s) last name, initial of first name. (Year of publication). Title of Book. City,
State where published: Publisher.
Magazine or Journal: Author last name, initial of first name. (Year of publication). Title of Article. Magazine or Journal Name, Volume(Number), Pages.
Website: Author/editor surname, author/editor initial(s). (Year, month and date of last update or copyright). Title of the page/document. Month, date and year of retrieval, and the URL.
Journal from Database: Author(s) last name, initial of first name. (Date of Publication). Title of Article.In Name of Journal, Volume, Issue, pages. Retrieved on (date of online retrieval) from (website).
6
NAME: _______________________________________ PERIOD: ______ DATE: _________________
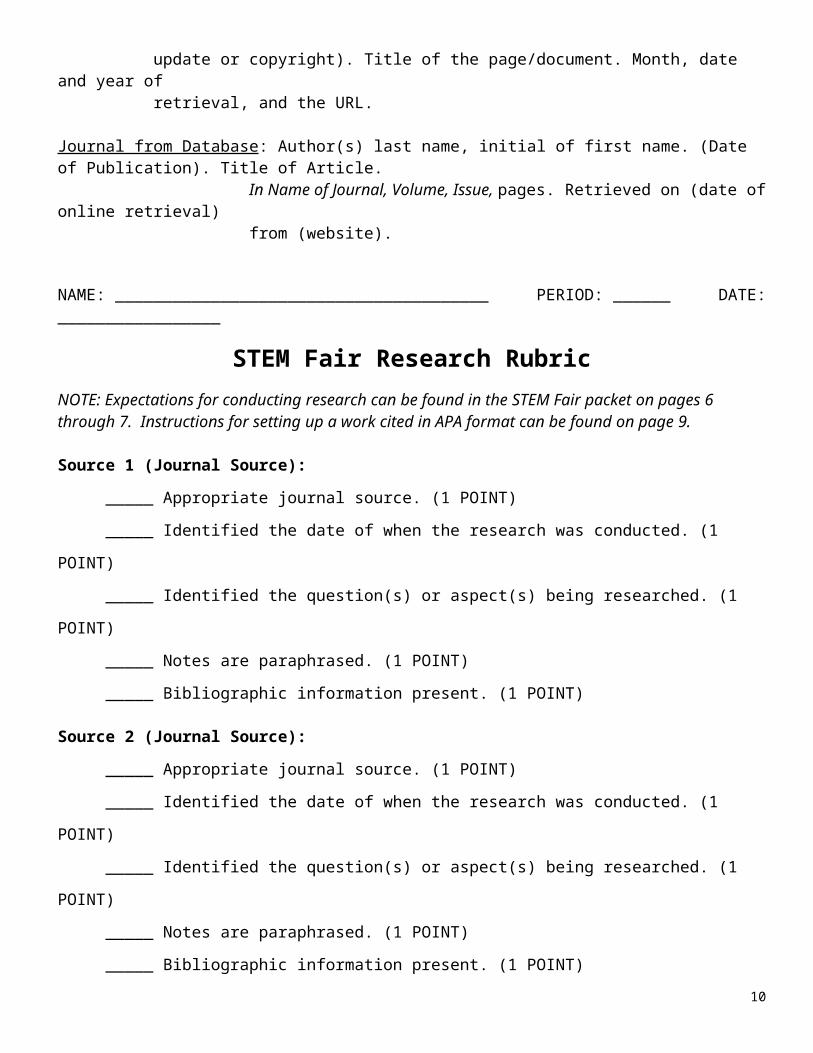
STEM Fair Research RubricNOTE: Expectations for conducting research can be found in the STEM Fair packet on pages 6 through 7. Instructions for setting up a work cited in APA format can be found on page 9.
Source 1 (Journal Source):
_____ Appropriate journal source. (1 POINT)
_____ Identified the date of when the research was conducted. (1 POINT)
_____ Identified the question(s) or aspect(s) being researched. (1 POINT)
_____ Notes are paraphrased. (1 POINT)
_____ Bibliographic information present. (1 POINT)
Source 2 (Journal Source):
_____ Appropriate journal source. (1 POINT)
_____ Identified the date of when the research was conducted. (1 POINT)
_____ Identified the question(s) or aspect(s) being researched. (1 POINT)
_____ Notes are paraphrased. (1 POINT)
_____ Bibliographic information present. (1 POINT)
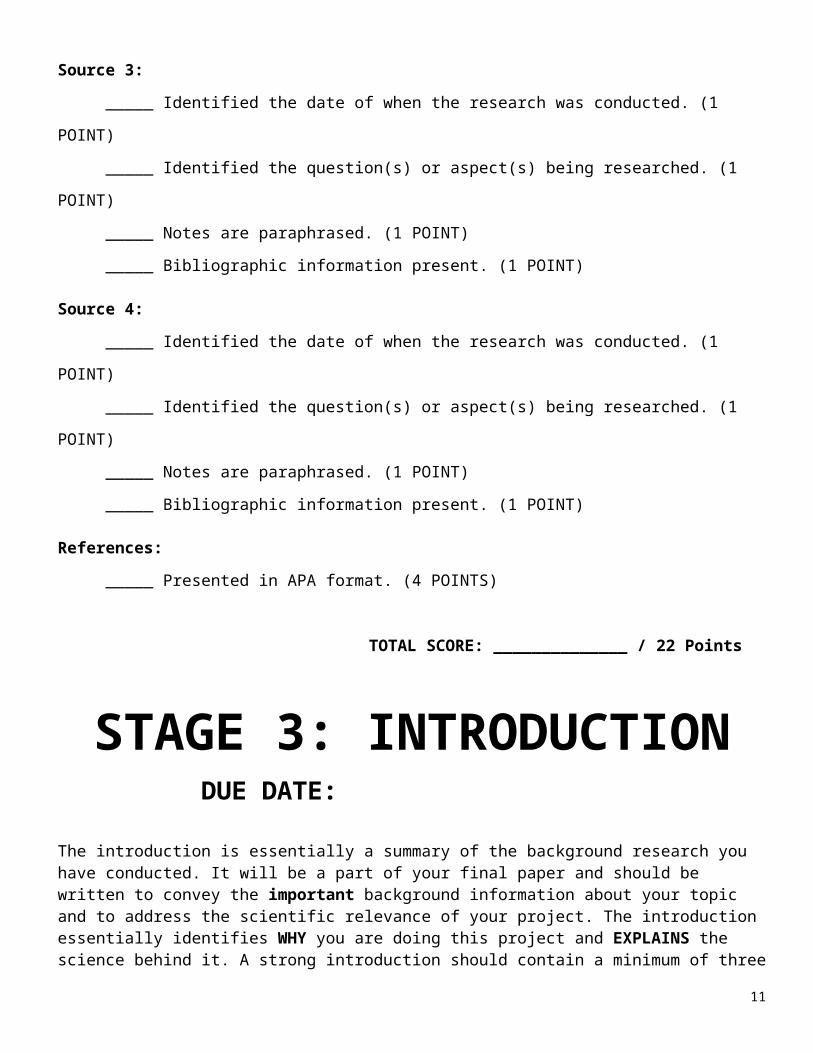
Source 3:
_____ Identified the date of when the research was conducted. (1 POINT)
_____ Identified the question(s) or aspect(s) being researched. (1 POINT)
_____ Notes are paraphrased. (1 POINT)
_____ Bibliographic information present. (1 POINT)
Source 4:
_____ Identified the date of when the research was conducted. (1 POINT)
_____ Identified the question(s) or aspect(s) being researched. (1 POINT)
_____ Notes are paraphrased. (1 POINT)
_____ Bibliographic information present. (1 POINT)
References:
_____ Presented in APA format. (4 POINTS)
TOTAL SCORE: ______________ / 22 Points
7
STAGE 3: INTRODUCTIONDUE DATE:
The introduction is essentially a summary of the background research you have conducted. It will be a part of your final paper and should be written to convey the important background information about your topic and to address the scientific relevance of your project. The introduction essentially identifies WHY you are doing this project and EXPLAINS the science behind it. A strong introduction should contain a minimum of three well-constructed paragraphs. The content of the paper should be organized in an “inverted pyramid” format, meaning that the information is presented in a way that starts off broad/general and becomes more specific.
PARAGRAPH #1The first paragraph is an introduction to the general topic that you are investigating. For example, if you are investigating the effect of candle dye on how fast a candle burns, your first paragraph should be about the science of candle making. You would explain how candles are made and what they are made of.
PARAGRAPH #2The second paragraph should address the specific factor (or independent variable) that you are investigating. For instance, if you are investigating the effect of wax dyes on how fast a candle burns, your second paragraph should explain how wax dyes are different from other dyes.
PARAGRAPH #3The third paragraph essentially identifies the scientific relevance of your project. You should identify what factor you believe will be most affected in your research (the dependent variable) and EXPLAIN the importance of this factor. For example, what is the importance of measuring how long it takes for a candle to burn? Typically, this paragraph concludes with the problem statement and hypothesis of your investigation.
MAKING A CLEAR PROBLEM STATEMENT After identifying a general topic to investigate, you must NARROW down your research to focus on a specific problem or question associated with that topic. Once you have identified the specific problem, you must write a statement of the problem that clearly identifies the factor that you believe is CAUSING the problem and also identifies the EFFECT it is having.
EXAMPLE: The purpose of this investigation is to determine the effect of various concentrations of indoleacetic acid (IAA) on the height of bean plants?
FORMING A HYPOTHESIS Your hypothesis is an educated guess of what you believe your experimental findings will be. It needs to explore the relationship between the factor that you are testing and the effect it has on topic you are investigating. A good hypothesis should make a measurable prediction regarding the outcome of your experiment. A strong hypothesis also justifies why you think your hypothesis might be true. Your background research should lend support to your hypothesis.
8
EXAMPLE: If radish plants are grown in a nutrient solution without soil, then they will grow taller than plants with soil because it is easier for the plant to take in the nutrients when there is no soil.
Remember that a well-written hypothesis uses the If….., then…..because…. format and should be clearly document in your folder.In order to complete each paragraph, you will use the background information that you collected in your previous research. You may find that you have to go back and complete some more research if you do not have enough information. In the process of writing the introduction, it is also important to consider what information is essential and what should be left out. Your introduction should include:
1. Definitions and explanations of all important scientific concepts, terms, and formulas related to the topic.
2. Discussions of previous research on related topics that support why more research is needed.
It is also important to recognize that this is a scientific based paper, not something that is being written for your English or History class. The introduction should only contain facts that can be supported by research. Any statements or claims that are made in your introduction must include support from the research you conducted (see In-Text Citation section). It must be written in a passive voice, meaning that you must remove all “I,” “me,” statements from your writing.
IN-TEXT CITATIONSSince you are most likely NOT considered an expert in the topic you are investigating, most of you will rely heavily on the research you gathered to complete the introduction. When you use information or statements from your research, you MUST give credit where credit is due, even if it is not word-for-word from the source material. Directly after using research information in the text of your paper, you must indicate the source of your information. This can be easily accomplished using the following technique in addition to a bibliography at the end of your paper.
(Author last name(s), Year of publication)
Be aware, failure to include proper in-text citations could be considered an act of plagiarism!
WORKS CITEDAt the end of your Introduction, you MUST include a works cited page. This is an APA Reference List of all of the resources that you used in your introduction. The list should include ONLY the resources that you utilize in your paper, listed in alphabetical order.
9
NAME: _______________________________________ PERIOD: ______ DATE: _____________
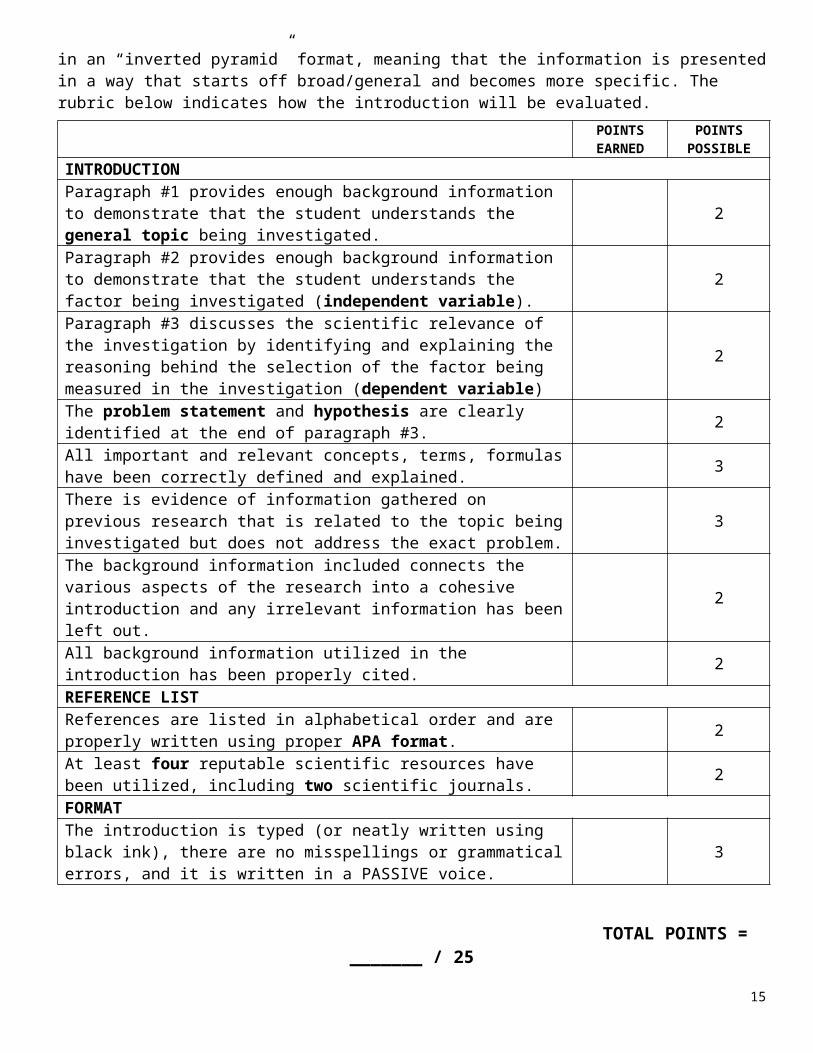
INTRODUCTION RUBRICThe introduction is essentially a summary of the background research you have conducted. It will be a part of your final paper and should be written to convey the important background information about your topic and to address the scientific relevance of your project. The introduction essentially identifies WHY you are doing this project and EXPLAINS the science behind it. A strong introduction should contain a minimum of three well-constructed paragraphs. The content of the paper should be organized in an “inverted pyramid” format, meaning that the information is presented in a way that starts off broad/general and becomes more specific. The rubric below indicates how the introduction will be evaluated.
POINTS EARNED
POINTS POSSIBLE
INTRODUCTIONParagraph #1 provides enough background information to demonstrate that the student understands the general topic being investigated. 2
Paragraph #2 provides enough background information to demonstrate that the student understands the factor being investigated (independent variable). 2
Paragraph #3 discusses the scientific relevance of the investigation by identifying and explaining the reasoning behind the selection of the factor being measured in the investigation (dependent variable)
2
The problem statement and hypothesis are clearly identified at the end of paragraph #3. 2
All important and relevant concepts, terms, formulas have been correctly defined and explained. 3
There is evidence of information gathered on previous research that is related to the topic being investigated but does not address the exact problem. 3
The background information included connects the various aspects of the research into a cohesive introduction and any irrelevant information has been left out.
2
All background information utilized in the introduction has been properly cited. 2
REFERENCE LISTReferences are listed in alphabetical order and are properly written using proper APA format. 2
At least four reputable scientific resources have been utilized, including two scientific journals. 2
FORMATThe introduction is typed (or neatly written using black ink), there are no misspellings or grammatical errors, and it is written in a PASSIVE voice. 3
TOTAL POINTS = _______ / 25
10
STAGE 4: EXPERIMENTAL DESIGN
DUE DATE:
DESIGNING AN EXPERIMENTNow that you have gathered sufficient background research, you need to start thinking about how you can conduct a valid scientific experiment. It is important that you think through the ENTIRE process from set-up to experimentation to data collection before you go too far into the process. Read through the following guidelines and make sure to document everything in your folder. RECOGNIZE THE VARIABLES
There are three kinds of variables that you must be aware of and account for in an experiment.
The INDEPENDENT VARIABLE is the factor that is changed by the scientist because it is the factor that they have identified as the factor that is causing the problem. It is important to have only ONE independent variable* in your experiment. (Students working in partners will design an experiment with TWO independent variables.)
The DEPENDENT VARIABLE is what will be measured in the experiment to see how it responds to the change made to the independent variable. For this project, you should select a dependent variable that can be quantitatively measured, that is you will have numerical data to represent the effect of the independent variable.
CONSTANT VARIABLES are all the other factors in the experiment that could possibly affect the outcome of the experiment. When designing an experiment with multiple testing groups, these are the variables that should be the SAME throughout all of the testing groups.
DESIGNING A VALID EXPERIMENT
Your procedure should indicate the presence of multiple TESTING GROUPS. The EXPERIMENTAL GROUP(S) consist of the trials where you apply and change the independent variable. For example, if your question asks whether fertilizer makes a plant grow bigger, then the experimental groups consist of all trials in which the plants receive fertilizer. In many experiments it is important to establish a testing group in which the independent variable IS NOT for comparison with the other groups. This group is referred to as a CONTROL GROUP. The control group consists of all those trials where you leave the independent variable in its natural state. In our example, it would be important to run some trials in which the plants get no fertilizer at all. These trials with no fertilizer provide a basis for comparison, and would insure that any changes you see when you add fertilizer are in fact caused by the fertilizer and not something else.
11
Your procedure should also include an appropriate LEVEL OF TREATMENT. The level of treatment is the extent to which you change your independent variable. For example, if you are testing the effects of magnesium concentration on radish growth, your levels of treatment might include no magnesium (0%), normal magnesium (100%), and double magnesium (200%). When selecting your levels of treatment however, consider that more extreme levels of treatment usually get more visible results, but less extreme levels of treatment usually simulate real-world conditions better.
Your procedure must also show evidence of REPLICATION, which is the number of times you repeat a specific procedure. This is important to insure that your experimental data is reliable and less subject to chance variation. In other words, you must verify that you obtain essentially the same results every time you repeat the experiment with the same value for your independent variable. This insures that the answer to your question is not just an accident. Each time that you perform your experiment is called a run or a trial. So, your experimental procedure should also specify how many trials you intend to run. Repeat your experiment a minimum of TEN times.
SUBMITTING YOUR EXPERIMENTAL DESIGNOnce you have taken all of these factors into consideration, you should begin writing a detailed experimental design plan that will explain how you will create a valid experiment to test your hypothesis. Your plan should include the following three sections.
SECTION 1: Explain how you will design a valid, controlled experiment.In paragraph format, you will explain how you have taken into account all of the factors addressed above to design a valid, controlled experiment. In this paragraph, you should:
1) Identify your independent and dependent variables.2) Describe your control group and identify what variables you will need to keep constant between all
of your testing groups. It is also important to discuss some variables that you will not be able to control throughout the experiment.
3) Discuss how your results will be validated through replication and how the appropriate levels of treatment will be applied.
SECTION 2: Materials ListWrite a materials list that not only identifies ALL of the items that you will need to complete the experiment but the EXACT amounts of those items that you will need. When writing out your materials list, remember that you always indicate the quantities and sizes in METRIC UNITS. For example, length is measured in meters, volume is measure in liters, mass is measured in grams, and temperature is measured in degrees Celcius.
SECTION 3: ProceduresWrite out detailed, numbered step-by-step instructions on how you will conduct your experiment. It is important that your procedure is clearly written in complete sentences and provides enough information so that anyone that reads it could reproduce the experiment. This includes indicating the proper size and amount of the materials that you will be using. You should also consider using diagrams and drawings as needed. It is also important to realize that your procedure may change during the experiment if you discover a better way to do something. Simply be sure to note all changes in your procedure.
12
NAME: ______________________________________ PERIOD: ______ DATE: ______________
EXPERIMENTAL DESIGN PLAN RUBRIC
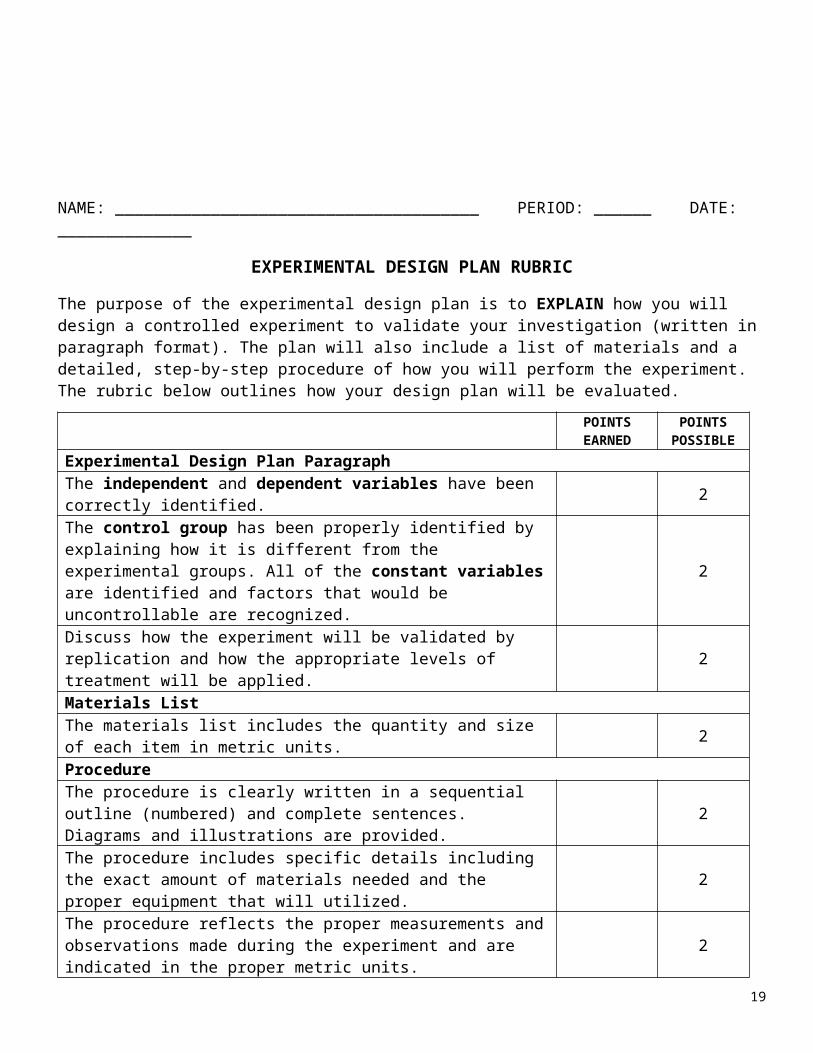
The purpose of the experimental design plan is to EXPLAIN how you will design a controlled experiment to validate your investigation (written in paragraph format). The plan will also include a list of materials and a detailed, step-by-step procedure of how you will perform the experiment. The rubric below outlines how your design plan will be evaluated.
POINTS EARNED
POINTS POSSIBLE
Experimental Design Plan Paragraph
The independent and dependent variables have been correctly identified. 2
The control group has been properly identified by explaining how it is different from the experimental groups. All of the constant variables are identified and factors that would be uncontrollable are recognized.
2
Discuss how the experiment will be validated by replication and how the appropriate levels of treatment will be applied. 2
Materials ListThe materials list includes the quantity and size of each item in metric units. 2
ProcedureThe procedure is clearly written in a sequential outline (numbered) and complete sentences. Diagrams and illustrations are provided. 2
The procedure includes specific details including the exact amount of materials needed and the proper equipment that will utilized. 2
The procedure reflects the proper measurements and observations made during the experiment and are indicated in the proper metric units. 2
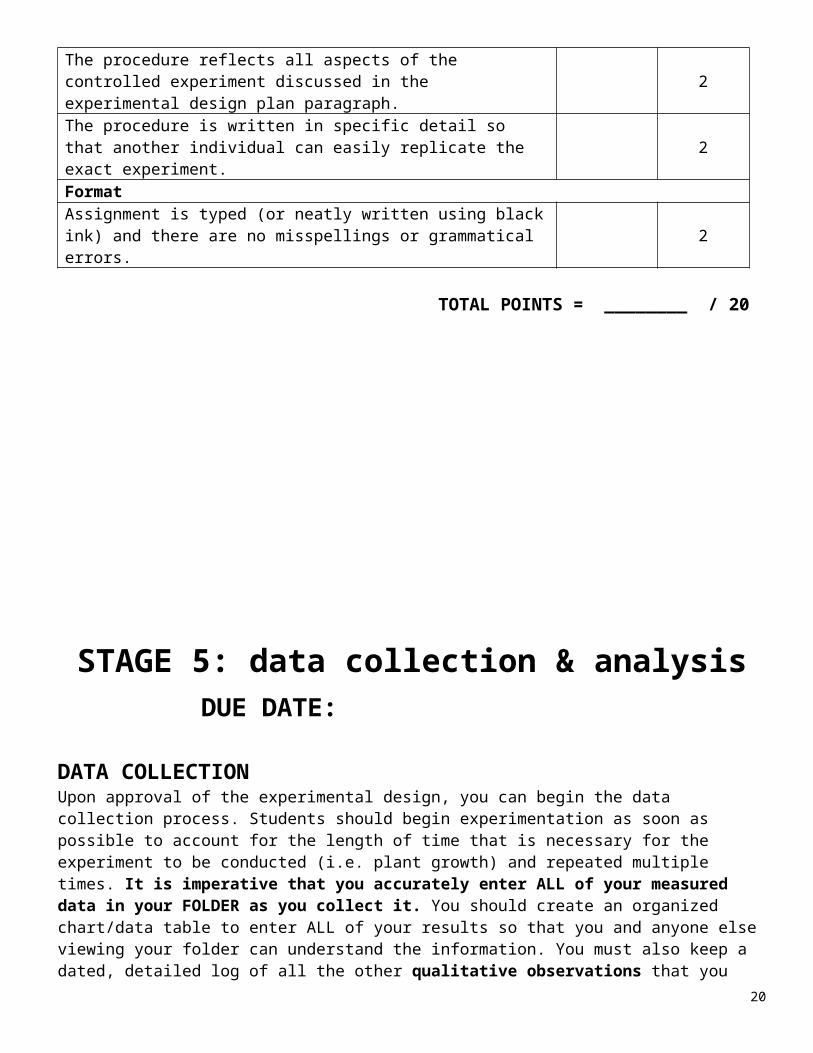
The procedure reflects all aspects of the controlled experiment discussed in the experimental design plan paragraph. 2
The procedure is written in specific detail so that another individual can easily replicate the exact experiment. 2
FormatAssignment is typed (or neatly written using black ink) and there are no misspellings or grammatical errors. 2
TOTAL POINTS = ________ / 20
13
STAGE 5: data collection & analysisDUE DATE:
DATA COLLECTIONUpon approval of the experimental design, you can begin the data collection process. Students should begin experimentation as soon as possible to account for the length of time that is necessary for the experiment to be conducted (i.e. plant growth) and repeated multiple times. It is imperative that you accurately enter ALL of your measured data in your FOLDER as you collect it. You should create an organized chart/data table to enter ALL of your results so that you and anyone else viewing your folder can understand the information. You must also keep a dated, detailed log of all the other qualitative observations that you make throughout the data collection process. Describe any changes you see occurring or other information that is not included in the measurements that you are taking.
This is also where you want to write any reflections that you might have as you complete the experiment. Reflections would include what seems to be working well versus what might not be working well. If things are not working in the experiment, discuss what changes can be made (and then make them!). As always, make sure to DATE all entries that you make during the data collection process.
REMEMBER TO TAKE PICTURES OF YOURSELF COLLECTING DATA!
ANALYZING DATAOnce you have collected data from your experiment, you need to be able to gather information and determine trends in the data. Results are NOT the same as raw data (which is what you collected). Results are compiled, calculated, and/or extrapolated to show trends and to be able to deduce collections. This component of research can be especially challenging because each unique project will need to be analyzed in a completely different way. The information that follows contains general information on how to go about analyzing your data. However, it is highly recommended that you seek additional help while completing this phase of your project, whether it is from your science teacher, a mentor, or even your math teacher. And remember, you must present an honest representation of your data. Many projects will yield unexpected results that do not support the hypothesis. That is not a failure, it is science!
ESTABLISHING TRENDS IN DATAOften, it will be necessary to perform calculations on the raw data that was collected in order to identify the trends in your data from which a conclusion is generated. A spreadsheet program such as Microsoft Excel
14
may be a good way to perform such calculations, and then later the spreadsheet can be used to display the results.
In order to establish a trend in your data, multiple trials should have been performed during the experiment. Think about the way to best summarize your data. In almost ALL cases, you will have to calculate the average for each group of trials and determine the standard deviation of those averages. The standard deviation is the most common means of measuring how widely spread the values in a data set (testing group) are and thus indicating the validity of the data set for each testing group. If the data points are close to the mean, then the standard deviation is small and the data set is valid. If many data points are far from the mean, then the standard deviation is large and the validity of the data set is questionable – meaning that you might not be able to draw a valid conclusion. In performing these calculations, students should also be mindful of outliers, values that fall will outside of the overall pattern of the data set.
Once you have established that the data for each testing group is valid, you must compare the data from each testing group in order to determine whether the data for each group is significantly different, which would imply that your independent variable DID affect the results of your experiment. How you go about performing your statistical analysis is completely dependent on the type of results you gathered. Below are the two most common forms of statistical analysis that will be performed. Coefficient of Correlation (r) – describes the direction and strength of a relationship between two quantitative variables. It
could be utilized in the following example:Example: If the concentration of calcium absorbed by plants increases, then the growth of the plant will increase.
Chi-Square and/or T-tests – these tests can be used when attempting to determine the data points of two different groups are significantly different. They could be utilized in the following example:Example: If individuals eat one cup of oatmeal every morning for a month, then they will have lower blood pressure then individuals that do not eat oatmeal.
Below of a website that you can use to not only determine what specific type of statistical test to perform, but it will also perform the calculations for you. RESOURCE: www.graphpad.com/quickcalcs/index.cfm
Once you have performed all of your statistical analysis, you will need to visually represent your findings in an organized manner. You will be expected to create a data table that summarizes the essential data and accurately establishes any trends that you have found. When making your table, remember that all tables must have an informative title that, at a minimum, indicates the dependent and independent variables of the experiment. The columns and rows must be properly labeled, including metric units of measurement when applicable. The data will communicate the accuracy and precision of your measurements by reporting them with the proper number of significant figures.
GRAPHING DATAGraphs are an excellent way to visually represent the trends and relationships established by your calculations. Different types of graphs are appropriate for different experiments and you should consult your teacher to determine which would work best. These are just a few the possible types of graphs: Pie Charts – show the relationship of parts to the whole (percentages). Bar Graphs – compare values in a category or between categories. Multiple bar graphs compare relationships of closely related
data sets. These graphs may be used to demonstrate relationships in non-continuous data or data intervals. Time-series Plot – can be used if the dependent variable is numerical and the independent variable is time. XY Line Graphs – shows the relationship between your dependent and independent variables when both are numerical and the
dependent variable is a function of the independent variable. Scatter Plots - might be the proper graph if you are trying to show how two variables MAY be related to one another.
Be sure to include a descriptive title that indicates the independent and dependent variables. For pie charts, create a key for the segments. For bar and line graphs, be sure to label each axis and indicate the proper unit of measurements. Place the independent variable on the X-axis and the dependent variable on the Y-axis. If you have multiple sets of data, show each series in a different color or symbol and include a legend with clear labels.
15
ERROR BARSYour graph should also include error bars, which are graphical representations of the variability of data and are used to indicate the error, or uncertainty in a reported measurement. They give a general idea of how accurate a measurement is. Error bars often represent one standard deviation of uncertainty, one standard error, or a certain confidence interval (e.g., a 95% interval). These quantities are not the same and so the measure selected should be stated explicitly in the graph or supporting text.DON’T FORGET TO MAKE ENTRIES IN YOUR FOLDER! A lot of the calculations and components in this section can be done on the computer or with a calculator. However, you must still document how you went about obtaining these calculations. You can identify websites or programs that you used, print out anything that you generate, and DISCUSS any formulas that were applied and describe how you used everything.
NAME: ______________________________________ PERIOD: ______ DATE: ______________
DATA COLLECTION AND ANALYSIS RUBRICOnce you have collected data from your experiment, you need to be able to gather information and determine trends in the data. Results are NOT the same as raw data (which is what you collected). Results are compiled, calculated, and/or extrapolated to show trends and to be able to deduce collections. This component of research can be especially challenging because each unique project will need to be analyzed in a completely different way. And remember, you must present an honest representation of your data. Many projects will yield unexpected results that do not support the hypothesis. Please place this rubric behind your tables and graphs in your folder.
16
TOTAL POINTS = ________ / 24
STAGE 6: DRAWING CONCLUSIONS
DUE DATE:
This is the section in which you discuss whether or not you supported your hypothesis and discuss why. A common conclusion is that the experiment “suggests a correlation between [the variables], but is statistically inconclusive.” This is OK, and usually points to the need to do additional experiments or to
17
POINTS EARNED
POINTS POSSIBLE
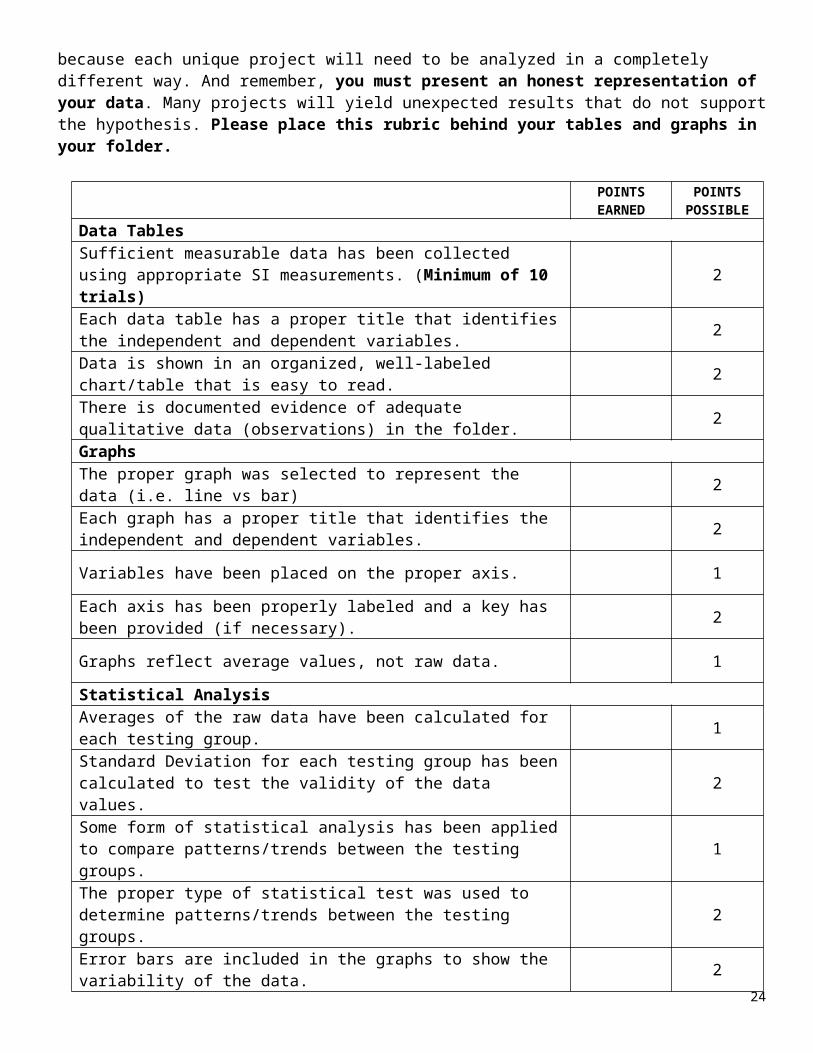
Data TablesSufficient measurable data has been collected using appropriate SI measurements. (Minimum of 10 trials) 2
Each data table has a proper title that identifies the independent and dependent variables. 2
Data is shown in an organized, well-labeled chart/table that is easy to read. 2
There is documented evidence of adequate qualitative data (observations) in the folder. 2
Graphs
The proper graph was selected to represent the data (i.e. line vs bar) 2
Each graph has a proper title that identifies the independent and dependent variables. 2
Variables have been placed on the proper axis. 1
Each axis has been properly labeled and a key has been provided (if necessary). 2
Graphs reflect average values, not raw data. 1
Statistical Analysis
Averages of the raw data have been calculated for each testing group. 1
Standard Deviation for each testing group has been calculated to test the validity of the data values. 2
Some form of statistical analysis has been applied to compare patterns/trends between the testing groups. 1
The proper type of statistical test was used to determine patterns/trends between the testing groups. 2
Error bars are included in the graphs to show the variability of the data. 2
re-run the experiment with a much larger data set. Here you will state whether your hypothesis was supported or not supported.
Don’t get yourself in trouble by saying you “proved” something. This you cannot do in science. The best we scientists can do is support a hypothesis or a theory with more and more evidence. Saying you’ve proved anything is a sure way to get a scientist to dismiss your work without even looking closely!
In order to support your conclusion, you should discuss the statistical analysis of the data and whether the results agree or disagree with previous work (connect to research conducted at the beginning of the project and then properly cite any information as you did in the introduction). The discussion should also include an adequate error analysis (see below). The conclusion typically ends by identifying the scientific importance of the results and any notable applications to the real world. Any claim you make must be SUPPORTED by your data or previous research.
ERROR ANALYSISSources of errors (or inconsistencies) are NOT errors that you made and fixed during the experiment. If your results do not support your hypothesis, this is NOT a source of error. Sources of error are made during the experimentation process and were either overlooked at the time or unavoidable. Source of inconsistencies generally come in three forms: systematic, measurement, and random (or statistical).
SYSTEMIC ERRORSSources of inconsistency in your experiment that resulted from the way it was designed or implemented. No experiment can control all possible variables, but we generally list these in our reports so that (1) we can assess how much they might affect the validity of our result, and (2) other scientists will know we considered them even if they are not explicitly controlled for. This promotes thinking of new ways around such problems in future experiments.
EXAMPLE: In the case of a person measuring the growth of 40 plants in four groups receiving different amounts of water, the following systematic errors might occur:
Some plants are always in the shade of others, and therefore grow more slowly but not because they have less water;
some plants receive more artificial light than others; the soils may have differing chemical makeup and consistencies; water may stick to the sides of the measuring cup, giving a greater percentage error to the plants
receiving less water than to those receiving the most.
Many times you will discover systematic errors you had not thought of as you do your experiment. This is part of the learning process in real science labs, and the important thing is to note these errors in your lab notebook and put them in your report. Of course, if you can fix them and still complete the experiment that would be best, but you still want to note that they affected the first part differently from after your correction.MEASUREMENT ERRORSSources of inconsistency in your experiment that resulted from the limitation in precision of your measuring instruments. General scientific practice is to go to the precision of the markings on the measuring device, then estimate one decimal place further. ALL experiments will have measurement errors – your job is to report them correctly based on the tools you use. In the plant example there are measurement errors (uncertainties) associated with the water, the plant height or leaf size, depth seeds were planted, and amount of soil per pot.
RANDOM (OR STATISTICAL) ERRORS
18
Sources of inconsistency in your experiment that resulted from many processes in nature being inherently random. Using the plant example from above, some seeds may be healthier than others; some may respond better to lower water levels through some genetic variation; some may sprout naturally taller plants; some may respond differently to the soil; etc. These errors cannot be eliminated, but are typically reduced by using a large sample size. The more random error an experiment is subject to, the more data is generally necessary.
NAME: ______________________________________ PERIOD: ______ DATE: ______________
CONCLUSION RUBRICThis is where you discuss whether or not your data supports your hypothesis and discuss why. In order to support your conclusion, you should discuss the statistical analysis of the data and whether the results agree or disagree with previous work (connect to research conducted at the beginning of the project and then properly cite any information as you did in the introduction). The discussion should also include an adequate error analysis. The conclusion typically ends by identifying the scientific importance
19
of the results and any notable applications to the real world. Any claim you make must be SUPPORTED by your data or previous research.
TOTAL POINTS = ________ / 24
STAGE 7: SUMMARIZING THE PROJECT
DUE DATE:
WRITING AN ABSTRACT20
POINTS EARNED
POINTS POSSIBLE
Conclusion
Correctly identifies whether or not the hypothesis is supported. 2
Uses data to support the claim. 2
Uses the appropriate statistical analysis to support the claim and explains the meaning of the statistical analysis. 2
Explains the conclusion by connecting with previous research. 2
Discusses application/relevance of findings. 2
Identifies new questions/problems that can be investigated in the future. 2
Error Analysis
Identifies Statistical sources of inconsistencies 2
Identifies Systemic sources of inconsistencies. 2
Identifies Measurement sources of inconsistencies 2
FormatAll background information utilized in the introduction has been properly cited. 2
References are listed in alphabetical order and are properly written using proper APA format. 2
The conclusion is typed (or neatly written using black ink), there are no misspellings or grammatical errors, and it is written in a PASSIVE voice. 2
The abstract is a very concise summary of your entire project, and should in no circumstance exceed 250 words (most of your abstracts will be 150 words or less). It will be the LAST thing your do before putting your final research paper together. It must include:
Your problem statement and your hypothesis A brief explanation of your experimental procedure A brief overview of your results (with numerical values) Your conclusion Applications and/or relevance of findings where appropriate.
Abstracts should be written in PAST TENSE, PASSIVE VOICE, and you should not include graphs or tables. One way to organize your writing would be to have the first sentence or two introduce the problem investigated and your working hypothesis, with a possible rationale for doing the project. Following this would be a very brief review of the procedure you followed in the investigation. This is a summary and is not even close to the level of detail used in your procedure section – it should not exceed two or three sentences. Next you should summarize the numerical results of the investigation, interpret the data and draw conclusions. Finally, you would include any applications, extensions, or special significance of the research worth mentioning.
One of the most common problems with student abstracts is the lack of numerical data in the abstract. To summarize numerical results, give only the “bottom line” values that educated readers would be interested in – for example, “the candles kept at 10ºC burned 38±5 seconds longer than those at 20ºC.” Too much data detracts from the readability of the abstract, while none at all causes one to question the scientific validity of the project. The conclusion should also be very brief and highly relevant – don’t add extra “fluff” to make it sound good. Edit your abstract at least 10 times, trying to cut out words and make it more concise and clear each time.
You will be providing each judge with a copy of your abstract on the day of the STEM fair. It may be the only item they actually read while reviewing your project, so do a good job of “selling” your project by writing clearly and persuasively about your research. In fact, working scientists seldom read more than the abstracts of research they are not directly involved in, and they use this information to keep informed about the ongoing work in their discipline.
STAGE 8: PRESENTING THE PROJECTDUE DATE:
21
Hypothesis
Materials and Methods
Title
Data Charts
Graphs
Pictures
Results
Conclusions
Bibliography & Acknowledgements
ProblemBackground Information
You will present your project to individuals of the science community at the Howard High STEM Fair. The visual display you create is used to help you organize your thoughts so that the project can be explained in a sequential and knowledgeable manner.
CONSTRUCTING THE DISPLAY BOARDThe STEM project display board is a visual summary of the entire investigation carried out by the student and will be used to communicate your results at the STEM Fair. You are required to have a normal sized, free standing, three sided display no larger then 122 centimeters (48 inches) wide, 274 centimeters (108 inches) high, and 76 centimeters (30 inches) deep (NO MINI-BOARDS). The display is normally purchased from an office supply store and made out of corrugated cardboard or foam. The display must be sturdy and not easily overturned. A typical arrangement of an investigation on the three-sided display is shown below.
Arrangement of STEM FAIR Project on Three-Sided DisplayYour name, your
teacher’s name, and your school MUST be on the top-left corner (think middle) on the back of the closed right panel of the display board.
Minimum font size of 20. Should be able to read from 2’ away. The title should be larger font and in center section only. Background information should be on your board in bullet format. Materials and Methods should be on your board in bullet format. A summary of your conclusion will be on your board. You MUST include photos of you performing your experiment! Make sure Data Tables and Graphs are readable and quickly communicate your
conclusion. Select graphs and data tables that contribute to supporting your conclusion.
STEM FAIROn the day of the STEM fair you will describe your project to a minimum of three individuals from the science community. You should discuss the STEM Fair project from personal experience. Make sure you use your science terms correctly. It might be helpful to present to a family member or a friend first and let them ask you to explain the project and also ask specific questions about how and why this particular investigation was performed.
22
On the day of the STEM fair make sure you dress nicely and look the judge in the eyes as much as possible. Answer any questions simply and concisely. Don’t chew gum! Do NOT read from your display board.
Your Presentation
Bring four copies of your abstract to give to the judges.
Introduction1. Introduce yourself.2. Tell how you became interested in the topic.3. State your problem.4. Review enough background information so that an average adult could understand your experiment.5. State your hypotheses.
Materials and Methods1. Describe what you did (materials and methods).2. Explain how the data were collected.
Results1. Describe the results.
Conclusion1. Summarize the major findings, including support for your hypothesis.2. Explain how your findings apply to the real world.3. Suggest improvements, topics for further study, and potential applications.
NAME: ________________________________________ PERIOD: ______ DATE: ___________
STEM Fair Project Display Board RubricYour STEM Fair Project display board is a visual summary of all aspects of your project. It should include a proper title, problem stat
***Failure to make corrections from comments on final paper will result in no credit given on that section. ***23
_______/1 Title is descriptive (recognizes independent/dependent variables), only in center section
_______/1 Problem (stated in question form)
_______/1 Hypothesis is included
_______/1 Hypothesis is written in the proper format (“if…, then ….”)
_______/1 Background Information is included, concise, and bulleted
_______/2 Background Information explains the important science behind the topic (Information necessary to explain the topic and the results)
_____ /1 Factual Information is properly cited
_______/1 Materials and Methods are included and concise. Materials are bulleted. Methods are numerical.
_______/2 Materials and Methods are clear for easy replication
_______/1 All data tables and graphs are properly titled with Independent and Dependent Variables
_______/1 Appropriate use of data tables to summarize investigation
_______/1 Appropriate type of graph(s)
_______/2 Properly labeled graph (axis, key, units)
_____ /1 Data tables and graphs are include standard deviation (and other statistical tests if necessary)
_______/1 Results section is included & concise
_______/2 Results section uses data and statistical analysis to summarize results
_______/1 Summaries of Conclusion and Error Analysis are included and concise. Sections are clearly separated
_______/2 Conclusion identifies if the hypothesis was supported with data and statistical analysis
_______/2 Conclusion explains why (scientifically) the results were obtained (references are cited)
_____ /1 Conclusion identifies relevance or application of findings
_______/2 Error Analysis identifies systemic, measurement, and statistical sources or error
_______/1 Bibliography is included and written in proper APA formation
_____ /1 Acknowledgements are included
_____ /1 Photographs of experiment are included on board
_______/1 Good use of space
_______/2 Good use of color and pictures/diagrams
_____ /1 Each section is clearly labeled/identified
_____ /1 Sections of the board are organized in an appropriate order
_______/1 Materials are properly attached (not falling off, no “flip-ups”, no staples, etc.)
_______/1 Font is large enough to see from 2 ft. away (minimum 20 pt font)
_______/1 Sturdy display board in appropriate size (122cm x 274cm x 76cm)
_____ / 1 Name is written on the back top-right corner of the display board
______ / 40 TOTAL *Display Board will NOT be graded without submission of graded/marked final paper.*
.24
25
26