Embed Size (px)
Citation preview
~.
~".
... ~111 .. ... .. ..
..
.. --.. ...
.. -.. .. -.. --.. .. -.
VIL-N 002
Fal se ARYCOfI3Y RECONNAI SSANCE STUDY
OF ENERGY REQU I REMENTS
AND ALTERNATIVES
PROPERTY OF: aska Power Authority
334 W. 5th Ave.
FOR
A chorage, Alask~ 99501 '--44------~--~LSE PASS
ANIAK ATKA MEKORYUK
CHEFORNAK NEWTOK
CHIGNIK LAKE NIGHTMUTE
COLD BAY NIKOLSKI
FALSE PASS ST. GEORGE
HOOPER BAY ST. MARYS
IVANOF BAY ST. PAUL
KOTLIK TOKSOOK BAY
LOWER AND TUNUNAK UPPER KALSKAG
PREPARED BY
NORTHERN TECHN ICAl SERVICES
a VAN GUllK AND ASSOCIATES
ANCHORAGE, ALASKA
___ ALASKA POWER AUTHORITY __ ~
FALSE PASS ,
RECONNAISSANCE STUDY OF ENERGY REQUIREMENTS AND ALTERNATIVES
A Report
by
Northern Technical Services
Van Gulik and Associates
Anchorage, Alaska
July, 1982
,.,.
TABLE OF CONTENTS
1.0 Summary and Recommendations
2.0 Background
3.0 Village Meeting
4.0 Existing Heating and Electrical Power Generating Facilities 4.1 Bulk Fuel Storage and Heating Appliances 4.2 Electrical Generation Facilities 4.3 Fuel Oil Usage 4.4 Electrical Energy Distribution
5.0 Energy Balance
1.1
2. 1
3. 1
4. 1 4. 1 4.1 4. 1 4.2
5.1
6.0 Energy Forecasts 6.1 6.1 Population Projection 6.1 6.2 Capital Projects 6.1 6.3 Thermal Energy Projection 6.2 6.4 Electrical Energy and Peak Demand Projection 6.3
7.0 Energy Resource Assessment
8.0 Energy Plans 8.1 Base Case 8.2 Alternate plan A 8.3 Alternate Plan B
9.0 Analysis of Alternatives and Recommendations
Appendix
Review letters and replies
i
7.1
8.1 8.1 8.6 8.12
9.1
LIST OF TABLES
Table 5.1 Energy Balance for 1982
Table 8.1 Itemized Present Worth Analysis of the Base Case
Table 8.2 Estimated Heat Recovery Costs
Table 8.3 Itemized Present Worth Analysis of Alternate Plan A
Table 8.4 Itemized Estimated Cost to Install a Hydroelectric System
Table 8.5 Itemized Present Worth Analysis of Alternate Plan B
Table 9.1 Summary of the Present Worth Analysis and Any Non-electric Benefits for Each Energy Plan
Table 9.2 Direct Power Generation Costs for Each Energy Plan
Table 9.3 Preference Ranking of Village Energy Plans and Associated Recommended Actions
II
5.2
8.3
8.7
8.9
8.13
8.15
9.1
9.2
9.3
• • • -• • • • • .. .. • • • • • -• .. • • • • .. .. • • --• • • --
LIST OF FIGURES
Figure 2.1 Location Map
Figure 2.2 Climatic Background
Figure 4.1 Bulk Fuel Storage Capacities and Types of Heating Appliances
Figure 4.2 Electrical Generation Facilities
Figure 4.3 Fuel Oil Usage
Figure 4.4 Electrical Generation Sector Energy Distribution
Figure 5.1 Energy Flow Diagram
Figure 5.2 Distribution of Total Useable Energy
Figure 6.1 Population Projection
Figure 6.2 Thermal Energy Projection
Figure 6.3 Peak Demand and Electrical Energy Projection
Figure 7.1 Appropriate Technology Ranking Diagram
iii
2.2
2.4
4.3
4.4
4.5
4.6
5.3
5.4
6.4
6.4
6.5
7.5
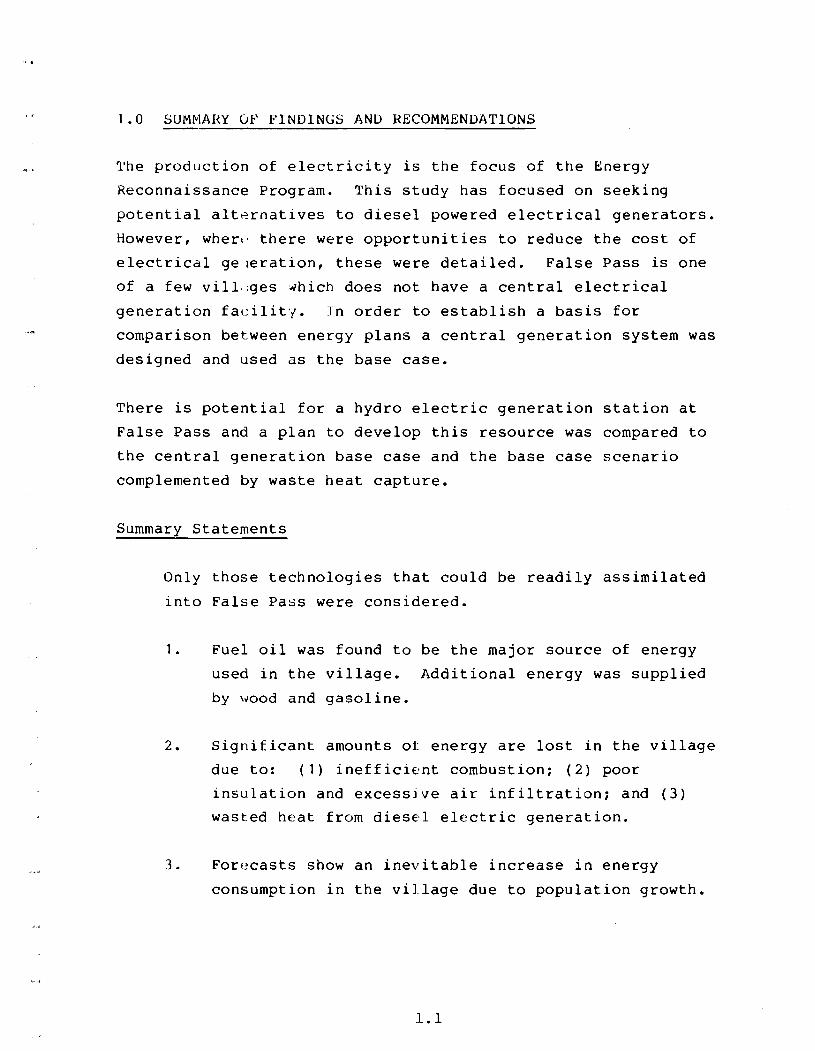
1.0 SUMMARY OF FINDINGS AND RECOMMENDATIONS
The production of electricity is the focus of the Energy
Reconnaissance Program. This study has focused on seeking
potential alternatives to diesel powered electrical generators.
However, wherl' there were opportunities to reduce the cost of
electrical ge leration, these were detailed. False Pass is one
of a few vill,:ges ~hich does not have a central electrical
generation facility. ]n order to establish a basis for
comparison between energy plans a central generation system was
designed and used as the base case.
There is potential for a hydro electric generation station at
False Pass and a plan to develop this resource was compared to
the central generation base case and the base case scenario
complemented by waste heat capture.
Summary Statements
Only those technologies that could be readily assimilated
into False Pass were considered.
1. Fuel oil was found to be the major source of energy
used in the village. Additional energy was supplied
by wood and gasoline.
2. Significant amounts of energy are lost in the village
due to: (1) ineffici~nt combustion; (2) poor
insulation and excessjve air infiltration; and (3)
wasted heat from diesel electric generation.
3. Forecasts show an inevitable increase in energy
consumption in the village due to population growth.
1.1
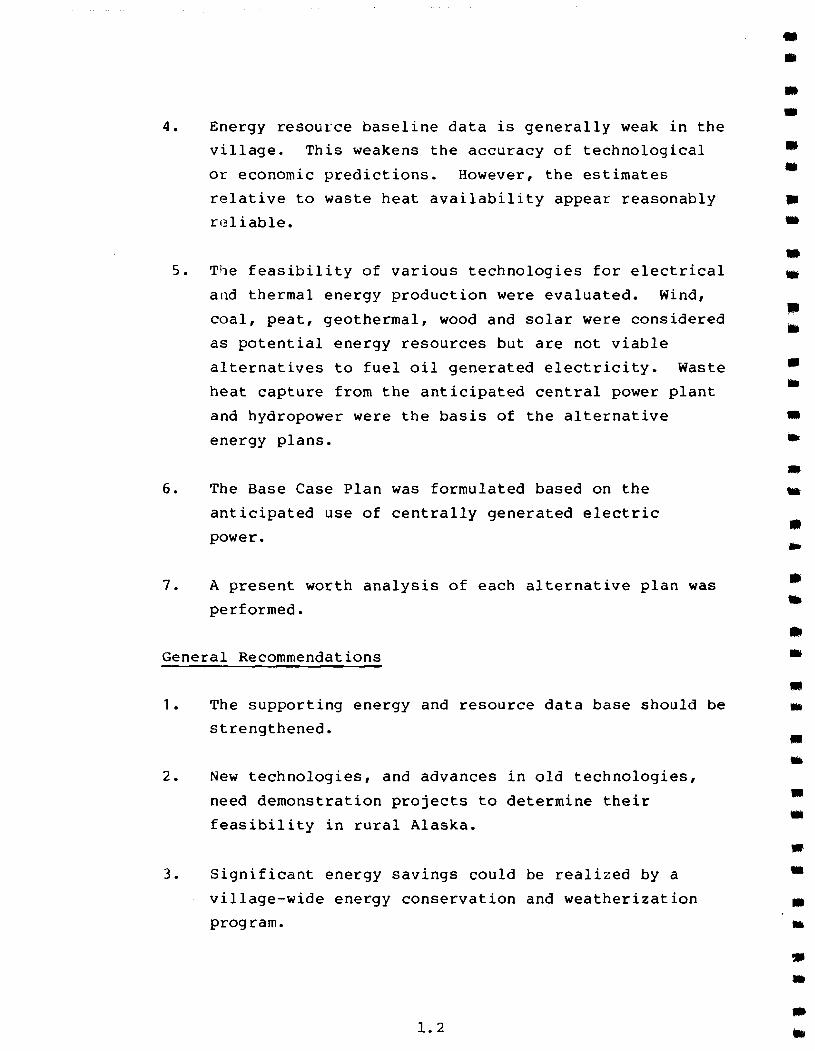
4. Energy resource baseline data is generally weak in the
village. This weakens the accuracy of technological
or economic predictions. However, the estimates
relative to waste heat availability appear reasonably
reliable.
• • • • • • • • •
5. T~e feasibility of various technologies for electrical _
6.
7.
and thermal energy production were evaluated. Wind,
coal, peat, geothermal, wood and solar were considered
as potential energy resources but are not viable
alternatives to fuel oil generated electricity. Waste
heat capture from the anticipated central power plant
and hydropower were the basis of the alternative
energy plans.
The Base Case Plan was formulated based on the
anticipated use of centrally generated electric
power.
A present worth analysis of each alternative plan was
performed.
General Recommendations
1. The supporting energy and resource data base should be
strengthened.
2. New technologies, and advances in old technologies,
need demonstration projects to determine their
feasibility in rural Alaska.
3. Significant energy savings could be realized by a
village-wide energy conservation and weatherization
program.
1.2
• • • • • .. • .. • .. • .. • .. • • •
• • • • • • .. • •
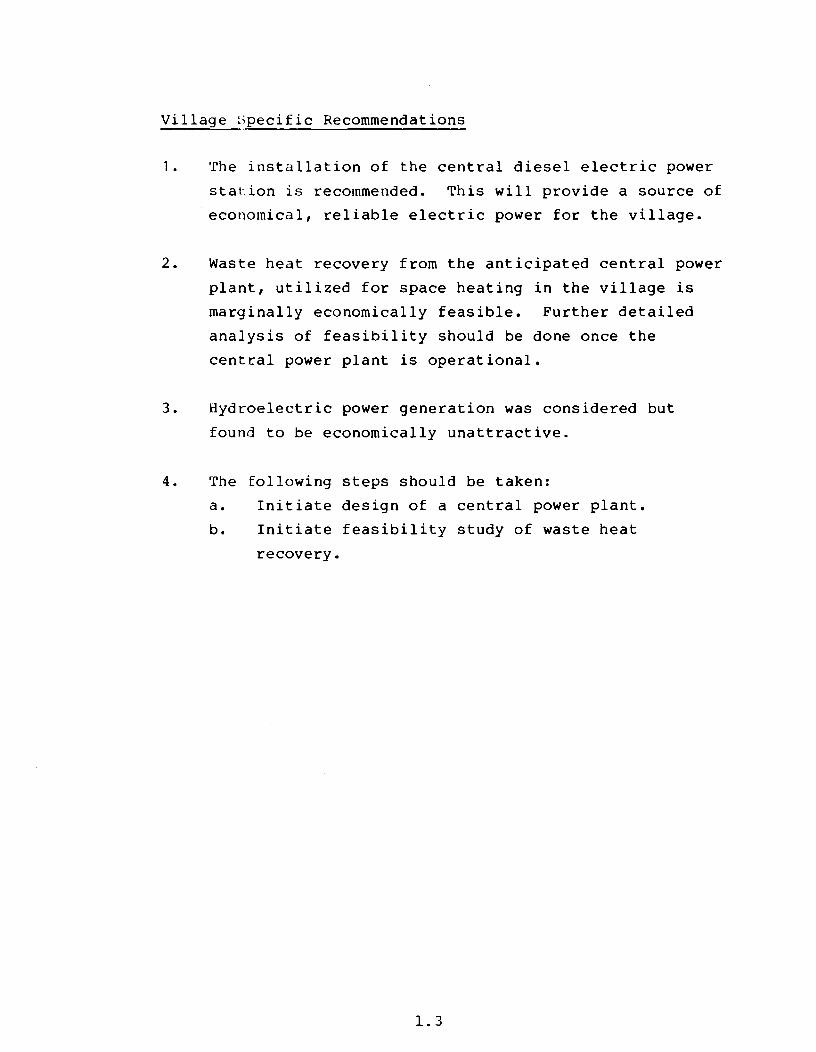
vi llage :~peci f ic Recommendat ions
1. The installation of the central diesel electric power
station is recommended. This will provide a source of
economical, reliable electric power for the village.
2. Waste heat recovery from the anticipated central power
plant, utilized for space heating in the village is
marginally economically feasible. Further detailed
analysis of feasibility should be done once the
central power plant is operational.
3. Hydroelectric power generation was considered but
found to be economically unattractive.
4. The following steps should be taken:
a. Initiate design of a central power plant.
b. Initiate feasibility study of waste heat
recovery.
1.3
2.0 BACKGROUND
Introduction
False Pass was established in 1918 by P. E. Harris Co. as a
salmon fishing and processing site. The community has
always been directly involved in the fishing industry. The
P.E. Harris Cannery was purchased by Bristol Bay Native
·Corporation in 1975 and renamed Peter Pan Seafoods. The
complex w~s sold after the processing plant burned in 1981.
There is no indication from the present owners as to
whether it will be rebuilt.
False Pass receives barge service from three shipping
companies, Western Pioneer Lines, Alaska Marine Shipping,
and the Alaska Standard. Because of the weather, air
travel is unpredictable year round. Charter flights are
available from Peninsula Airways.
The village consists of 16 wood frame houses. There is an
average of 3.5 person per household. The ground is quite
marshy so most homes are built on pilings. The older
houses have little or no insulation. The cannery
bunkhouse, mess hall, hotel, clinic and laundry now receive
only intermittent use. The school, owned by the State, and
the community building are the only public facilities. The
school, serving 15 students, is a member of the Aleutian
Region School District.
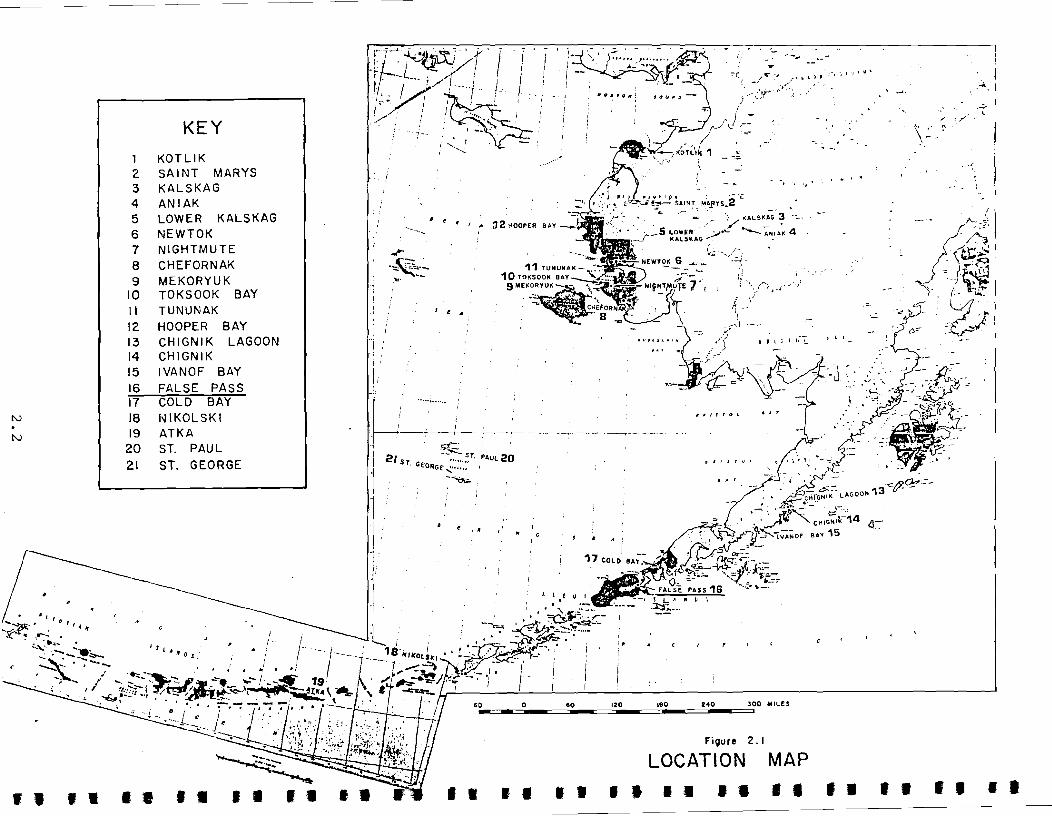
Location
The unincorporated village of False Pass lies on the east
ern side of Unimak Island overlooking the Isanotski Strait
which connects the Gulf of Alaska and the Bering Sea (Figure
2.1). False Pass is 635 miles southwest of Anchorage and
2.1
KEY
1 KOTLIK 2 SAINT MARYS
:3 KALSKAG
4 ANIAK
5 LOWER KALSKAG
6 NEWTOK
7 NIGHTMUTE
8 CHEFORNAK
9 MEKORYUK 10 TOKSOOK BAY
II TUNUNAK
12 HOOPER BAY
1:3 CHIGNIK LAGOON 14 CHIGNIK
15 IVANOF BAY
16 FALSE PASS 17 COLD BAY
I\.) 18 [IIIKOLSKI
I\.) 19 ATKA
20 ST. PAUL
21 ST. GEORGE
. , I • • • I. I I '1 •
- ~
I I / ,
I
"/
. . , " :12 HOOPER
j i i
Ii
s •
r ' .... ~'......, ,
.~---_~ __ ,_' - .. ~." ., ~-.'
I 21 '_::0:::... ST P~UL 20
I
I ST. GEORGE ::::::: •. , " I -~ .. I
I I
I
... l. f U I
--
"
... 2..-==::JI_-==O_-=== •• O_-=~1;;20;..-=~';;80;..-==~2;4;;.O _0::==';,00 "II. .. £S
Figure 2, I
LOCATION MAP
I I • • I • • • I I I • • •
" I .-'. I
ri l '-
\" " ~ - .'
. ,. , "
I • , . r I I •
35 miles west of Cold Bay. Unimak iE: the largest and first
island of the Aleutian Chain.
Climate
The island topography includes mountains rising to 10,000
feet, broad glacial valleys, low swampy areas, meandering
streams and several active volcanoes, all within 25 miles
of False Pass. The village is located on a flat beach and
outwash plain of an unnamed stream wtich drains a broad
glacial valley.
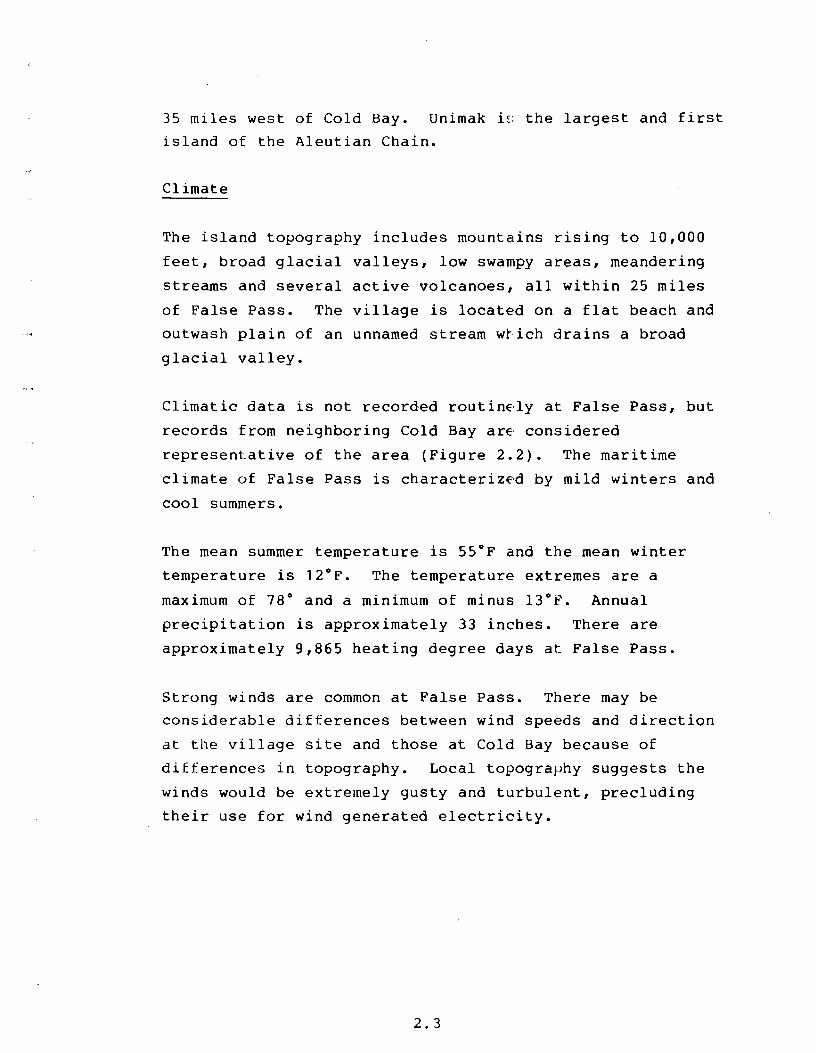
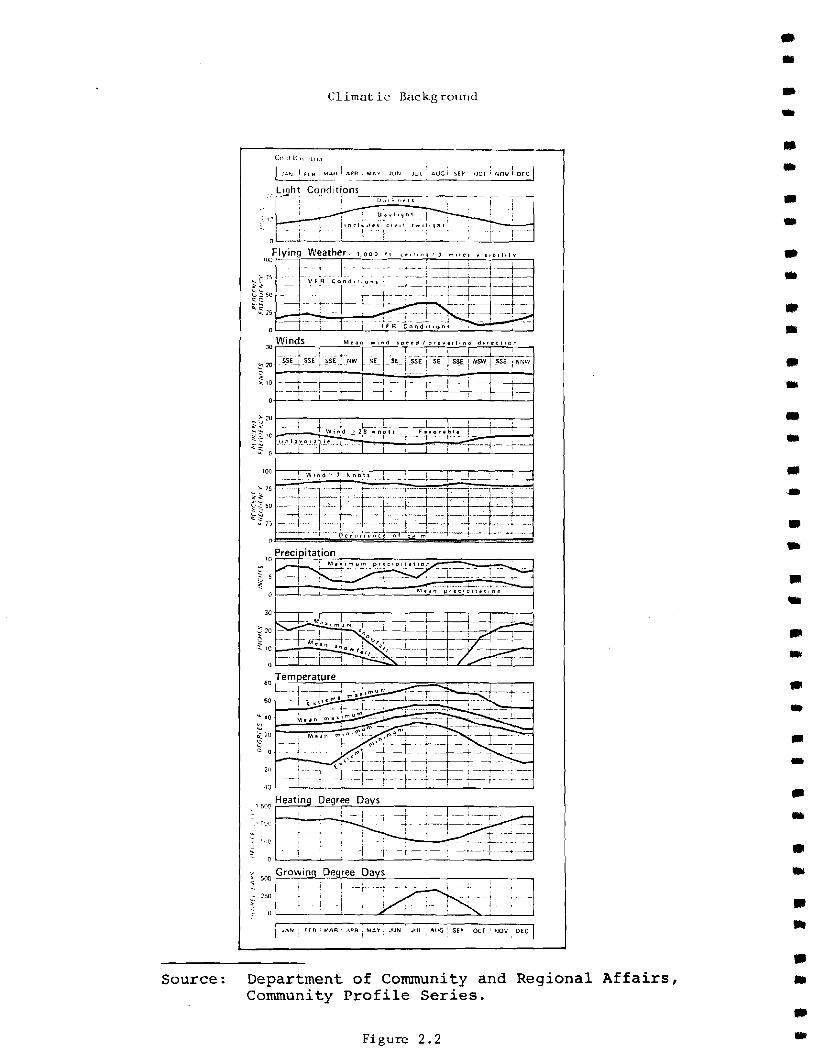
Climatic data is not recorded routinely at False Pass, but
records from neighboring Cold Bay are considered
representative of the area (Figure 2.2). The maritime
climate of False Pass is characterized by mild winters and
cool summers.
The mean summer temperature is 55°F and the mean winter
temperature is 12°F. The temperature extremes are a
maximum of 78° and a minimum of minus 13°F. Annual
precipitation is approximately 33 inches. There are
approximately 9,865 heating degree days at False Pass.
Strong winds are common at False Pass. There may be
considerable differences between wind speeds and direction
at the village site and those at Cold Bay because of
differences in topography. Local topography suggests the
winds would be extremely gusty and turbulent, precluding
their use for wind generated electricity.
2.3
Source:
Climatic Background
I I I I ' I I ' I ' I I J':'~, I FI t:! ,MAti I API! I MAY JUN: JUL AUG: S£P' OCT; NOV: DEC
.. ' Li ht Condltio"'n"s:....-__ ------() ,t • ~ " .. I l
: j. ,~t"~ 111j ~ t..) -i j,nrludel ,.v,1 r .... '.,Qht'
I 1 Ii·'
oL-__ L-~ __ -L __ L-~~~~~~~~ __ ~ __ ~~
30rVV~in~d~s~-r _ _rM~.~.~n~W~,~"~d~'~P.:c.~d~/~P~,.~.~.~,~',~n~._d~i,r.~'~.'~o~n~~
::0 20 :-S5ei s5' l-sSEt-Nw f 5'_):5'.) =5SEj 5Et
551-! wSW I S5E ; NNW
§.o ~=t=t=~--=j--r~I-- ~+.-~--+----j
100~-~~~~~--~-.-_.-~-~-_r-_r----~ '- \''''~d-''', k.no,'_' _1. ~~, \ __
, ,GO rH-"e:..;a-'t.;.;.in'""---'D:..;e::..;g"-r.;:.ee"--'D::;.=.ay!....s=--__ ..,..... ___ -r __ ...,...._~----~
-' \ r(.r;
-~---- j I
-I ,:,1('
250
'-1AR' APR! MAV: JUN ! )Ul ; AUG: Sf" ocr: NOV DEC
Department of Community and Regional Affairs, Community Profile Series.
Figure 2.2
• • .. -• • • -• • • • • -• • .. -• • • .. .. • .. • • -• • • • .. • till
• • •
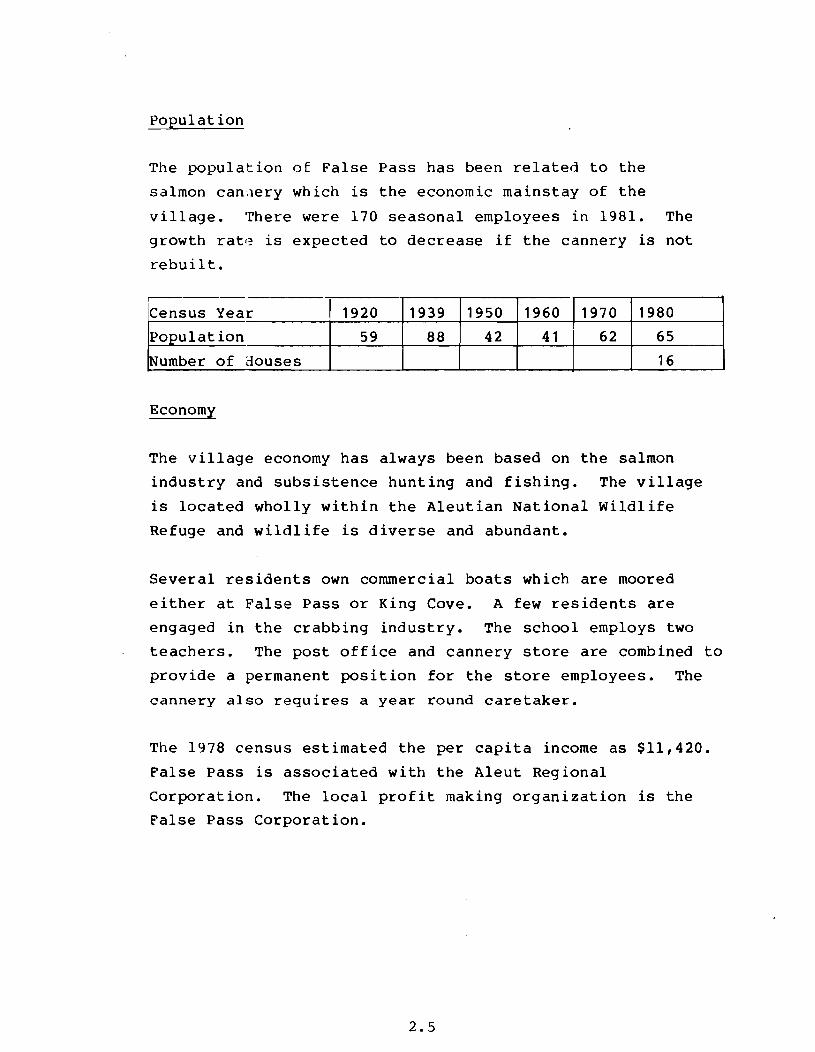
Population
The population of False Pass has been related to the
salmon can,lery which is the economic mainstay of the
village. 'rhere were 170 seasonal employees in 1981. The
growth ratf~ is expected to decrease if the cannery is not
rebuil t.
r------
Census Year 1920 1939 1950 1960 1970 1980
Population 59 88 42 41 62 65
Number of douses 16
Economy
The village economy has always been based on the salmon
industry and subsistence hunting and fishing. The village
is located wholly within the Aleutian National Wildlife
Refuge and wildlife is diverse and abundant.
Several residents own commercial boats which are moored
either at False Pass or King Cove. A few residents are
engaged in the crabbing industry. The school employs two
teachers. The post office and cannery store are combined to
provide a permanent position for the store employees. The
cannery also requires a year round caretaker.
The 1978 census estimated the per capita income as $11,420.
False Pass is associated with the Aleut Regional
Corporation. The local profit making organization is the
False Pass Corporation.
2.5
3.0 VILLAGE VISIT
Poor weather condition delayed many attempts to reach the
village of False Pass from Cold Bay. Weat:ler conditions
were favorable on December 1st and the field team was able
to reach the village. Many attempts at radio and telephone
communication prior to the visit were unsuccessful.
The majority of the villagers were out hun:ing because of
the improved weather. At a meetings with :he villagers the
Energy Reconnaissance Program was explainej and discussions
soon focused on the recent fire at the cannery (March 8,
1981). The villagers were concerned that there were no
known plans to rebuild the cannery.
At present there is no central electrical generation
facility at False Pass. The villagers were hoping that
such a facility would be installed in the near future.
The majority of the villagers work at the canneries in
Chignik, Kodiak and Bristol Bay; however many w,:>uld prefer
to work in the village.
Although the Corps of Engineers has determined that
hydropower is not feasible at False Pass. it appeared that
there might be opportunities for a more restricted
development just to supply the villagers' needs.
Wind power is a source of interest in all villages althouqh
there are severe doubts about its reliability, especially
in light of all the widely reported problems at Nelson
Lagoon.
3.1

Several residents expressed interest in the State
assistance programs for weatherization. Because of
rapidly climbing costs of fuel oil for residential
weatherization was seen as a necessary first step.
3.2
heating
• • • • • .. • • • • • • • • .. .. • -• .. • ... • .. • • • -• .. • .. • • • • • •
4.0 EXISTING HEATING AND ELECTRICAL POWER GENERATING FACILITIES
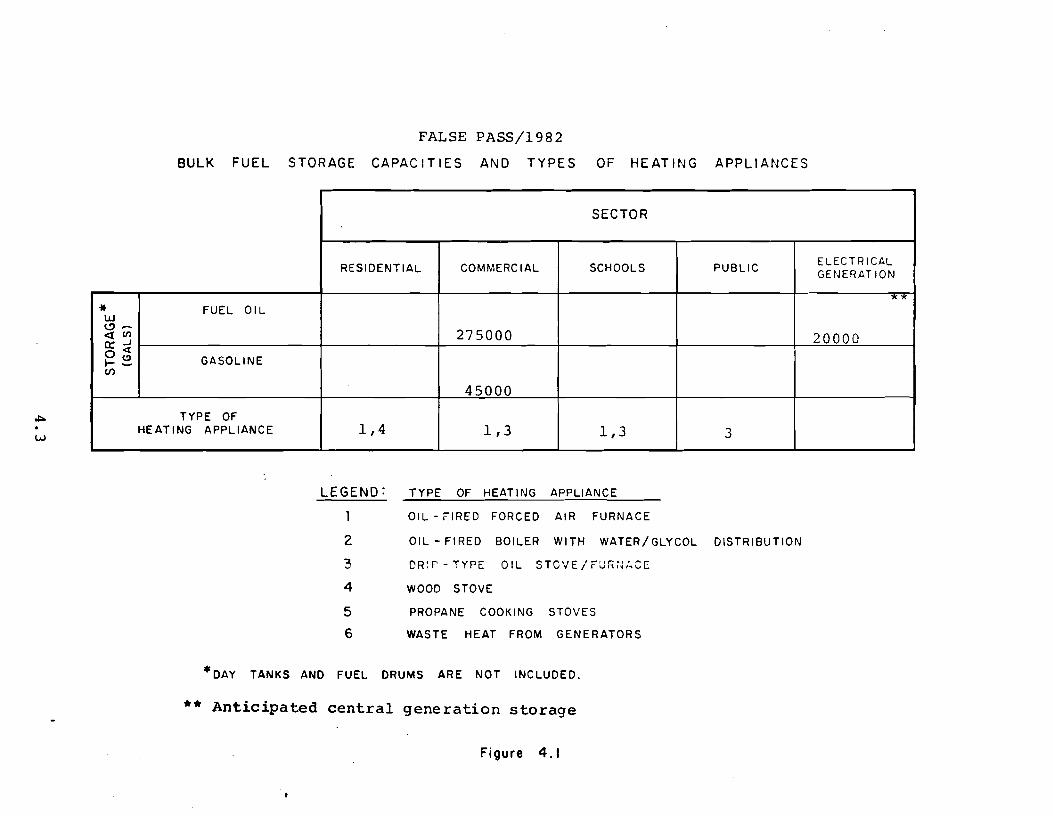
4.1 Bulk Fuel Storage and Heating Appliances
Bulk fuel storage capacity within the village is
listed, segregated by sector, in Figure 4.1. These
capacities are based on actual tank sizes and on
estimates where reliable data could not be obtained.
The storage capacity of domestic fuel tanks and 55
gallon drums is not included in the bulk storage
capacities.
Also listed in Figure 4.1 are the types of heating and
cooking appliances, segregated by sector, being used
in the village.
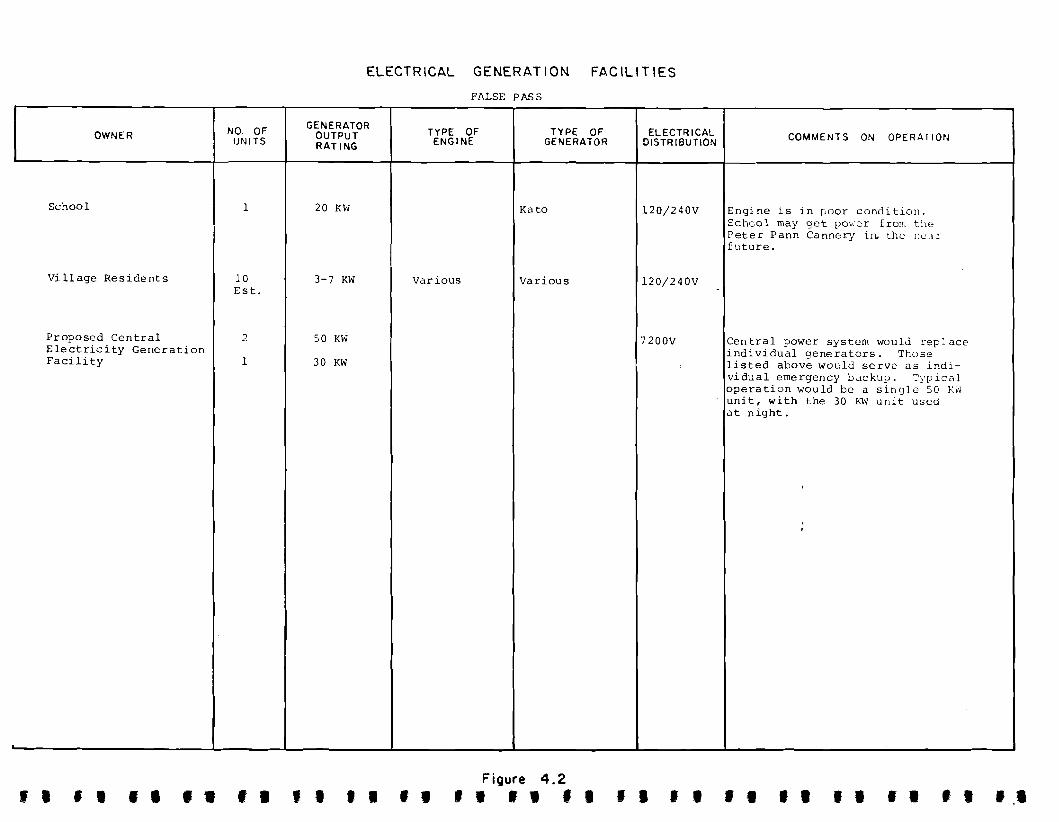
4.2 Electrical Generation Facilities
The existing generating equipment installed in the
village is listed in Figure 4.2. Comments on the
operation of the generators are included.
The anticipated generation equipment for a central
power plant is also listed on Figure 4.2. Once the
central power plant becomes operational the individual
generators now used would be disconnected or used for
back up.
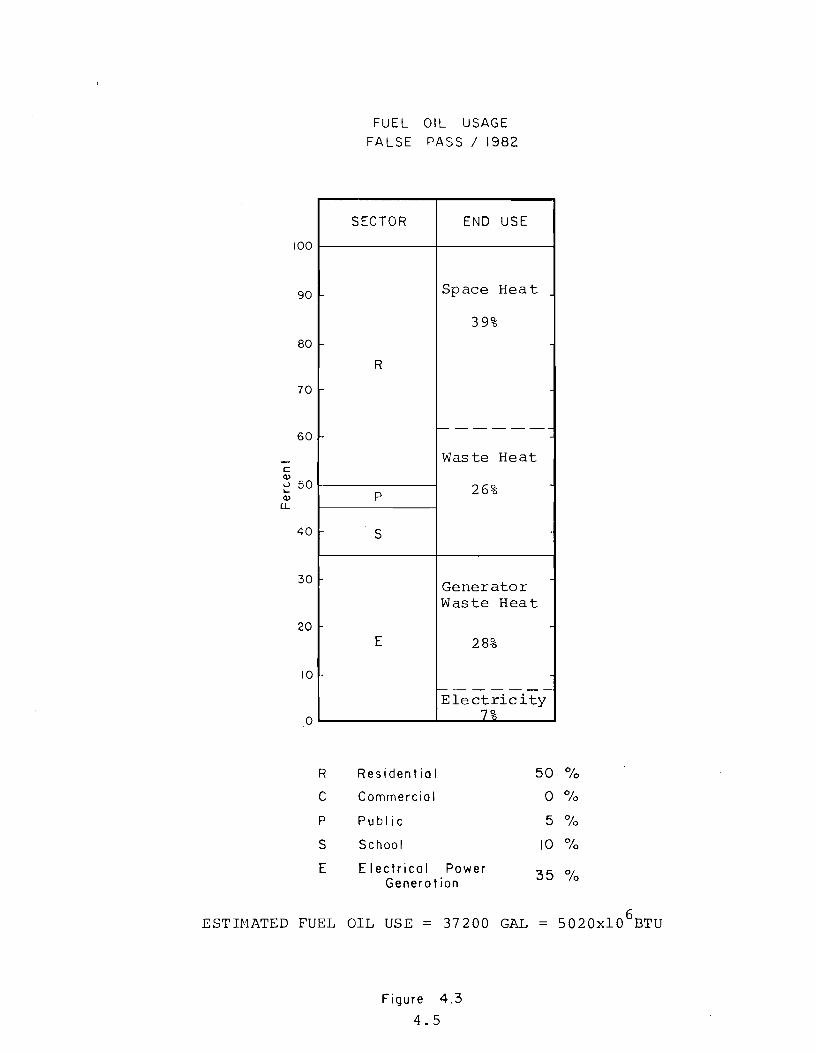
4.3 Fuel Oil Usage
Figure 4.3 illustrates the use of fuel oil in the
village. Consumption of fuel oil by sector for space
heating is listed as a percentage of the total oil
consumption. Similarly, the percentage of oil used
for electrical power generation is shown.
4.1
The oil used for space heating is broken down to show
the portion that actually heats building space, and
that which is lost to waste. The electrical
generation fuel oil is also separated into electrical
energy and waste heat segments.
Fuel oil consumption in the village was based on
records, where avilable, and calculated estimates
where no reliable records existed. Please refer to
the main report for an explanation of the estimating
process.
The fuel oil consumption for electrical power
generation was based on an anticipated central
electrical power plant, with the generating equipment
listed in Figure 4.2.
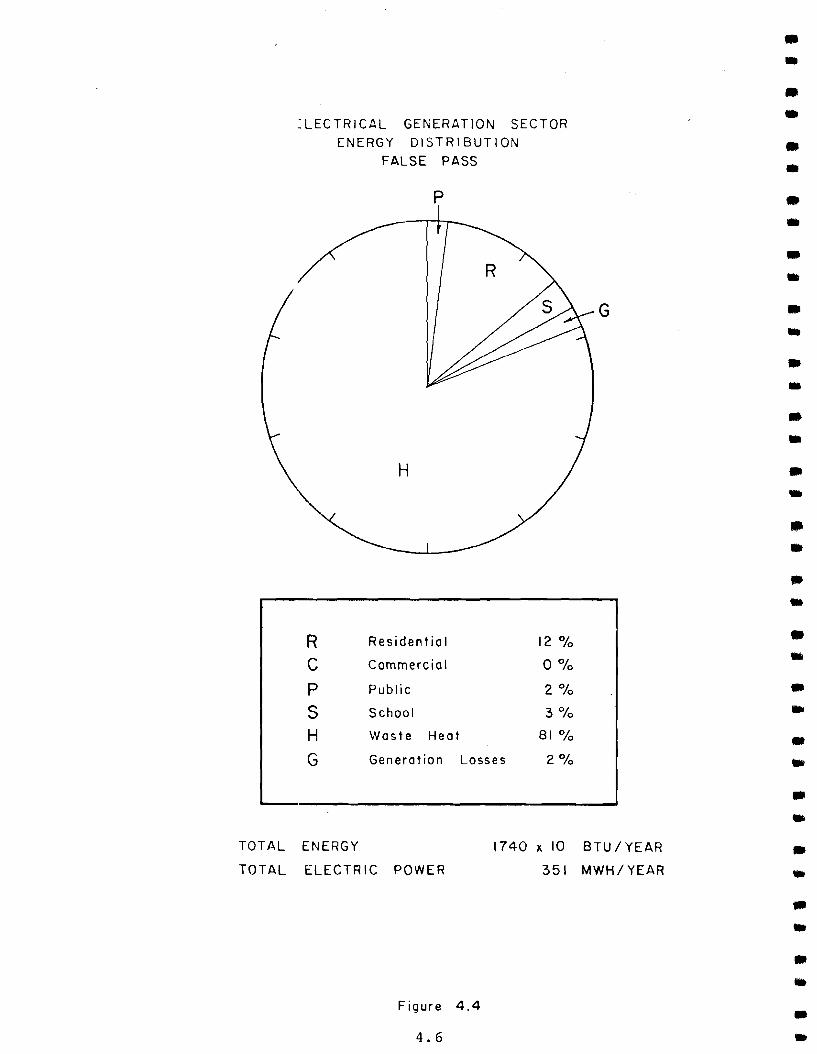
4.4 Electrical Energy Distribution
The energy flow through the electrical generation
sector is depicted graphically on Figure 4.4. The
"pie-chart" represents the total energy dedicated to
the geneLation of electrical power. Each sector in
the village consumes a slice of the pie, as shown.
4.2
• • • • • • • .. • -• .. • • • -• -• • •
• • • .. •
• .. • • • • • ...
FALSE PASS/1982
BULK FUEL STORAGE CAPACITIES AND TYPES OF HEATING APPLIANCES
SECTOR
RESIDENTIAL COMMERCIAL SCHOOLS PUBLIC ELECTRICAL GENERAT ION
** * FUEL OIL w <.!),...
275000 <tCf) 20000 a: J 0<
GASOLINE t-e U)
45000
TYPE OF HEATING APPLIANCE 1,4 1,3 1,3 3 w
LEGEND: TYPE OF HEATING APPLIANCE
OIL - FIRED FORCED AIR FURNACE
2 OIL - FIRED BOILER WITH WATER/GLYCOL DISTRIBUTION
3 DR:r - TYPE OIL STOVE/FUh;~t,C;E
4 WOOD STOVE
5 PROPANE COOKING STOVES
6 WASTE HEAT FROM GENERATORS
*DAY TANKS AND FUEL DRUMS ARE NOT INCLUDED.
** Anticipated central generation storage
Figure 4.1
NO. OF OWNER UNITS
School 1
Village Residents 10 Est.
Proposed Central 2 Electrici ty Generation Facility 1
, . , . " , . , .
ElECTR ICAl GENERAT ION FACILITIES
GENERATOR OUTPUT RAT ING
20 KW
3-7 KW
50 KW
30 KW
, I I •
Fl\LSE PASS
TYPE OF TYPE OF ENGINE GENERATOR
Kato
Various Various
, , Figure 4.2 ,. ,. ..
ELECTRICAL DISTRIBUTION
l20/240V
l20/240V
7200V
f, , .
COMMENTS ON OPERATION
Engine is in poor condi tion. Scheol may get pov.:er f rO!T. t:le Peter Pann Cannery in .. the no:! r future.
.
Cen tral power system would repl ace individual generators. Those listed above would serve as indi-vidual emergency backup. cyp ical operation would be a single 50 KI'i unit, with the 30 KW unit used at night.
,
, ,
I • • • I. • • , . I "
100
90
80
70
60
c: Q)
u 50 .... Q)
n.
40
30
20
10
o
R
C
P
S
E
FUEL OIL USAGE
FALSE PASS / 1982
SECTOR END USE
Space Heat
39%
R
------
Waste Heat
P 26%
S
Generator Waste Heat
E 28%
-------Electrici ty
7%
Residential 50
Commercial 0
Publ i c 5
School 10
Electrical Power 35 Generation
%
%
%
"/0
%
ESTn.1ATED FUEL OIL USE = 37200 GAL = 5020xl06
BTU
Figure 4.3
4.5
~ LEC TR I CAL GENERAT ION SECTOR
ENERGY DISTRIBUTION
FALSE PASS
p
G
H
R Residential 12 %
C Commercial o %
P Public 2 0/0
S School 3 0/0
H Waste Heat 81 0/0
G Generation Losses 2 %
TOTAL ENERGY 1740 x 10 BTU/YEAR
TOTAL ELECTRIC POWER 351 MWH / YEAR
Figure 4.4
4.6
• .. • • • • • .. • .. • • .. • • • -• .. • -• .. •
• .. • • • • .. .. • .. • ..
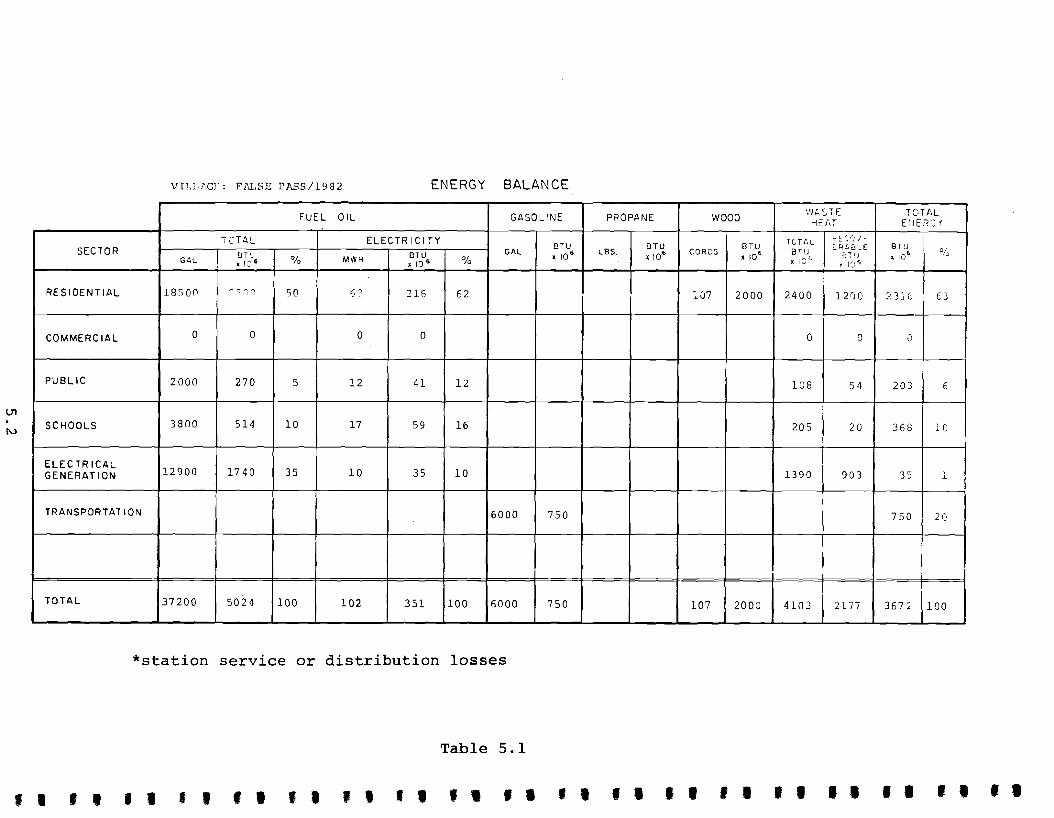
5.0 ENERGY BALANCE
The estimated energy consumption in False Pass during 1982
is listed in Table 5.1. Estimates of the different types
of energy consumed by the various sectors are based upon
the 1980-81 fuel purchase records kept by the cannery
store and the school. Estimates based on the population,
square footage of residences and other buildings, and
calculated energy usage factors, were used where data were
incomplete. Wood use ~as estimated using the observations
and discussions with wood users that occurred during the
village visit.
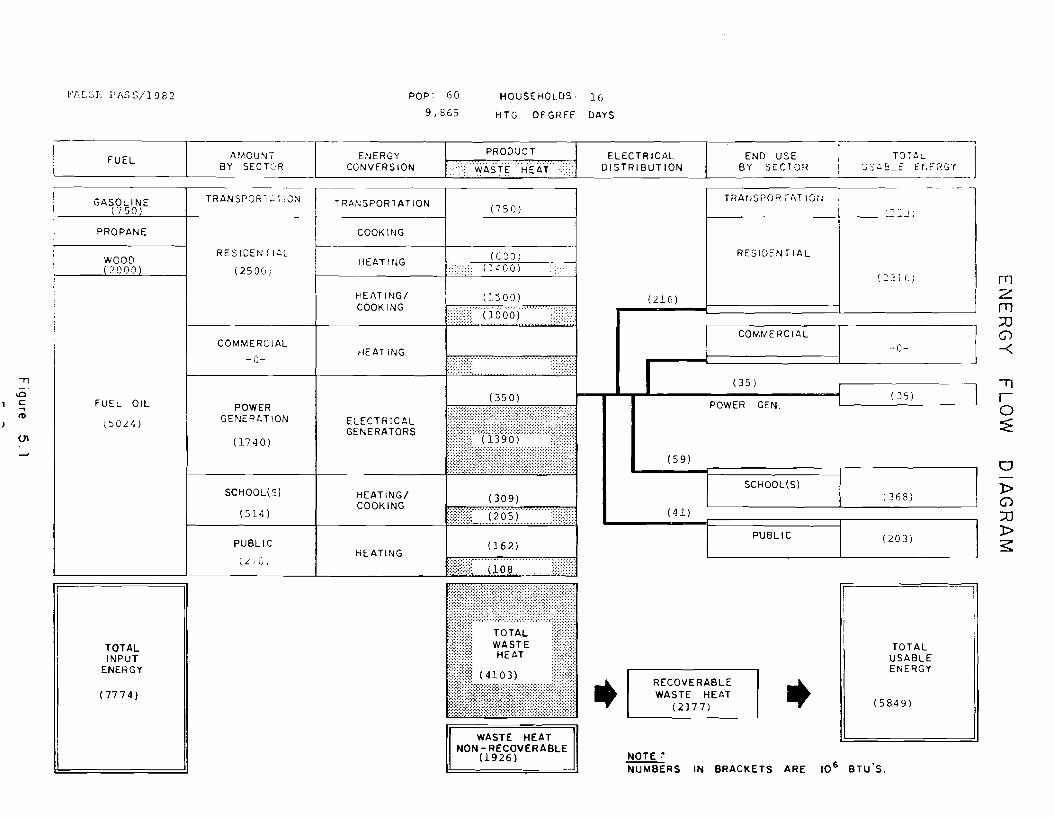
The flow of energy through the village is illustrated in
Figure 5.1. In 1982 it is estimated that 7,774 MMBTU of
fuel will enter False Pass in the form of gasoline, wood
and fuel oil. This fuel will be distributed to the various
sectors and used for transportation, cooking, heating and
electricity generation. The conversion of the fuel to its
end use will result in 53% or 4,103 MMBTU of energy lost as
heat. 53% of this waste heat could be recovered using
conservation and waste heat recovery practices. The actual
amount of energy used by each sector is listed in the last
column of the diagram.
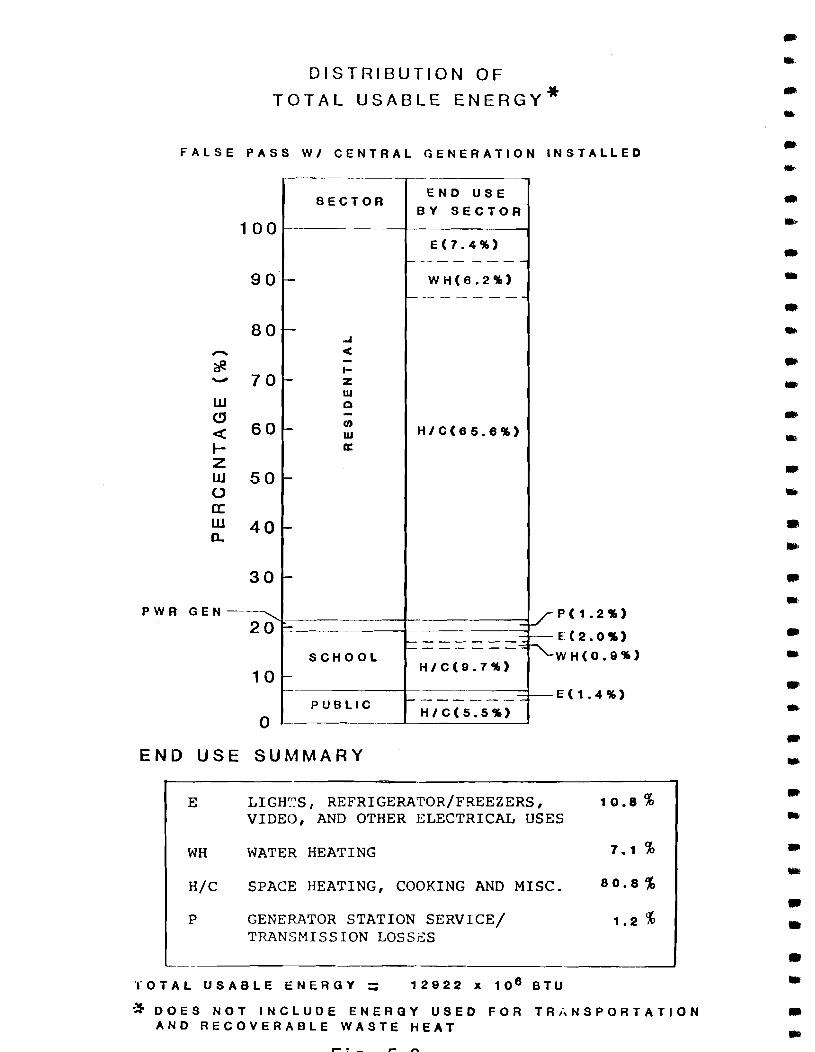
The 1982 projected distribution of useable energy, if a
central generation system is installed in the village, is
shown in Figure 5.2. The distribution represents the
quantity of energy that will be required by each sector
(excluding transportation) for electric lights and
appliances, water heating, space heating and cooking, and
generation station service. Percentages listed in the
figure can be multiplied by the useable energy of 12922 X
10 6 Btus to determine the projected energy requirements
for a 9articular end use in a given sector. These
projected energy requirements do not include energy
conversion losses and therefore represent the actual
quantity of energy required for each end use.
5.1
VILLl,GF: FALSE l'ASS/1982 ENERGY BALANCE
FUEL Oil GASOLINE PROPANE WOOD '//i-.S 1E TOTAL HE?;T E;JERG f
TC'T4L ELECTRICITY TCTt.L t-- E Sc..'"/-BTU BTU BTU
BTU E.Rt...2LE BTIJ 0/ SECTOR BTU BTU GAL • 10" LBS,
• 10" CORDS • 10· E::T I) A 106 ,.:)
GAL K !~ 6 0/0 MWH X 10" 0/0 x I 0 ~
'I 1815
RESIDENTIAL 18500 ,'" n (1 50 G-:t 216 62 :07 2000 2400 1200 23H 63
COMMERCIAL 0 0 0 0 0 0 0
PUBLIC 2000 270 5 12 41 12 108 54 203 6
lT1
SCHOOLS 3800 514 10 17 59 16 205 20 368 10
ElECTR ICAl 12900 GENERATION 1740 35 10 35 10 1390 903 35 1
TRANSPORTAT ION 6000 750 750 20
TOTAL 37200 5024 100 102 351 100 6000 750 107 2000 4103 2177 3672 100
*station service or distribution losses
Table 5.1
, I , , , . , . • I , . , , , I , I • • • I , , , , , . • • II , . , . • •
" _ . .0
1 C ..... til
r--I
FUEL AMOUN. ay SECFR l ________________ -L _________ _
PROPANE
FUEL OIL
(::' 0 24)
TOTAL INPUT
ENERGY
(7774)
TRANSPOR1.~ 1 ;ON
RESIDENTI.c.L
(2500;
COMMERCIAL
-lJ-
POWER GENERt.TION
(1740)
SCHOOL{S)
(514 )
PUBL I C
POP: 60 HOUSEHOLDS· 16
9,865 HTG. DEGREE DAYS
EI~ERGY
CONVERSION
TRA/';SPORTATION
COOK ING
(750)
~·----------~-----(G-C-:O--)----·-
HEATUJG <:>:<: (1400)
HEATINGI COOKING
HEAT ING
ELECTRICAL GENERATORS
HEATING/ COOKING
HEATING
(1500)
(350)
(309)
(162)
. : :.~( :: TOTAL
WASTE HEAT
:::
':::::::::::,:, 2ill::
(4103) .. ::::::::::::: .;:::;:::::::::::::::,:::::: ..
:::;::;:::::::::::::{::: .
WASTE HEAT NON - RECOVERABLE
(1926)
•
TRAtlSPOR rl;T IO~J
~ _____________ +-____ L~-~"~~j~ _______ _
RESIDENTIAL
(216)
COMMERCIAL
I (35 )
POWER GEN.
( 59)
(41)
RECOVERABLE WASTE HEAT
(2177)
NOTE :'
SCHOOL(S)
PUBLIC
• NUMBERS IN BRACKETS ARE
I I I
(:2 31 C)
-0-
( 35)
( 368)
(203)
TOTAL USABLE ENERGY
( 5849)
106 BTU'S.
-I I I
rrJ Z rn ::0 G)
-<
CJ
1> G)
::0 1> S
DISTRIBUTION OF
TOTAL USABLE ENERGY*
FALSE PASS WI CENTRAL GENERATION INSTALLED
-UJ (!J
« fZ UJ o a: UJ n.
1
P W R G E N --
00
90
80
70
60
50
40
30
20
10
0
------
SECTOR
i-
r-..A
< -I-r- z
w a -
'-tI)
w a:
r-
-
-
-SCHOOL
--
PUBLIC
END USE
BY SECTOR
E(7.4%) - -- - - - - --
WH(6.2 .. ) - -- - - - ---
H/C(6S.6cr.)
--------= -'= = = = = = :-:
H/C(9.7%)
r- -=-=-= - - --:: H/C(S.Scr.)
V I---
~
,.-
P(1.2cr.)
£-:(2.0cr.)
WH(O.Scr.)
E(1.4%)
END USE SUMMARY
E LIGHTS, REFRIGERATOR/FREEZERS, 10.8 % VIDEO, AND OTHER ELECTRICAL USES
WH WATER HEATING 7.1 %
H/C SPACE HEATING, COOKING AND MISC. 80.8%
P GENERATOR STATION SERVICE/ 1.2% TRANSMISSION LOSSES
-"OTAL USABLE ENERGY = 12922 x 10 6 BTU
* DOES NOT INCLUDE ENERGY USED FOR TRANSPORTATION AND RECOVERABLE WASTE HEAT
•
-•
• .. • -• -•
-• • •
• .. • .. • ..
•
• • • .. • ..
6.0 ENERGY FORECASTS
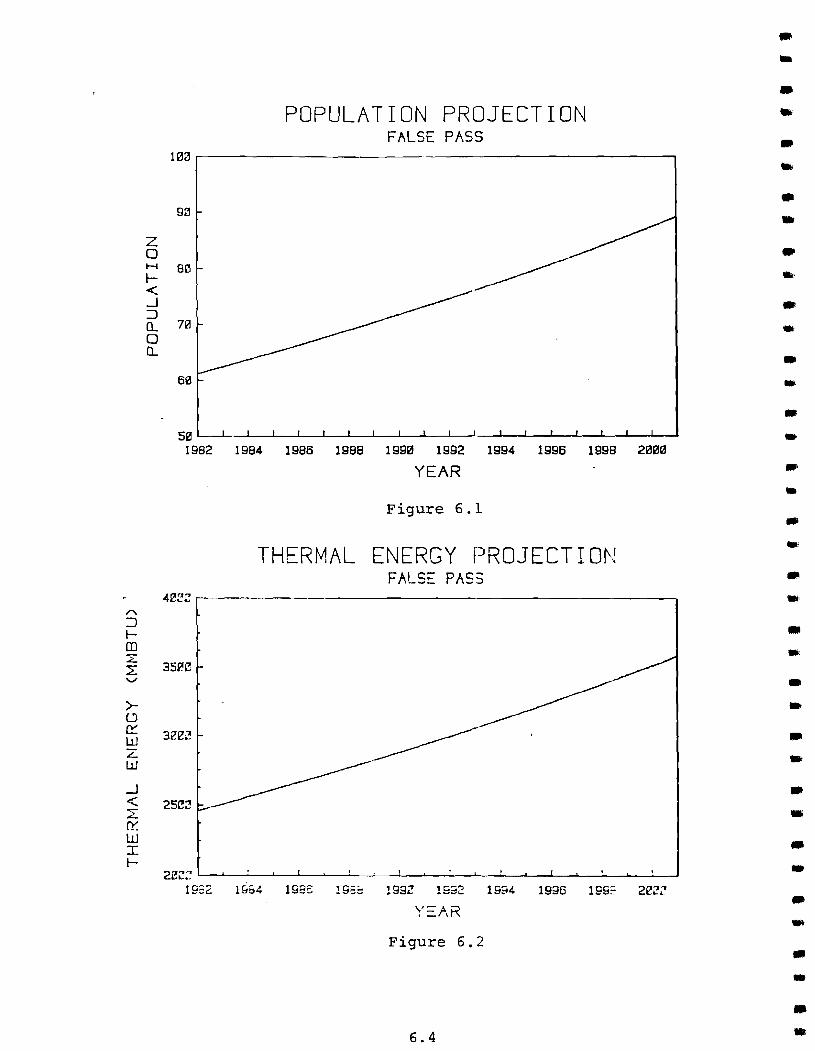
6.1 Population Projection
The population of False Pass was forecast for the
twenty year planning period based upon historical
population trends, expected changes resulting from
planned capital projects, and the villagers'
projections of the growth of their community.
Historical data from 1950 to 1980 approximates an
average annual growth rate of 2%. Capital projects
that would increase the current rate of growth are not
planned at this time, therefore, a 2% growth rate was
used in the projection.
Historical and projected populations are listed below.
Figure 6.1 illustrates the population projection over
the 20 year planning period.
Historical
1950 1960 1970 1980
42 41 62 65
6.2 Capital Projects Forecast
Projected
1990 2000 2010
75 8d 102
~s far as can be determined, no major capital
projects are imminent at False Pass. No details could
be obtained over the future of the cannery site.
Although the villagers would prefer to see the
facility rebuilt, the owners are undecided.
The State Department of Transportation proposes to
repair the runway but this will not have an effect on
6.1
the electrical or thermal energy requirements of the
community.
Some potential capital projects mentioned during the
village visit are as follows:
Airport
Schools
Cannery
The State Department of Transportation
plans to repair the runway to its full
3900 length.
The school plans to buy electrical power
from the Peter Pan Cannery as soon as
the cannery installs an additional
generator. The school will then operate
its current generator as backup.
Some of the cannery buildings burned in
March 1981. Plans are indefinite as to
whether or not these will be rebuilt and
operated in the future. Current cannery
plans are to install a 75 KW generator
to service remaining cannery building
needs and provide power for the school.
6.3 Thermal Energy Projection
Figure 6.2 presents the anticipated thermal energy
consumption of False Pass during the forecast period.
The thermal energy is provided by the combustion of
fuel oil and wood.
The proje~tions were based on fuel usage records, and
fuel use estimates, of the facilities in False Pass.
Details of the estimation methods and calculations are
6.2
• • .. • .. • .. .,
• .. .. • • • • .. •
.. -.. •
.. --.. .. .. -•
• -•
inc luded in the Jl1ain report.
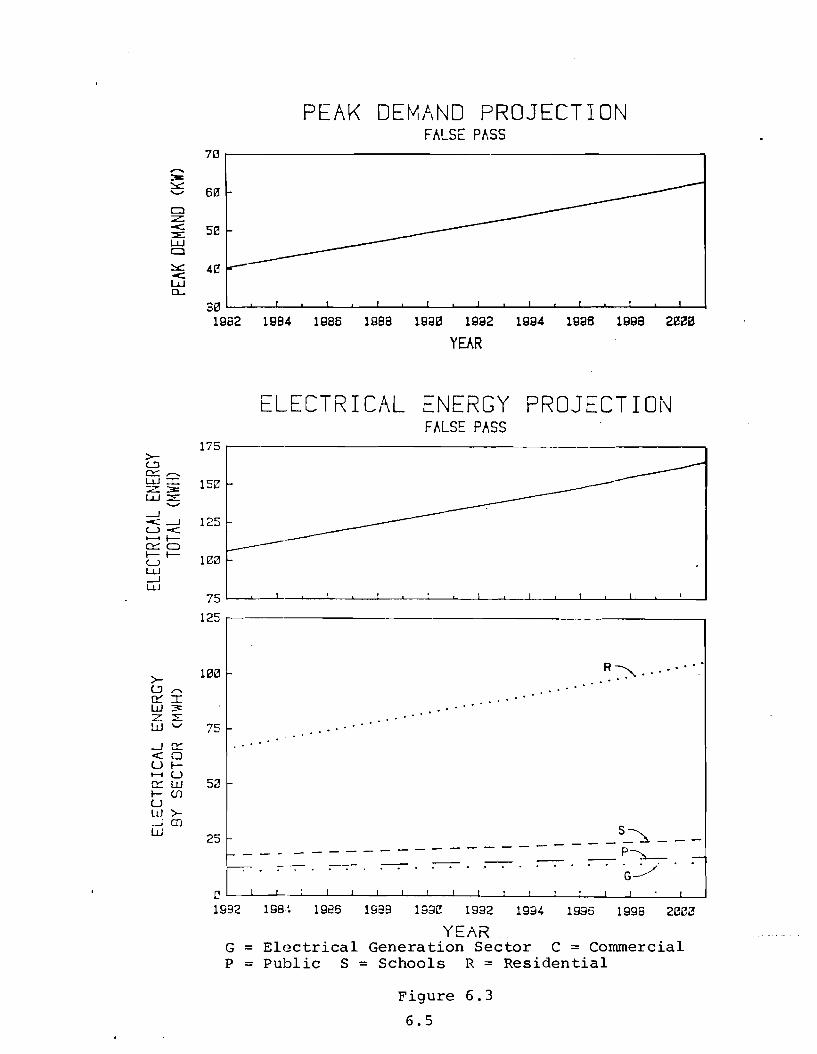
6.4 Ele~trical Energy and Peak Demand Projection
Fig~re 6.3 presents the anticipated electrical
enecgy consumption of False Pass, by sector, during
the forecast period. The projections were based on
the existing electrical loads, consumption records,
and estimates where accurate data were not available.
Det~ils of the estimation methods and calculations are
included in the main report.
6.3
A
:J I-m 'Z L: '-'
>-C) 0::: w z W
-1 < :z r::r w I I-
z a
POPULATION PROJECTION FALSE PASS
10~.------------------------------------------------,
g"
H 8(3 I-< -l :J Q 7~ a Q
60
seL-~·-L~--~-L~--~~~--~~--L~--~~~--~~~
1982 1984 1986 1988 199~ 1992 1994 1996 1998 20~~
YEAR
Figure 6.1
TH~RMAL ENERGY PROJECTION FALSE PASS
4~3Jr------------------------------------------------,
3Sp.e
3ee~
2S~~
2~~~~~~~--~~~--~~~--~~~~--~~~--~~-J
1932 1~o4 198~ 1982 1992 19~2 1994 1996 199~ 2~~~
':' =:,.A,R
Figure 6.2
6.4
• -• .. • .. • • • .' •
• -• -.. • . ' .. • -• -•
• -• • • -• -• •
,.... =-~ '-'
Cl Z -< :::E L.1.J Cl
~ -< L.1.J D...
-1 c::: <0 Ur....... U c::: w r-Ui U w>-.Jrn W
PEAK DEMAND PROJECTION FALSE PASS
7(3
63
S0
4(1
313 1982 1984 1986 1988 lSOla 1992 1994 19a6 199a 222B
YEAR
ELECTRICAL ENERGY PROJECTION FALSE PASS
175~----------------------------------------------~
153
125
t Hl0
75 ~--~~~--~--~--~~~--~~~~~~~~
125~----------------------------------------------~
75 . . .
52
. . . . . . . . . ...
. . . . . . . . . . . .
...
25 __________ Sp~ __ _ -------- - ~
r C-· .. -... -... -.... -. " .-. '.' . 'G~' .•
1932 199~ 1925 1989 19~:m 1992 199~ 1995 1998 2CC2
YEAR G = Electrical Generation Sector C = Commercial P = Public S = Schools R = Residential
Figure 6.3
6.5
7.0 ENERGY RESOURCE ASSESSMENT
Wind
False Pass is protected on the east and west sides by steep
mountain ranges. It is suspected that these mountains
cause turbulent, unsteady winds much of the year. Long
term wind data must be gathered before the feasilibity of
wind power in False Pass could be judged.
Wood
There are no trees at False Pass, but a small amount of
driftwood is gathered by village residents for home
heating. The use of driftwood for fuel in a central power
station would require high gathering cost and would not be
viable for power generation.
Coal
No coal deposits have been identified near False Pass.
Transportation charges to bring in coal from Anchorage are
high.
Peat
The Island of Unimak has large reserves of low quality
peat. The peat is not considered fuel quality due to the
high content of volcanic ash.
7.1
Geothermal
A small warm spring is located 1 mile west of the village.
The great distance from the hot springs and the
unpredictable changes in a volcanic area make development
of geothermal energy not feasible.
Solar
The sky has an average of 9/10 cloud cover every day of the
year. The low occurrence of cloud free days and low
intensity of radiation make even passive solar heating
unfeasible.
Hydropower
Although precipitation sustains a number of small streams
throughout the year, none of the streams have reasonable
potential for adequate hydroelectric generation.
A Corps of Engineers study completed in 1981 identified
potential hydroelectric power sites in the vicinity of
False Pass.
Alternate Plan B investigates the potential for hydro power
on the stream that is 3 miles west of the village.
7.2
.,
.,
., • • ., .,
-• -., -., ., .. .. • .. • -• -• • ., .. .,
-., -., -.,
.. ..
Conservation Measures
Waste Heat Capture
The majority of the energy in the fuel oil burned in a
diesel generator is lost as waste heat through the engine
cooling water, exhaust gases, and radiant heat from the
engine. Much of the waste heat can be reclaimed from the
engine cooling water and exhaust gas by transferring the
heat in heat exchangers to a secondary fluid, usually an
antifreeze solution. This is then pumped to buildings and
used in heaters for space heating.
Alternate Plan A, detailed in Section 8.2 of this report,
investigates the feasibility of waste heat recovery at
False Pass.
Weatherization
Homes and buildings built on the Alaska Peninsula in the
past have in general been poorly insulated and weatherized.
Heat loss from such buildings is high, in the forms of heat
Joss directly through the walls, floor, and ceiling, and by
the cold air that enters around leaky doors and windows.
Insulating and weatherizing a home can often cut the
heating fuel requirement in half or more, and make the
building more comfortable and liveable at the same time.
The materials required are inexpensive, and the skills
necessary for installation low. This work is perhaps the
most effective way of reducing village energy usage.
7.3
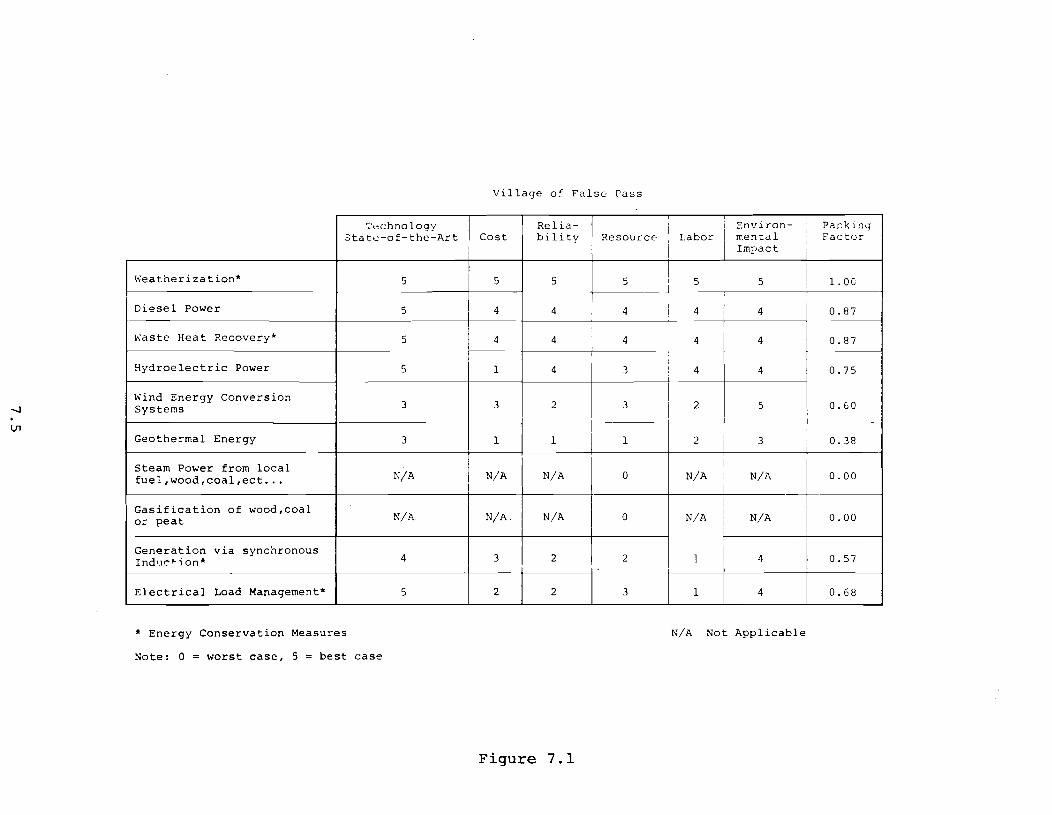
Technology Ranking
Figure 7.1 presents a ranking of the technologi?s that
could be applied to the village. Each technology was
examined on the basis of state-of-the-art quality of the
technology, cost, n~liability, resource, labor, and
environmental impact. Please refer to the main report for
the ranking methodology.
7.4
• • • .. • • • • • • • • • • • • .. -• • • • • • • • • .. .. .. • • • • • • • •
.....,J
Ul
T",chnology State-of-the-Art
h"eatherization* 5
Diesel Power 5
h"aste Heat Recovery* 5
Hydroelectric Power 5
Wind Energy Conversion 3 Systems
Geothermal Energy 3
Steam Power from local N!A fuel,wood,coal,ect ...
Gasification of wood,coal N/A or peat
Generation via synchronous IndlJe"t- i on* 4
Electrical Load Management* 5
* Energy Conservation Measures
Note: 0 = worst case, 5 = best case
Village of Fals0 Pass
Relia- I Re,ou,ce i i Environ- Rar.kinq
Cost bility Labor mental Factor Impact
5 5 ~-- 5 5 1. OC
I 4 4 4 I
4 I 4 0.87 I
4 4 4 4 4 0.87
1 4 3 4 4 0.75
3 2 3 2 5 : 0.60
1 1 1 2 3 0.38
N/A N/A 0 N/A N/A 0.00
N!A N/A 0 N/A N/A 0.00
3 2 2 1 4 0.57
2 2 3 1 4 0.68
N/A Not Applicable
Figure 7.1
8.0 ENERGY PLAN
8.1 Base Case
8.1.1 General Description
The base case plan for False Pass is to install a
central electrical generation plant.
A reconnaissance level study of the village indicated
that the centralized power system should include the
following components:
1. Two 50 KW diesel generators that would be used to
meet the major power demands.
2. A 30 KW diesel generator to be used for night and
summer time lower demands and as hackup.
3. A central power distribution systE~m operating at
7200 volts, single phase. This higher voltage
would minimize distribution loses and voltage drop
in the system through the use of step-up and step
down transformers. Single phase power of 120/240
volts would be provided to village residents.
4. Wntt meters at the service entrance of all power
users in order to provide equitable billing for all
consumers.
5. A 12' X 20' building that would house the
generators and electrical equipment.
8.1
8.1.2 Base Case Cost Analysis
The installation cost of the anticipated central
electric power plant was estimated to be $364,000.
The cost is itemized below:
Generators and Equipment
Fuel Storage
Generator Building
Shipping
Labor
Equipment Rental
Subtotal
Engineering
Project Management
Test
Contingency
Total Estimated Cost
64,600
3,500
120,000
7,400
18,400
50,000
263,20fJ
25,200
12,600
12,600
50, 40(~
$364,000
The plant value was amortized over a 20 year period.
Additional generation capacity was added, in
increments of 50 kw, as required by the growing peak
demand. The cost of additional generation capacity
was estimated to be $1650/kw.
The cost of fuel oil was set at $9.6~/MMBTU, ba3ed on
a fuel cost of $1.30/gallon. Operatcon and
maintenance expenses were estimated dt 8~/kwh.
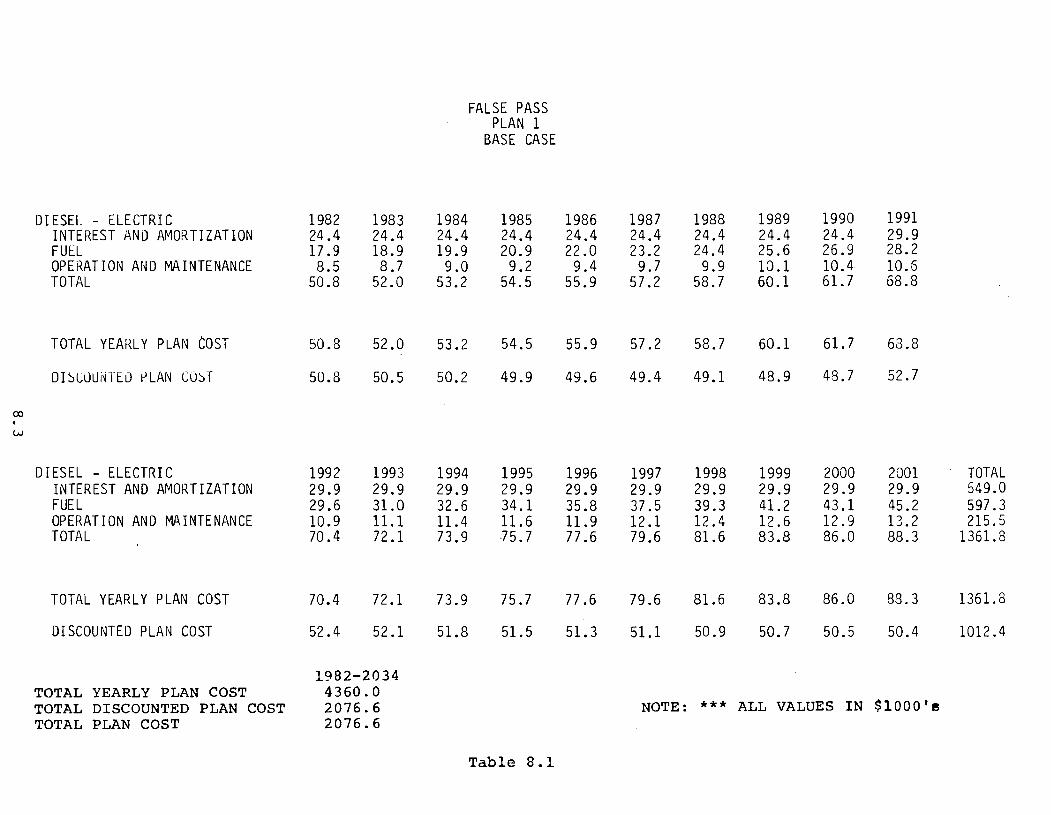
Table 8.1 presents the i temized pres.~nt value a r1alysis
of the base case for the 20 year study period. The
discounted 20 year present value was $1,012,400.
8.2
• .. • .. • ....
l1li' .. III'
• • .. • • • .. • • • .. • .. .. •
• .. • • • .. • • • .. • ..
co . w
DIESEL - ELECTRIC INTEREST AND AMORTIZATION FUEL OPERATION AND MAINTENANCE TOTAL
TOTAL YEARLY PLAN COST
DI~CUUNTEO ~LAN CU~T
DIESEL - ELECTRIC INTEREST AND AMORTIZATION FUEL OPERATION AND MAINTENANCE TOTAL
TOTAL YEARLY PLAN COST
DISCOUNTED PLAN COST
TOTAL YEARLY PLAN COST TOTAL DISCOUNTED PLAN COST TOTAL PLAN COST
1982 24.4 17.9 8.5
50.8
50.8
50.8
1992 29.9 29.6 10.9 70.4
70.4
52.4
1983 24.4 18.9 8.7
52.0
52.0
50.5
1993 29.9 31.0 11.1 72.1
72 .1
52.1
1982-2034 4360.0 2076.6 2076.6
1984 24.4 19.9 9.0
53.2
53.2
50.2
1994 29.9 32.6 11.4 73.9
73.9
51.8
FALSE PASS PLAN 1
BASE CASE
1985 24.4 20.9 9.2
54.5
54.5
49.9
1995 29.9 34.1 11.6 .] 5.7
75.7
51.5
Table 8.1
1986 24.4 22.0 9.4
55.9
55.9
49.6
1996 29.9 35.8 11.9 77 .6
77 .6
51. 3
1987 24.4 23.2 9.7
57.2
57.2
49.4
1997 29.9 37.5 12.1 79.6
79.6
51.1
1988 24.4 24.4 9.9
58.7
58.7
49.1
1998 29.9 39.3 12.4 81.6
81.6
50.9
1989 24.4 25.6 10.1 60.1
60.1
48.9
1999 29.9 41.2 12.6 83.8
83.8
50.7
1990 24.4 26.9 10.4 61.7
61.7
48.7
2000 29.9 43.1 12.9 86.0
86.0
50.5
1991 29.9 28.2 10.6 68.8
68.8
52.7
2001 29.9 45.2 13.2 88.3
88.3
50.4
NOTE: *** ALL VALUES IN $lOOO'e
TOTAL 549.0 597.3 2l5.5
1361.8
1361.8
1012.4
8.1.3 Social and Environmental Evaluation
Base Case Plan Summary: Operation of anticipated
central diesel generation
1) Community Preference: At the time of the village
visit there was no central generation system. The
villagers are requesting that central generation
be installed to reduce their cost of electricity
and increase its availability and reliability.
Central generation has been assumed as the base
case.
2) Environmental Considerations:
i) Air Quality: Exhausting combustion gases
releases a small amount of pollutants to the
local environment, but the impact is
minimal.
ii) Noise: The exhaust stacks from the generator
produce a considerable amount of noise. The
installation of more effective mufflers would
reduce the noise level.
iii) Water Quality: No impact.
iv) Fish and Wildlife Impacts: No known impact.
v) Terrestrial Impacts: There is no impact on
vegetation or soils.
vi) Land Use and Ownership Status: All leases
and permits are in place.
8.4
• .. ., • • .. • .. • • •
WI
• .. .. -•
.. • • • • --.. , .. , • • -• ..

8.1.4 Base Case Technical Evaluation
The anticipated operation of the centJ'al diesel
electric power plant in False Pass is expected to
conform as follows:
1. High Reliability. Diesel electric is a well
proven well understood technology with a
successful history in rural Alaska. Backup
generation allows maintenance operations on the
generators to be performed without major power
interruption. Occasional system downtime is
expected for distribution system naintenance.
2. Safety. A small risk is realized by the stora~e
and handling of fuel oil. Normal risks associated
with electrical power are also pr'~sent.
3. Availability. There are no indic~tions that spare
parts will become difficult to obtain in the
future. The availability of fuel to the power
plant depends on the reliability of transportation
to the village.
8.5
8.2 Alternate Plan A
8.2.1 General Description
The Alternate Plan A for False Pass is the
installation of a waste heat recovery system installed
at the anticipated central electric power plant, with
the following features:
1. Jacket water heat recovery equipment installed on
the two 50 KW generators.
2. A distribution system consisting of pumps, piping
and valves to deliver the ethylene glycol heat
transfer fluid to the heated buildings and return
it to the power plant.
3. Heating equipment installed in the school and
community center buildings, to provide space
heating.
4. A control system that automatically regulates the
supply of heat to the buildings, and rejects any
surplus waste heat to the engine radiators.
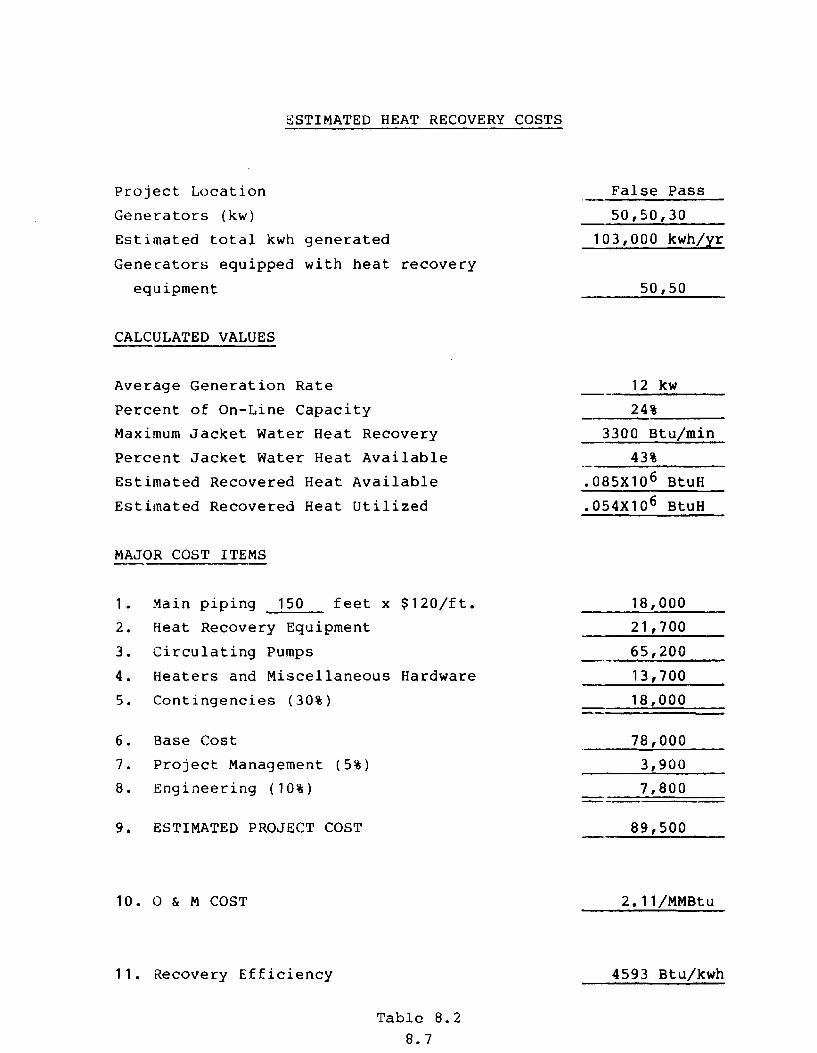
8.2.2 Alternate A Cost Analysis
Table 8.2 presents the itemized, estimated cost to
install the jacket water heat recovery system.
The installation cost of the heat recovery system was
estimated to be $89,500. The system value was
amortized over a 10 year period.
8.6
• .. • •
.. .. •
• •
-.. ...
• ..
-• • • • •
..
•
., •
ESTIMATED HEAT RECOVERY COSTS
Project Location
Generators (kw)
Estimated total kwh generated
Generators equipped with heat recovery
equipment
CALCULATED VALUES
Average Generation Rate
Percent of On-Line Capacity
Maximum Jacket water Heat Recovery
Percent Jacket Water Heat Available
Estimated Recovered Heat Available
Estimated Recovered Heat Utilized
MAJOR COST ITEMS
1. Main piping 150 feet x $120/ft.
2. Heat Recovery Equipment
3. Circulating Pumps
4. Heaters and Miscellaneous Hardware
5. Contingencies (30%)
6. Base Cost
7. Project Management (5%)
8. Engineering (10%)
9. ESTIMATED PROJECT COST
10. 0 & M COST
11. Recovery Efficiency
Table 8.2
8.7
False Pass
50,50,30
103,000 kwh/yr
50,50
12 kw
24%
3300 Btu/min
43%
.085X10 6 BtuH
.054Xl0 6 BtuH
18,000
21,700
65,200
13,700
18,000
78,000
3,900
7,800
89,500
2.11/MMBtu
4593 Btu/kwh
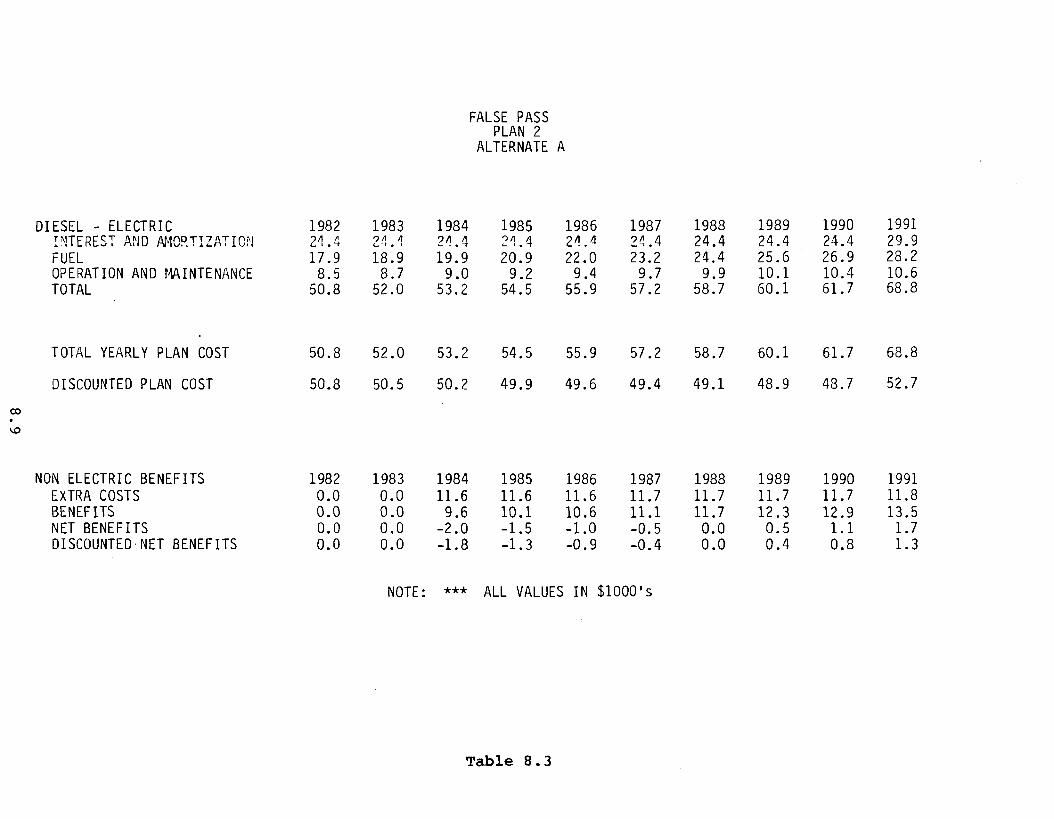
The cost of fuel oil normally used for space heating,
which was offset by the captured waste heat, was set
at $9.63/MMBTU, based on a fuel oil cost of
$1.30/gallon. Operation and maintenance costs were
calculated to be $2.11/MMBTU waste heat captured.
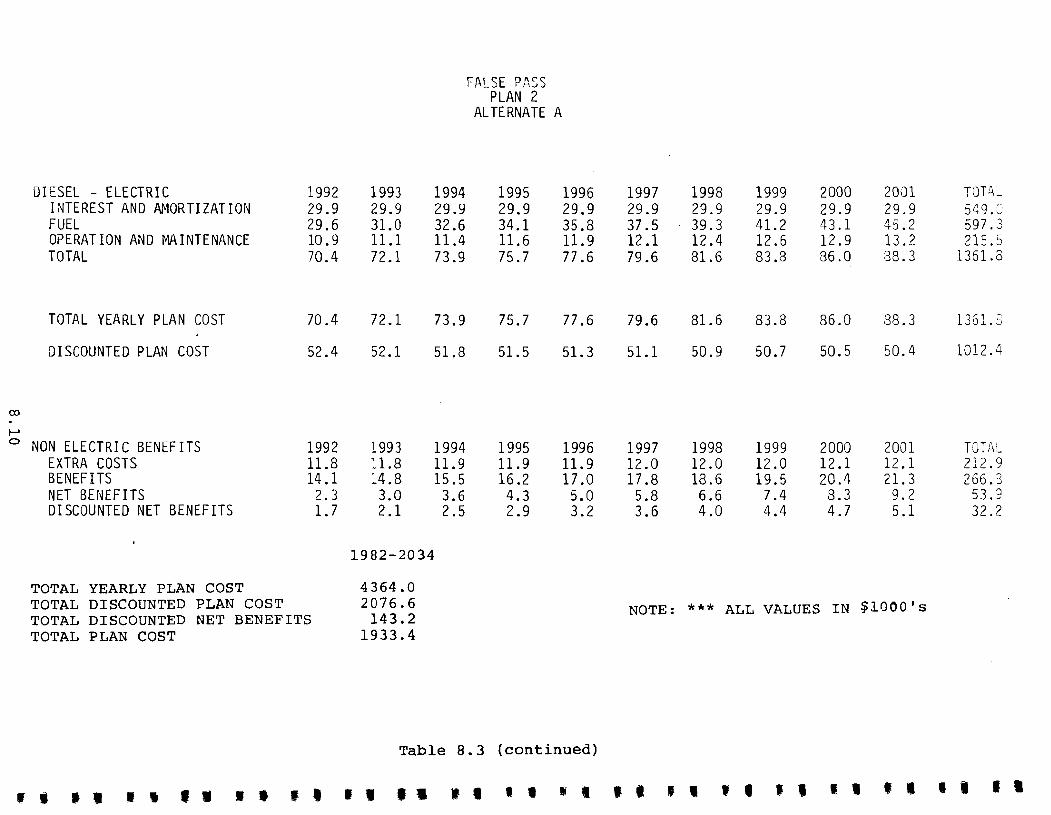
Table 8.3 presents the itemized present value
analysis of the plan, for the 20 year study
period. The discounted net benefit of the
system was $32,200.
8.2.3 Social and Environmental Evaluation
Alternate Plan A Summary: waste heat capture from
anticipated central generators for sale to major
consumers.
1) Community Preference: The villagers of False Pass
recognize that the installation of waste heat in
conjunction with a central power plant will
improve the efficiency of fuel use in the
community.
Installation of the waste heat capture system will
require local expertise and should provide a
number of jobs during the construction phase. The
system should operate with minimal maintenance
although one part time person would be required
until the system has been tested and initial minor
problems have been solved.
8.8
• • • -• WI!
• • .. • .. .. .. -.. Ilk
• • • •
• •
• •
• • III ..
DIESEL - ELECTRIC 1982 1983 !~!TEREST AND Ar10~TIZATIO~1 21.4 ?II 11 '- ~-r. I
FUEL 17.9 18.9 OPERATION AND t1AINTENANCE 8.5 8.7 TOTAL 50.8 52.0
TOTAL YEARLY PLAN COST 50.8 52.0
DISCOUNTED PLAN COST 50.8 50.5
co . \.0
NON ELECTRIC BENEFITS 1982 1983 EXTRA COSTS 0.0 0.0 BENEFITS 0.0 0.0 NET BENEFITS 0.0 0.0 DISCOUNTED-NET BENEFITS 0.0 0.0
NOTE:
1984 2~.4 19.9
9.0 53.2
53.2
50.2
1984 11.6 9.6
-2.0 -1.8
FALSE PASS PLAN 2
ALTERNATE A
1985 21.4 20.9
9.2 54.5
54.5
49.9
1985 11.6 10.1 -1.5 -1. 3
1986 1987 2~.1.l 2~.4 22.0 23.2 9.4 9.7
55.9 57.2
55.9 57.2
49.6 49.4
1986 1987 11.6 11.7 10.6 11.1 -1.0 -0.5 -0.9 -0.4
*** ALL VALUES IN $1000'5
Table 8.3
1988 1989 1990 1991 24.4 24.4 24.4 29.9 24.4 25.6 26.9 28.2 9.9 10.1 10.4 10.6
58.7 60.1 61.7 68.8
58.7 60.1 61.7 68.8
49.1 48.9 48.7 52.7
1988 1989 1990 1991 11.7 11.7 11.7 11.8 11.7 12.3 12.9 13.5 0.0 0.5 1.1 1.7 0.0 0.4 0.8 1.3
co
r-o
DIESEL - ELECTRIC INTEREST AND AMORTIZATION FUEL OPERATION AND MAINTENANCE TOTAL
TOTAL YEARLY PLAN COST
DISCOUNTED PLAN COST
o NON ELECTRI C BENEF ITS EXTRA COSTS BENEFITS NET BENEF ITS DISCOUNTED NET BENEFITS
TOTAL YEARLY PLAN COST
1992 29.9 29.6 10.9 70.4
70.4
52.4
1992 11.8 14.1 2.3 1.7
TOTAL DISCOUNTED PLAN COST TOTAL DISCOUNTED NET BENEFITS TOTAL PLAN COST
1993 29.9 31.0 11.1 72 .1
72.1
52.1
1993 11.8 14.8 3.0 2.1
1982-2034
4364.0 2076.6 143.2
1933.4
1994 29.9 32.6 11.4 73.9
73.9
51.8
1994 11.9 15.5 3.6 2.5
FALSE PASS PLAN 2
ALTERNATE A
1995 29.9 34.1 11.6 75.7
75.7
51.5
1995 11.9 16.2 4.3 2.9
1996 29.9 35.8 11.9 77 .6
77 .6
51.3
1996 11.9 17.0 5.0 3.2
Table 8.3 (continued)
1997 29.9 37.5 12.1 79.6
79.6
51.1
1997 12.0 17.8 5.8 3.6
1998 29.9 39.3 12.4 81.6
81.6
50.9
1998 12.0 18.6 6.6 4.0
1999 29.9 41.2 12.6 83.8
83.8
50.7
1999 12.0 19.5
7.4 4.4
2000 29.9 43.1 12.9 86.0
86.0
50.5
2000 12.1 20.4 8.3 4.7
2001 29.9 45.2 13 .2 38.3
38.3
50.4
2001 12.1 21. 3 9.2 5.1
NOTE: *** ALL VALUES IN $1000'5
TOTi\_ 549.C 597.3 215.5
1361.3
1361.3
1012.4
TO-:-AL 212.9 266.3 53.9 32.2
• I" w, •• ., , •• 1.1 II •• ,1.1 ., '. " I, .• ,. ••
2) Environmental Considerations:
i) Air Quality: There will be a' reduction in
fuel consumption in the village resulting in
reduced hydrocarbon, monoxi~es and nitrogen
oxide emissions.
ii) Noise Levels: No impact.
iii) Water Quality: There would be a minor impact
if a major leakage occurred in the coolant
system.
iv) Fish and Wildlife Impacts: None.
v) Terrestrial Impacts: Will be: minimal during
the installation of the distribution system
and will be restricted to the: village site.
vi) Land use and Ownership Status:: It is assumed
that the village will make the necessary . arrangements for the right of: way
requirements for the distribution system.
8.2.4 Alternate Plan A Technical Evaluation
Operation of the waste heat recovery system in False
Pass, in conjunction with the central power plant, is
expf'cted to conform to the following ekpectations: ,
1. High Reliability. The system utilizes simple, ,
reliable components that are readi1y available off
the shelf from a variety of source~ • . 2. Safety. A well maintained systeM has a very low
hazard potential.
8.11
3. Availability. All componentf needed are available
immediately. The system is lelatively easy to
implement.
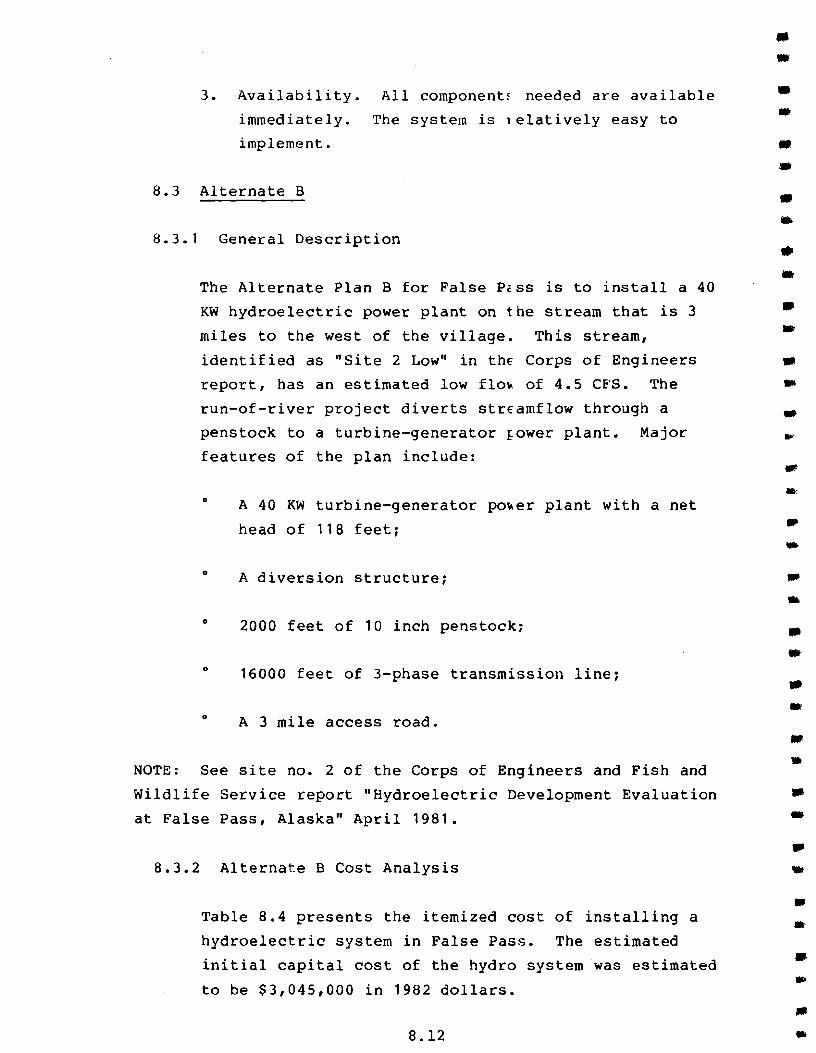
8.3 Alternate B
8.3.1 General Description
The Alternate Plan B for False PiSS is to install a 40
KW hydroelectric power plant on the stream that is 3
miles to the west of the village. This stream,
identified as "Site 2 Low" in the Corps of Engineers
report, has an estimated low flo~ of 4.5 CFS. The
run-of-river project diverts streamflow through a
penstock to a turbine-generator 10wer plant. Major
features of the plan include:
o
o
o
o
o
A 40 KW turbine-generator po~er plant with a net
head of 118 feet~
A diversion structure~
2000 feet of 10 inch penstock;
16000 feet of 3-phase transmission line~
A 3 mile access road.
NOTE: See site no. 2 of the Corps of Engineers and Fish and
Wildlife Service report "Hydroelectric Development Evaluation
at False Pass, Alaska" April 1981.
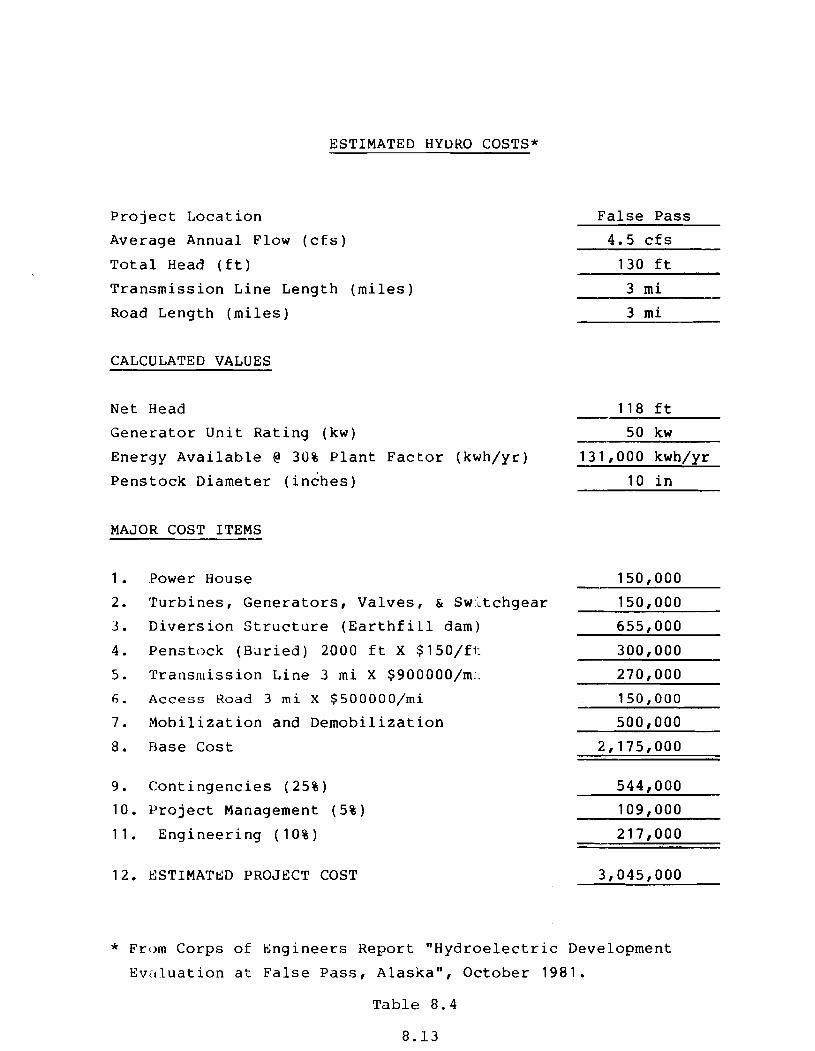
8.3.2 Alternate B Cost Analysis
Table 8.4 presents the itemized cost of installing a
hydroelectric system in False Pass. The estimated
initial capital cost of the hydro system was estimated
to be $3,045,000 in 1982 dollars.
8.12
• -• • • • • .. • • • --.,
• .. -• •
-• • III -.. .. • •
•
ESTIMATED HYDRO COSTS*
Project Location
Average Annual Flow (cfs)
Total Head (ft)
Transmission Line Length (miles)
Road Length (miles)
CALCULATED VALUES
Net Head
Generator Unit Rating (kw)
Energy Available @ 30% Plant Factor (kwh/yr)
Penstock Diameter (inches)
MAJOR COST ITEMS
1. Power House
2. Turbines, Generators, Valves, & Switchgear
3. Diversion Structure (Earthfill dam)
4. Penstock (Buried) 2000 ft X $150/f1:
5. 'l'ransmission Line 3 mi X $900000/m:.
6. Access Road 3 mi X $500000/mi
7. Mobilization and Demobilization
8. Base Cost
9. Contingencies (25%)
10. Project Management (5%)
11. Engineering (10%)
12. ESTIMAT~D PROJECT COST
False Pass
4.5 cfs
130 ft
3 mi
3 mi
118 ft
50 kw
131,000 kwh/yr
10 in
150,000
150,000
655,000
300,000
270,000
150,000
500,000
2,175,000
544,000
109,000
217,000
3,045,000
* From Corps of Engineers Report "Hydroelectric Development
Ev~luation at False Pass, Alaska", October 1981.
Table 8.4
8.13
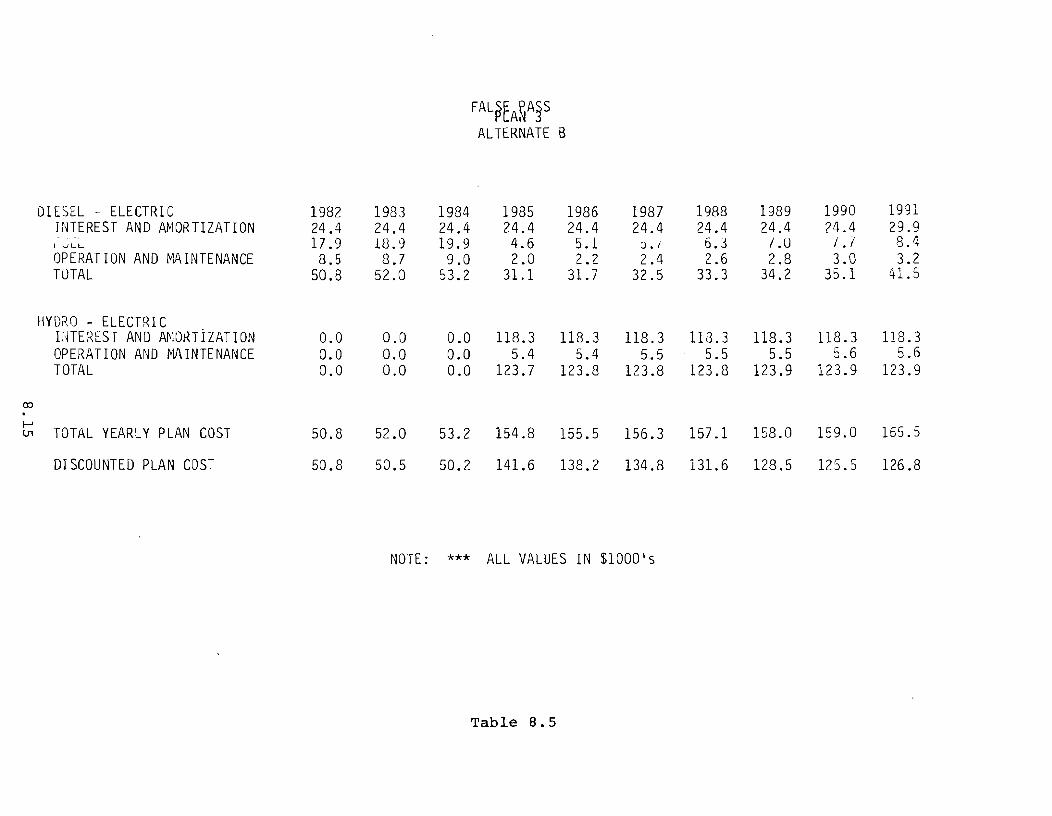
The hydro project is planned for completion in 1984
• • -•
and is expected to have a useful life of 50 years. In -
False Pass diesel generation will be required to
supplement hydro during periods of low flow.
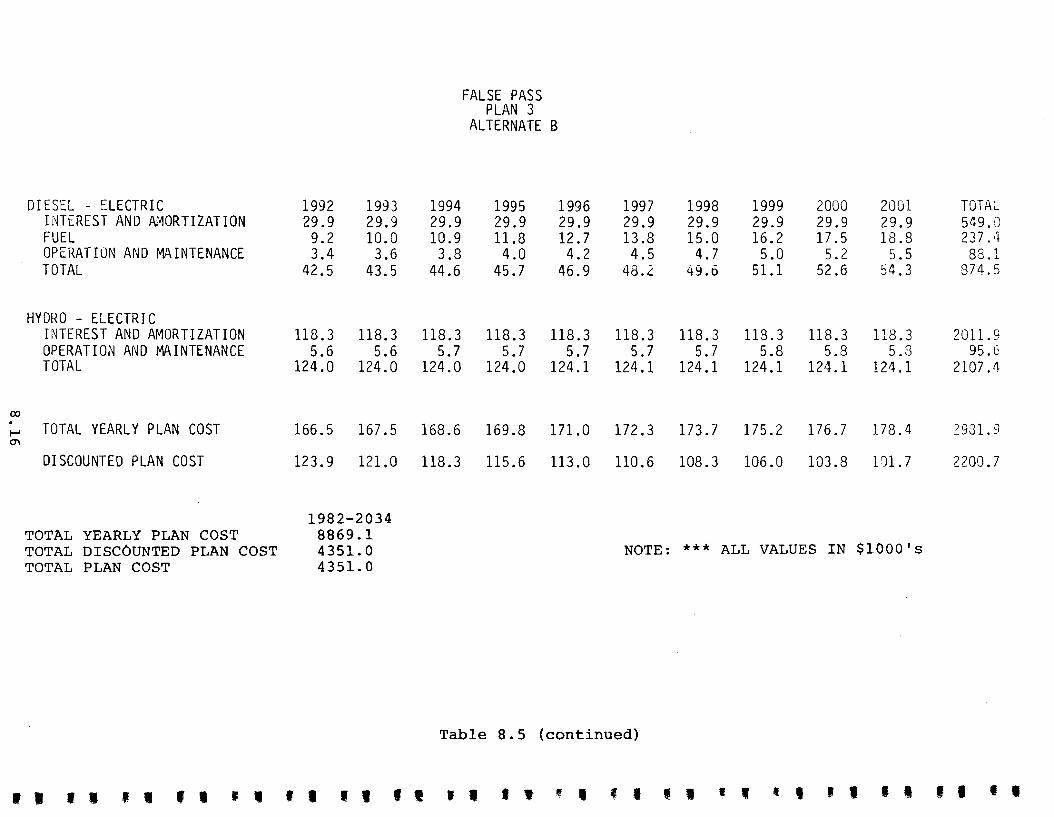
Table 8.5 presents an itemized present worth analysis
of the plan for the 20 and 50 year study periods.
The discounted present worth of the plan is
$2,200,700 and $4,351,000, respectively.
8.3.3 Social and Environmental Evaluation
Alternate Plan Summary
1) Community Preference: Village interest is high
for hydro electric power as the primary
alternative to diesel. The low O&M and
reliability of the system are important
considreations. Also, there is the potential for
excess power production which would be available
for either local commercial developments or
possibly resistance heating.
Installation of a hydro facility would provide
several jobs locally during the construction phase
and a part time position for a person to operate
and maintain the system.
The community is strongly in favor of a
feasibility study to determine an accurate cost
and fully access the potential of the proposed
installation, if the preliminary reconnaissance
level study indicates that there is an economic
basis for proceeding.
8.14
.. -•
.. -.. .' ., -•
.. • • • • • ., .. • • • • •
DIESEL - ELECTRIC 1982 INTEREST AND A~10RTlZATlON 24.4 i vLL 17.9 OPERATION AND rv'AINTENANCE 8.5 TOTAL 50.8
HYDRO - ELECTRIC INTEREST AND A~10RTiZATlON 0.0 OPERATION AND ~~INTENANCE 0.0 TOTAL 0.0
co . /--'
TOTAL YEARLY PLAN COST U'1 50.8
DISCOUNTED PLAN COST 50.8
1983 1984 24.4 24.4 18.9 19.9 8.7 9.0
52.0 53.2
0.0 0.0 0.0 0.0 0.0 0.0
52.0 53.2
50.5 50.2
FAL~tANA1S ALTERNATE B
1985 1986 24.4 24.4 4.6 5.1 2.0 2.2
31.1 31.7
118.3 118.3 5.4 5.4
123.7 123.8
154.8 155.5
141.6 138.2
1987 24.4
:J • I
2.4 32.5
118.3 5.5
123.8
156.3
134.8
NOTE: *** ALL VALUES IN tl000's
Table B. 5
1988 1989 1990 1991 24.4 24.4 24.4 29.9 6.3 1.0 / . 1 8.4 2.6 2.8 3.0 3.2
33.3 34.2 35.1 41.5
118.3 118.3 118.3 118.3 5.5 5.5 5.6 5.6
123.8 123.9 123.9 123.9
157.1 158.0 159.0 165.5
131.6 128.5 125.5 126.8
co . ,.....
'"
DIESEL - ELECTRIC INTEREST AND Ar~ORTIZATION FUEL OPERATION AND MAINTENANCE TOTAL
HYDRO - ELECTRIC HJTEREST AND AMORTIZATION OPERATION AND MAINTENANCE TOTAL
TOTAL YEARLY PLAN COST
DISCOUNTED PLAN COST
TOTAL YEARLY PLAN COST TOTAL DISCOUNTED PLAN COST TOTAL PLAN COST
1992 1993 29.9 29.9 9.2 10.0 3.4 3.6
42.5 43.5
118.3 118.3 5.6 5.6
124.0 124.0
166.5 167.5
123.9 121.0
1982-2034 8869.1 4351. 0 4351. 0
1994 29.9 10.9 3.8
44.6
118.3 5.7
124.0
168.6
118.3
FALSE PASS PLAN 3
ALTERNATE B
1995 1996 29.9 29.9 11.8 12.7
4.0 4.2 45.7 46.9
118.3 118.3 5.7 5.7
124.0 124.1
169.8 171.0
115.6 113.0
1997 29.9 13.8 4.5
48.2
118.3 5.7
124.1
172.3
110.6
1998 1999 2000 2001 29.9 29.9 29.9 29.9 15.0 16.2 17.5 18.8 4.7 5.0 5.2 5.5
49.6 51.1 52.6 54.3
118.3 113.3 118.3 118.3 5.7 5.8 5.8 5.8
124.1 124.1 124.1 124.1
173.7 175.2 176.7 178.4
108.3 106.0 103.8 101. 7
NOTE: *** ALL VALUES IN $1000's
Table 8.5 (continued)
TOTAL 549.0 237.4 88.1
874.5
2011.9 95.6
2107.4
2931. 9
2200.7
II •• 11.1" 11.1'. 'I ,. 'I ,.,",., II II II ,.
2) Environmental Considerations:
i) Air Quality: There will be a slight
improvement in air quality because the
diesels will be relegated to a back up role.
ii) Noise: Levels will be almost eliminated
except when the diesels are run for testing
or when operating in their capacity as a
backup to the hydro.
iii) Water Quality: No impact.
iv) Fish and wildlife: The small diversion dam
will not have an appreciable effect, although
detailed investigation of stream use would
have to be conducted during a possible
feasibility study.
v) Terrestrial Impacts: Will be associated with
the road construction to the diversion dam
site, the diversion dam construction (assumed
to be rock crib type), the penstock route,
powerhouse and transmission line to the
village.
vi) Land Use and Land Ownership Status: The dam
site is on land administered by the Fish and
Wildlife Service. Either the village would
expand its land selections to include the
site and corridor or the necessary permission
would have to be sought from Fish and
Wildlife.
8.17
8.3.4 Alternate Plan B Technical Evaluati0n
A hydro electric power plant operating in False Pass
is expected to conform to the following:
1. Reliable. A possible power shortage could occur
if a dry season causes low flow.
2. Safety. A well maintained systen will present
little hazard to operators or viJlage residents.
3. Availability. Construction wou16 utilize
conventional well established construction
practices. Replacement parts would be
difficult to obtain at the remotE Alaska
site.
8.18
.. . ' -.. • .. .. • .. .. .' .. • .. .. .,
•
.,
..
.,
.. .. • • .. . ' •
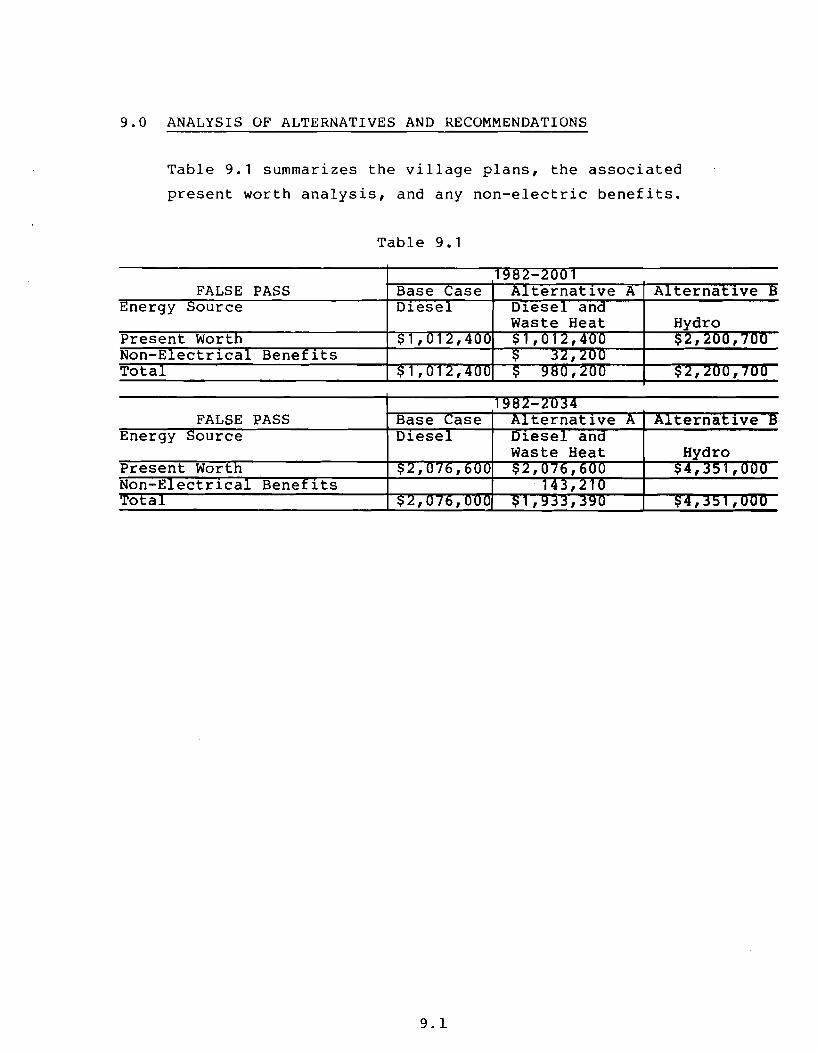
9.0 ANALYSIS OF ALTERNATIVES AND RECOMMENDATIONS
Table 9.1 summarizes the village plans, the associated
present worth analysis, and any non-electric benefits.
Table 9. 1
FALSE PASS Base ternatlve Energy ource Dlese
Present Worth Non-E Tota
FALSE PASS Energy ource
9.1
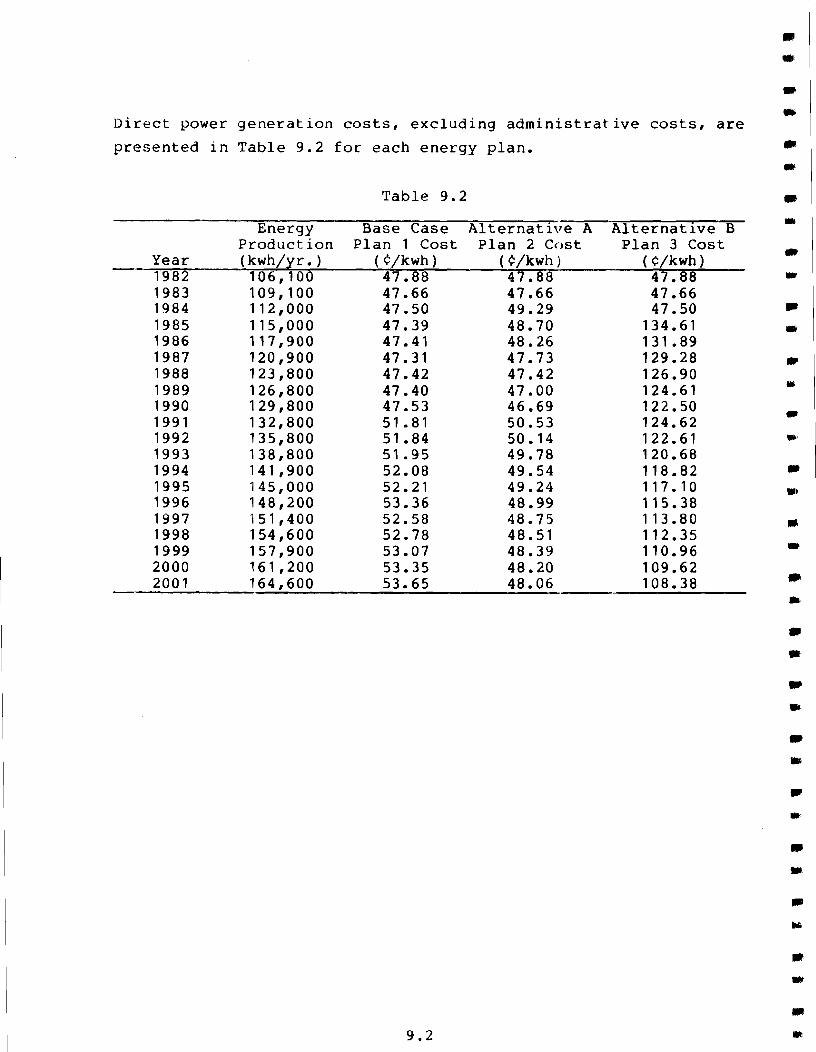
Direct power generation costs, excluding administrative costs, are
presented in Table 9.2 for each energy plan.
Table 9.2
Energy Base Case Alternative A Alternative B Production Plan 1 Cost Plan 2 Cost Plan 3 Cost
Year (kwh/;r:r. ) (¢/kwh) (¢/kwh) (¢/kwh) 1982 106,100 47.88 47.88 47.88 1983 109,100 47.66 47.66 47.66 1984 112,000 47.50 49.29 47.50 1985 115,000 47.39 48.70 134.61 1986 117,900 47.41 48.26 131 .89 1987 120,900 47.31 47.73 129.28 1988 123,800 47.42 47.42 126.90 1989 126,800 47.40 47.00 124.61 1990 129,800 47.53 46.69 122.50 1991 132,800 51 .81 50.53 124.62 1992 135,800 51.84 50.14 122.61 1993 138,800 51.95 49.78 120.68 1994 141,900 52.08 49.54 118.82 1995 145,000 52.21 49.24 117.10 1996 148,200 53.36 48.99 115.38 1997 151,400 52.58 48.75 113.80 1998 154,600 52.78 48.51 112.35 1999 157,900 53.07 48.39 110.96 2000 161,200 53.35 48.20 109.62 2001 164,600 53.65 48.06 108.38
9.2
• • .. .. • .. .. -WI
• • •
.. •
-•
• • • • .. at
.,
• .. • ..
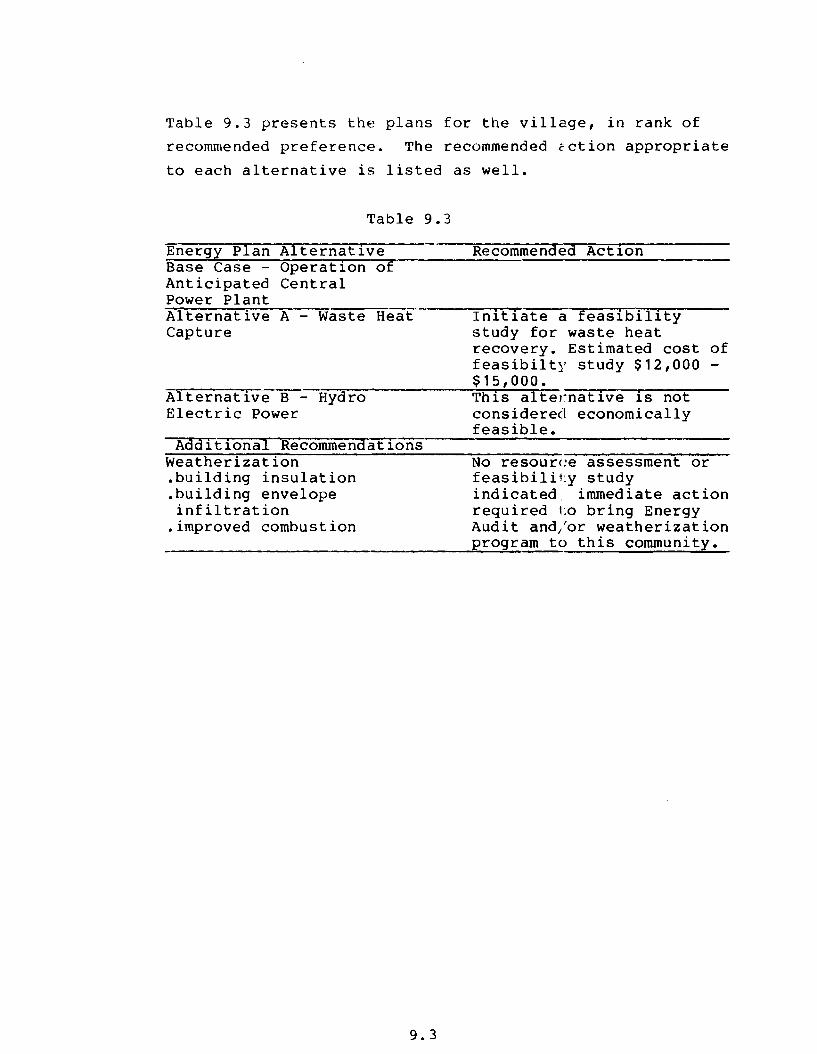
Table 9.3 presents the plans for the village, in rank of
recommended preference. The recommended Ection appropriate
to each alternative is listed as well.
Table 9.3
Energy Plan Alternative Base Case - Operation of Anticipated Central Power Plant Alternative A - Waste Heat Capture
Alternative B - Hydro Electric Power
Additional Recommendatlons Weatherization .building insulation .building envelope infiltration
.improved combustion
9.3
Recommended Actlon
Initiate a feasibility study for waste heat recovery. Estimated cost of feasibilty study $12,000 -$15,000. Th is al te}~nat ive is not considered economically feasible.
No resource assessment or feas ibil i l:y study indicated. immediate action required to bring Energy Audit and/or weatherization program to this community.
Reconnaissance studies are necessarily preliminary in nature,
however, it is apparent that there is great potential for a
waste heat capture system in False Pass. Sale of the waste heat
will realize increased revenues to the utility which will
decrease the cost of production for electricity. Currently
(1981-82) electricity costs are estimated to be 47.88~ per KWH
based on $1.30 a gallon for fuel and assuming that a central
generation and distribution system is installed. The fuel is
supplied by Standard Oil and barged to False Pass from the
distribution center in Seattle. The computer model used in the
reconnaissance study projected that the 1982-83 cost of
production for electricity will be approximately 47.88~ per KWH.
The study suggested that a waste heat capture system would be
installed, and become operational in 1983-84. It was assumed
that the waste heat would replace fuel oil, which costs $1.30
per gallon, used for space heating.
Therefore it is recommended that a waste heat capture system be
installed. The reconnaissance study estimates that the system
has the potential to save up to 4,000 gallons of fuel oil in the
first full year of operation.
9.4
• • • • .. .. •
• • • .' •
•
• • ... • • .. • .. .. •
•
• • • • • ..
APPENDIX.
See Section 3.0 (Methodology) of the Main Report:
RECONNAISSANCE STUDY OF ENERGY REQUIREMENTS AND ALTERNATIVES
FOR THE VILLAGES OF
Aniak, Atka, Chefornak, Chignik Lake, Cold Bay, False Pass,
Hooper Bay, Ivanof Bay, Kotlik, Lower and Upper Kalskag,
Mekoryuk, Newtok, Nightmute, Nikolski, St. George, St. Marys,
St. Paul, Toksook Bay, and Tununak.
REPlY TO
ATTENTION OF
NPAEN-PL-R
Mr. Eric YOll1d
DEPARTMENT OF THE ARMY ALASKA DISTRICT. CORPS OF ENGINEERS
po. BOX 7002
ANCHORAGE. ALASKA 99510
APR - 2 1982
334 West 5th Averue Anchorage, Alaskc 99501
Dear Mr. Yould:
3 1 MAR 1982
Thank you for thE opportunity to review your draft energy reconnaissance reports for FY lS82. In general, we found the reports to be comprehensive and potentially he1pful in our planning studies for both hydropower ana boat harbors. We would appreciate copies of the fina1 reports when they are available.
We have limited our comments to the reports that considered the areas we are most fami1iar with; however, some of the ccmments may apply to the other reports as I'lell. The attached pages list specific corranents for various communities.
If we can be of further assistanc~ please feel free to contact Mr. Loran Baxter of my staff at 552-3461.
Sincerely,
1 Incl ~k~--As stated Chief, Engineering Division
.,
Comments
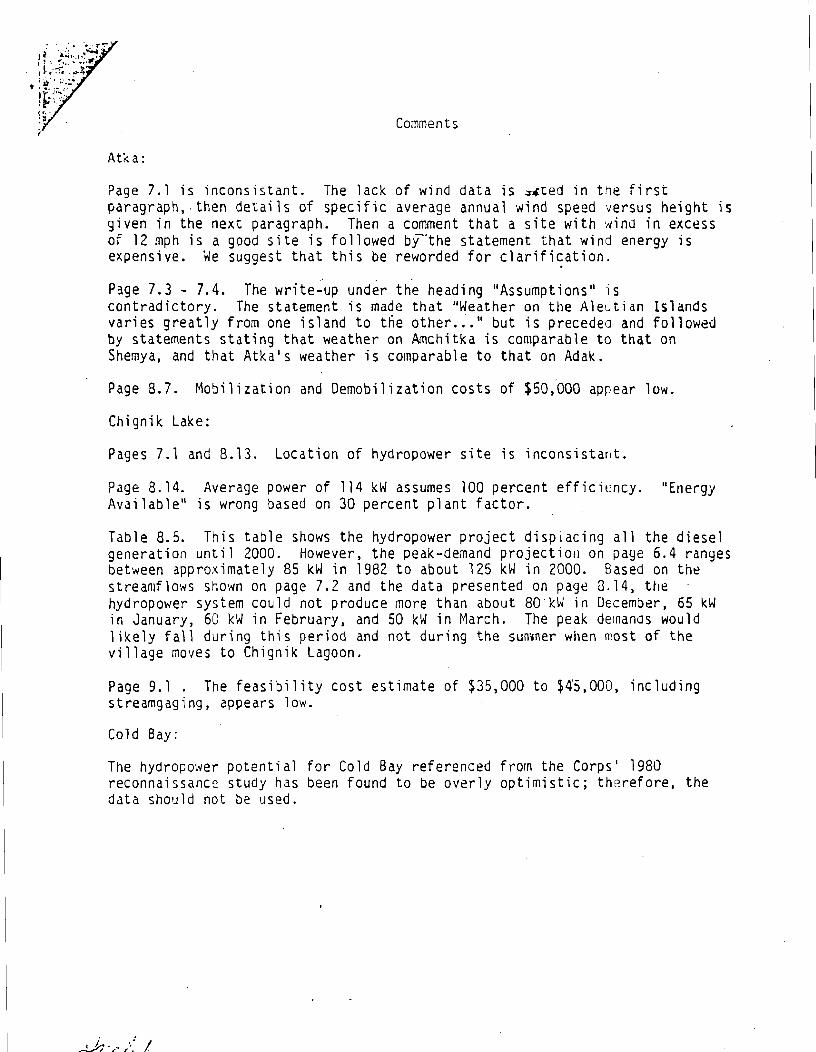
Atka:
Page 7.1 is inconsistant. The lack of wind data is .":I.ted in the first paragraph,.then details of specific average annual wind speed versus height is given in the next paragraph. Then a comment that a site with wind in excess of 12 mph is a good sHe is fo 11 owed by"the statement that wi nd energy is expensive. We suggest that this be reworded for clarifi~ation .
. ' .'
Page 7.3 - 7.4. The write-up under the heading "Assumptions" is contradictory. The statement is made that "Weather on the Aleutian Islands varies greatly from one island to tfie other .•. " but is preceded and followed by statements stating that weather on Amchitka is comparable to that on Shemya, and that Atka's weather is comparable to that on Adak.
Page S.7. Mobilization and Demobilization costs of $50,000 appear low.
Chignik Lake:
Pages 7.1 and S.13. Location of hydropower site ;s inconsistant.
Page 8.14. Average power of 114 kW assumes 100 percent efficiency. "Energy Available" is wrong based on 30 percent plant factor.
Table 8.5. This table shows the hydropower project displacing all the diesel generation until 2000. However, the peak-demand projectioll on page 6.4 ranges between approximately 85 kW in 1982 to about 125 kW in 2000. Based on th~ streamflows sho'.'m on page 7.2 and the data presented on page 3.14, the hydropower system could not produce more than about 80kW in December, 65 kW in January, 60 kW in February, and 50 kW in March. The peak delnanas would likely fall during this period and not during the summer when most of the village moves to Chignik Lagoon.
Page 9.1 . The feasibility cost estimate of $35,000 to $45,000, including streamgaging, appears low.
Cold Bay:
The hydropO\ ... er potential for Cold Bay referenced from the Corps' 1980 reconnaissanc~ study has been found to be overly optimistic; therefore, the data should not be used.
I / •. '.
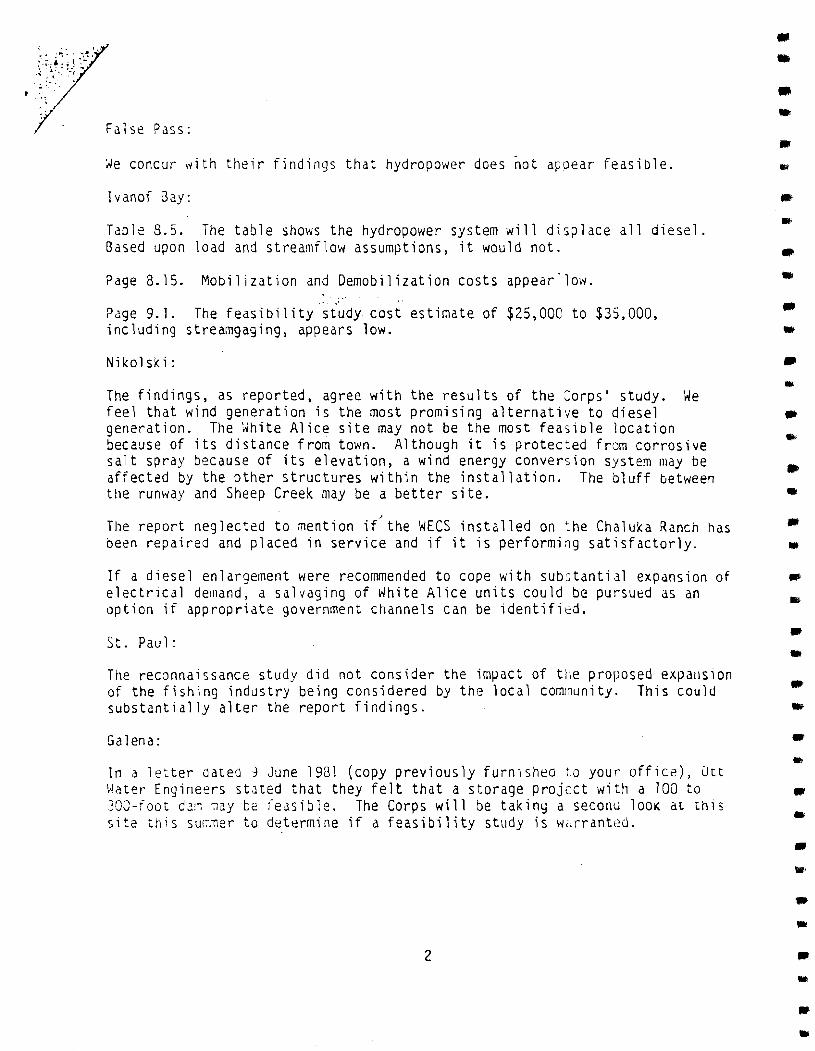
False Pass:
~e concur with their findings that hydropower does ~ot appear feasible.
Ivanof 3.3.y:
Table B.S. The table shows the hydropower system will displace all diesel. Based upon load and streamflow assumptions, it would not.
Page 8.15. Mobilization and Demobilization costs appear' low. " .. '
Page 9.1. The feasibility study cost estimate of $25,000 to $35,000, including streamgaging, appears low.
Nikolski:
The findings, as reported, agree with the results of the :orps' study. We feel that wind generation is the most promising alternative to diesel generation. The White Alice site may not be the most feasiole location because of its distance from town. Although it is protected from corrosive salt spray because of its elevation, a wind energy conversion system may be affected by the other structures within the installation. The bluff between the runway and Sheep Creek may be a better site.
The report neglected to mention if~the WECS installed on ~he Chaluka Ranch has been repaired and placed in service and if it is performing satisfactorly.
If a diesel enlargement were recommended to cope with substantial expansion of electrical de!lland, a salvaging of White Alice units could be pursued as an option if appropriate government channels can be identified.
St. Paul:
The reconnaissance study did not consider the impact of ttle proposed expansion of the fishing industry being considered by the local coml~unity. This coulll substantially alter the report findings.
Galena:
In a letter dated 9 June 1981 (copy previously furnished to your office), utt Water Engineers stated that they felt that a storage project with a 100 to 300-foot dam may te feasible. The Corps will De taking a seconu lOOK at this site this SUI~;ner to determine if a feasibility study is w"rranted.
2
• • • ..
• .. .. .. •• • • • • • ...
.. • •
.. .. • .' •
..
.,
7·~;'··'
..
•..... .£. . c'· ~ . . - . ,.. .
i Gustavus:
The National Park Service has been directed to coo~erate with the Corps of Engineers to determine the feas'ibility of hydroelect~ic power on Fa11s Creek. An initial field trip and public meeting is tentatiV~'y scheauled for mid-i·1ay. He will be installing a streamgage this surrmtr.
New Chenega:
The study indicates that it would be possible to construct a hydropower system at the site above the San Juan fish hatchery. It is our understanding that San Juan Aquaculture is going to construct a new hydropower system at this site for their personal use. We suggest you call Mr. Mike Hall with R.w. Retherford Associates at 274-6551. He is involved with the proposed deve 1 opment.
3
Reply to Department of the Army, Alaska District, Corps of
Engineers, letter dated 3/31/82.
Atka
p. 7.1 (draft) Statements concerning wind resoures have been
clarified.
p. 7.3-7.4 (draft) Because of the lack of climatic data from the
Aleutian Islands, it is necessary to extrapolate data from the
nearest recording station. However, variability in the local
climate means that all extrapolations are conservative.
p. 8.7 (draft) Cost estimates for mobilization and
demobilization have been adjusted to reflect Anchorage prices
for equipment rather than those quoted from Adak.
Chignik Lake
p. 7.1 - 8.13 (draft) The distance has been corrected.
8.14 (draft) The energy available value has been corrected.
Table 8.5 (draft) The table presented in the final report
illustrates the use of diesel powered generators when there is a
projected short fall.
p. 9.1 The feasibility study estimates have been addressed
especially in light of the comments from the U. S. Fish and
Wildlife Service which are included above.
Cold Bay
The hydropower data was included as part of the resource
assessment and was the determining factor for our not including
an alternative plan which was based on hydro.
False Pass
No comment necessary.
Ivanof Bay
Table 8.5 The hydropower scenario calls for the construction of
a small dam and creates a reservoir. Without extensive field
work, it has not been possible to show that this would be
inadequate to meet the estimated demand of the village.
p. 8.15 Mobilization costs have been increased.
p. 9.1 Feasibility study figures have been increased especially
in light of the comments and requirements of the U. S. Fish and
Wildlife Service which are included above.
Nikolski
The White Alice site was considered because excellent
foundations exist and the site is removed from the influence of
salt spray. The bluff between the runway and Sheep Creek has
been reconsidered and discussed with representatives of the
village. The result has been the suggestion that the bluff site
is a viable alternative and marginally less costly to develop
because of a shorter transmission distance. However, this is
largely offset by anticipated foundation problems at the bluff
site.
WECS at the Chaluka Ranch was not in operation when the field
team was in the village.
The diesel set from the White Alice site was purchased by the
utility; however, its condition was uncertain and the engine was
being stored outside.
St. Paul
As the role of the National Marine Fisheries in the Pribilofs is
curtailed, the future of the islands' economies is uncertain.
The proposed boat harbor has not been funded, as yet, and no
data was available which would enable predictions to be made as
to its effect on the local economy and power requirements.
Therefore a scenario including the possible development of such
facilities was not included.
• III
• .. • .. .,
• • .. .. .. .. .,
•
., .. • • .. • .. .. .. .. • .. •
IN REPLY REFER TO:
WAES
United States Department of the Interior
FISH AND WILDLIFE SER VICE Western Alaska Ecological Services
733 W. 4th Avenue, Suite 101 Anchorage, Alaska 99501 B 1;.0 I; lY 1:. D. _
(907) 271-4575 -
APR_ 91982 Mr. Eric P. Yould Executive Director Alaska Power Authority 334 West 5th Avenue Anchorage, Alaska 99501
AtWcA fOWER AIJJ110BlJ! I APR 1982
Dear Mr. Yould:
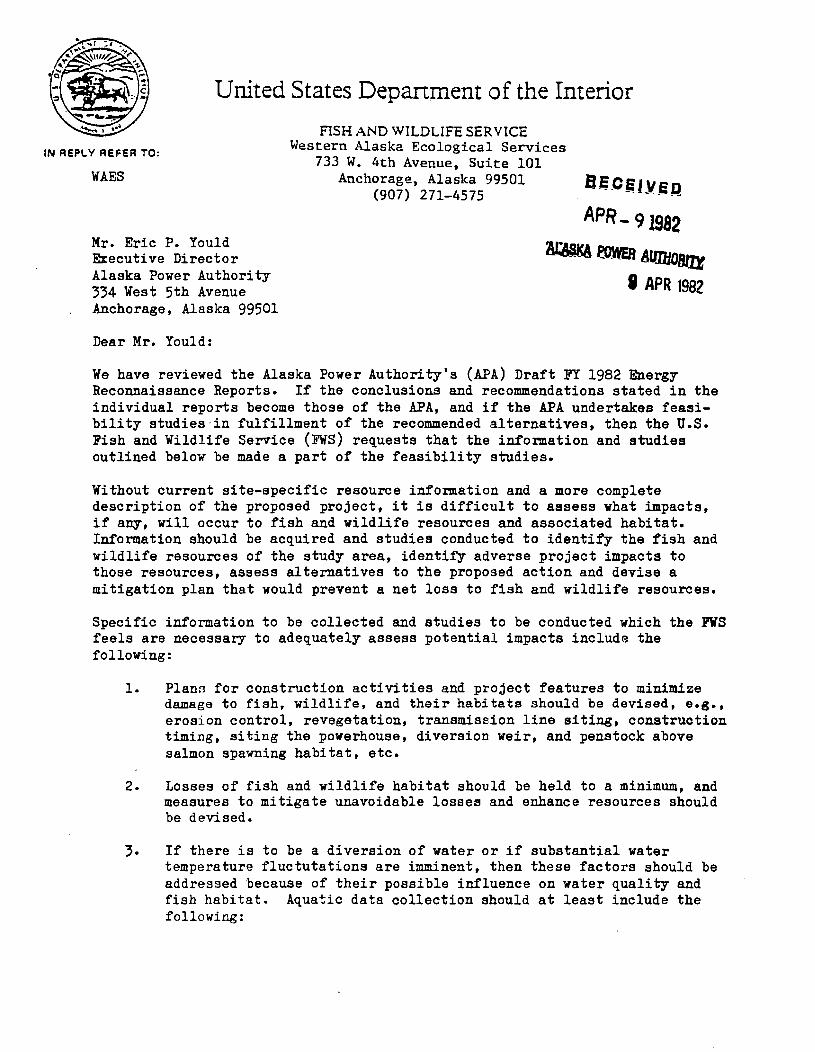
We have reviewed the Alaska Power Authority's (APA) Draft FY 1982 Energy Reconnaissance Reports. If the conclusions and recommendations stated in the individual reports become those of the APA, and if the APA undertakes feasibility studies'in fulfillment of the recommended alternatives, then the U.S. Fish and Wildlife Service (FWS) requests that the information and studies outlined below be made a part of the feasibility studies.
Without current site-specific resource information and a more complete description of the proposed project, it is difficult to assess what impacts, if any, will occur to fish and wildlife resources and associated habitat. Information should be acquired and studies conducted to identify the fish and wildlife resources of the study area, identify adverse project impacts to those resources, assess alternatives to the proposed action and devise a mitigation plan that would prevent a net loss to fish and wildlife resources.
Specific information to be collected and studies to be conducted which the FWS feels are necessary to adequately assess potential impacts include the following:
1. Plans for construction activities and project features to minimize damage to fish, wildlife, and their habitats should be devised, e.g., erosion control, revegetation, transmission line siting, construotion timing, siting the powerhouse, diversion weir, and penstock above salmon spawning habitat, etc.
2. Losses of fish and wildlife habitat should be held to a minimum, and measures to mitigate unavoidable losses and enhance resources should be devised.
3. If there is to be a diversion of water or if sUbstantial water temperature fluctutations are imminent, then these factors should be addressed because of their possible influence on water quality and fish habitat. Aquatic data collection should at leaat include the following:
Page 2
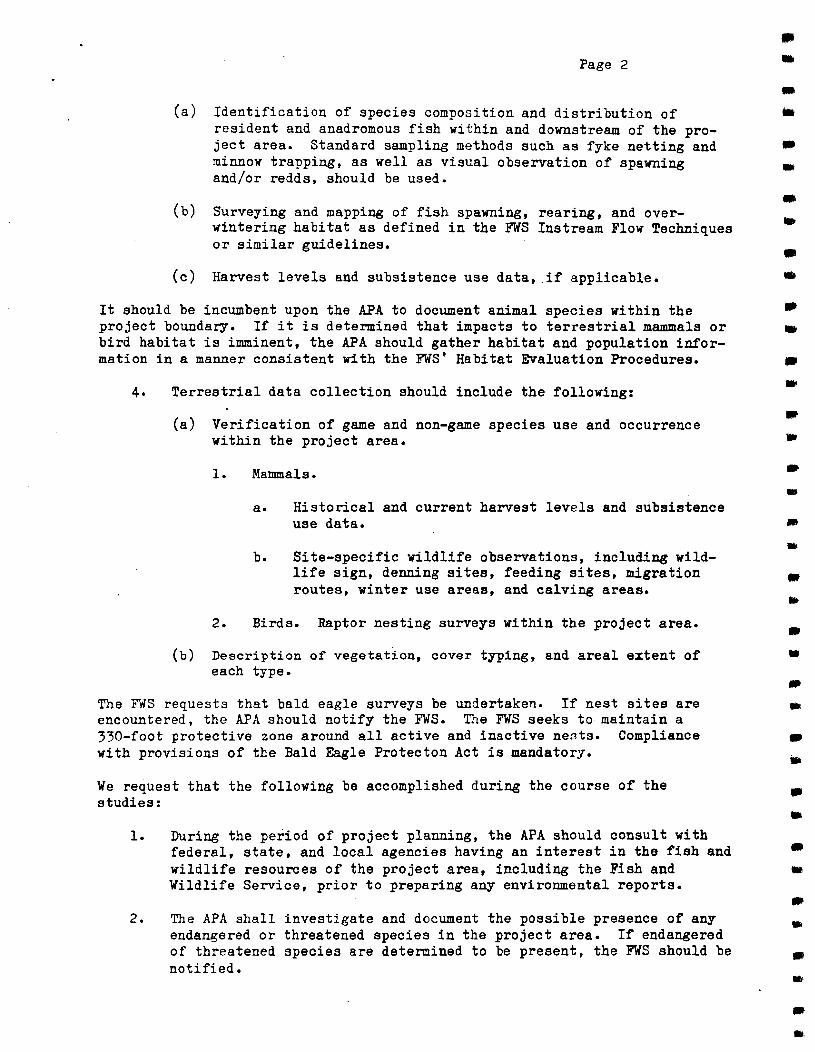
(a) Identification of species composition and distribution of resident and anadromous fish within and downstream of the project area. Standard sampling methods such as fyke netting and minnow trapping, as well as visual observation of spawning and/or redds, should be used.
(b) Surveying and mapping of fish spawning, rearing, and overwintering habitat as defined in the FWS Instream Flow Techniques or similar guidelines.
(c) Harvest levels and subsistence use data, .if applicable.
III .. • .. • • • .. • ..
It should be incumbent upon the APA to document animal species within the • project boundary. If it is determined that impacts to terrestrial mammals or .. bird habitat is imminent, the APA should gather habitat and population infor-mation in a manner consistent with the FWS' Habitat Evaluation Procedures. •
Terrestrial data collection should include the following:
(a) Verification of game and non-game species use and occurrence within the project area.
2.
Mammals.
a.
b.
Historical and current harvest levels and subsistence use data.
Site-specific wildlife observations, including wildlife sign, denning sites, feeding sites, migration routes, winter use areas, and calving areas.
Birds. Raptor nesting surveys within the project area.
(b) Description of vegetation, cover typing, and areal extent of each type.
The FWS requests that bald eagle surveys be undertaken. If nest sites are encountered, the APA should notify the FWS. The FWS seeks to maintain a 330-foot protective zone around all active and inactive nests. Compliance with provisions of the Bald Eagle Protecton Act is mandatory.
We request that the following be accomplished during the course of the studies:
1.
2.
During the period of project planning, the APA should consult with federal, state, and local agencies having an interest in the fish and wildlife resources of the project area, including the Fish and Wildlife Service, prior to preparing any environmental reports.
The APA shall investigate and document the possible presence of any endangered or threatened species in the project area. If endangered of threatened species are determined to be present, the FWS should be notified.
.. • .. • III!
•
• •
• ., • .. .. • ., II'
• •
• •
Page 3
3. The APA shall design and conduct at project cost, as soon as practicable, preparato~ studies in cooperation with the FWS and the Alaska Department of Fish and Game. These studies shall include, but not be limited to, the above aquatic and terrestrial data. The studies shall also identify and evaluate general measures to avoid, offset, and/or reduce adverse project-caused impacts on fish and wildlife resources. Information from these fish and wildlife related studies shall be provided to the concerned state and federal resource agencies.
Future correspondence on this, or other projects proposed by the APA should include a clear map, in sufficient detail to show the exact location of the project. This will enable the FWS to accurately determine whether or not Interior managed lands are involved.
It is the desire of the FWS to work with the APA to resolve any concerns relating to fish, wildlife, and other resources. If it is determined that the project will result in resource impacts, the FWS will assist the APA in attempting to modify the project to alleviate or mitigate any adverse effects.
Please feel free to contact me if you have any questions regarding our suggested feasibility studies.
Sincerely,
~~ Field Supervisor

Reply to J.5. Fish and Wildlife Service letter, undated.
Environmental work to fulfill the information requirements
detailed by FWS is included in the estimates for feasibility
studies.
Alaska Power Authority J44 W. 5th Avenue, Second Floor Anchorage, AK 99501
Dear Ms. Dejong:
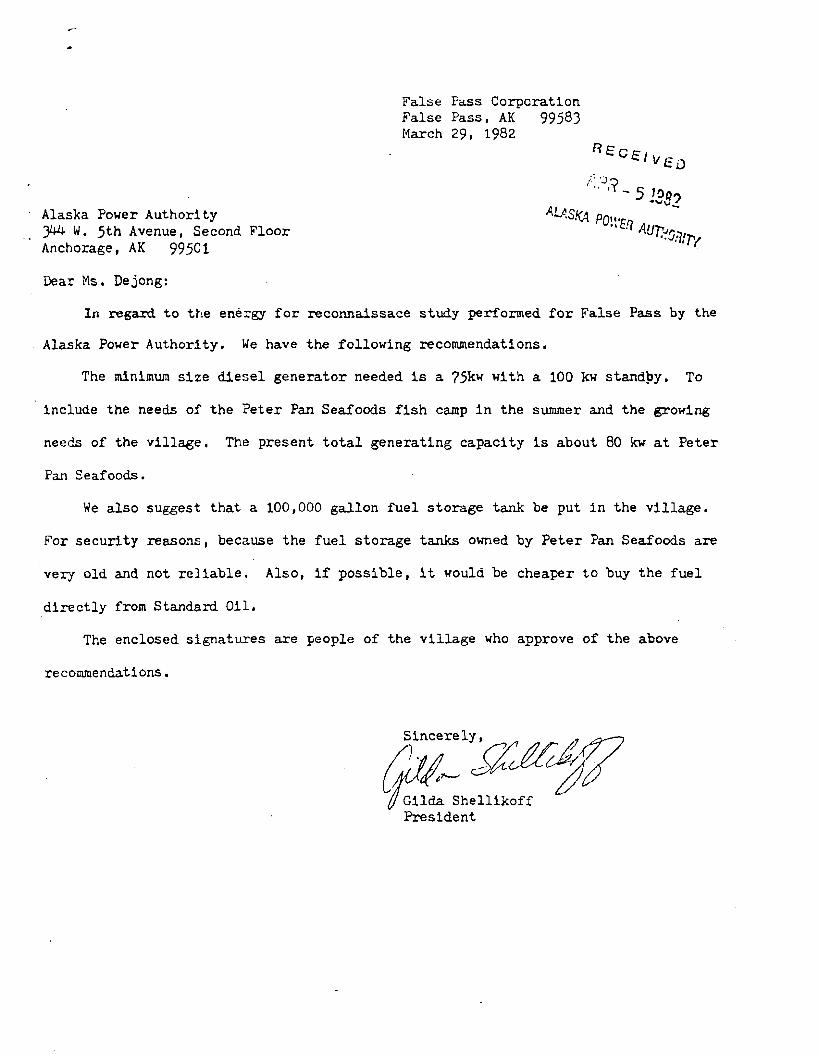
False Pass Corporation False Pass, AK 99583 March 29, 1982
In regard to the energy for reconna.issace study performed for False Pass by the
Alaska Power Authority. We have the £ollowing recommendations.
The minimum size diesel generator needed is a 75kw with a 100 kw standpy. To
include the needs of the Peter Pan Seafoods fish camp in the summer and the growing
needs of the village. The present total generating capacity is about 80 kw at Peter
Fan Seafoods.
We also suggest that a 100,000 gallon fuel stor-age tank be put in the Village.
For security reasons, because the fuel storage tanks owned by Peter Pan Seafoods are
very old and not reliable. Also, i£ possible, it would be cheaper to buy the fuel
directly from Standard Oil.
The enclosed signatures are people of the village who approve o£ the above
recommendations.

• •
-• .. •
• .. .. .. • .. • • •
• .. • .. • .. • .. • • • •
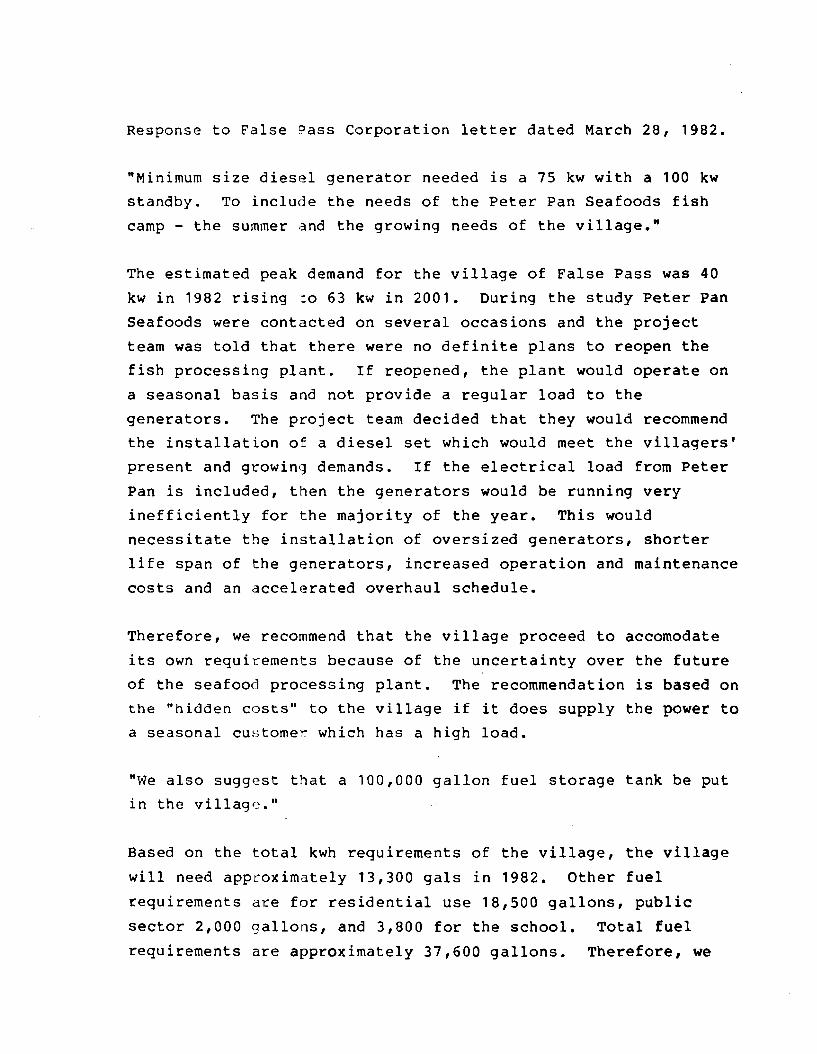
Response to False Pass Corporation letter dated March 28, 1982.
"Minimum size diesel generator needed is a 75 kw with a 100 kw
standby. To include the needs of the Peter Pan Seafoods fish
camp - the summer and the growing needs of the village."
The estimated peak demand for the village of False Pass was 40
kw in 1982 rising ~o 63 kw in 2001. During the study Peter Pan
Seafoods were contacted on several occasions and the project
team was told that there were no definite plans to reopen the
fish processing plant. If reopened, the plant would operate on
a seasonal basis and not provide a regular load to the
generators. The project team decided that they would recommend
the installation of a diesel set which would meet the villagers'
present and growing demands. If the electrical load from Peter
Pan is included, then the generators would be running very
inefficiently for the majority of the year. This would
necessitate the installation of oversized generators, shorter
life span of the generators, increased operation and maintenance
costs and an accelerated overhaul schedule.
Therefore, we recommend that the village proceed to accomodate
its own requirements because of the uncertainty over the future
of the seafood processing plant. The recommendation is based on
the "hidden costs" to the village if it does supply the power to
a seasonal customer. which has a high load.
"We also suggest that a 100,000 gallon fuel storage tank be put
in the village."
Based on the total kwh requirements of the village, the village
will need approximately 13,300 gals in 1982. Other fuel
requirements are for residential use 18,500 gallons, public
sector 2,000 gallons, and 3,800 for the school. Total fuel
requirements are approximately 37,600 gallons. Therefore, we
would recommend that 48,000 gallons of storage be installed for the village's requirements. The costs for the tanks have been
included in the energy plans.
A copy of your letter has been forwarded to the Department of
Community Affairs (CRA) and the Department of Energy and Power
Development (DEPD). CRA has responsibility for fuel storage
programs in rural Alaska and DEPD is responsible for fuel use
management and planning.
.. • .. .. • -•
• .. .. .. .. --• .. • • .. • .. ., .. • • • • • • ..