Embed Size (px)
Citation preview
Bisphenol A and phthalates in utero and in childhood: association with child BMI z-score and adiposity
Tiffany C Yang, MPH, RD, PhDa,b, Karen E Peterson, ScDa,c, John D Meeker, ScD, CIHd, Brisa N Sánchez, PhDe, Zhenzhen Zhang, PhDa,e, Alejandra Cantoral, ScD, MS, RDf, Maritsa Solanof, Martha M Tellez-Rojo, PhDf
Affiliations: aDepartment of Nutritional Sciences, University of Michigan School of Public Health, 1415 Washington Heights, Ann Arbor, MI 48109, USA;b Department of Health Sciences, University of York, Heslington, York, United Kingdom;c Center for Human Growth and Development, University of Michigan, 300 North Ingalls St., Ann Arbor, MI, 48109, USA;dDepartment of Environmental Health Sciences, University of Michigan School of Public Health, 1415 Washington Heights, Ann Arbor, MI 48109, USA;eDepartment of Biostatistics, University of Michigan School of Public Health, 1415 Washington Heights, Ann Arbor, MI 48109, USA;fCentro de Investigación en Nutrición y Salud, Instituto Nacional de Salud Pública, Cuernavaca, Morelos, Mexico.
Address correspondence to: Karen E Peterson, Department of Nutritional Sciences, University of Michigan School of Public Health, 1867 SPH I, 1415 Washington Heights, Ann Arbor, MI 48109. Telephone: (734) 647-1923. Email: [email protected].
Abstract
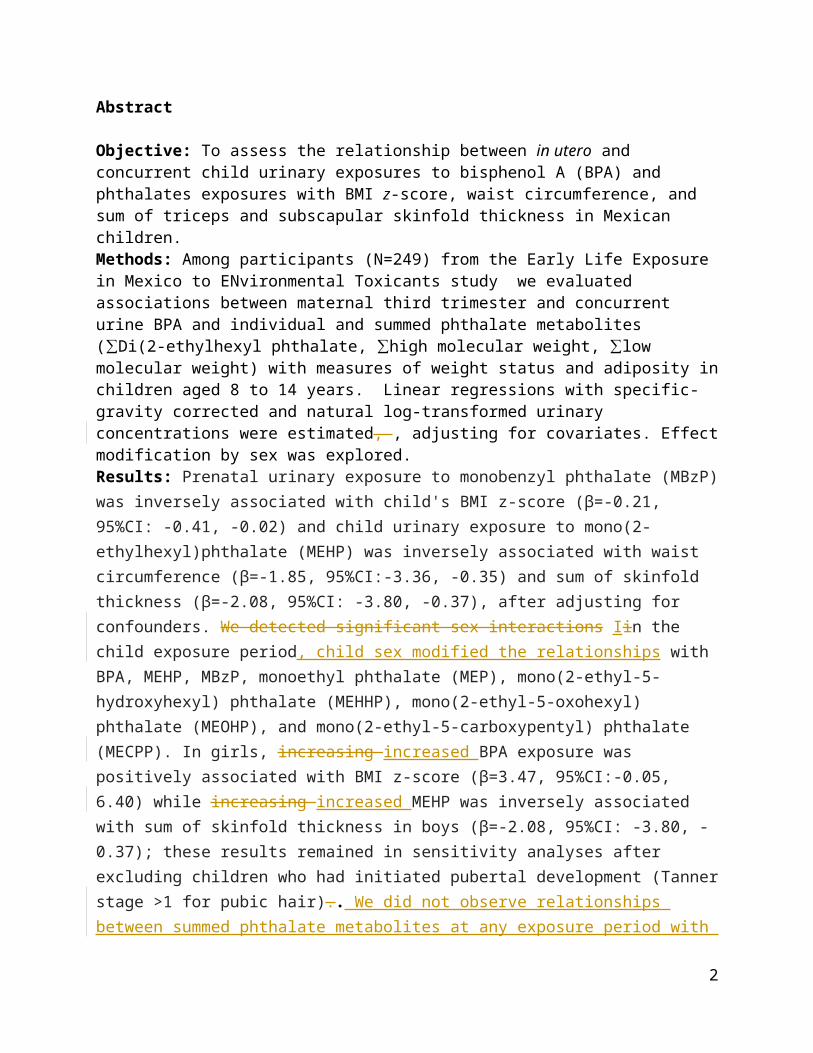
Objective: To assess the relationship between in utero and concurrent child urinary exposures to bisphenol A (BPA) and phthalates exposures with BMI z-score, waist circumference, and sum of triceps and subscapular skinfold thickness in Mexican children. Methods: Among participants (N=249) from the Early Life Exposure in Mexico to ENvironmental Toxicants study we evaluated associations between maternal third trimester and concurrent urine BPA and individual and summed phthalate metabolites (∑Di(2-ethylhexyl phthalate, ∑high molecular weight, ∑low molecular weight) with measures of weight status and adiposity in children aged 8 to 14 years. Linear regressions with specific-gravity corrected and natural log-transformed urinary concentrations were estimated, , adjusting for covariates. Effect modification by sex was explored.Results: Prenatal urinary exposure to monobenzyl phthalate (MBzP) was inversely associated with child's BMI z-score (β=-0.21, 95%CI: -0.41, -0.02) and child urinary exposure to mono(2-ethylhexyl)phthalate (MEHP) was inversely associated with waist circumference (β=-1.85, 95%CI:-3.36, -0.35) and sum of skinfold thickness (β=-2.08, 95%CI: -3.80, -0.37), after adjusting for confounders. We detected significant sex interactions Iin the child exposure period, child sex modified the relationships with BPA, MEHP, MBzP, monoethyl phthalate (MEP), mono(2-ethyl-5-hydroxyhexyl) phthalate (MEHHP), mono(2-ethyl-5-oxohexyl) phthalate (MEOHP), and mono(2-ethyl-5-carboxypentyl) phthalate (MECPP). In girls, increasing increased BPA exposure was positively associated with BMI z-score (β=3.47, 95%CI:-0.05, 6.40) while increasing increased MEHP was inversely associated with sum of skinfold thickness in boys (β=-2.08, 95%CI: -3.80, -0.37); these results remained in sensitivity analyses after excluding children who had initiated pubertal development (Tanner stage >1 for pubic hair).. We did not observe relationships between summed phthalate metabolites at any exposure period with outcome measures.Conclusion: Our results suggest that associations between urinary BPA and phthalate metabolites with measures of weight status and adiposity differ by timing of exposure, sex, and pubertal status .Additional studies considering the influence of the pubertal transition are needed to confirm these findings in a larger population of children undergoing the pubertal transition.
Key Words: BMI, Adiposity, Bisphenol A, Phthalates, Adolescence
2
Funding Source: All phases of this study were supported by National Institutes of Environmental Health Sciences and U.S. Environmental Protection Agency funded UMSPH Formative Children’s Environmental Health and Disease Prevention Research Center (P20 ES018171/RD834800PI: Peterson), Lifecourse Exposures and Diet: Epigenetics, Maturation, and Metabolic Syndrome (P01ES022844-01/RD-83543601) and Lifestage Exposures and Adult Disease (P30 ES017885). Funding sources did not have any involvement in study design, analyses, and manuscript preparation. The research protocols were approved by the Ethics and Research Committees of the National Institute of Public Health in Mexico, and the University of Michigan School of Public Health.
3
INTRODUCTION
Childhood obesity continues to be a globally persistent disease with a wide range of
complications and is known to track into adulthood.1–3 Differences between energy intake and
physical activity expenditure are considered the largest risk factors for the development of
obesity, but increasing evidence suggests exposures to environmental endocrine-disrupting
compounds (EDCs) such as bisphenol A (BPA) and phthalates are implicated in weight
dysregulation.4,5
BPA and phthalates are multi-functional materials used in everyday products resulting in
widespread exposure to these compounds and their metabolites.6,7 BPA is frequently found in
plastic food containers, the lining of food cans, toys, and thermal receipt paper.8,9 Phthalates are
also found in a variety of common consumer goods. Low molecular weight (LMW) phthalates
are generally used in personal care products such as lotions, creams, and perfumes, while high
molecular weight (HMW) phthalates are used as a component of harder plastics, such as vinyl
flooring, food containers, and medical tubing.10–13 These metabolites have been detected during
pregnancy and are detected in amniotic sac and cord blood.7,8,14
Cross-sectional studies in humans show that urinary BPA and phthalates metabolites may
be associated with increased body mass index (BMI),waist circumference, and adiposity, with
suggestions of sex differences, but results remain inconclusive depending on population, sex, and
age of exposure.15–29 Few longitudinal studies relate in utero exposures to obesity-related
outcomes in later childhood and adolescence.30 A prospective study of prenatal exposure to BPA 4
Abbreviations: BMI – Body mass index; BPA – Bisphenol A; CI – Confidence Interval; DEHP – Di(2-ethylhexyl) phthalate; EDC – Endocrine-disrupting compound; HMW – high molecular weight; LMW – low molecular weight; MBP – Mono-n-butyl phthalate; MBzP – Monobenzyl phthalate; MCPP – Mono(3-carboxypropyl) phthalate; MECPP – Mono(2-ethyl-5-carboxypentyl) phthalate; MEHP – Mono(2-ethyl-5-oxohexyl) phthalate; MEHHP – Mono(2-ethyl-5-hydroxyhexyl) phthalate; MEOHP – Mono(20ethyl-5-oxohexyl) phthalate; MEP – Monoethyl phthalate; MiBP – Mono-isobutyl phthalate; NHANES – National Health and Nutrition Examination Survey; SD – Standard Deviation; TSF – triceps skinfolds
in the Rhea cohort from Greece found increasing increased exposure to be positively associated
with BMI in boys at 4 years of age, but negatively with girls while cross-sectional analyses of
these children at 4 years old observed higher BPA concentrations to be associated with increased
BMI z-scores, waist circumference, and sum of skinfold thickness.31 Phthalate studies are also
inconclusive: in utero exposures were found to have no association with fat mass in children
aged 4-9 years,28 decreased BMI z-scores only in girls aged 4-7 years,32 or only in boys aged 4 or
7 years old.33
BPA is and phthalates are well-known to be an endocrine-disrupting chemicalsknown as
an estrogen-simulator, while phthalates are anti-androgenic and possible thyroid antagonists.5,34
Exposures to these compounds could increase risk of developing chronic diseases, such as
altered weight status, through potential mechanisms such as alterations in thyroid hormone, in
estrogen and androgen levels, in glucose tolerance and insulin resistance, or through the
peroxisome proliferator pathways.5,8,35 Exposures to these compounds during pregnancy are of
especial concern for later childhood obesity, as this period is considered a sensitive period for the
development of obesity due to the rapid development and cell differentiation of organ systems
occurring in the fetus.Exposures in pregnancy are thought to be particularly detrimental because
of this sensitive period for the development of obesity where rapid development and cell
differentiation of organ systems are occurring in the fetus.36,37 Accumulating evidence suggest
these compounds play a role in influencing physiology from the perinatal period, with animal
studies showing effects on weight gain, adiposity, and alterations in satiety hormones.38–42
In a population of children and youths aged 8-14 years old in Mexico City, this study
investigated the impact of prenatal and concurrent exposures to BPA and phthalate metabolites
5
on BMI z-score, waist circumference, and skinfolds in children older than previously reported in
the literature. We also explored sex-specific differences in these associations.
MATERIALS AND METHODS
Study population
The study population involved participants (N=249) from the 19-year Early Life Exposure in
Mexico to ENvironmental Toxicants (ELEMENT) research collaboration with Mexico’s
Instituto Nacional de Salud Pública (INSP) that consists of three birth cohorts developed to
study the role that exposures to environmental toxicants play on health and development in early
life. Between 1994 and 2003, 2075 mothers were recruited during the first trimester of pregnancy
or at delivery from maternity hospitals in Mexico City. Similar exclusion criteria were applied to
all cohorts, such as living outside Mexico City, gestational diabetes, preeclampsia, or pregnancy-
related hypertensive disorders, as well as other criteria as described elsewhere.43–45 Study
methods have been described previously.43–48 In 2012, 250 mother-child pairs from cohorts 2 and
3 were re-recruited when the children were between the ages of 8 and 14 years, in order to
prioritize the peripubertal period and the availability archived maternal biological specimens.
Among the 250 children, 249 had complete data on all outcomes; of these, 132 were males and
117 were females.
Mothers were given detailed information regarding study procedures and signed a letter
of informed consent at the time of initial recruitment and follow-up when children were 8-14
years old. The research protocols were approved by the Ethics and Research Committees of
INSP in Mexico, and the Institutional Review Boards at Harvard University and University of
Michigan Schools of Public Health.
Urinary BPA and phthalate metabolites
6
A spot (second morning void) urine sample was collected from each woman during her
third-trimester visit to the project's research center and frozen at − 80 °C; these samples were
later matched to the urine samples collected from children at the follow-up visit in 2010 when
they were between the ages of 8-13 years. Samples were analyzed for total (free +
glucuronidated) BPA and nine phthalate metabolites by isotope dilution-liquid chromatography-
tandem mass spectrometry using validated modification of the Centers for Disease Control and
Prevention (CDC) methods by NSF International (Ann Arbor, MI, USA); further details are
described elsewhere.12,49,50 The nine phthalate metabolites measured were monoethyl phthalate
(MEP), mono-n-butyl phthalate (MBP), mono-isobutyl phthalate (MiBP), mono(3-
carboxypropyl) phthalate (MCPP), monobenzyl phthalate (MBzP), mono(2-ethylhexyl) phthalate
(MEHP), mono(2-ethyl-5-hydroxyhexyl) phthalate (MEHHP), mono(2-ethyl-5-oxohexyl)
phthalate (MEOHP), and mono(2-ethyl-5-carboxypentyl) phthalate (MECPP). Specific gravity
(SG) of the urine samples was measured using a handheld digital refractometer (ATAGO
Company Ltd., Tokyo, Japan). Urinary concentrations below the limit of quantitation (LOQ)
were assigned a value of LOQ/sqrt(2).
We calculated the molar sums of the DEHP metabolites (ΣDEHP) because they occur
from the same parent phthalate, and also of HMW (ΣHMW) and LMW (ΣLMW) phthalates
because they represent similar sources and biological activity. Molar sums were calculated by
dividing metabolite concentrations by their molecular weight and summing across. ΣDEHP
included MEHP (molecular weight 278, MEHHP (molecular weight 294), MEOHP (molecular
weight 292), and MECPP (molecular weight 308). ΣHMW included ΣDEHP, MCPP (molecular
weight 251) and MBzP (molecular weight 256 ). ΣLMW included MEP (molecular weight 194),
MiBP (molecular weight 222), and MBP (molecular weight 222). In order to enable
7
comparisons to other studies, molar sums were expressed in nanograms/millilitre by multiplying
ΣDEHP and ΣHMW with the molecular weight of MEHP, and multiplying ΣLMW with the
molecular weight of MEP.51
Individual and summed metabolites were then corrected for SG using: Pc=P[SGp-1)/(SGi-
1)], where Pc is the SG-corrected BPA or phthalate metabolite concentration (ng/mL), P is the
measured urinary BPA or phthalate metabolite concentration, SGp is the median of the urinary
specific gravities for the sample (SGp for mothers = 1.013, for children = 1.018), and SGi is the
urinary specific gravity for the individual.52
Anthropometric outcomes
Children’s anthropometry was obtained at a single follow-up visit between the ages of 8
and 14 years by study personnel using established research protocol.53 Waist circumference was
measured with a non-stretchable tape (QM2000; QuickMedical) to the nearest 0.1 cm. Triceps
and subscapular skinfold thicknesses (TSF, SSF) were measured using a Lange skinfold caliper
(Lange; Beta Technology) to the nearest 0.1 mm. Duplicate measures were taken of weight and
height and triplicate measures were taken of waist circumference and skinfold measurements. An
additional measurement was taken if intra-personal variability exceeded the measurement
tolerance of 0.5 cm and observed values were averaged. To provide comparable indices with
other international studies of weight status, age- and sex-specific BMI z-scores were calculated
using the 2007 World Health Organization (WHO) reference growth standard.54
Covariates
Sociodemographic characteristics of the mother were collected via questionnaires
administered by study personnel to the mother at the third trimester visit. Socioeconomic status
was represented by the number of years of schooling completed by the mother at enrollment. At
8
one month postpartum, maternal weight (BAME Mod 420; Catálogo Médico) was measured to
the nearest 0.1 kg; height (BAME Mod 420; Catálogo Médico) was measured to the nearest 0.1
cm.
Statistical analysis
Data analysis was completed using SAS version 9.4 for Windows (SAS Institute, Cary,
NC, USA). Distributions of SG-corrected BPA and individual and summed phthalate metabolites
were log-normally distributed and were ln-transformed to normality prior to regression analyses.
Geometric means (standard deviation) and distributions of SG-corrected BPA and individual and
summed phthalate metabolite concentrations were calculated for third trimester and child
exposure periods.
We used linear regression to assess the association between ln-transformed BPA and
individual and summed phthalate metabolites with continuous outcome measures (BMI z-score,
waist circumference, and sum of skinfolds55) prospectively with maternal urinary concentrations
and cross-sectionally when the youths were aged 8-14. Linear regression models were first
constructed with ln-transformed and SG-corrected BPA and phthalate metabolites in crude
models. We elected to adopt a confounders only approach to the a priori selection of
covariates.56 All models were adjusted for mother’s age and years of education at enrollment and
BMI at one month postpartum. In addition, models for waist circumference and sum of skinfolds
were adjusted for child’s age and sex. Mother’s BMI at 1 month postpartum was used due to
missing values of self-reported pre-pregnancy BMI in the analytic sample and because it would
be correlated with pre-pregnancy BMI and gestational weight gain. To assess the potential
modifying effect of child’s sex at follow-up, we then included appropriate interaction terms and
9
estimated models stratified by sex for those EDCs with significant interaction terms, consistent
with previous reports.16,33,57–59 In sensitivity analyses, we additionally adjusted for mother’s
smoking history (yes/no). We repeated analyses after excluding children who had initiated
puberty using physician-assessed Tanner stage for pubic hair (stage >1, n=54) as an indicator,
where age 1 indicates no pubertal development and 5 indicates full pubertal development.60 We
also repeated analyses excluding children who were born preterm (gestational age <37 weeks;
n=57). We considered statistical significance as alpha level of 0.10 for interaction terms and 0.05
for effect estimates. We explored the possibility of non-monotonic relationships using
generalized additive models and noted departures from linearity with deviance p values, but the
small sample size precluded further meaningful exploration of associations across quantiles of
exposure.
RESULTS
There were 249 children (47% female) with an average age of 10 years (Table 1). Girls
had significantly higher sum of skinfolds (30 vs 25 mm; p<0.001) but did not differ in waist
circumference or BMI z-score. Mothers were, on average, 27 (SD: 5.4) years old at time of
delivery, had completed 11(SD: 2.8) years of schooling, and overweight (BMI ≥25).
The majority of prenatal urinary samples show detectable concentrations of SG-corrected
metabolites, with the lowest detection in BPA measures (30%<LOQ) (Table 2). There were
fewer samples below the LOQ among child urinary measures and, with the exception of MEP,
higher geometric means were reported in child compared to prenatal measures. Spearman
correlations of SG-corrected BPA and individual phthalate metabolites were weakly to highly
correlated (range 0.13-0.98) within each time period while concentrations between prenatal and
child measures were weakly correlated (range 0.14-0.19) (data not shown).
10
Ln-transformed SG-corrected prenatal MBzP was significantly associated with a decrease
in child’s BMI z-score at ages 8-14 (β=-0.21, 95%CI: -0.41, -0.02) after controlling for
confounders (Table 3). There were no other associations detected from the prenatal exposure
period and we did not observe any sex modificationmodification of associations by sex.
In child urinary measures, we observed inverse associations between MEHP and waist
circumference (β=-1.85, 95%CI:-3.36, -0.35) and sum of skinfold measurements (β=-2.08,
95%CI: -3.80, -0.37) after controlling for confounders (Table 4). Significant sex interactions
were detected between Child sex modified the relationships between BPA and BMI z-score (p
for interaction=0.06) and sum of skinfolds (p for interaction =0.03), MEHP and sum of skinfolds
(p for interaction=0.08), and between MBzP, MEP, MECPP, MEHHP, and MEOHP across the
three outcome measures. These metabolites were reanalyzed after stratifying by sex (Table 5).
Increasing Increased concentrations of ln-transformed SG-corrected BPA in girls was associated
with an increase in sum of skinfolds (β=3.47, 95%CI:-0.05, 6.40) while exposure to MEHP,
MECPP, MEHHP, and MEOHP were inversely associated with child outcomes in boys.
In our sensitivity analyses, results did not differ with the exclusion of preterm births or
additional adjustment for mother’s smoking history. When we excluded children who had
initiated puberty, prenatal MBzP was no longer significantly associated with BMI z-score in our
regression analyses (results not shown) and sex-stratified analyses with child exposure measures
show significant results only between BPA exposure and sum of skinfolds in girls, and MEHP
exposure and sum of skinfolds in boys (Supplementary Table 1).
DISCUSSION
11
In this prospective cohort in Mexico City, we found that higher concentrations of child
urinary MEHP was inversely associated with child’s waist circumference and sum of skinfold
thickness in children aged 8-14. We observed effect modification by sex with BPA, MEP, and
individual metabolites from the high molecular weight phthalates in the child exposure period.
Sex-stratified analyses found increasing increased exposure to urinary concentrations of BPA to
be positively associated with girls’ sum of skinfold thickness, while exposures to MEHP,
MEHHP, MECPP, and MEOHP were inversely related to BMI z-score, waist circumference, and
sum of skinfold thickness in boys. When we restricted our analyses to children who had not yet
begun the pubertal transition, our results showed the positive relationships between BPA in girls
and MEHP in boys, with sum of skinfold thickness. From the prenatal exposure period, we had
observed an inverse relationship between MBzP and child’s BMI z-score, but this finding did not
persist when we restricted our analyses to children who had not initiated puberty. We did not
observe any associations between the sum of DEHP metabolites or sum of HMW or LMW
metabolites with any child outcome.
Our cross-sectional findings of BPA are in agreement with findings from a cross-
sectional NHANES study of children aged 6-19 years old who showed increasing increased
urinary BPA concentrations to be positively associated with BMI z-score,26 as well as the
CHAMACOS cohort in the US, where Harley et al. (2013) observed increased BMI z-scores,
waist circumference, and body fat percentage in children with higher BPA concentrations at 9
years of age.59 In the NHANES study, the majority of the children would likely have begun the
pubertal transition, and the CHAMACOS population at 9 years had 43% of girls and 16% of
boys who had entered puberty. Therefore, Harley et al. suggested that these positive cross-
sectional associations between BPA and BMI z-score are only observed in older children.
12
However, our results persisted whether we included or excluded children who had entered
puberty. In a study population with younger children, cross-sectional child urinary
concentrations of BPA were associated with BMI z-score, waist circumference, and sum of
skinfold thickness at 4 years of age in one study from Greece,61 but not in a study of US children
aged 2-5 years old.42 Unlike studies reporting relationship between prenatal BPA exposure and
child anthropometric outcomes,41,58,59 we did not observe any associations, which is consistent
with a study by Braun et al (2014)42 in the US and Vafeiadi et al (2016)61 with the Rhea cohort.
We did not observe any relationships between prenatal urinary phthalate concentrations
and child outcomes after excluding children who had initiated puberty, consistent with findings
from a New York City cohort, where no associations with fat mass in children aged 4-9 years
were observed.28 However, other studies report mixed findings, depending on age, sex, and
phthalate metabolite.32,33,57,62,63 Prenatal exposure to MEP was associated with decreased BMI z-
scores only in girls 4-7 years old in one US cohort,32 while ∑HMW prenatal phthalates were
associated with lower BMI z-scores only in boys age 4 and 7 in the INMA-Sabadell cohort.33 In
contrast, prenatal exposure to non-DEHP metabolites was negatively associated with BMI z-
score, waist circumference, and fat mass in boys aged 5 and 7 years old in the US.57
Our cross-sectional findings with phthalate metabolites showed increasing increased
child MEHP urinary concentration to be negatively associated with waist circumference and sum
of skinfold thickness. This relationship was modified by sex and the association with sum of
skinfold thickness was observed only in boys and is not consistent with other studies. Deierlein
et al., observed an association between MEHP exposure at ages 6-8 years with a predicted
decrease in BMI from the ages of 7-1362, but only in girls, a cross-sectional study of children
aged 6-8 years using NHANES found an inverse relationship between MEHP and BMI in girls
13
and no association with boys,64 and MEHP exposure was negatively associated with obesity in
girls in a Chinese study.16
Overall, we found no relationships between prenatal exposures and child outcomes, and
sex-specific associations between BPA and MEHP exposures and sum of skinfold thickness in
the child exposure period. Sex differences have been observed in other epidemiological studies,
as well as animal studies and are likely due to the endocrine-disrupting mechanisms of BPA and
phthalate metabolites.65–67 BPA is known to alter binding to estrogen receptors, promote
differentiation of, and lipid accumulation in, adipocytes, and inhibit adiponectin release, which
may increase risk of hypertension, dyslipidemia, and diabetes by increasing muscle and liver
catabolism of fatty acids and glucose.68–70 Phthalates are anti-androgenic, can possibly alter
thyroid levels, which are important for maintaining metabolism and energy balance, and can, like
BPA, activate the peroxisome proliferator-activated receptors (PPAR) family of receptors, a
family of lipid-sensors that are involved in energy homeostasis and can redirect metabolism
when activated, through adipogenesis, lipogenesis, and insulin sensitivity.71,72 Given the evidence
that phthalates have anti-androgenic effects, we expected that our association between MEHP
and sum of skinfold thickness in boys would have been a positive association rather than an
inverse association; nonetheless, similar to the assertion by Maresca et al. (2016),57 these results
still support evidence that phthalates can disrupt metabolism.
Limitations of our study include the use of a single spot-urine during pregnancy and in
childhood. As previously reported, metabolite concentrations in the prenatal and child exposure
periods are similar to those described in other studies.12 BPA and phthalates have short
metabolite half-lives, with <5-6 hours for BPA and <24 hours for phthalates.73,74 These
metabolites are subject to temporal variability and a single spot-urine sample may not be capable
14
of capturing accurate individual levels, but previous studies have shown that a single measure
may be a relatively good measure of exposure due to the consistency of behaviors and similar
assumptions about the validity of a single urine measurement has been made in other studies.75–77
Various methods for correcting variations in urinary dilutions, such as adjusting or correcting for
urinary creatinine levels or specific gravity in regression models, are currently used. We chose to
control for urinary dilution by correcting for specific gravity, not creatinine because it has been
shown to be a better marker in children; unlike specific gravity, creatinine can be influenced by
age and seasonality, as well as muscle mass, race, and sex.78,79 Recently, it has been suggested
that how urinary dilution is adjusted, such as standardization, covariate adjustment, or covariate-
adjusted standardization, may influence the interpretation of results.80
We did not include dietary data, physical activity, and consumer product use as potential
confounders and therefore residual confounding may exist. BPA and phthalates exposures are
thought to occur primarily through ingestion and dermal absorption, as these compounds are
found in common consumer goods such as food containers, toys, and personal care products.8,11,12
It is possible that individuals with higher canned and/or packaged food intake would have higher
urinary concentrations. Heavier individuals may also have higher urinary concentrations due to
increased dietary intake and product use, which may influence our cross-sectional results..
Our study population was not large, which limited the interpretation of our findings.
Some studies have observed that endocrine-disrupting compounds have a non-monotonic
relationship with health outcomes,18,26 but our sample size limited investigation of nonlinear
associations. Available toxicant measures and sample size also account for residual confounding
by other perinatal or childhood exposures or to consider mixtures of endocrine disrupting
chemicals in the genesis of adiposity outcomes. We utilized the WHO growth standard to
15
calculate BMI z-score which could have implications for direct comparisons with studies
conducted in the United States that rely on CDC reference growth curves. Nevertheless, this
measure would permit comparisons with studies conducted in Europe, Latin American and other
worldwide settings. We also had very limited information on pre-pregnancy BMI due to
availability of self-reported weight and the timing of recruitment in our original birth cohorts; we
therefore had to rely on maternal BMI at one month postpartum as a covariate. We also did not
control for multiple comparisons as this analysis was exploratory, which increases the likelihood
of false significant findings. However, strengths of our study include its prospective design and
length of follow-up, which allowed us to assess child outcomes at ages later than those currently
reported in the literature. We also had information on pubertal status, allowing us to explore
whether associations are influenced in this time of transition. Associations between metabolite
exposure and outcomes may change as children enter the ages of the pubertal transition may
hormonal fluctuations, as well as changes in dietary, physical activity, and habits around
consumer product use changes requires further studies.
CONCLUSIONS
We found higher concentrations of the phthalate metabolite MEHP was associated with a
decrease in sum of skinfold thickness in boys aged 8-14 while BPA exposure was associated
with an increase in BMI z-score in girls among children who had not entered puberty. In contrast,
we did not find any relationships between prenatal exposures to BPA or phthalate metabolites
after excluding children who had entered the pubertal transition. Our findings suggest
associations depend on timing of exposure, as well as sex and pubertal status. Further follow-up
in this and other studies are needed to further our understanding of how timing of exposures
influence adiposity in different periods of development.
16
REFERENCES
1. Guo SS, Roche AF, Chumlea WC, Gardner JD, Siervogel RM. The predictive value of childhood body mass index values for overweight at age 35 y. Am J Clin Nutr. 1994;59(4):810-819. http://ajcn.nutrition.org/content/59/4/810.short.
2. Mangner N, Scheuermann K, Winzer E, et al. Childhood Obesity: Impact on Cardiac Geometry and Function. JACC Cardiovasc Imaging. 2014. doi:10.1016/j.jcmg.2014.08.006.
3. Ebbeling CB, Pawlak DB, Ludwig DS. Childhood obesity: Public-health crisis, common sense cure. Lancet. 2002;360(9331):473-482. doi:10.1016/S0140-6736(02)09678-2.
4. Baillie-Hamilton PF. Chemical toxins: a hypothesis to explain the global obesity epidemic. J Altern Complement Med. 2002;8(2):185-192. doi:10.1089/107555302317371479.
5. Grün F, Blumberg B. Endocrine disrupters as obesogens. Mol Cell Endocrinol. 2009;304(1-2):19-29. doi:10.1016/j.mce.2009.02.018.
6. Silva MJ, Barr DB, Reidy JA, et al. Urinary levels of seven phthalate metabolites in the U.S. population from the National Health and Nutrition Examination Survey (NHANES) 1999-2000. Environ Health Perspect. 2004;112(3):331-338. doi:10.1289/ehp.6723.
7. Callan AC, Hinwood AL, Heffernan A, Eaglesham G, Mueller J, Odland JØ. Urinary bisphenol A concentrations in pregnant women. Int J Hyg Environ Health. 2012:2-5. doi:10.1016/j.ijheh.2012.10.002.
8. Vandenberg LN, Hauser R, Marcus M, Olea N, Welshons W V. Human exposure to bisphenol A (BPA). Reprod Toxicol. 2007;24(2):139-177. doi:10.1016/j.reprotox.2007.07.010.
9. Mendum T, Stoler E, VanBenschoten H, Warner JC. Concentration of bisphenol A in thermal paper. Green Chem Lett Rev. 2011;4(1):81-86. doi:10.1080/17518253.2010.502908.
10. Braun JM, Sathyanarayana S, Hauser R. Phthalate exposure and children’s health. Curr Opin Pediatr. 2013;25(2):247-254. doi:10.1097/MOP.0b013e32835e1eb6.
11. Meeker JD, Sathyanarayana S, Swan SH. Phthalates and other additives in plastics: human exposure and associated health outcomes. Philos Trans R Soc Lond B Biol Sci. 2009;364(1526):2097-2113. doi:10.1098/rstb.2008.0268.
12. Lewis RC, Meeker JD, Peterson KE, et al. Predictors of urinary bisphenol A and phthalate metabolite concentrations in Mexican children. Chemosphere. 2013;93(10):2390-2398. doi:10.1016/j.chemosphere.2013.08.038.
13. Hauser R, Calafat AM. Phthalates and human health. Occup Environ Med. 2005;62(11):806-818. doi:10.1136/oem.2004.017590.
17
14. Chou W-C, Chen J-L, Lin C-F, Chen Y-C, Shih F-C, Chuang C-Y. Biomonitoring of bisphenol A concentrations in maternal and umbilical cord blood in regard to birth outcomes and adipokine expression: a birth cohort study in Taiwan. Environ Health. 2011;10(1):94. doi:10.1186/1476-069X-10-94.
15. Yaghjyan L, Sites S, Ruan Y, Chang S-H. Associations of Urinary Phthalates with Body Mass Index, Waist Circumference, and Serum Lipids Among Females: National Health and Nutrition Examination Survey 1999-2004. Int J Obes. 2015;(August 2014):1-23. doi:10.1038/ijo.2015.8.
16. Zhang Y, Meng X, Chen L, et al. Age and Sex-Specific Relationships between Phthalate Exposures and Obesity in Chinese Children at Puberty. PLoS One. 2014;9(8):e104852. doi:10.1371/journal.pone.0104852.
17. Wang H-X, Zhou Y, Tang C-X, Wu J-G, Chen Y, Jiang Q-W. Association between bisphenol a exposure and body mass index in Chinese school children: a cross-sectional study. Environ Health. 2012;11(1):79. doi:10.1186/1476-069X-11-79.
18. Eng DS, Gebremariam A, Meeker JD, Peterson K, Padmanabhan V, Lee JM. Bisphenol A and Chronic Disease Risk Factors in US Children. Pediatrics. 2013;132(3):e637-45. doi:10.1542/peds.2013-0106.
19. Shankar A, Teppala S, Sabanayagam C. Urinary bisphenol a levels and measures of obesity: results from the national health and nutrition examination survey 2003-2008. ISRN Endocrinol. 2012;2012:965243. doi:10.5402/2012/965243.
20. Carwile JL, Michels KB. Urinary bisphenol A and obesity: NHANES 2003-2006. Environ Res. 2011;111(6):825-830. doi:10.1016/j.envres.2011.05.014.
21. Hatch EE, Nelson JW, Stahlhut RW, Webster TF. Association of endocrine disruptors and obesity: perspectives from epidemiological studies. Int J Androl. 2010;33(2):324-332. doi:10.1111/j.1365-2605.2009.01035.x.
22. Trasande L, Spanier AJ, Sathyanarayana S, Attina TM, Blustein J. Urinary phthalates and increased insulin resistance in adolescents. Pediatrics. 2013;132(3):e646-55. doi:10.1542/peds.2012-4022.
23. Trasande L, Sathyanarayana S, Spanier AJ, Trachtman H, Attina TM, Urbina EM. Urinary Phthalates Are Associated with Higher Blood Pressure in Childhood. J Pediatr. 2013:1-8. doi:10.1016/j.jpeds.2013.03.072.
24. Wells EM, Jackson LW, Koontz MB. Association between bisphenol A and waist-to-height ratio among children: National Health and Nutrition Examination Survey, 2003-2010. Ann Epidemiol. 2013:6-8. doi:10.1016/j.annepidem.2013.06.002.
25. Bhandari R, Xiao J, Shankar A. Urinary Bisphenol A and Obesity in US Children. Am J Epidemiol. 2013;(18):1-8. doi:10.1093/aje/kws391.
26. Trasande L, Attina TM, Blustein J. Association between urinary bisphenol A concentration and obesity prevalence in children and adolescents. JAMA.
18
2012;308(11):1113-1121. doi:10.1001/2012.jama.11461.
27. Li D-K, Miao M, Zhou Z, et al. Urine Bisphenol-A Level in Relation to Obesity and Overweight in School-Age Children. Votruba SB, ed. PLoS One. 2013;8(6):e65399. doi:10.1371/journal.pone.0065399.
28. Buckley JP, Engel SM, Mendez MA, et al. Prenatal phthalate exposures and childhood fat mass in a New York city cohort. Environ Health Perspect. 2016;124(4):507-513. doi:10.1289/ehp.1509788.
29. Buckley JP, Engel SM, Braun JM, et al. Prenatal phthalate exposures and body mass index among 4 to 7 year old children: A pooled analysis. Epidemiology. 2016. doi:10.1097/EDE.0000000000000436.
30. Liu Y, Peterson KE. Maternal Exposure to Synthetic Chemicals and Obesity in the Offspring: Recent Findings. Curr Environ Heal Reports. 2015;2(4):339-347. doi:10.1007/s40572-015-0068-6.
31. Vafeiadi M, Agramunt S, Pedersen M, et al. In utero exposure to compounds with dioxin-like activity and birth outcomes. Epidemiology. 2014;25(2):215-224. doi:10.1097/EDE.0000000000000046.
32. Buckley JP, Engel SM, Braun JM, et al. Prenatal Phthalate Exposures and Body Mass Index Among 4- to 7-Year-old Children: A Pooled Analysis. Epidemiology. 2016;27(3):449-458. doi:10.1097/EDE.0000000000000436.
33. Valvi D, Casas M, Romaguera D, et al. Prenatal phthalate exposure and childhood growth and blood pressure: Evidence from the spanish inma-sabadell birth cohort study. Environ Health Perspect. 2015;123(10):1022-1029. doi:10.1289/ehp.1408887.
34. Meeker JD, Calafat AM, Hauser R. Di(2-ethylhexyl) phthalate metabolites may alter thyroid hormone levels in men. Environ Health Perspect. 2007;115(7):1029-1034. doi:10.1289/ehp.9852.
35. De Coster S, van Larebeke N. Endocrine-disrupting chemicals: associated disorders and mechanisms of action. J Environ Public Health. 2012;2012:713696. doi:10.1155/2012/713696.
36. Dietz WH. Critical periods in childhood for the development of obesity. Am J Clin Nutr. 1994;59(5):955-959. http://www.ncbi.nlm.nih.gov/pubmed/8172099.
37. Gluckman PD, Hanson MA, Beedle AS. Early life events and their consequences for later disease: a life history and evolutionary perspective. Am J Hum Biol. 2007;19(1):1-19. doi:10.1002/ajhb.20590.
38. Angle BM, Do RP, Ponzi D, et al. Metabolic disruption in male mice due to fetal exposure to low but not high doses of bisphenol A (BPA): Evidence for effects on body weight, food intake, adipocytes, leptin, adiponectin, insulin and glucose regulation. Reprod Toxicol. 2013:1-13. doi:10.1016/j.reprotox.2013.07.017.
19
39. Xu X, Tan L, Himi T, et al. Changed preference for sweet taste in adulthood induced by perinatal exposure to bisphenol A-A probable link to overweight and obesity. Neurotoxicol Teratol. 2011;33(4):458-463. doi:10.1016/j.ntt.2011.06.002.
40. Wei J, Lin Y, Li Y, et al. Perinatal exposure to bisphenol A at reference dose predisposes offspring to metabolic syndrome in adult rats on a high-fat diet. Endocrinology. 2011;152(8):3049-3061. doi:10.1210/en.2011-0045.
41. Valvi D, Casas M, Mendez M a, et al. Prenatal bisphenol a urine concentrations and early rapid growth and overweight risk in the offspring. Epidemiology. 2013;24(6):791-799. doi:10.1097/EDE.0b013e3182a67822.
42. Braun JM, Lanphear BP, Calafat AM, et al. Early-life bisphenol a exposure and child body mass index: a prospective cohort study. Environ Health Perspect. 2014;122(11):1239-1245. doi:10.1289/ehp.1408258.
43. Gonzalez-Cossio T, Peterson KE, Sanin L-H, et al. Decrease in Birth Weight in Relation to Maternal Bone-Lead Burden. Pediatrics. 1997;100(5):856-862. doi:10.1542/peds.100.5.856.
44. Téllez-Rojo MM, Hernández-Avila M, Lamadrid-Figueroa H, et al. Impact of bone lead and bone resorption on plasma and whole blood lead levels during pregnancy. Am J Epidemiol. 2004;160(7):668-678. doi:10.1093/aje/kwh271.
45. Ettinger AS, Lamadrid-Figueroa H, Téllez-Rojo MM, et al. Effect of calcium supplementation on blood lead levels in pregnancy: a randomized placebo-controlled trial. Environ Health Perspect. 2009;117(1):26-31. doi:10.1289/ehp.11868.
46. Téllez-Rojo MM, Hernández-Avila M, González-Cossío T, et al. Impact of breastfeeding on the mobilization of lead from bone. Am J Epidemiol. 2002;155(5):420-428. http://www.ncbi.nlm.nih.gov/pubmed/11867353.
47. Hernandez-Avila M, Gonzalez-Cossio T, Hernandez-Avila JE, et al. Dietary calcium supplements to lower blood lead levels in lactating women: a randomized placebo-controlled trial. Epidemiology. 2003;14(2):206-212. doi:10.1097/01.EDE.0000038520.66094.34.
48. Hu H, Téllez-Rojo MM, Bellinger D, et al. Fetal Lead Exposure at Each Stage of Pregnancy as a Predictor of Infant Mental Development. Environ Health Perspect. 2006;(11):1730-1735. doi:10.1289/ehp.9067.
49. Calafat AM, Ye X, Wong L-Y, Reidy J a, Needham LL. Exposure of the U.S. population to bisphenol A and 4-tertiary-octylphenol: 2003-2004. Environ Health Perspect. 2008;116(1):39-44. doi:10.1289/ehp.10753.
50. Silva MJ, Samandar E, Preau JL, Reidy JA, Needham LL, Calafat AM. Quantification of 22 phthalate metabolites in human urine. J Chromatogr B Analyt Technol Biomed Life Sci. 2007;860(1):106-112. doi:10.1016/j.jchromb.2007.10.023.
51. Wolff MS, Teitelbaum SL, Pinney SM, et al. Investigation of relationships between 20
urinary biomarkers of phytoestrogens, phthalates, and phenols and pubertal stages in girls. Environ Health Perspect. 2010;118(7):1039-1046. doi:10.1289/ehp.0901690.
52. Mahalingaiah S, Meeker JD, Pearson KR, et al. Temporal variability and predictors of urinary bisphenol A concentrations in men and women. Environ Health Perspect. 2008;116:173-178. doi:10.1289/ehp.10605.
53. Lohman TG, Roche AF, Martorell R. Anthropometric Standardization Reference Manual. Champaign, IL: Human Kinetics Books; 1988.
54. de Onis M. Development of a WHO growth reference for school-aged children and adolescents. Bull World Health Organ. 2007;85(9):660-667. doi:10.2471/BLT.07.043497.
55. Boeke CE, Oken E, Kleinman KP, Rifas-Shiman SL, Taveras EM, Gillman MW. Correlations among adiposity measures in school-aged children. BMC Pediatr. 2013;13(1):99. doi:10.1186/1471-2431-13-99.
56. Schisterman EF, Cole SR, Platt RW. Overadjustment bias and unnecessary adjustment in epidemiologic studies. Epidemiology. 2009;20(4):488-495. doi:10.1097/EDE.0b013e3181a819a1.
57. Maresca MM, Hoepner LA, Hassoun A, et al. Prenatal exposure to phthalates and childhood body size in an urban cohort. Environ Health Perspect. 2016;124(4):514-520. doi:10.1289/ehp.1408750.
58. Hoepner LA, Whyatt RM, Widen EM, et al. Bisphenol A and adiposity in an inner-city birth cohort. Environ Health Perspect. 2016;124(10):1644-1650. doi:10.1289/EHP205.
59. Harley KG, Aguilar Schall R, Chevrier J, et al. Prenatal and postnatal bisphenol A exposure and body mass index in childhood in the CHAMACOS cohort. Environ Health Perspect. 2013;121(4):514-520, 520-6. doi:10.1289/ehp.1205548.
60. Marshall W a., Tanner JM. Variations in the Pattern of Pubertal Changes in Boys. Arch Dis Child. 1970;45(239):13-23. doi:10.1136/adc.45.239.13.
61. Vafeiadi M, Roumeliotaki T, Myridakis A, et al. Association of early life exposure to bisphenol A with obesity and cardiometabolic traits in childhood. Environ Res. 2016;146:379-387. doi:10.1016/j.envres.2016.01.017.
62. Deierlein AL, Wolff MS, Pajak A, et al. Longitudinal Associations of Phthalate Exposures During Childhood and Body Size Measurements in Young Girls. Epidemiology. 2016;27(4):492-499. doi:10.1097/EDE.0000000000000489.
63. de Cock M, de Boer MR, Lamoree M, Legler J, van de Bor M. First Year Growth in Relation to Prenatal Exposure to Endocrine Disruptors - A Dutch Prospective Cohort Study. Int J Environ Res Public Health. 2014;11(7):7001-7021. doi:10.3390/ijerph110707001.
64. Hatch EE, Nelson JW, Qureshi MM, et al. Association of urinary phthalate metabolite concentrations with body mass index and waist circumference: a cross-sectional study of
21
NHANES data, 1999-2002. Environ Health. 2008;7:27. doi:10.1186/1476-069X-7-27.
65. Miyawaki J, Sakayama K, Kato H, Yamamoto H, Masuno H. Perinatal and postnatal exposure to bisphenol a increases adipose tissue mass and serum cholesterol level in mice. J Atheroscler Thromb. 2007;14(5):245-252. http://www.ncbi.nlm.nih.gov/pubmed/17938543.
66. Nadal A, Alonso-Magdalena P, Soriano S, Quesada I, Ropero AB. The pancreatic beta-cell as a target of estrogens and xenoestrogens: Implications for blood glucose homeostasis and diabetes. Mol Cell Endocrinol. 2009;304(1-2):63-68. doi:10.1016/j.mce.2009.02.016.
67. Schneider JE, Brozek JM, Keen-Rhinehart E. Our stolen figures: The interface of sexual differentiation, endocrine disruptors, maternal programming, and energy balance. Horm Behav. 2014;66(1):104-119. doi:10.1016/j.yhbeh.2014.03.011.
68. Gould JC, Leonard LS, Maness SC, et al. Bisphenol A interacts with the estrogen receptor alpha in a distinct manner from estradiol. Mol Cell Endocrinol. 1998;142(1-2):203-214. http://www.ncbi.nlm.nih.gov/pubmed/9783916.
69. Hugo ER, Brandebourg TD, Woo JG, Loftus J, Alexander JW, Ben-Jonathan N. Bisphenol A at environmentally relevant doses inhibits adiponectin release from human adipose tissue explants and adipocytes. Environ Health Perspect. 2008;116(12):1642-1647. doi:10.1289/ehp.11537.
70. Boucher JG, Boudreau a, Atlas E. Bisphenol A induces differentiation of human preadipocytes in the absence of glucocorticoid and is inhibited by an estrogen-receptor antagonist. Nutr Diabetes. 2014;4(1):e102. doi:10.1038/nutd.2013.43.
71. Meeker JD, Ferguson KK. Relationship between Urinary Phthalate and Bisphenol A Concentrations and Serum Thyroid Measures in U . S . Adults and Adolescents from the National Health and Nutrition Examination Survey ( NHANES ) 2007 – 2008. Environ Health Perspect. 2011;119:1396-1402.
72. Taxvig C, Dreisig K, Boberg J, et al. Differential effects of environmental chemicals and food contaminants on adipogenesis, biomarker release and PPARγ activation. Mol Cell Endocrinol. 2012;361(1-2):106-115. http://www.ncbi.nlm.nih.gov/pubmed/22526026.
73. Koch HM, Bolt HM, Preuss R, Angerer J. New metabolites of di(2-ethylhexyl)phthalate (DEHP) in human urine and serum after single oral doses of deuterium-labelled DEHP. Arch Toxicol. 2005;79(7):367-376. doi:10.1007/s00204-004-0642-4.
74. Völkel W, Colnot T, Csanády GA, Filser JG, Dekant W. Metabolism and kinetics of bisphenol a in humans at low doses following oral administration. Chem Res Toxicol. 2002;15(10):1281-1287. http://www.ncbi.nlm.nih.gov/pubmed/12387626.
75. Perrier F, Giorgis-Allemand L, Slama R, Philippat C. Within-subject Pooling of Biological Samples to Reduce Exposure Misclassification in Biomarker-based Studies. Epidemiology. 2016;27(3):378-388. doi:10.1097/EDE.0000000000000460.
22
76. Teitelbaum SL, Britton JA, Calafat a M, et al. Temporal variability in urinary concentrations of phthalate metabolites, phytoestrogens and phenols among minority children in the United States. Environ Res. 2008;106(2):257-269. doi:10.1016/j.envres.2007.09.010.
77. Mahalingaiah S, Meeker JD, Pearson KR, et al. Temporal variability and predictors of urinary bisphenol A concentrations in men and women. Environ Health Perspect. 2008;116(2):173-178. doi:10.1289/ehp.10605.
78. Pearson MA, Lu C, Schmotzer BJ, Waller LA, Riederer AM. Evaluation of physiological measures for correcting variation in urinary output: Implications for assessing environmental chemical exposure in children. J Expo Sci Environ Epidemiol. 2009;19(3):336-342. doi:10.1038/jes.2008.48.
79. Barr DB, Wilder LC, Caudill SP, Gonzalez AJ, Needham LL, Pirkle JL. Urinary Creatinine Concentrations in the U.S. Population: Implications for Urinary Biologic Monitoring Measurements. Environ Health Perspect. 2004;113(2):192-200. doi:10.1289/ehp.7337.
80. O’Brien KM, Upson K, Cook NR, Weinberg CR. Environmental Chemicals in Urine and Blood: Improving Methods for Creatinine and Lipid Adjustment. Environ Health Perspect. 2016;124(2):220-227. doi:10.1289/ehp.1509693.
23
Table 1. Maternal and child characteristics in the ELEMENT cohort in Mexico City, Mexico..
Table 2. Distribution of specific-gravity corrected prenatal BPA and individual and ∑DEHP, ∑HMW,and ∑LMW phthalate metabolites in the prenatal and child exposure periods.Table 3. Associations between prenatal urinary BPA, individual, and summed ∑DEHP, ∑HMW, ∑LMW phthalate metabolites with BMI z-score, waist circumference, and sum of skinfolds in children aged 8-14 years old.
Table 4. Associations between child urinary BPA, individual, and summed ∑DEHP, ∑HMW, ∑LMW phthalate metabolites with BMI z-score, waist circumference, and sum of skinfolds in children aged 8-14 years old.
Table 5. Sex-stratified associations between child urinary metabolites and BMI z-score, waist circumference, and sum of skinfolds identified.Supplementary Table 1. Associations between p-sex interaction identified ln-transformed SG-corrected child urinary metabolites with BMI z-score, waist circumference, and sum of skinfoldsidentified from, restricted to children who have not initiated puberty.
24