Embed Size (px)
Citation preview

Quantifying the Value of a Clean Ride: How Far Would You Bicycle to Avoid Exposure to Traffic-Related Air Pollution?
Sabreena Anowar* Postdoctoral Associate
Department of Civil, Environmental and Construction EngineeringUniversity of Central Florida
Tel: 1-407-823-4815; Fax: 1-407-823-3315Email: [email protected]
Naveen EluruAssociate Professor
Department of Civil, Environmental and Construction EngineeringUniversity of Central Florida
Tel: 1-407-823-4815; Fax: 1-407-823-3315Email: [email protected]
Marianne HatzopoulouAssociate Professor
Department of Civil EngineeringUniversity of TorontoTel: 1-416-978-0864
Email: [email protected]
*Corresponding author
123456789
101112131415161718192021222324252627282930313233343536

ABSTRACT
While there is widespread acceptance of the health benefits of bicycling, recent research has highlighted that the benefits may be partially offset by the potential adverse health impacts as a result of bicyclists’ exposure to traffic-related air pollution. Using a stated preference experiment, data from 695 commuter cyclists was compiled through a web-based survey and analyzed using a random utility approach to evaluate whether and to what extent cyclists are willing to trade-off air pollution exposure with other attributes such as roadway characteristics, bike facilities, and travel time. Mean and maximum concentrations of nitrogen dioxide (in parts per billion or ppb), a common marker of traffic-related air pollution, were used as the attributes to represent the externality (ranging from 5-60 ppb). Empirical results indicate that travel time and traffic volume remain the most important attributes for commuter cyclists in their route decision. We also computed a unique marginal rate of substitution called “Value of Clean Ride” (VCR). For mean exposure, the VCR is: 0.72 min/ppb and for maximum exposure, the VCR is: 0.25 min/ppb (95% distribution: -0.16, 0.67). This essentially suggests that if an alternative route was available with an average nitrogen dioxide concentration that is lower by 5 ppb (a realistic goal in light of the high spatial variability in air pollution within urban areas), then cyclists would be willing to take it if it added no more than about 4 minutes to their travel time. We also observed that cyclists who received information on short-term impacts of traffic-related air pollution tended to be more concerned with avoiding maximum exposure.
Keywords: Bike route choice, traffic-generated pollution, panel mixed multinomial logit, clean ride, travel time trade-off, pollution exposure
2
123456789
1011121314151617181920212223

1. INTRODUCTION
The reliance on private automobile for travel has resulted in a vast array of negative externalities – traffic congestion, air, and noise pollution. Transportation professionals and metropolitan planning organizations are challenged to find potential solutions to reduce vehicle use while promoting environmentally friendly and physically active transportation alternatives. Towards this end, transportation demand management strategies that encourage active transportation, particularly bicycling, for both commuting and short distance utilitarian trips are encouraged (Eluru et al., 2008; Mailbach et al., 2009; Rojas-Rueda et al., 2011). For instance, in addition to investing in infrastructure and bike share programs, local governments often sponsor and endorse events such as “bike to work day” or “bike month” to promote bicycle use among the general public (Ahmed et al., 2013). The adoption of bicycling has the potential to reduce congestion and air pollution (and greenhouse gas emissions) in well-connected dense urban regions while offering individuals a low-cost travel option that provides personal health and fitness benefits (Wen and Rissel, 2008). In fact, there is evidence to suggest that the health benefit is one of the primary stimuli for people wanting to participate in active commuting (Anable and Gatersleben, 2005).
While there is widespread acceptance of the potential health benefits of bicycling, recent research has highlighted that the benefits may be partially offset by the potential adverse health impacts as a result of exposure to traffic-related air pollution. In fact, it has been reported that in some cases, cyclists may be exposed to higher concentrations of traffic-related air pollutants than other road users owing to their close proximity to traffic, high respiration rates, and longer journeys (Panis et al., 2010; Bigazzi et al., 2016; Broach and Bigazzi, 2017). In addition, data suggest that exposure to traffic-related air pollution during cycling may contribute to altered autonomic regulation of the heart (Weichenthal et al., 2011), increased oxidative DNA damage (Vinzents et al., 2005), and acute myocardial infarction (Peters et al., 2004). The exposure is particularly of concern for the vulnerable segments of the community including children, pregnant women, seniors, and individuals with pre-existing respiratory conditions such as asthma (Sharker and Karimi, 2014; McLaren and Williams, 2015).
Given growing evidence of the adverse health effects of traffic-related air pollution on bicyclists, there is a need to provide solutions to reduce exposure. While it may be impossible to entirely rid urban environments of anthropogenic air pollutants, one potential solution could be supplying bicyclists with a route planning tool that would inform them of a “lower exposure alternative” (Hertel et al., 2008; Sharker and Karimi, 2014). This tool could be especially beneficial to those who regularly spend more than 45-60 minutes on daily commutes. For some users, altering their route may result in increasing their daily commute by only a few minutes, but could reduce their long-term commute-time pollution exposure significantly. This was demonstrated by Hatzopoulou et al. (2013) using origin-destination (O-D) survey data for more than 2,000 cycling trips in Montréal, Canada. On average, exposures to ambient Nitrogen dioxide (NO2) were estimated to be lower by 0.76 parts per billion (ppb) (95% CI: 0.72, 0.80) relative to the shortest route, with decreases of up to 6.1 ppb for a single trip. In general, the benefits of decreased exposure were achieved with little increase (less than 1km) in the overall route length.
The tool provides clear evidence of benefits from assessing route choice options in the context of exposure. However, bicycling route choices are seldom made in isolation with only emphasis on exposure. In this context, a critical question to ask is, what impact, if any, will such
3
123456789
10111213141516171819202122232425262728293031323334353637383940414243444546

exposure information have on bicyclists’ route choice decisions? Will they be willing to make trade-offs in terms of travel time or distance or other roadway attributes to reduce their exposure to traffic-generated emissions? There has been scant research investigating the issue. The emphasis of our research effort therefore is to bridge the research on bicycling route preferences with emerging research on examining the influence of air pollution on travel behavior. More specifically, we attempt to investigate the influence of exposure information on route choice while controlling for the other major dimensions (such as travel time, roadway characteristics, traffic characteristics, and bike facility characteristics) that influence the decision process. The study employs a stated preference (SP) elicitation approach for individual level route choice preference data compilation. The data compiled is analyzed using a random utility approach to evaluate whether and to what extent individuals are willing to trade-off exposure with other route attributes. In addition, a policy analysis exercise is also conducted to illustrate the applicability of the proposed approach.
The remainder of the paper is organized as follows. A discussion of the relevant literature is presented in Section 2. In Section 3, the materials and methods are described in detail including survey design, experimental setup, survey administration, and econometric approach used in the analysis. Section 4 provides the model estimation and trade-off analysis results. Section 5 concludes the paper and presents directions for future research.
2. HIGHLIGHTS OF PREVIOUS RESEARCH
To the best of authors’ knowledge, there has been no earlier work examining the influence of exposure to traffic related air pollution on bicycling route choices. Hence, we focus our review along two dimensions: (1) studies exploring bicycle route choice preferences and (2) earlier work examining the impact of air pollution in the context of travel decisions.
2.1 Route Choice PreferencesThere is a vast body of literature examining the impacts of different exogenous factors on cyclist’s route choice preferences (Sener et al., 2009 provides a detailed review). Of particular interest to our research are studies conducted to evaluate underlying behavioral mechanisms that actually guide the bicyclist’s decision process. The majority of these studies have examined preferences for commuter cyclists and/or recreational cyclists. However, some have investigated preferences of would-be or potential cyclists (Su et al., 2010; Winters et al., 2011). The data elicitation approaches considered include stated preference and revealed preference (RP) techniques with a clear preference for the SP approach (for SP studies see Stinson and Bhat, 2003; Hunt and Abraham, 2007; Tilahun et al., 2007; Sener et al., 2009; Caulfield et al., 2012; Chen and Chen, 2013; for RP studies see Menghini et al., 2010; Hood et al., 2011; Broach et al., 2012; Yeboah and Alvanides, 2015). This approach allows the analyst to explore various attributes that affect route choice behavior, most often unavailable under real world conditions. In an SP survey, routes that have varying attribute levels across multiple attributes can be easily generated with rigorous experimental design. On the other hand, employing RP data would significantly limit the
4
123456789
10111213141516171819202122232425262728293031323334353637383940414243444546

potential routes, route attributes, and attribute levels that can be explored in the analysis. The approaches employed for data analysis include ordinary least squares (OLS), binary logit (BL) or multinomial logit (MNL), mixed multinomial logit (MMNL), multinomial probit (MNP) models, and heuristic approaches.
These earlier studies provide valuable insights into the multitude of factors impacting route evaluation and subsequent route choice. For instance, for commuter cyclists (individuals who use the bicycle for commuting to and from work or school), travel time has the paramount importance with regards to their route choice decision (Stinson and Bhat, 2003; Sener et al., 2009). That is, they are more likely to choose the quickest route to reach their destination. However, commuter cyclists are willing to incur additional travel time for using bicycle facilities (if present on the route). This is particularly so for less experienced cyclists, women, and bike share system users (Abraham et al., 2002; DeGruyter, 2003; Tilahun et al., 2007; Garrard et al., 2008; Winters and Teschke, 2010; Hood et al., 2011; Gonzalez et al., 2016). Interestingly, in a study in Montreal, it was found that bicycle facilities are associated with higher air pollution levels (Strauss et al., 2012). It was also observed that cyclists tend to avoid uphill routes as well as routes with increased traffic control devices at intersections and higher vehicular traffic volumes particularly bus services (Parkin et al., 2008; Winters et al., 2011; Broach et al., 2012; Gonzalez et al., 2016). Preference for attractive aesthetics alongside the route was also reported in some studies. In addition to observed factors, latent psychological traits of bicyclists such as emotions, feelings, and personal perceptions can be important predictors of their route choice decisions as well (Fernández-Heredia et al., 2014). For example, Bhat et al. (2015), using survey data collected in Austin, Texas, found that “pro-bicyclist attitude” and “safety (from traffic crashes) consciousness” moderate the impact of the observed individual attributes on bicycle route choice.
2.2 Impact of Air Pollution on Travel DecisionsResearchers have sought to develop user-friendly tools that can be used by pedestrians and cyclists to plan their route so as to limit their exposures to air pollution. A list of studies in this context is presented in Table 1. The majority of these studies focus on cycling and compare shortest routes with low air pollution routes. Shortest routes are identified either in terms of travel time or travel distance while lowest exposure routes are identified based on exposure to a variety of air pollutants. We observe that irrespective of the method of analysis, a general consensus that emerges from these studies is that changing route can lead to reductions in exposure while cycling, without considerable increase in the travel time or distance. This, in turn, lends credence to the idea that a route planning tool identifying less polluted routes could help deliver potential health benefits for both pedestrians and bicyclists.
5
123456789
101112131415161718192021222324252627282930313233343536373839404142434445

Interestingly, in our review, we only found a handful of studies that investigated the relationship between environmental knowledge/information and subsequent travel behavior or willingness-to-pay to be sustainable in travel behavior (not specific to bicycling). For instance, Flamm (2009) found that environmental knowledge and attitudes significantly impacted vehicle ownership and use. Along similar lines, using stated choice experiments, Walker and colleagues (Gaker et al., 2010; Gaker et al., 2011; Gaker and Walker, 2013) investigated how individuals respond to feedback about personal carbon footprint in the context of auto ownership, mode choice, and route selection. Their research was motivated by the ‘nudge’ theory of behavioral economics which postulates that providing personalized information is one of the most effective ways to influence people to change their behavior. The results indicated that most of their study subjects (university students) were willing to modify their travel behavior to reduce greenhouse gas (GHG) emissions.
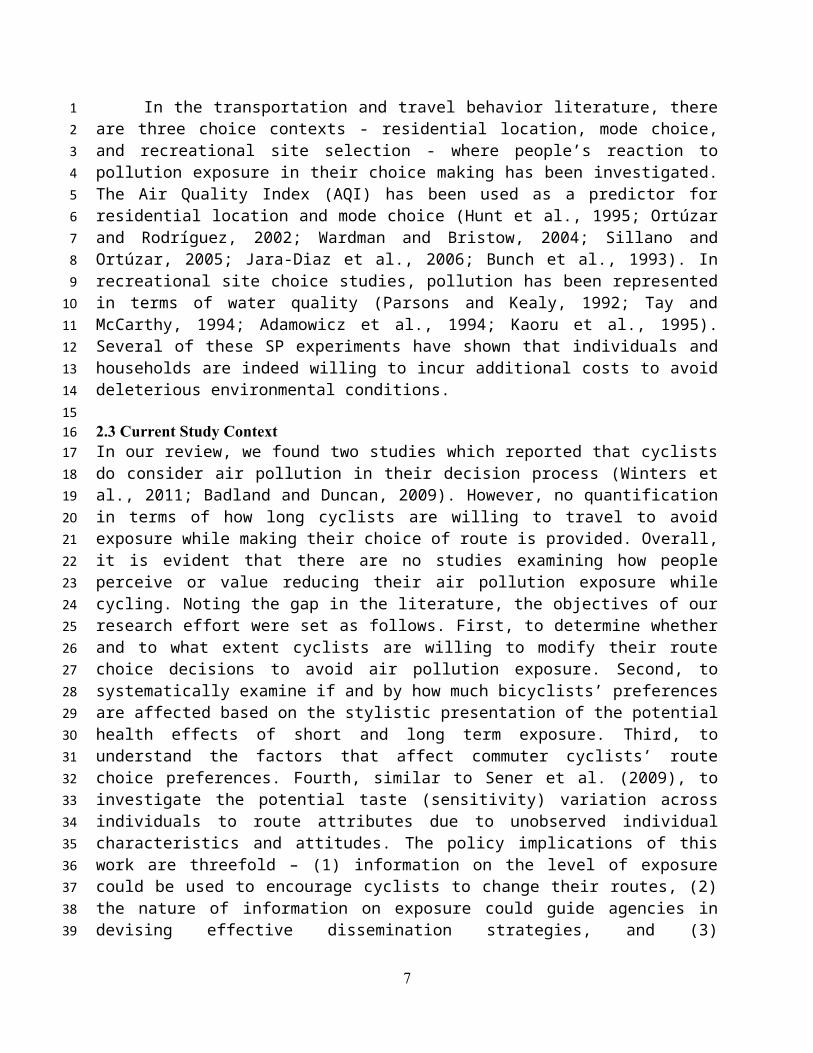
In the transportation and travel behavior literature, there are three choice contexts - residential location, mode choice, and recreational site selection - where people’s reaction to pollution exposure in their choice making has been investigated. The Air Quality Index (AQI) has been used as a predictor for residential location and mode choice (Hunt et al., 1995; Ortúzar and Rodríguez, 2002; Wardman and Bristow, 2004; Sillano and Ortúzar, 2005; Jara-Diaz et al., 2006; Bunch et al., 1993). In recreational site choice studies, pollution has been represented in terms of water quality (Parsons and Kealy, 1992; Tay and McCarthy, 1994; Adamowicz et al., 1994; Kaoru et al., 1995). Several of these SP experiments have shown that individuals and households are indeed willing to incur additional costs to avoid deleterious environmental conditions.
2.3 Current Study ContextIn our review, we found two studies which reported that cyclists do consider air pollution in their decision process (Winters et al., 2011; Badland and Duncan, 2009). However, no quantification in terms of how long cyclists are willing to travel to avoid exposure while making their choice of route is provided. Overall, it is evident that there are no studies examining how people perceive or value reducing their air pollution exposure while cycling. Noting the gap in the literature, the objectives of our research effort were set as follows. First, to determine whether and to what extent cyclists are willing to modify their route choice decisions to avoid air pollution exposure. Second, to systematically examine if and by how much bicyclists’ preferences are affected based on the stylistic presentation of the potential health effects of short and long term exposure. Third, to understand the factors that affect commuter cyclists’ route choice preferences. Fourth, similar to Sener et al. (2009), to investigate the potential taste (sensitivity) variation across individuals to route attributes due to unobserved individual characteristics and attitudes. The policy implications of this work are threefold – (1) information on the level of exposure could be used to
6
123456789
10111213141516171819202122232425262728293031323334353637383940414243444546
encourage cyclists to change their routes, (2) the nature of information on exposure could guide agencies in devising effective dissemination strategies, and (3) understanding which roadway infrastructure characteristics impact route choice aids in the decisions of where to invest and what type of facility to install, e.g. bike lanes or separate paths (Broach et al., 2012).
3. MATERIALS AND METHODS
3.1 Survey Design Our survey elicited responses from bicyclists along four dimensions. These are:
(1) Personal and household characteristics (such as gender, age, education level, employment type and schedule, nearest intersections at the place of residence and work, household income, number of persons in the household, level of automobile and bicycle ownership, and commute time in minutes),
(2) Cycling habits (frequency of cycling, if accompanied by children while making the trip, regular bicycling experience in years, primary reasons for cycling, seasons of cycling, and how often they switch their usual biking route),
(3) Hypothetical commuting choice scenarios with three route options per scenario, and (4) A cyclist’s perception about the characteristics of his/her usual commuting route.
Of these sections, apart from section 3, all other sections entailed direct responses to questions. The centerpiece of this survey and our study is a stated choice experiment in Section 3 that required the development of an experimental design to allow bicyclists to compare various attributes of the hypothetical routes before making their choice. Prior to the experimental design exercise, an important step in SP survey design consisted in identifying and defining, clearly and adequately, the attributes that characterize the available alternatives of the choice context (Hensher, 1994; Ortúzar and Rodríguez, 2002). From the existing bicycle route choice literature, we found that the factors affecting a cyclist’s route choice decision can be broadly classified into three major categories (Sener et al., 2009):
Roadway characteristics: grade, number of stop signs, red lights, cross streets, on-street parking, traffic volume, and roadway speed limit,
Bicycle route characteristics: segregation of bicycle lane, and facility continuity, Trip characteristics: travel time.
The attributes that were adopted in our study include: roadway characteristics: grade, traffic volume, and roadway type; bike route characteristics: cycling infrastructure continuity and segregation; and trip characteristics: travel time.
The valuation of air pollution exposure information and capturing the trade-offs with other attributes was the primary objective of our study. However, identifying appropriate indicators representing ambient air pollution exposure information is far from straightforward, for two specific reasons. First, the general public (including cyclists) is most likely unaware of the analytical measurement units of air pollutant concentrations (for example, parts per billion or ppb1) and what they signify. Second, individuals (including cyclists) are also not privy to the 1 In our survey, air pollution exposure was measured as a concentration of Nitrogen dioxide (NO2). This concentration is listed in units of parts per billion (ppb). NO2 concentrations in cities like Toronto and Montréal in Canada typically range between 5 ppb and 50 ppb. We chose NO2 for representing air pollution because NO2 is a marker of traffic-related air pollution and is highly associated with air pollution from traffic in urban areas. It is therefore of most concern for cyclists. Other pollutants such as CO, SO2 are also generated from other sources and it becomes a lot more difficult for participants to understand. NO2 is routinely monitored in urban areas and the vast
7
123456789
1011121314151617181920212223242526272829303132333435363738394041
123456

potential amount of pollution they are exposed to while on the road. They cannot see, touch, feel or smell it. Thus, our goal was to include measures that would bear meaningful and readily understandable information to the respondents. For this purpose, two measures that reflect the amount of traffic-related air pollution the cyclists are exposed to were identified. The first measure is the mean exposure that refers to the average air pollution level over the length of the route. The second measure is the maximum exposure i.e. the maximum level of air pollution that cyclists would encounter for a short part of their trip (for example, when biking behind a bus/truck). The mean and maximum exposures have both been associated with human health effects in the epidemiological literature.
A detailed description of the attribute and the corresponding attribute levels are presented in Table 2. Considering all of these attributes for experimental design would burden the respondent significantly. Hence, we opted to use an innovative partitioning technique where only five attributes were used to characterize routes in each of the SP scenarios. Of these five attributes, the environmental exposure, and travel time attributes were always retained. On the other hand, one attribute from roadway characteristics and bike route characteristics were randomly chosen for each individual. The selection of the attributes from these two categories was undertaken in a carefully designed rotating and overlapping fashion to enable the capture of all variable effects when the responses from the different SP choice scenarios across different individuals are brought together.
3.2 Experimental DesignWithin each choice question, three alternative routes (with different levels of the five route attributes selected) were presented, and the individual was asked to make a choice among the alternatives presented. We used the experimental design routines in SAS (fractional factorial design) to develop the route choice alternatives in each scenario presented to the respondents. Each respondent was presented with five choice experiments in the survey. The design was checked to ensure that the attribute levels of the alternatives did not create dominating alternatives. The design also enables the estimation of (1) models more general than the multinomial logit model by maintaining factor orthogonality within and between alternatives, and (2) main effects of attributes, as well as all two-way interaction effects of attributes. The SP scenarios were preceded by clear definitions of the attributes – pictorial representations were provided to give respondents a clearer idea about exclusive/shared and continuous/discontinuous cycling infrastructure.
We also conducted an “information provision” experiment to understand two issues. First, to identify if receiving information on the potential health effects resulting from exposure to traffic-related air pollution has any impact on a cyclist’s route choice decision and second, to study the sensitivity towards the nature of information provided. For this purpose, we devised three types of informational messages. One (or none) of these messages would appear to the respondent in a window preceding the scenarios and following the description of attributes. The survey was designed so that information display was randomized to ensure that a quarter of the respondents received no information while the rest of them received at least one of the three messages below:
(1) short term exposure (short term exposures to high levels of NO2 have been associated with immediate effects on heart rate (magnitude of the effect depends on the individual)),
majority of the epidemiology literature on air pollution and health effects is based on exposure to NO2.
8
123456789
101112131415161718192021222324252627282930313233343536373839404142434445
1

(2) long term exposure (long term exposure to traffic related air pollution has been associated with a range of respiratory and cardiovascular health effects as well as some types of cancers),
(3) specific information citing findings on long term exposure (long-term exposure to traffic-related air pollution has been associated with a range of respiratory and cardiovascular health effects. Also, a recent study demonstrated that a 5 ppb increase in exposure to NO2 was associated with 10% increase in the risk of breast cancer. Another study also demonstrated that a 5ppb increase in exposure to NO2
was associated with 18% increase in the risk of prostate cancer).
3.3 Survey AdministrationThe survey design was coded on a Survey Monkey platform (www.surveymonkey.net) for web dissemination. It was approved by the Health Sciences Research Ethics Board (HSREB) of the University of Toronto, Canada and was widely pilot tested to ensure that the experimental design and attribute randomization worked efficiently. It was open to cyclists who are 18 years of age or older. This ensured that data was obtained from individuals who were able to cycle unsupervised and also most likely to possess a driving license. The final survey included 33 questions requiring about 10-15 minutes to complete. The instrument for commuter cyclists is available from the authors upon request. Figure 1 presents a screenshot of sample choice task in the survey.
We adopted several survey dissemination, distribution, and advertisement schemes for collecting responses. For instance, web-links to the surveys were emailed to individuals, university electronic mailing lists, various bicyclist forums, organizations, and groups; posts related to the survey were uploaded in different social media platforms including Facebook, LinkedIn, and Twitter; bicycle-related websites placed web-links on their own web pages; advertisement posters placed in public message sharing spaces alongside major roadways. Individuals who learnt about our survey from these sources may have distributed it to their peers, colleagues, family, and friends. Owing to the sampling technique, it is likely that most of the respondents were bicyclists with access to computers and/or smart phones. Our dissemination was mostly focused on the cities of Toronto, Montreal, Calgary, New York, and Orlando in light of the presence of collaborators who could provide assistance in distribution.
3.4 Econometric ApproachIn this analysis, we use a panel mixed multinomial logit (MMNL) model formulation for our data with 5 responses per cyclist. Let c (c=1,2,…,C) be the index for cyclists, r (1 ,2 ,…,R) be the index for route alternative, and k (1,2 ,…,K ) be the index for choice occasions for each cyclist. In our case, R=3 and K=5 for all c. With this notation, the random utility formulation takes the following familiar form:
U crk=(α '+ηc' ) zcrk+ξcrk (1)
zcrk is a (M x 1) column vector of route attributes including all interactions influencing the utility of cyclist c for route alternative r at the k th choice occasion. α ' is a corresponding (M x 1) column vector of coefficients (representing mean effects), ηc
' is another (M x 1) column vector representing unobserved factors specific to cyclist c – the elements of ηc
' are usually considered
9
123456789
101112131415161718192021222324252627282930313233343536373839
40414243

to be independent realizations from a normal population distribution (ηc' N (0 , σ2 )), and ξcrk is an idiosyncratic random error term assumed to be identically and independently Type 1 Extreme Value distributed. Then, the probability that any cyclist c will select route r for a given value of ηc' can be expressed as:
Pcrk∨ηc'= e [(α '+ηc' ) zcrk ]
∑r=1
R
e[ (α'+ ηc' ) zcrk ] (2)
The unconditional probability then can be written as:
Pcrk=∫ηc'
❑
(Pcrk∨ηc' ) d F (ηc'∨σ ) (3)
where F is the multivariate cumulative normal distribution and σ is a vector. The log-likelihood (LL) function is constructed based on the above probability expression and maximum simulated likelihood (MSL) estimation is employed to estimate parameters α ' and σ . For this particular study, we use a quasi-Monte Carlo (QMC) approach with 500 draws for the MSL estimation (see Bhat, 2001 for more details). Please note that in the current context, we do not have any alternative specific variables since the alternatives are “unlabeled” and characterized by route attributes.
We began our analysis by estimating the main effects of the variables. Then we introduced the first order interaction variables including interaction effects of route attributes with any bicyclist characteristics and interactions among route attributes. The final variable specification was based on a systematic process of removing statistically insignificant variables (in our analysis we considered 95 percent significance level). The specification process was also guided by prior research, intuitiveness and parsimony considerations.
4. RESULTS
The survey data was downloaded from the on-line Survey Monkey platform in an SPSS compatible file format. After removing data with incomplete information, our final estimation sample comprised of 3475 choice occasions from 695 commuter cyclists. Next, we checked if our collected sample meets the minimum sample size requirement for stated choice experiments. Towards that end, we used the empirical equation proposed by Johnson and Orme (2003) for
experiments considering two-way interaction effects. The equation is: n≥ 500cta , where n is the
number of respondents, t is the number of tasks, a is the number of alternatives, and c is the number of analysis cells (in our case, c is the largest product of levels of any two attributes since we are considering two-way interaction effects in addition to the main effects). According to this equation, minimum sample size needs to be greater than or equal to 500 respondents; our collected sample is greater than the minimum requirement (695 respondents).
10
1234
5
6789
1011121314151617181920212223242526
27
282930313233

4.1 Demographic Profile of Commuter CyclistsOf the 695 commuter cyclists, fifty-eight percent are males and 42 percent are females. This gender difference reflects the lower participation of women in bicycle commuting. By age, two-fifths (40%) of the respondents are between the ages of 25 and 34, suggesting that commuter cyclists tend to belong to a younger age cohort. The majority is highly educated (80%), 46 percent held graduate degrees while 34 percent had completed a bachelor degree. More than three-fifths of the respondents are employed full-time, approximately 7 percent are employed part-time, and 30 percent are students. More than half the respondents have a flexible work schedule. The major proportion (52%) of the commuter cyclists belong to a household earning a minimum of $75,000 a year or more. This over-representation of affluent and highly educated individuals in a web-based survey has been observed in other studies as well (Sener et al., 2009; Hansen and Nielsen, 2014). Although it may indicate bias in the data collection method, it also reflects that cycling, especially commuting, is popular among professionals with higher education level. The vast majority of cyclists reside in multi-individual households (77%). The prevalence of cyclists from households owning multiple bicycles (78 percent of cyclists’ households owned at least 2 bicycles) and reduced automobile fleet size (42 percent of cyclists’ households did not own a car and 38 percent owned a single vehicle) is perhaps indicative that our commuter cyclist sample is predominantly composed of avid cyclists. Descriptive statistics for the sample used in this study are presented in Table 32. For the sake of brevity, we provide full details of the demographic composition and other bicyclist characteristics in a companion paper (Anowar et al., 2017).
4.2 Model ResultsOur model performs well in that all parameters have expected signs and most are highly significant. The yardstick equal probability model has the log-likelihood of -3817.68. The log-likelihood at convergence of the mixed multinomial logit model with interactions is -2759.65. The corresponding log-likelihood value at convergence for the traditional multinomial logit model without unobserved heterogeneity terms is -2765.47. Clearly, the two models are substantially superior to the equal probability model. Among the two models, the likelihood ratio (LR) test value computed is 11.64 which is higher than the critical chi-square ( χ2 )value with 1 degrees of freedom at any reasonable level of confidence. This clearly indicates the presence of unobserved individual factors that influence bicyclist route choice decisions. Therefore, in the subsequent sections, we discuss the effects of variables by variable category obtained from the MMNL model only. The estimation results are presented in Table 4.
4.2.1 Roadway CharacteristicsWe tried three roadway characteristics in our model: grade, volume, and functional type. The effect of roadway grade is introduced with the flat grade type as the base. The negative sign on
2 Please note that our sample includes bicyclists from multiple cities and this makes the task of checking the representativeness of the sample a challenging task. However, we compared the sociodemographic characteristics of our Toronto sub-sample with the 2011 Transportation Tomorrow Survey (TTS) of the city. Even this comparison was difficult since our variable categories didn’t exactly match with the TTS. Moreover, cyclists’ education level and household income are not collected in the TTS. From the comparison, we found that our commuter cyclist subsample of Toronto has an overrepresentation of females, young cyclists of 25-34 years of age, and an underrepresentation of older cyclists who are more than 45 years of age. It is important to note that the 2011 TTS data was predominantly based on phone calls (land-line) which underrepresents the younger generation and downtown residents in high-rise condominium buildings.
11
123456789
1011121314151617181920212223242526272829303132333435363738
123456789

the steep grade indicates that commuter cyclists prefer flat or moderate grades to steep grades. This is particularly so for females (relative to male). The result might be attributable to the fact that pedaling is difficult and strenuous where there is steep incline and high speed on steep declines might be discomforting too. Moreover, women might be less willing to undertake additional physical activity and effort leading to perspirations while commuting to work (see similar results in Sener et al., 2009). As expected, bicyclists were disinclined to use routes with higher motorized traffic presumably due to safety concerns (Akar and Clifton, 2009). Furthermore, the larger magnitude of the coefficient on heavy traffic volume indicates that bicyclists prefer moderate traffic to heavy traffic. This is intuitive, since increased number of motor vehicles means greater possibility of conflict, particularly with turning vehicles which poses a serious safety threat. The negative sign on major and minor arterial street classes suggest that commuter cyclists prefer residential streets to non-residential streets (see Winters et al., 2010 for similar results). On residential streets, there are generally less motor vehicle traffic, hence there is reduced potential of conflict. Moreover, speed limits on these roadways are usually lower, forcing vehicles to travel at a lower speed, reducing the safety hazards to the cyclists. Females perhaps feel more comfortable riding with vehicles traveling at lower speed, hence they favorably evaluate residential streets.
4.2.2 Bike Route CharacteristicsThe effect of bicycle facility type is also as expected. Positive coefficient on continuous and exclusive cycling infrastructures clearly underscores the preference among bicyclists for uninterrupted and laterally separated facilities. Exclusivity of bike facilities from motor vehicle traffic is more desired by females. Researchers have found that riding alongside motor vehicles create emotional stress to cyclists (O’Connor and Brown, 2010; Heesch et al., 2011; Heesch et al., 2015; Kaplan and Prato, 2013). Since, females are more risk averse by nature (Garrard et al., 2008; Byrnes et al., 1999), they tend to be more concerned about cycling in mixed traffic than men (Garrard et al., 2006).
4.2.3 Air PollutionExposure to air pollution was expressed in terms of two attributes. The first is the mean exposure level ranging from 5-15 ppb (for NO2) and the second is the maximum exposure level ranging from 20-60 ppb (for NO2). This type of variable is novel in bicycle route choice analysis. First, as expected, we observed that commuter cyclists tend to choose routes with lower air pollution levels. The higher negative coefficient for mean exposure level indicates that cyclists are more sensitive towards a constant level of pollution on a regular basis rather than instantaneous exposure to high levels of NO2 which typically occur while riding behind a transit bus or diesel truck. The coefficients on mean exposure and its interaction term with biking experience indicate that inexperienced cyclists are more willing to avoid air pollution.
We also found that cyclists react to information provided to them. Intuitively, compared to the cyclists who didn’t receive any air pollution related health hazard information, those who were informed about short term impacts tended to be more concerned about avoiding maximum exposure. However, cyclists were found to be indifferent towards long term exposure information. The results obtained have interesting implications. First, it is perhaps indicating towards types of cyclists – one group who are air pollution conscious and the other who are air pollution neutral. Second, dissemination of simplistic, easily relatable and comprehensible health impacts (such as increased heart rate/breathing stress) of air pollution exposure might have more
12
123456789
10111213141516171819202122232425262728293031323334353637383940414243444546

effect on cyclists’ route choice decision. The issue certainly requires further investigation. Moreover, there is a statistically significant variation due to unobserved effects in the sensitivity to maximum exposure levels. The results indicate that nearly 12% of the respondents have a positive value for the parameter for the maximum exposure. The result highlights how a small subset of individuals in the sample are indifferent to maximum exposure.
4.2.4 Trip CharacteristicsThe final set of variables in the results table corresponds to travel time effects. The coefficient of this variable is negative as expected and highly significant indicating commuter cyclists’ high preference for shorter travel times. The travel time variable has several interactions, including those with gender, age, biking frequency, and actual commute length. It reveals the following trends: (1) females are less time sensitive, (2) young (aged 25-34 years) commuter cyclists are more sensitive to travel time, perhaps because they prefer more fast-paced lifestyle, (3) older individuals (more than 55 years) have a lower sensitivity to travel time, perhaps because they have more time availability in general, (4) frequent riders prefer shorter commute time, and (5) those who make long commute trips are willing to endure longer commute durations.
4.3 Trade-off AnalysisBased on our estimation results, we conducted two additional analyses. First, based on the estimated coefficients in our model, we evaluated the relative magnitudes of the effects of route attributes on the route choice decision of cyclists. Note that all of our route attributes except mean exposure, maximum exposure, and travel time were indicator variables. Hence, we computed the contribution to utility of these three variables at their average value in the sample. For instance, the average value of travel time across all routes presented to respondents was 30 minutes and the contribution to utility was -0.081 from the model. Therefore, the average contribution to utility of travel time was computed as 30 × -0.081 = -2.43. Similarly, the average contribution to utility of mean and maximum exposures were -0.54 and -0.76, respectively. When compared with the coefficient values of the indicator variables in Table 4, it was no surprise that we found that travel time is the most important route characteristics for bicycle commuters, followed by heavy traffic volume, whether the bicycle route is along a major arterial, and steepness of roadway. On the other hand, whether the route is along minor arterial or not is the least important attribute in route choice evaluation decision of commuter cyclists.
Second, we computed the time-based trade-offs, i.e. how much (in minutes) bicyclists are willing to travel extra for using routes with better facilities or less traffic-generated pollution3. The results are presented in Table 5. We compared the travel time trade-offs across genders. Following conventional literature, these time-values are calculated by dividing the coefficients of each attribute by the coefficient of travel time. Note that the positive value signifies the additional travel time bicyclists are ready to incur to avoid that attribute, while negative values signify the additional time bicyclists would be willing to travel to avail themselves of the attribute. The results show that time values of attributes are quite similar for male and female commuter cyclists. However, the exceptions occurred for steep grade, whether the bicycle facility is located on a major arterial or not, and exclusivity of the facility. We also found that our computed trade-off values for roadway and bike attributes are in line with previous route choice studies. For instance, Tilahun et al. (2007) reported that cyclists are willing to travel 16.41 3 Of the 695 commuter cyclists, we found that only four respondents consistently made route selection based on the minimum travel time, only one on lowest mean exposure, and only four on lowest maximum exposure. So, we can see that the majority of the respondents were actually evaluating trade-offs.
13
123456789
1011121314151617181920212223242526272829303132333435363738394041424344
123

minutes extra to travel on a designated bike lane. In our study, we observed that cyclists are willing to travel 11-17 minutes to travel on continuous and exclusive bike facilities. The study by Sener et al. (2009) reported that commuter bicyclists are willing to travel approximately 11 minutes more to avoid moderate traffic and 31-39 minutes extra to avoid heavy traffic. In our case, commuter cyclists are willing to travel 9 minutes more to avoid moderate traffic and 20 minutes more to avoid heavy traffic.
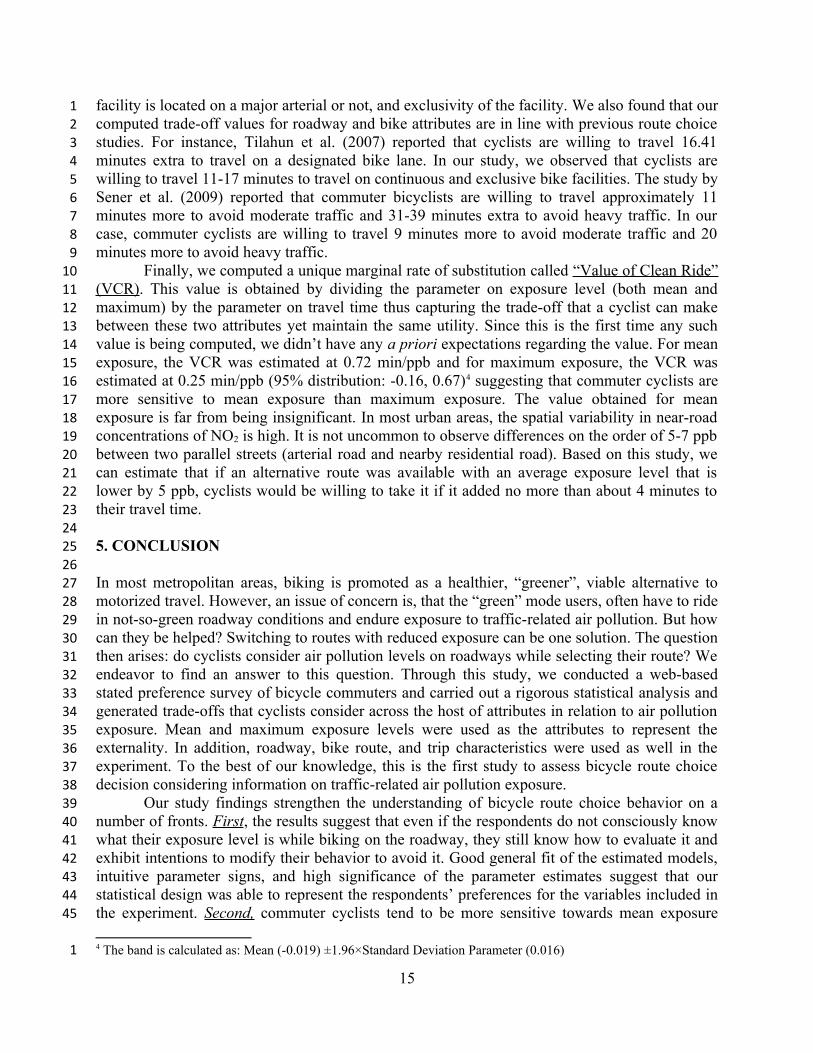
Finally, we computed a unique marginal rate of substitution called “Value of Clean Ride” (VCR). This value is obtained by dividing the parameter on exposure level (both mean and maximum) by the parameter on travel time thus capturing the trade-off that a cyclist can make between these two attributes yet maintain the same utility. Since this is the first time any such value is being computed, we didn’t have any a priori expectations regarding the value. For mean exposure, the VCR was estimated at 0.72 min/ppb and for maximum exposure, the VCR was estimated at 0.25 min/ppb (95% distribution: -0.16, 0.67)4 suggesting that commuter cyclists are more sensitive to mean exposure than maximum exposure. The value obtained for mean exposure is far from being insignificant. In most urban areas, the spatial variability in near-road concentrations of NO2 is high. It is not uncommon to observe differences on the order of 5-7 ppb between two parallel streets (arterial road and nearby residential road). Based on this study, we can estimate that if an alternative route was available with an average exposure level that is lower by 5 ppb, cyclists would be willing to take it if it added no more than about 4 minutes to their travel time.
5. CONCLUSION
In most metropolitan areas, biking is promoted as a healthier, “greener”, viable alternative to motorized travel. However, an issue of concern is, that the “green” mode users, often have to ride in not-so-green roadway conditions and endure exposure to traffic-related air pollution. But how can they be helped? Switching to routes with reduced exposure can be one solution. The question then arises: do cyclists consider air pollution levels on roadways while selecting their route? We endeavor to find an answer to this question. Through this study, we conducted a web-based stated preference survey of bicycle commuters and carried out a rigorous statistical analysis and generated trade-offs that cyclists consider across the host of attributes in relation to air pollution exposure. Mean and maximum exposure levels were used as the attributes to represent the externality. In addition, roadway, bike route, and trip characteristics were used as well in the experiment. To the best of our knowledge, this is the first study to assess bicycle route choice decision considering information on traffic-related air pollution exposure.
Our study findings strengthen the understanding of bicycle route choice behavior on a number of fronts. First, the results suggest that even if the respondents do not consciously know what their exposure level is while biking on the roadway, they still know how to evaluate it and exhibit intentions to modify their behavior to avoid it. Good general fit of the estimated models, intuitive parameter signs, and high significance of the parameter estimates suggest that our statistical design was able to represent the respondents’ preferences for the variables included in the experiment. Second, commuter cyclists tend to be more sensitive towards mean exposure along the route than the maximum exposure levels and there is a variation in sensitivity to maximum exposure due to unobserved factors. Third, travel time is the most important attribute for commuter cyclists in their route choice decision. But they are willing to travel extra minutes
4 The band is calculated as: Mean (-0.019) ±1.96×Standard Deviation Parameter (0.016)
14
123456789
101112131415161718192021222324252627282930313233343536373839404142434445
1
to reduce their exposure from traffic-related air pollution. For mean exposure, the value of clean ride (VCR) is: 0.72 min/ppb and for maximum exposure, the VCR band is computed as 0.25 min/ppb (95% distribution: -0.16, 0.67). Fourth, our study highlights bicyclists’ preference for continuous and exclusive bicycle facilities, lower traffic volume, and lower speed limits on roadways. Moreover, gender sensitivity to roadway characteristics and bike facilities is also established. This is in line with the results reported in existing studies in the literature.
In conclusion, the value obtained for mean exposure is far from being insignificant. In most urban areas, the spatial variability in near-road concentrations of nitrogen dioxide (NO2) is high. It is not uncommon to observe differences on the order of 5-7 ppb between two parallel streets (arterial road and nearby residential road). Based on this study, we can estimate that if an alternative route was available with an average exposure level that is lower by 5 ppb, cyclists would be willing to take it if it added no more than about 4 minutes to their travel time. Hence, there is merit in developing routing algorithms that can propose lower exposure alternatives combined with easily understandable health impact information. The results also suggest that bicyclists’ exposure to air pollution should be incorporated and emphasized in bicycle facility planning. In addition, findings of the model can be used to assess and improve existing bike routes as well as to plan and implement better new routes.
However, the study is not without limitations. The estimated coefficients for mean exposure and maximum exposure rely on how respondents visualized the air pollution. While we provided general information on the impact of air pollution, it was beyond the scope of the analysis, to educate bicyclists on impact of pollution ppb on health. So, in general, the respondents are unlikely to “evaluate” exact impacts of air pollution on health. Rather, they are likely to make decisions as per their expectations of air pollution represented by values provided in the SP game. A more involved study can be conducted for investigation into defining the attribute with varying pollutant types and if the VCR value varies with the change in pollutant type. We leave that for future research explorations.
ACKNOWLEDGMENT
We would like to express our deepest gratitude to everyone who helped in disseminating the survey, particularly Professor Richard Tay, Keenan Dixon, Tyler Irving, and Junshi Xu. We also like to thank Chris Harding and Susanna Choy for their help with the TTS data. This study has been funded by an interdisciplinary grant from the Canadian Institutes of Health Research and the Natural Sciences and Engineering Research Council of Canada under the program “Collaborative Health Research Projects (CHRP).” The authors would also like to acknowledge insightful feedback on an earlier version of the manuscript from two anonymous reviewers.
REFERENCES
1. Abraham, J., McMillan, S., Brownlee, A. T., & Hunt, J. (2002). Investigation of Cycling Sensitivities. Paper presented at the 81st Annual Meeting of the Transportation Research Board (TRB), Washington DC.
2. Adamowicz, W., Louviere, J., & Williams, M. (1994). Combining Revealed and Stated Preference Methods for Valuing Environmental Amenities. Journal of Environmental Economics and Management, 26(3), 271-292.
15
123456789
101112131415161718192021222324252627282930313233343536373839404142434445

3. Ahmed, F., Rose, G., & Jakob, C. (2013). Commuter Cyclist Travel Behavior. Transportation Research Record: Journal of the Transportation Research Board, 2387, 76-82.
4. Akar, G., & Clifton, K. (2009). Influence of Individual Perceptions and Bicycle Infrastructure on Decision to Bike. Transportation Research Record: Journal of the Transportation Research Board, 2140, 165-172.
5. Anable, J., & Gatersleben, B. (2005). All Work and No Play? The Role of Instrumental and Affective Factors in Work and Leisure Journeys by Different Travel Modes. Transportation Research Part A: Policy and Practice, 39(2), 163-181.
6. Anowar, S., Eluru, N., & Hatzopoulou, M. (2017). Who are commuter and non-commuter cyclists? An in-depth exploration of their characteristics, habits and perceptions. Paper presented at the 96th Annual Meeting of the Transportation Research Board (TRB), Washington D.C. No. 17-03435. http://amonline.trb.org/63532-trb-1.3393340/t026-1.3403500/852-1.3403517/17-03435-1.3402199/17-03435-1.3500944#tab_0=0.
7. Badland, H. M., & Duncan, M. J. (2009). Perceptions of air pollution during the work-related commute by adults in queensland, australia. Atmospheric Environment, 43(36), 5791-5795.
8. Bhat, C. R. (2001). Quasi-random Maximum Simulated Likelihood Estimation of the Mixed Multinomial Logit Model. Transportation Research Part B: Methodological, 35(7), 677-693.
9. Bhat, C. R., Dubey, S. K., & Nagel, K. (2015). Introducing Non-normality of Latent Psychological Constructs in Choice Modeling with an Application to Bicyclist Route Choice. Transportation Research Part B: Methodological, 78, 341-363.
10. Bigazzi, A. Y., Broach, J., & Dill, J. (2016). Bicycle route preference and pollution inhalation dose: Comparing exposure and distance trade-offs. Journal of Transport & Health, 3(1), 107-113.
11. Broach, J., & Bigazzi, A. Y. (2017). Existence and use of low pollution route options for observed bicycling trips. Paper presented at the 96th Annual Meeting of the Transportation Research Board (TRB), Washington D.C.
12. Broach, J., Dill, J., & Gliebe, J. (2012). Where Do Cyclists Ride? A Route Choice Model Developed with Revealed Preference GPS Data. Transportation Research Part A: Policy and Practice, 46(10), 1730-1740.
13. Bunch, D. S., Bradley, M., Golob, T. F., Kitamura, R., & Occhiuzzo, G. P. (1993). Demand for Clean-fuel Vehicles in California: A Discrete-choice Stated Preference Pilot Project. Transportation Research Part A: Policy and Practice, 27(3), 237-253.
14. Byrnes, J. P., Miller, D. C., & Schafer, W. D. (1999). Gender Differences in Risk Taking: A Meta-Analysis. Psychological Bulletin, 125(3), 367.
15. Caulfield, B., Brick, E., & McCarthy, O. T. (2012). Determining Bicycle Infrastructure Preferences – A Case Study of Dublin. Transportation Research Part D: Transport and Environment, 17(5), 413-417.
16. Chen, C.-F., & Chen, P.-C. (2013). Estimating Recreational Cyclists’ Preferences for Bicycle Routes – Evidence from Taiwan. Transport Policy, 26, 23-30.
17. Cole-Hunter, T., Morawska, L., Stewart, I., Hadaway, M., Jayaratne, R., & Solomon, C. (2013). Utility of an Alternative Bicycle Commute Route of Lower Proximity to Motorised Traffic in Decreasing Exposure to Ultra-Fine Particles, Respiratory Symptoms and Airway Inflammation – A Structured Exposure Experiment. Environmental Health, 12(1), 29.
16
123456789
10111213141516171819202122232425262728293031323334353637383940414243444546

18. Davies, G., & Whyatt, J. D. (2014). A Network-Based Approach for Estimating Pedestrian Journey-Time Exposure to Air Pollution. Science of The Total Environment, 485–486, 62-70.
19. DeGruyter, C. (2003). Exploring Bicycle Level of Service in A Route Choice Context. Transport Engineering in Australia, 9(1), 5-11.
20. Eluru, N., Bhat, C. R., & Hensher, D. A. (2008). A Mixed Generalized Ordered Response Model for Examining Pedestrian and Bicyclist Injury Severity Level in Traffic Crashes. Accident Analysis & Prevention, 40(3), 1033-1054.
21. Fernández-Heredia, Á., Monzón, A., & Jara-Díaz, S. (2014). Understanding Cyclists’ Perceptions, Keys for A Successful Bicycle Promotion. Transportation Research Part A: Policy and Practice, 63, 1-11.
22. Flamm, B. (2009). The Impacts of Environmental Knowledge and Attitudes on Vehicle Ownership and Use. Transportation Research Part D: Transport and Environment, 14(4), 272-279.
23. Gaker, D., Vautin, D., Vij, A., & Walker, J. L. (2011). The Power and Value of Green in Promoting Sustainable Transport Behavior. Environmental Research Letters, 6(3), 1-10.
24. Gaker, D., & Walker, J. L. (2013). Revealing the Value of “Green” and the Small Group with a Big Heart in Transportation Mode Choice. Sustainability, 5(7), 2913-2927.
25. Gaker, D., Zheng, Y., & Walker, J. (2010). Experimental Economics in Transportation: Focus on Social Influences and Provision of Information. Transportation Research Record: Journal of the Transportation Research Board, 2156, 47-55.
26. Garrard, J., Crawford, S., & Hakman, N. (2006). Revolutions for Women: Increasing Women’s Participation in Cycling for Recreation and Transport. Retrieved from https://www.researchgate.net/profile/Natalie_Hakman/publication/270762586_Revolutions_for_Women_Increasing_women's_participation_in_cycling_for_recreation_and_transport_(Final_Report)/links/54b49d060cf28ebe92e480b7.pdf
27. Garrard, J., Rose, G., & Lo, S. K. (2008). Promoting Transportation cycling for women: The role of bicycle infrastructure. Preventive medicine, 46(1), 55-59.
28. Good, N., Mölter, A., Ackerson, C., Bachand, A., Carpenter, T., Clark, M. L., . . . Volckens, J. (2016). The fort collins commuter study: Impact of route type and transport mode on personal exposure to multiple air pollutants. Journal of Exposure Science and Environmental Epidemiology, 26(4), 397-404.
29. González, F., Melo-Riquelme, C., & de Grange, L. (2016). A Combined Destination and Route Choice Model for a Bicycle Sharing System. Transportation, 43(3), 407-423.
30. Hankey, S., Lindsey, G., & Marshall, J. D. (2017). Population-level exposure to particulate air pollution during active travel: Planning for low-exposure, health-promoting cities. Environmental Health Perspectives, 125(4), 527.
31. Hansen, K. B., & Nielsen, T. A. S. (2014). Exploring Characteristics and Motives of Long Distance Commuter Cyclists. Transport Policy, 35, 57-63.
32. Hatzopoulou, M., Weichenthal, S., Barreau, G., Goldberg, M., Farrell, W., Crouse, D., & Ross, N. (2013). A Web-Based Route Planning Tool to Reduce Cyclists' Exposures to Traffic Pollution: A Case Study in Montréal, Canada. Environmental Research, 123, 58-61.
33. Heesch, K. C., Giles-Corti, B., & Turrell, G. (2015). Cycling for Transport and Recreation: Associations with the Socio-Economic, Natural and Built Environment. Health & Place, 36, 152-161.
17
123456789
101112131415161718192021222324252627282930313233343536373839404142434445

34. Heesch, K. C., Sahlqvist, S., & Garrard, J. (2011). Cyclists' Experiences of Harassment from Motorists: Findings from A Survey of Cyclists in Queensland, Australia. Preventive Medicine, 53(6), 417-420.
35. Hensher, D. A. (1994). Stated Preference Analysis of Travel Choices: The State of Practice. Transportation, 21(2), 107-133.
36. Hertel, O., Hvidberg, M., Ketzel, M., Storm, L., & Stausgaard, L. (2008). A Proper Choice of Route Significantly Reduces Air Pollution Exposure - A Study On Bicycle and Bus Trips in Urban Streets. Science of The Total Environment, 389(1), 58-70.
37. Hood, J., Sall, E., & Charlton, B. (2011). A GPS-based Bicycle Route Choice Model for San Francisco, California. Transportation Letters, 3(1), 63-75.
38. Hunt, J., Abraham, J., & Patterson, D. (1995). Computer Generated Conjoint Analysis Surveys for Investigating Citizen Preferences. Paper presented at the Proceedings of the 4th International Conference on Computers in Urban Planning and Urban Management, Melbourne.
39. Hunt, J. D., & Abraham, J. E. (2007). Influences on Bicycle Use. Transportation, 34(4), 453-470.
40. Jara‐Díaz, S. R., Vergara, C., & Gálvez, T. (2006). Methodology to Calculate Social Values for Air Pollution Using Discrete Choice Models. Transport Reviews, 26(4), 435-449.
41. Jarjour, S., Jerrett, M., Westerdahl, D., de Nazelle, A., Hanning, C., Daly, L., . . . Balmes, J. (2013). Cyclist Route Choice, Traffic-Related Air Pollution, and Lung Function: A Scripted Exposure Study. Environ Health, 12, 14.
42. Johnson, R., & Orme, B. (2003). Getting the Most from CBC. Sequim: Sawtooth Software Research Paper Series, Sawtooth Software; 2003.
43. Kaoru, Y., Smith, V. K., & Liu, J. L. (1995). Using Random Utility Models to Estimate the Recreational Value of Estuarine Resources. American Journal of Agricultural Economics, 77(1), 141-151.
44. Kaplan, S., & Prato, C. G. (2013). Cyclist–motorist Crash Patterns in Denmark: A Latent Class Clustering Approach. Traffic Injury Prevention, 14(7), 725-733.
45. Maibach, E., Steg, L., & Anable, J. (2009). Promoting Physical Activity and Reducing Climate Change: Opportunities to Replace Short Car Trips with Active Transportation. Preventive medicine, 49(4), 326-327.
46. McLaren, J., & Williams, I. (2015). The Impact of Communicating Information About Air Pollution Events on Public Health. Science of The Total Environment, 538, 478-491.
47. Menghini, G., Carrasco, N., Schüssler, N., & Axhausen, K. W. (2010). Route Choice of Cyclists in Zurich. Transportation Research Part A: Policy and Practice, 44(9), 754-765.
48. Mölter, A., & Lindley, S. (2015). Influence of walking route choice on primary school children's exposure to air pollution – A proof of concept study using simulation. Science of The Total Environment, 530, 257-262.
49. O’Connor, J. P., & Brown, T. D. (2010). Riding with the Sharks: Serious Leisure Cyclist's Perceptions of Sharing the Road with Motorists. Journal of Science and Medicine in Sport, 13(1), 53-58.
50. Ortúzar, J., & Rodrı́guez, G. (2002). Valuing Reductions in Environmental Pollution in a Residential Location Context. Transportation Research Part D: Transport and Environment, 7(6), 407-427.
18
123456789
1011121314151617181920212223242526272829303132333435363738394041424344

51. Panis, L. I., De Geus, B., Vandenbulcke, G., Willems, H., Degraeuwe, B., Bleux, N., . . . Meeusen, R. (2010). Exposure to Particulate Matter in Traffic: A Comparison of Cyclists and Car Passengers. Atmospheric Environment, 44(19), 2263-2270.
52. Parkin, J., Wardman, M., & Page, M. (2008). Estimation of the Determinants of Bicycle Mode Share for The Journey to Work Using Census Data. Transportation, 35(1), 93-109.
53. Parsons, G. R., & Kealy, M. J. (1992). Randomly Drawn Opportunity Sets in a Random Utility Model of Lake Recreation. Land Economics, 68, 93-106.
54. Peters, A., Von Klot, S., Heier, M., Trentinaglia, I., Hörmann, A., Wichmann, H. E., & Löwel, H. (2004). Exposure to Traffic and The Onset of Myocardial Infarction. New England Journal of Medicine, 351(17), 1721-1730.
55. Rojas-Rueda, D., de Nazelle, A., Tainio, M., & Nieuwenhuijsen, M. J. (2011). The Health Risks and Benefits of Cycling in Urban Environments Compared with Car Use: Health Impact Assessment Study. British Medical Journal, 343, d4521.
56. Sener, I. N., Eluru, N., & Bhat, C. R. (2009). An Analysis of Bicycle Route Choice Preferences in Texas, US. Transportation, 36(5), 511-539.
57. Sharker, M. H., & Karimi, H. A. (2014). Computing Least Air Pollution Exposure Routes. International Journal of Geographical Information Science, 28(2), 343-362.
58. Sillano, M., & de Dios Ortúzar, J. (2005). Willingness-to-pay Estimation with Mixed Logit Models: Some New Evidence. Environment and Planning A, 37(3), 525-550.
59. Strauss, J., Miranda-Moreno, L., Crouse, D., Goldberg, M. S., Ross, N. A., & Hatzopoulou, M. (2012). Investigating the link between cyclist volumes and air pollution along bicycle facilities in a dense urban core. Transportation Research Part D: Transport and Environment, 17(8), 619-625.
60. Stinson, M. A., & Bhat, C. R. (2003). Commuter Bicyclist Route Choice: Analysis Using a Stated Preference Survey. Transportation Research Record, 1828, 107-115.
61. Su, J. G., Winters, M., Nunes, M., & Brauer, M. (2010). Designing a Route Planner to Facilitate and Promote Cycling in Metro Vancouver, Canada. Transportation Research Part A: Policy and Practice, 44(7), 495-505.
62. Tay, R., & McCarthy, P. (1994). Benefits of Improved Water Quality: A Discrete Choice Analysis of Freshwater Recreational Demands. Environment and Planning A, 26(10), 1625-1638.
63. Tilahun, N. Y., Levinson, D. M., & Krizek, K. J. (2007). Trails, Lanes, or Traffic: Valuing Bicycle Facilities with an Adaptive Stated Preference Survey. Transportation Research Part A: Policy and Practice, 41(4), 287-301.
64. Vinzents, P. S., Møller, P., Sørensen, M., Knudsen, L. E., Hertel, O., Jensen, F. P., . . . Loft, S. (2005). Personal Exposure to Ultrafine Particles and Oxidative DNA Damage. Environmental Health Perspectives, 1485-1490.
65. Wardman, M., & Bristow, A. L. (2004). Traffic Related Noise and Air Quality Valuations: Evidence from Stated Preference Residential Choice Models. Transportation Research Part D: Transport and Environment, 9(1), 1-27.
66. Weichenthal, S., Kulka, R., Dubeau, A., Martin, C., Wang, D., & Dales, R. (2011). Traffic-related Air Pollution and Acute Changes in Heart Rate Variability and Respiratory Function in Urban Cyclists. Environmental Health Perspectives, 119(10), 1373.
67. Wen, L. M., & Rissel, C. (2008). Inverse Associations Between Cycling to Work, Public Transport, And Overweight and Obesity: Findings from A Population Based Study in Australia. Preventive Medicine, 46(1), 29-32.
19
123456789
10111213141516171819202122232425262728293031323334353637383940414243444546

68. Winters, M., Davidson, G., Kao, D., & Teschke, K. (2011). Motivators and Deterrents of Bicycling: Comparing Influences On Decisions to Ride. Transportation, 38(1), 153-168.
69. Winters, M., & Teschke, K. (2010). Route Preferences Among Adults in The Near Market for Bicycling: Findings of The Cycling in Cities Study. American Journal of Health Promotion, 25(1), 40-47.
70. Yeboah, G., & Alvanides, S. (2015). Route Choice Analysis of Urban Cycling Behaviors Using OpenStreetMap: Evidence from a British Urban Environment OpenStreetMap in GIScience (pp. 189-210): Springer.
20
12345678

FIGURE 1 Screenshot of Sample Choice Task in the Survey
18
1
2

TABLE 1 Literature Review Matrix
No. Study Choice Context Study AreaPollutants
Considered (Units)
Method of Analysis
Shortest Routes Exposure
1. Hankey et al. (2017) Bicycle and pedestrian streets and trails
Minneapolis, USA
PM2.5 (μg/m3),BC(μg/m3)
--- Land use regression (LUR) model
2. Good et al. (2016) Bicycle route Fort Collins, USA
BC(μg/m3), PM2.5 (μg/m3),
PNC (#/cm3),CO (ppm)
Manually selected routes Field measurement
3. Molter and Lindley (2015)Walking routes of
primary school children
Manchester, UKNO2 (μg/m3), PM10 (μg/m3)
Simulation Land use regression (LUR) model
4. Davies and Hyatt (2014) Walking route of pedestrians Lancaster, UK PM2.5 (μg) ArcGIS network analysis Dispersion modeling
5. Sharker and Karimi (2014) Road network routes Pittsburgh, USA O3 (ppb) --- EPA data
6. Hatzopoulou et al. (2013) Bicycle route Montreal, Canada NO2 (ppb)
ArcGIS network analysis based on real life origins
and destinations
Land use regression (LUR) model
7. Jarjour et al. (2013) Bicycle route Berkeley, California
PM2.5 (μg/m3), CO (ppm),
BC(μg/m3)Manually selected routes Actual measurement
8. Cole-Hunter et al. (2013) Bicycle route Queensland, Australia PNC (ppcc) Manually selected routes Actual measurement
9. Su et al. (2010) Bicycle route Vancouver, Canada NO2 (ppb) Google map interface Land use regression
(LUR) model
10. Hertel et al. (2008) Bicycle and transit route
Copenhagen, Denmark
NOx(μg/m3), CO(μg/m3), NO2(μg/m3), PM10(μg/m3), PM2.5(μg/m3)
ArcGIS network analysis Street pollution model
18
1

TABLE 2 Attribute Levels for the SP ExperimentsAttribute Category Attribute Definition of Attribute Attribute Levels
Roadway characteristics
Grade Nature of terrain1. Flat2. Moderate 3. Steep
Traffic volume Amount of traffic on the roadway1. Light2. Moderate3. Heavy
Roadway type Functional classification of roadway
1. Residential /Local roads 2. Minor arterial3. Major arterial
Bike route characteristics
Cycling infrastructure continuity
Continuous bike route – if the whole route has a bicycle facility (a bike lane or shared-use path)
Discontinuous - otherwise
1. Continuous2. Discontinuous
Cycling infrastructure segregation
Exclusive/Segregated – if physically separated from motor vehicle traffic
Shared – otherwise
1. Exclusive2. Shared
Environmental condition
Amount of traffic-related air pollution subjected to while cycling
Mean exposure levels to pollutants1. 5 ppb2. 10 ppb3. 15 ppb
Maximum exposure levels to pollutants
1. 20 ppb2. 40 ppb3. 60 ppb
Trip characteristics Duration of trip Travel time to destination
1. 20 minutes2. 25 minutes3. 30 minutes4. 35 minutes 5. 40 minutes
19
1
2

TABLE 3 Sample Characteristics
Demographics Percentages within Sample of Respondents
GenderMales: 58%
Females: 42%
Age
18-24 years: 19%
25-34 years: 41%
35-44 years: 20%
45-54 years: 13%
55-64 years: 6%
≥ 65 years: 1%
Education
High school: 10%
College: 10%
Bachelors: 33%
Graduate or higher: 47%
Employment Type
Student: 30%
Full-time worker: 61%
Part-time worker: 7%
Retired: 1%
Not/self-employed: 1%
Household Income
≤ $30K: 21%
$30K-$45K: 8%
$45K-$60K: 9%
$60K-$75K: 11%
$75K-$100K: 13%
$100K-$150K: 20%
≥ $150K: 19%
Household Size
1 person: 23%
2 persons: 36%
3 persons: 18%
≥4 persons: 22%
24
1

TABLE 4 Estimation ResultsAttribute Category Attribute Attribute Levels Coefficient t-statistics
Roadway characteristics
Grade (Base: Flat)
Steep -0.982 -10.579
Female -0.804 -5.601
Traffic volume (Base: Light)
Moderate -0.657 -7.729
Heavy -1.508 -16.662
Roadway type (Base: Residential roads)
Minor arterial -0.398 -4.776
Major arterial -1.290 -15.025
Female -0.345 -2.576
Bike route characteristics
Infrastructure continuity(Base: Discontinuous) Continuous 0.879 13.485
Infrastructure segregation(Base: Shared)
Exclusive 0.939 10.353
Female 0.306 2.561
Environmental condition
Mean exposure
Mean exposure -0.054 -8.791
Biking experience (Base: 2 or more years)
Less than 2 years -0.021 -1.961
Maximum exposure
Maximum exposure -0.019 -10.271
Standard deviation 0.016 6.480
Exposure impact information (Base: No information)
Short-term -0.007 -2.148
Trip Travel time Travel time -0.075 -4.551
21
1

characteristics
Female 0.018 2.942
Age (Base: 18-24 years)
25-34 years -0.043 -6.740
55-64 years 0.027 2.656
65 years or more 0.056 2.762
Biking frequency (Base: Rarely)
Once or several times a month -0.049 -2.988
Daily -0.080 -4.982
Commute length (Base: Short commute)
Moderate 0.030 4.831
Long 0.072 7.997
Log-likelihood at convergence (N = 3475): -2759.65
22
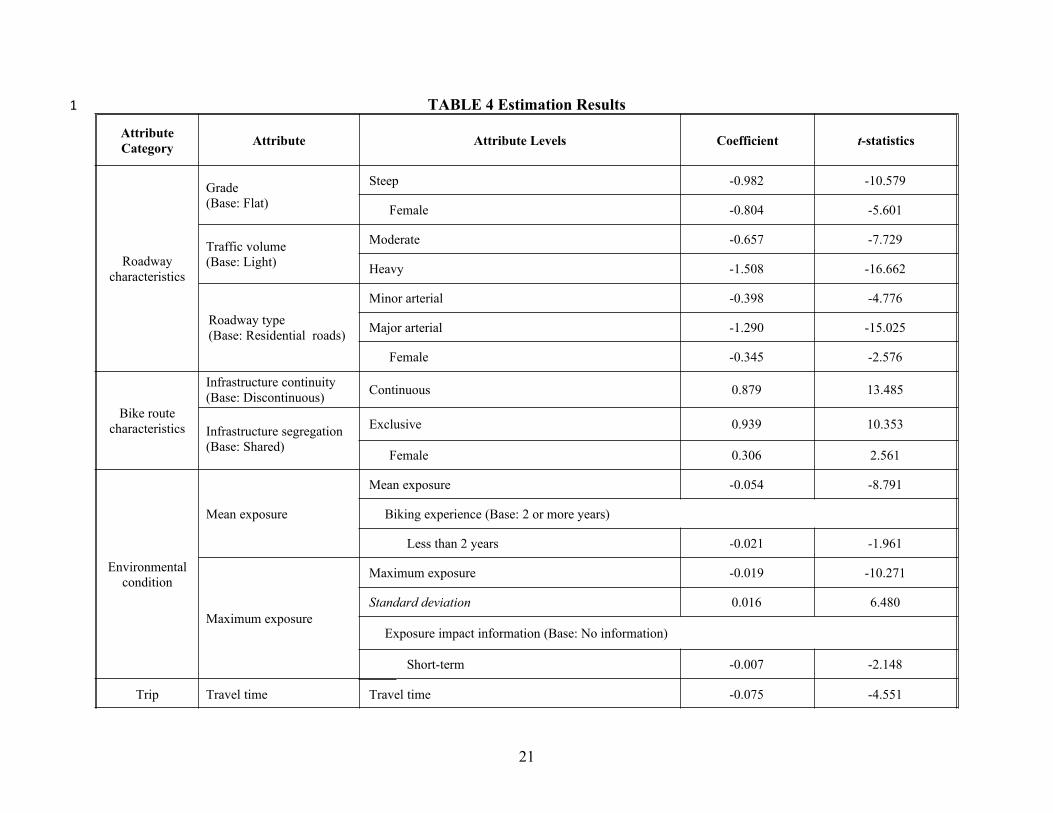
TABLE 5 Time based Trade-offs across Gender
Attribute Attribute LevelsTime Value (minutes)
Male Female
Grade Steep 13.10 23.81
Traffic volumeModerate 8.76 8.76
Heavy 20.11 20.11
Roadway typeMinor arterial 5.31 5.31
Major arterial 17.20 21.80
Infrastructure continuity Continuous 11.72 11.72
Infrastructure segregation Exclusive 12.52 16.60
Environmental conditionMean exposure (10 ppb) 7.20 7.20
Maximum exposure (40 ppb) 10.13 (-6.6/26.8) 10.13 (-6.6/26.8)
23
1
2