Embed Size (px)
Citation preview

ContentsExecutive summary............................................................................................................................5
1 Objectives and methodology.......................................................................................................6
1.1 Objectives............................................................................................................................6
1.2 Patents as indicators of research performance...................................................................6
1.3 Definition of Australian food patents....................................................................................6
1.4 Identification of food patents................................................................................................7
1.5 Localisation of inventive activity in food patenting...............................................................7
1.6 Timeframe for analysis........................................................................................................7
1.7 Classification of inventions..................................................................................................7
1.8 Data extraction and analysis................................................................................................8
2 Patenting scale and intensity......................................................................................................9
2.1 Patenting intensity...............................................................................................................9
2.2 Patenting activity over time................................................................................................10
2.3 Inventive activity in the food industry by Australian States and Territories........................12
3 Types of food technologies originating from Australia..............................................................14
3.1 Analysis by type of food production...................................................................................14
Cocoa/chocolate.......................................................................................................................15
Confectionery............................................................................................................................16
Wine..........................................................................................................................................16
Tea extraction...........................................................................................................................17
Cheese......................................................................................................................................17
Bakery.......................................................................................................................................17
Containers for storage or transport of food and preservation...................................................18
Therapeutic foods.....................................................................................................................18
3.2 Technology theme visualisation.........................................................................................19
4 National and regional relative specialisation.............................................................................20
4.1 Overall food RSI................................................................................................................20
4.2 Food processing industries relative specialisation.............................................................22
5 Key patent applicants................................................................................................................24
5.1 Top filing applicants...........................................................................................................24
3
5.2 Grant recipients.................................................................................................................26
5.3 CSIRO...............................................................................................................................27
6 Collaboration measured through co-applicants........................................................................31
7 Patent citation analysis.............................................................................................................35
7.1 Patent citation frequency...................................................................................................36
8 Conclusion................................................................................................................................39
Appendix A – Search strategy..........................................................................................................40
Appendix B – OECD definitions of subregions: TL2 and TL3 regions of Australia..........................43
Appendix C – Classification into Food Sub-Industries.....................................................................44
Appendix D – Complete list of PCT contracting states....................................................................46
4

Executive summaryThis report analyses food inventions originating from Australia. Identifying patent activity, technological specialisation, and collaboration can help to illustrate the innovation landscape. This report uses patent analysis to assess the scope, quality and impact of innovative activity within the food sector.
The study identified 1,050 food related inventions that originated from Australia between 2000 and 2011. Australia ranks 14th in food patenting globally and this performance is comparable with Canada and Sweden.
Australia exhibits a positive technological specialisation in the food industry, which means that the share of food patents filed by Australian inventors is more than the overall proportion of food patents filed worldwide. The results indicate Australia’s relative importance in innovative activity in the field. Regional specialisations include South Australia’s wine and beer brewing, Queensland’s slaughtering, New South Wales’ bakery and Victoria’s beverages.
New South Wales, Victoria and Queensland are the highest patent filers among Australian States and Territories. Capital cities are the highest regional filers followed by regional centres, such as Gold Coast, Ovens-Murray, Sunshine Coast and Illawarra.
In terms of the volume of patent filings, the sub-industries that have a sustained presence over the study period include: cocoa, confectionery and chocolate, beverages including wine, beer brewing and tea extraction, dairy and cheese, and bakery. Other inventions include containers for food storage, food transport, foods with nutritive value, food preservation and extension of shelf life.
Inventions in the cocoa/chocolate, confectionery, wine and tea areas appear to be targeted to product improvements that relate to consumer preferences, prolonging shelf-life, and improvements in production.
Many inventions in therapeutic foods and foods as medicine, such as probiotics, address a new need or demand in society.
Around 45 per cent of all Australian food inventions are cited by follow on inventors. Collaboration in Australian food inventions is a defining characteristic of many prolific inventors and occurs in approximately 23 per cent of the filings. Australia’s national science agency CSIRO is the most prolific filer and most prominent collaborator.
Applicants with higher filings are generally large employers with a focus on food research and production, such as CSIRO, Moffat, Murray-Goulburn Co-operative, Horizon Science, and Agriculture Victoria Services.
5
1 Objectives and methodology
1.1 Objectives
This report provides insights into the scope, quality and impact of Australian-originated patents in the food industry. Specifically, this report:
identifies the scale and intensity of patent activity in the food industry originating from Australia and its subregions;
evaluates the quality of Australian patenting activity; and
assesses the level of collaboration in developing inventions relating to the food industry.
The food industry comprises the manufacturing and processing of food and beverages and is one of Australia’s largest manufacturing sectors.1 Technologies in the food industry relate to ingredients, quality control, processing machinery and tools and packaging.
This report presents a range of metrics based on patent analytics. This analysis is achieved through the extraction, analysis, interpretation, and visual presentation of information included in patent documents.
1.2 Patents as indicators of research performance
Patents can be used as indicators of R&D output.2 A patent is a right that is granted for any device, substance, method or process 1 In 2013, the food, beverage and tobacco products sector was the largest manufacturing sector, representing 23 per cent of gross value added in the Australian manufacturing sector, followed by machinery and equipment (21 per cent). See ABS, Australian National Accounts: National Income, Expenditure and Product, Table 6.2 For example, see Griliches, Z. (1998), Patent Statistics as Economic Indicators: A Survey, R&D and Productivity: The Econometric Evidence, University Chicago Press.
that is new, inventive, and useful. Patent rights are legally enforceable and give the owner exclusive rights to commercially exploit the invention for a limited period of time.
It is a requirement of patent law that patent documents are published and that they fully disclose inventions. Patent documents include other useful information, such as international patent classifications and information about inventors and applicants. As a result of the disclosure requirement, patent literature reflects developments in science and technology.
Through the extraction and analysis of data associated with patent documents, it is possible to measure aspects of inventive activity such as scope, intensity, collaboration, and impact. These metrics can be developed across technology sectors and by various units of measurement, such as individuals (inventors), institutions (applicants), regions, and countries.
1.3 Definition of Australian food patents
There are two major filing routes for patent applications: direct and international.
The direct filing route involves filing a national application directly with the patent office in the country (or countries) where the applicant resides or wishes to seek protection. Direct filings include provisional filings, standard applications and certified innovation patents. Food applications filed directly with IP Australia were identified in IP Australia’s internal databases.
The international route involves filing a Patent Cooperation Treaty (PCT)3 application, which 3 There are 148 contracting states to the PCT (see Appendix D). This international system is intended to streamline the initial filing process for those applicants who intend to seek protection for their invention in
6

establishes a filing date in all 148 contracting states. A PCT application must be followed by entering into national or regional phases to proceed towards grant. For the purposes of this report food PCT applications with at least one inventor residing in Australia were attributed to Australia.
Patents from these two routes provide a comprehensive dataset on Australian food patents.
1.4 Identification of food patents
Food patents were identified by International Patent Classification (IPC) searches and keyword searches. A list of descriptors for the IPC classes and the keywords used to search titles and abstracts of patent documents are reported in Appendix A.
Conducting both IPC and keyword searches results in a complete view of food inventions originating from Australia.
The range of food technologies identified in these searches includes ingredients, quality control, processing machinery and tools, and packaging, among others.
1.5 Localisation of inventive activity in food patenting
We used the OECD subregion definitions to identify the geographic locations of inventive activity within Australia. States and Territories as well as regional centres and cities are linked with PCT data according to the address of the patent applicant and inventor. Appendix B illustrates the breakdown of Australian regionalisation.
1.6 Timeframe for analysis
The timeframe for the analysis is 2000 to 2011.
The priority date is the most relevant for ascertaining the date of invention. It is the
multiple jurisdictions.
earliest date recorded on patents and therefore allows the comparison of dates unaffected by administrative variations or delays. The data used in this study include patent documents with a priority date between 1 January 2000 and 31 December 2011.4
1.7 Classification of inventions
The IPC was used as a primary categorisation tool for the technology areas of food patenting.
The IPC is a detailed classification of inventions disclosed in patent documents. The IPC is developed and maintained by the World Intellectual Property System (WIPO) and provides a hierarchical system for the classification of patents according to the different areas of technology to which they pertain. IPCs are assigned to each patent application prior to publication.5
The IPC classifies technology areas into 70,000 different IPC codes. While some of the IPC classifications have descriptions that readily correspond with food technologies, many do not. IPC classes and keywords were used to classify the search results into ten food sub-industries (see Appendix C for a detailed correlation):
1. Meat and Meat Product Manufacturing
2. Seafood Processing3. Dairy Product Manufacturing4. Fruit & Vegetable Processing5. Oil & Fat Manufacturing
4 The April 2013 edition of the PATSTAT database used for identifying PCT applications contains all publications at the end of week 2013/03, essentially comprising publications with a priority date up to June 2011.5 This classification allows countries to class patents under a common system, which facilitates searching and a direct comparison between technologies and between countries. For more information about the IPC system see section http://www.wipo.int/edocs/mdocs/classifications/en/ipc_ce_41/ipc_ce_41_5-annex1.pdf
7
6. Grain(s) Mill & Cereal(s) Product Manufacturing
7. Bakery Product Manufacturing8. Sugar and Confectionery
Manufacturing9. Alcoholic and non-alcoholic Beverage
manufacturing10. Other (Food manufacturing and
products not elsewhere classified)
1.8 Data extraction and analysis
There were four key stages of data extraction and analysis.
The first stage involved identifying the relevant technology areas (as determined from IPC and keyword searches) and the patent documents relating to the food industry originating from Australia between 1 January 2000 and 31 December 2011.
The patent documents were then grouped into patent families — documents generally relating to the same invention but filed in different countries. Patent families enable us to analyse inventive activity regardless of the number of countries in which protection is sought.
IP Australia’s internal data were used to identify patents filed directly with IP Australia. EPO Worldwide Patent Statistical Database (PATSTAT) and REGPAT, produced jointly by the Organisation for Economic Cooperation and Development and the European Patent Office, were used to identify Australia-originated PCT patents.
The second stage was data cleansing, such as eliminating duplicate records and screening for spelling variation, and checking for genuine Australian derived inventions.
The third stage was classifying data and eliminating records that were not relevant to the current study.
The final stage comprised the data analysis, including the calculation and visual presentation of patent metrics.
8
2 Patenting scale and intensityObjective: To identify the scale of patenting activity in the food industry originating from Australia.
2.1 Patenting intensity
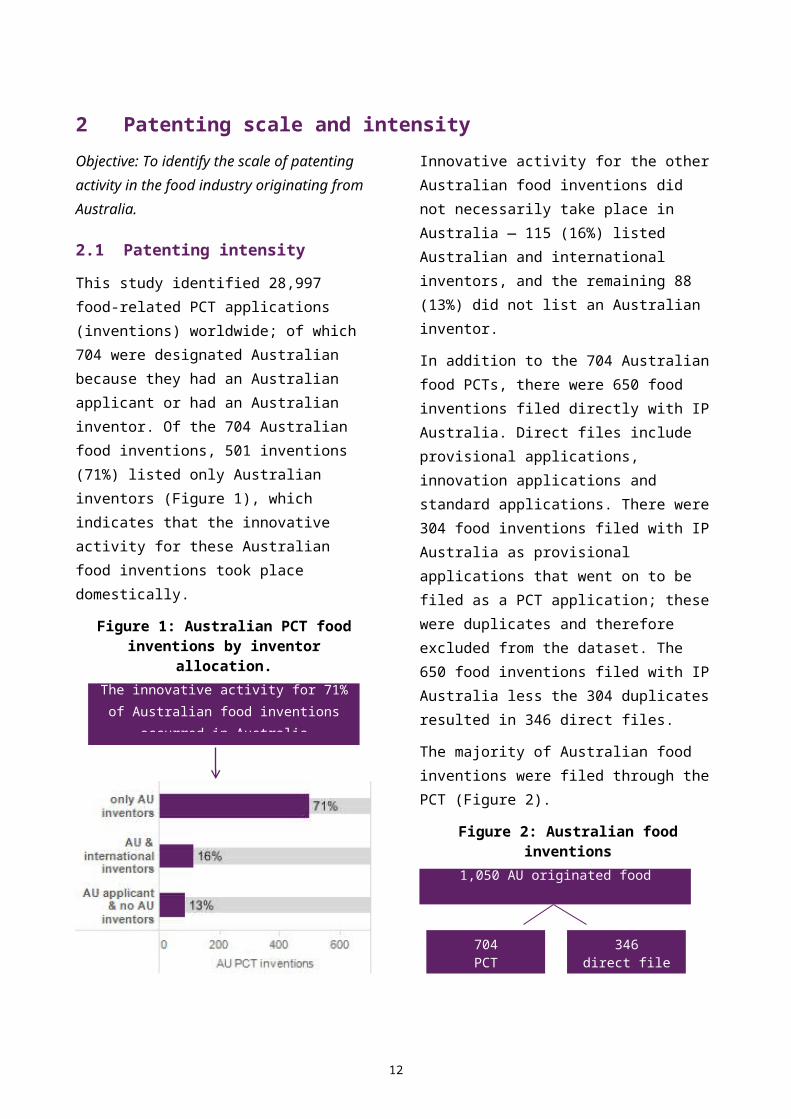
This study identified 28,997 food-related PCT applications (inventions) worldwide; of which 704 were designated Australian because they had an Australian applicant or had an Australian inventor. Of the 704 Australian food inventions, 501 inventions (71%) listed only Australian inventors (Figure 1), which indicates that the innovative activity for these Australian food inventions took place domestically.
Figure 1: Australian PCT food inventions by inventor allocation.
Innovative activity for the other Australian food inventions did not necessarily take place in Australia — 115 (16%) listed Australian and international inventors, and the remaining 88 (13%) did not list an Australian inventor.
In addition to the 704 Australian food PCTs, there were 650 food inventions filed directly with IP Australia. Direct files include provisional applications, innovation applications and standard applications. There were 304 food inventions filed with IP Australia as provisional applications that went on to be filed as a PCT application; these were duplicates and therefore excluded from the dataset. The 650 food inventions filed with IP Australia less the 304 duplicates resulted in 346 direct files.
The majority of Australian food inventions were filed through the PCT (Figure 2).
Figure 2: Australian food inventions
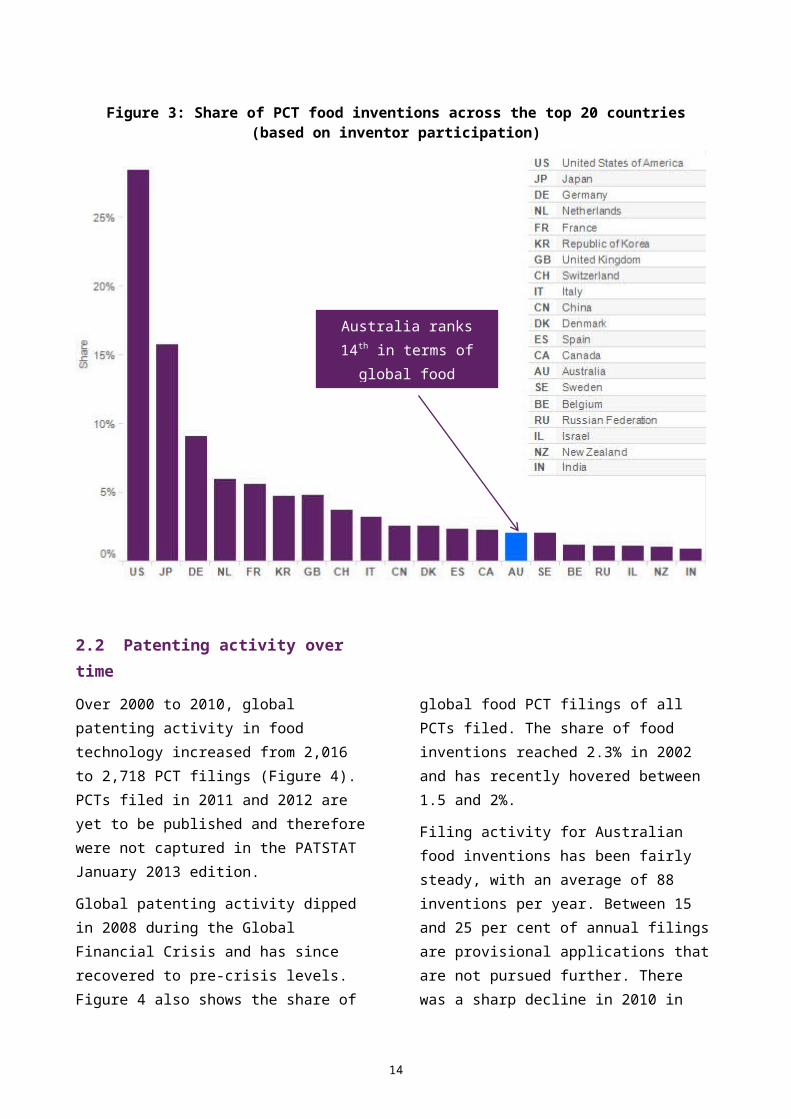
The top 20 countries filing PCT food inventions are shown in Figure 3. With 2 per cent of the global food inventions, Australia ranks 14th and is comparable with Canada and Sweden.
9
The innovative activity for 71% of Australian food inventions occurred in
Australia
1,050 AU originated food inventions
704PCT
346direct file

Figure 3: Share of PCT food inventions across the top 20 countries(based on inventor participation)
2.2 Patenting activity over time
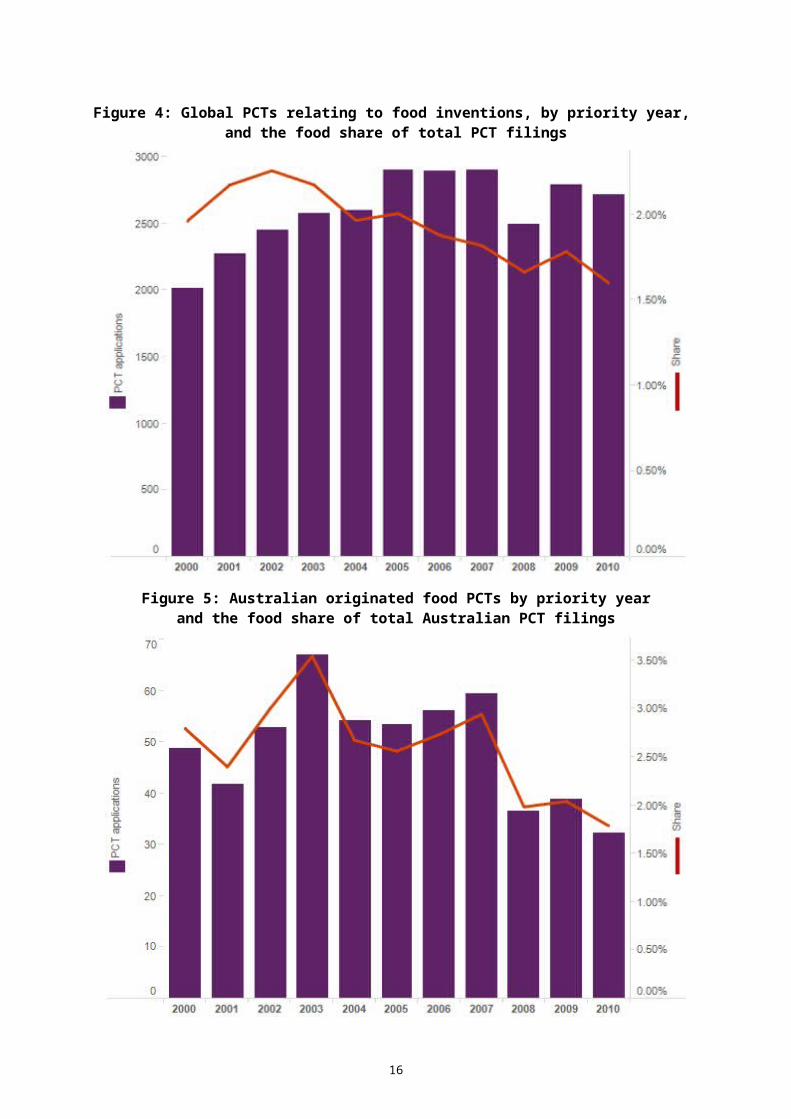
Over 2000 to 2010, global patenting activity in food technology increased from 2,016 to 2,718 PCT filings (Figure 4). PCTs filed in 2011 and 2012 are yet to be published and therefore were not captured in the PATSTAT January 2013 edition.
Global patenting activity dipped in 2008 during the Global Financial Crisis and has since recovered to pre-crisis levels. Figure 4 also shows the share of global food PCT filings of all PCTs filed. The share of food inventions reached 2.3% in 2002 and has recently hovered between 1.5 and 2%.
Filing activity for Australian food inventions has been fairly steady, with an average of 88
inventions per year. Between 15 and 25 per cent of annual filings are provisional applications that are not pursued further. There was a sharp decline in 2010 in Australian food inventions overall, which is consistent with trends observed for Australian patent filings across all technologies.
Figure 5 shows the number of Australian food PCT inventions filed by priority year and the share of food inventions of the total of PCTs filed by Australian inventors. The number of food inventions has a similar profile to the share of food inventions in Australia.
10
Australia ranks 14th in terms of global food
inventions.
Figure 4: Global PCTs relating to food inventions, by priority year, and the food share of total PCT filings
Figure 5: Australian originated food PCTs by priority yearand the food share of total Australian PCT filings
11
Research and development is a continual process and a reduction in patent activity may occur years after a trigger event or secular trends. For instance, the fall of applications after 2003 and subsequent slow rise in the period from 2004-2007 may reflect the widespread drought of 2003 and the resultant 6 per cent fall in employment in the food sector in the 2003-04 financial year. After the 2003 drought, economic activity in the sector began to recover. The sharp drop in activity in 2008 is attributed to the global financial crisis, which had a similar effect on patent filings as a whole. The slow pick up from 2008 may reflect closures from droughts in previous years, the global financial crisis, or the SARS outbreak. Secular trends include commodity price fluctuations, changes in consumer preferences, and currency volatility.6
2.3 Inventive activity in the food industry by Australian States and Territories
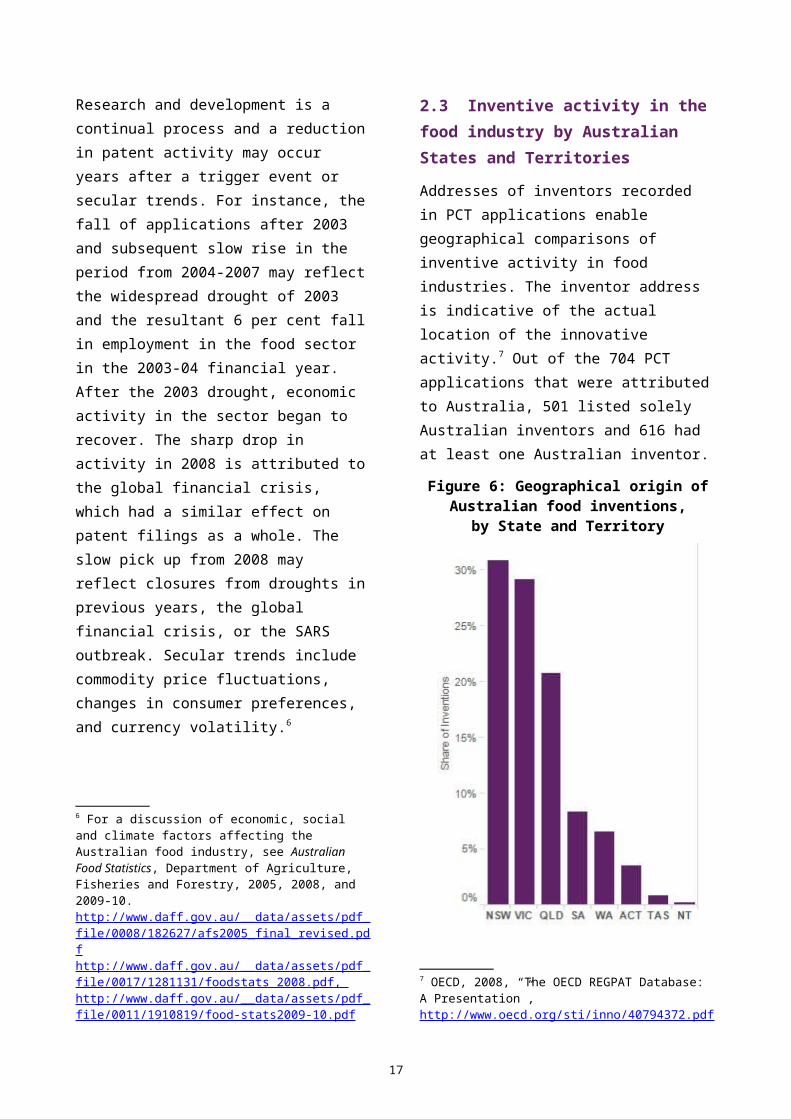
Addresses of inventors recorded in PCT applications enable geographical comparisons of inventive activity in food industries. The inventor address is indicative of the actual location of the innovative activity.7 Out of the 704 PCT applications that were attributed to Australia, 501 listed solely Australian inventors and 616 had at least one Australian inventor.
Figure 6: Geographical origin of Australian food inventions,
by State and Territory
New South Wales, Victoria and Queensland are the largest food producers and patent filings generally correspond with this trend.8 These three states also had the highest shares of the 616 inventions with an Australian inventor (Figure 6). NSW and Victoria have the highest shares of patents at approximately 30 per cent each. In 2002, however, Queensland had the highest share of inventions with 38 per cent, owing to intensive patenting in dough mixing technology, and fruit and vegetable preservation innovations.
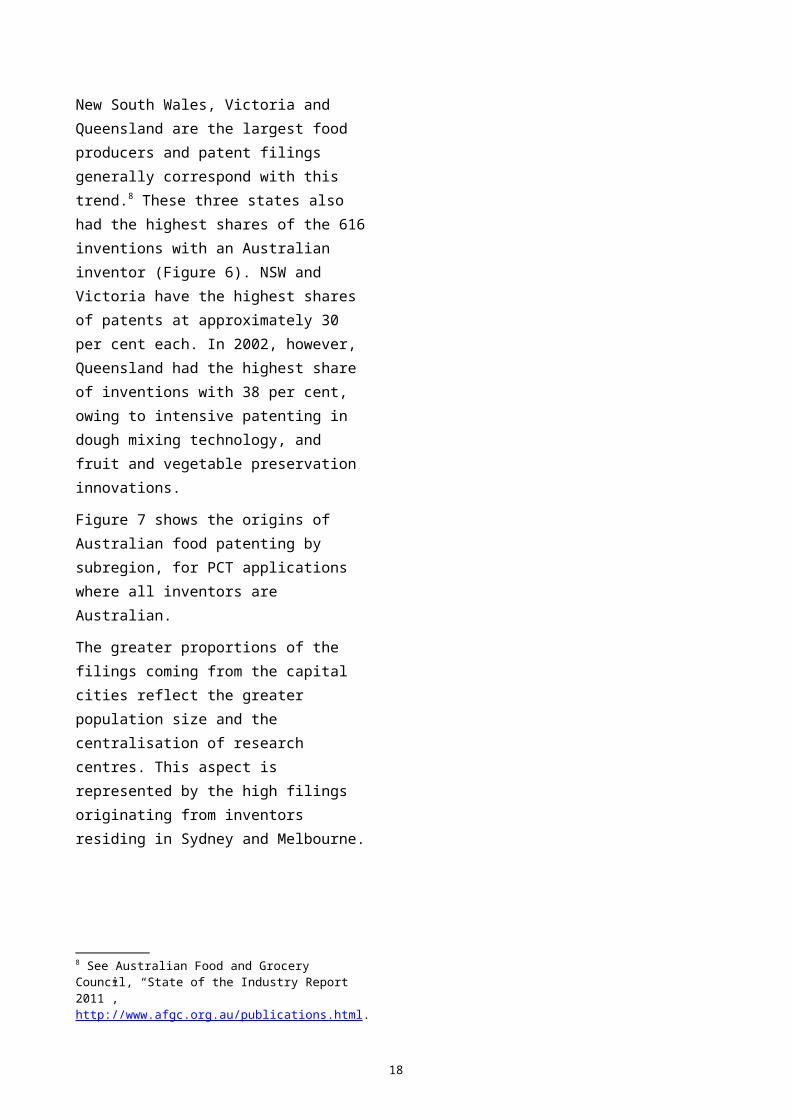
Figure 7 shows the origins of Australian food patenting by subregion, for PCT applications where all inventors are Australian.
The greater proportions of the filings coming from the capital cities reflect the greater population size and the centralisation of
6 For a discussion of economic, social and climate factors affecting the Australian food industry, see Australian Food Statistics, Department of Agriculture, Fisheries and Forestry, 2005, 2008, and 2009-10. http://www.daff.gov.au/__data/assets/pdf_file/0008/182627/afs2005_final_revised.pdf http://www.daff.gov.au/__data/assets/pdf_file/0017/1281131/foodstats_2008.pdf , http://www.daff.gov.au/__data/assets/pdf_file/0011/1910819/food-stats2009-10.pdf7 OECD, 2008, “The OECD REGPAT Database: A Presentation”, http://www.oecd.org/sti/inno/40794372.pdf8 See Australian Food and Grocery Council, “State of the Industry Report 2011”, http://www.afgc.org.au/publications.html.
12

research centres. This aspect is represented by the high filings originating from inventors residing in Sydney and Melbourne.
Figure 7: Subregional distribution of PCTs with Australian inventors only
13
Sydney 133
Capital cities have filed the most
inventions.
Melbourne108
Adelaide37
Brisbane63
3 Types of food technologies originating from AustraliaObjective: Provide an assessment of the specific types of food-related technologies developed in Australia.
3.1 Analysis by type of food production
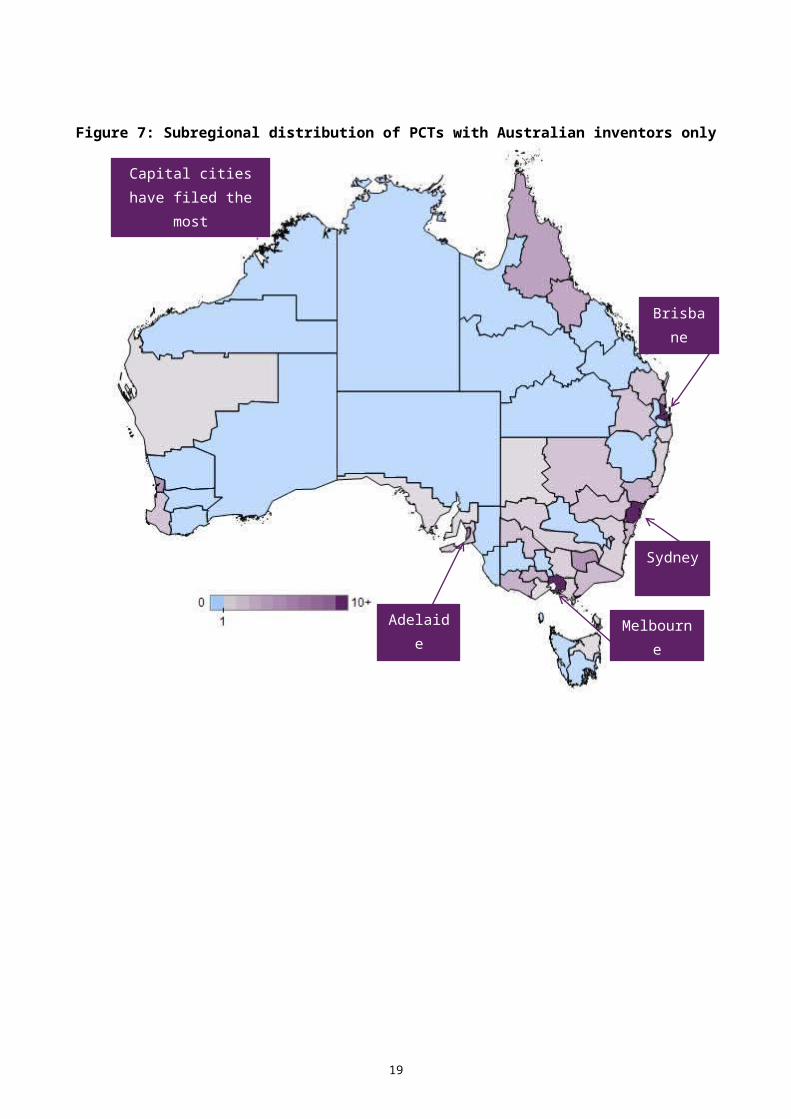
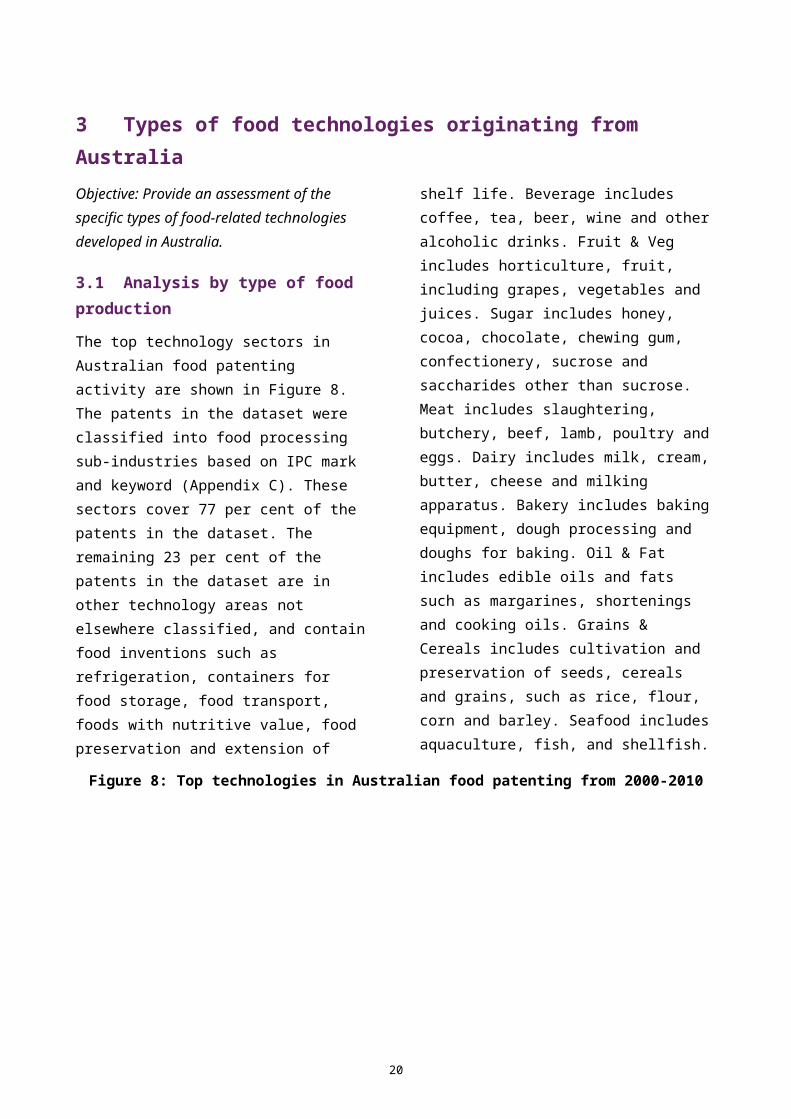
The top technology sectors in Australian food patenting activity are shown in Figure 8. The patents in the dataset were classified into food processing sub-industries based on IPC mark and keyword (Appendix C). These sectors cover 77 per cent of the patents in the dataset. The remaining 23 per cent of the patents in the dataset are in other technology areas not elsewhere classified, and contain food inventions such as refrigeration, containers for food storage, food transport, foods with nutritive value, food preservation
and extension of shelf life. Beverage includes coffee, tea, beer, wine and other alcoholic drinks. Fruit & Veg includes horticulture, fruit, including grapes, vegetables and juices. Sugar includes honey, cocoa, chocolate, chewing gum, confectionery, sucrose and saccharides other than sucrose. Meat includes slaughtering, butchery, beef, lamb, poultry and eggs. Dairy includes milk, cream, butter, cheese and milking apparatus. Bakery includes baking equipment, dough processing and doughs for baking. Oil & Fat includes edible oils and fats such as margarines, shortenings and cooking oils. Grains & Cereals includes cultivation and preservation of seeds, cereals and grains, such as rice, flour, corn and barley. Seafood includes aquaculture, fish, and shellfish.
Figure 8: Top technologies in Australian food patenting from 2000-2010
14

The share of each sub-industry has been fairly stable over time, but some sub-industries had individual peaks (data not shown), such as meat in 2001 (22 per cent, compared to 5-10 per cent in other years), sugar in 2008 and 2009 (23 and 21 per cent compared to 10-15 per cent in other years) and beverage in 2007 (35 per cent compared to 15-25 per cent in other years).
In addition, the patent data for the ten year period was analysed qualitatively by plotting invention information based on priority years. There are trends across a number of food classes over this time.
The sub-industries that have a sustained presence over time include:
Sugar, including:o Cocoa/chocolate; ando Confectionery/sweetmeats/Chewing
gum.
Beverage, including:o Wine; ando Tea extraction.
Dairy, including:o Cheese.
Bakery; and
Other, including:o Containers for storage or transport
of food; ando Therapeutic foods/medicinal.
Inventions in the cocoa/chocolate, confectionery, wine and tea areas appeared to be targeted to product improvements that relate to consumer preferences, prolonging shelf-life, and improvements in production.
Inventions in therapeutic foods/medicinal appeared to address a new need or demand in society, for example the use of foods as medicines.
Cocoa/chocolate
Inventions in the A23G 1/00 IPC mark relate to cocoa and chocolate or its substitutes. In the 10 year period analysed, activity was concentrated early in years 2000, 2003 and 2005, and then later in 2008 and 2009.
Most inventions occurred in 2000 with a mix of Australian-owned companies and multinationals. Mars/Effem Foods dominate the first part of the decade and Cadbury UK Ltd becomes the prominent player around 2008-2009 with a new chocolate crumb product.
The companies active in cocoa/chocolate inventions include:
Australian Co Operative Foods; Chocolate Graphics Pty Ltd; Effem Foods; Nestle SA; Mars Incorporated; McNeil PPC Inc ; Nestec SA; and Cadbury UK Ltd.
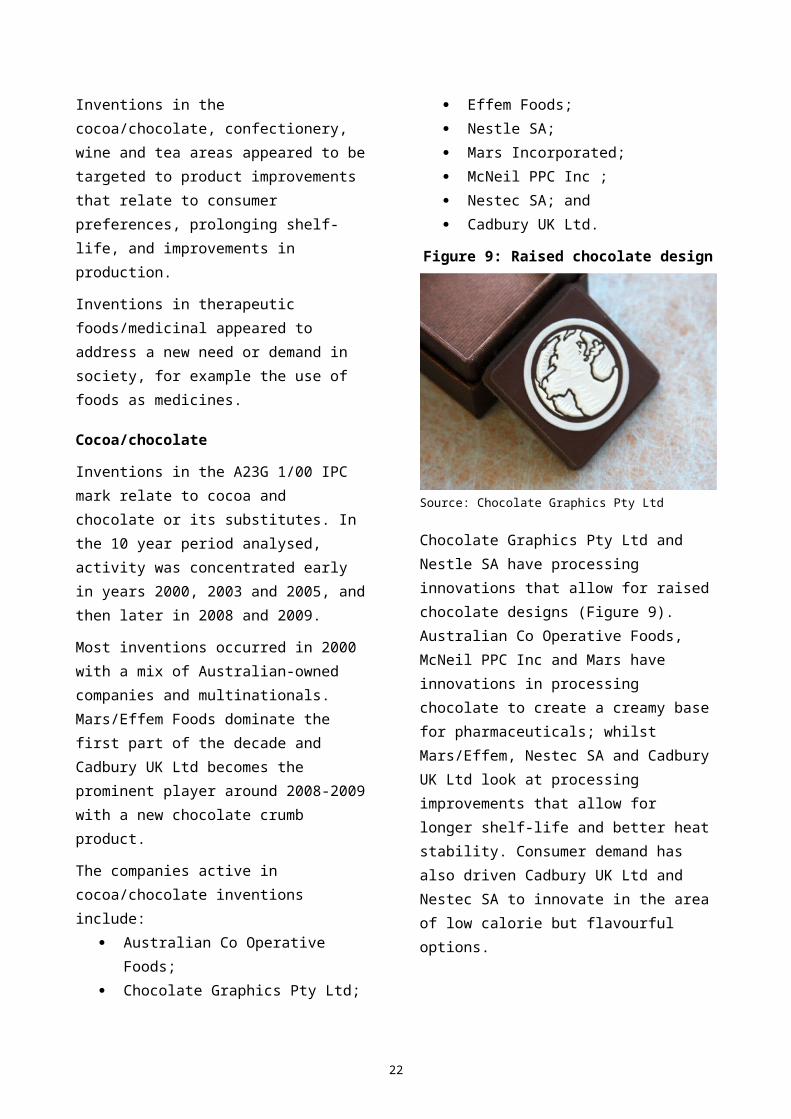
Figure 9: Raised chocolate design
Source: Chocolate Graphics Pty Ltd
Chocolate Graphics Pty Ltd and Nestle SA have processing innovations that allow for raised chocolate designs (Figure 9). Australian Co Operative Foods, McNeil PPC Inc and Mars have innovations in processing chocolate to create a creamy base for pharmaceuticals; whilst Mars/Effem, Nestec
15
SA and Cadbury UK Ltd look at processing improvements that allow for longer shelf-life and better heat stability. Consumer demand has also driven Cadbury UK Ltd and Nestec SA to innovate in the area of low calorie but flavourful options.
Confectionery
Inventions in the A23G 3/00 IPC mark relate to confectionery, sweetmeats, marzipan and coated or filled products.
There are two concentrations of inventive activity in this combined field occurring in the 2002 and 2008.
2002 is dominated by Weston Foods Ltd (crosslinking waxy wheat starch to be used as filling in foods) and Australian Entpr Pty Ltd/Internet Agencies Pty Ltd (food products that have weight bearing supports with edible elements, see Figure 10).
Figure 10: Food product with weight bearing support
Source: WO 2003/011036
In 2008, a similar trend to the cocoa/chocolate category is observed as Cadbury becomes the dominant player with inventions in the area of processing confectionery with centre fillings including jellies and confectionery with “capillaries” that extend the flavour over time. Those inventions dealt with changes in consumer
preferences such as products with reduced fat or sugar content but with improved flavours that lasted for longer periods. Other improvements included compositions that minimised production problems such as blocking of passageways in equipment.
Wine
Inventions in the wine industry peaked in 2003, 2005 and 2007. The players were varied and diverse and the inventions related to improvements in production, storage, quality assessment, as well as gene modifications of yeasts.
In 2003 the main players were: Flextank Pty Ltd (wine storage and reduction of oxygen transfer from atmosphere to storage tank made of plastic); Soniclean Pty Ltd (decontaminating wine using an ultrasonic apparatus); and South East Machining (wine tanks and mechanical means of holding a plank therein).
In 2005 the main players were: Wychwood Estates Pty Ltd (a container assembly having a body with oxygen permeable walls for maturing wine); CSIRO (using Vis-NIR Spectroscopy to assess wine quality); Bacchus Distillery Pty Ltd (a process of increasing alcohol concentration of wine); and Provenzale Domenic (an apparatus and method for extracting wine from fruit, grapes and the like in wine making, especially the extraction of wine from the bulk solid products of fermentation, also known as "marc").
In 2007 the main players were: N. P. Anthony – a private individual – (resveratrol enhanced wine which has enhanced antioxidant activity); Australian Wine Research Institute Ltd (a new industrial yeast strain comprising modification in MET5 and/or MET10 gene which results in reduced hydrogen sulphide production, useful for production of a fermented product such as wine); Pernod Ricard Pacific Pty Ltd (the invention is
16
generalist but has application to whiskeys wherein the system is useful for blending component fluids to form a blended fluid); Air Liquide Australia (a sparging assembly useful in a system for removing oxygen from wine; dosing specific amounts of sulphur dioxide into wine); and Carlton and United Beverages (the use of pectin as an agent for reducing calcium in fermented alcoholic beverages).
Tea extraction
Inventions in tea extraction peaked in 2006. The key applicants were:
Tea-Cha Teaware Pty Limited – Making individual servings of aqueous tea concentrate involving controlling particle size of tea material, and tea material and water contact time and water temperature. This process is aimed to minimize tannin extraction.
Chocolate Genie Willoughby Pty Ltd – Making tea concentrate useful for single beverages involves directly contacting loose particulate tea material with boiling or near boiling water to produce aqueous concentrate, and separating the concentrate from particulate tea material.
Cheese
Most inventive activity took place in 2006 and 2009.
In 2006 the main applicants were Mexican Express Pty Ltd (a method for modifying the resilience of a flexible layer of edible material such as cheese, involving increasing the thickness of flexible layer and maintaining a predetermined amount of edible material and footprint of flexible layer); Puck Holdings Pty Ltd (manufacture of melt bodies for use in preparing food article e.g. bread rolls, pizzas or cheddar melt steak, involves mixing cheese component with food component to form homogeneous mixture and forming melt bodies from mixture); and L. C. Bond, a
private applicant (firm and processed cheese snack product comprises a block of cheese having a unit to facilitate separation of the product into snack sized portions).
In 2009 the main applicants were: Kraft Foods (cream substitute used in cooking at elevated temperatures and for preparing savoury sauces comprising cheese curd, water source, and combination of gums that provide cream substitute texture of thick cream); and Puck Holdings Pty Ltd (a mixture of cheese and other food components where the mixture is formed into a body having an oval shape).
Bakery
Most inventive activity in relation to bakery processing occurred in 2004-2005 and was dominated by Moffat Pty Limited. In 2005 the inventions related to production issues, moulding apparatus for pre-baking processing of bread; process of thawing planar frozen dough pieces and an improved bakery process.
Key applicants included:
Mars Inc – a dried confectionery meringue, e.g. for candy bar, formed from a meringue mixture having low pre-drying moisture level and including protein foaming agent, sucrose and at least one monosaccharide;
FGF Brands Inc – Making naan bread by flattening formed dough balls into discs; stretching each disc into an irregular shaped loaf; loading loaves onto a conveyor and baking them by running conveyor through high temperature gas oven; and
Gruma Oceania Pty Ltd – a taco shell having longitudinal axis and comprising a pair of spaced apart sidewalls, each having a curved bottom portion, which curves inward toward opposing sidewall as sidewall approaches the bottom of taco shell.
17
Containers for storage or transport of food and preservation
Inventions related to storage and transport containers generally began in 2003. These innovations aim to preserve and extend the shelf life of food products, thereby offering production efficiencies.
In 2003-2007 the inventions associated with container and storage technology are dominated by AsiaWorld Shipping Company and relate to methods of removing a residual gas from inside a conventional shipping container. In 2010 the company was interested in fumigating containers with special gas containers.
Innovations by Vaporex Pty Ltd extended the shelf life of food by treating with a volatile biocidal substance; and an apparatus for gaseous treatment of food. Similarly, Boc Limited was inventing a fumigant for similar purposes.
Inventions that were attributed to private individuals were dominated by concepts such as the environment, convenience, and aesthetics. Private applicants developed beverage holders with LED and/or cooling devices. In 2005 this technology area was led by private individuals who devised the following inventions: multiple servings of reconstituted liquid product beverage container systems that would eliminate the use and throw habits of consumers; and a coffee/tea/beverage stick for combining packaged ingredients. In 2006 inventions included a sealable food container for use in refrigerator; a cold fill rigid container for drinks, and container that is attachable to / removable from a person’s clothing. In 2007 this technology area was dominated by disposable or reusable beverage containers.
Inventive activity in 2009 related to beverage holders including containers used in transport and subsequent dispensing, with two
companies showing inventive activity: Fabal Wines Pty Ltd and Coopers Brewery Ltd. In 2010 a private inventor had an invention with a resealable wine decanter.
Therapeutic foods
Innovations in this area aim to improve the nutritive value of foods (the A23L1/30 IPC mark). Food is modified using various processes to extract, purify and ferment desirable additives, such as low glycaemic index sugar, rehydrating beverages, vitamins, glucosamine, and cholesterol-lowering agents. Nutritive food products are used to control various disorders such as diabetes, arteriosclerosis and irritable bowel syndrome. The enriched food products are also employed in the recovery and growth of muscles.
Some assignees in this group are: Food Science Australia, Food Ingredients Technologies, Probendo Pty Ltd, Penford Australia Ltd, Natraherbal Pty Ltd, CSIRO, Novogen Research Pty Ltd, Vital Health Sciences Pty Ltd, Queen Bioactives Pty Ltd, Protech Reseach Pty Ltd, A2 Corporation and Unistraw Patent Holdings Ltd.
Unistraw started in 1996 with a straw full of dissolving beads to flavour milk. They continue to innovate in this field with vitamin milk straws that add flavour and 19 essential vitamins and minerals to milk. Unistraw filed a patent in 2008 for a straw comprising a probiotic microorganism embedded within the bead matrix (Figure 11).
Figure 11: Unistraw
Source: WO 2010/054439
18
3.2 Technology theme visualisation
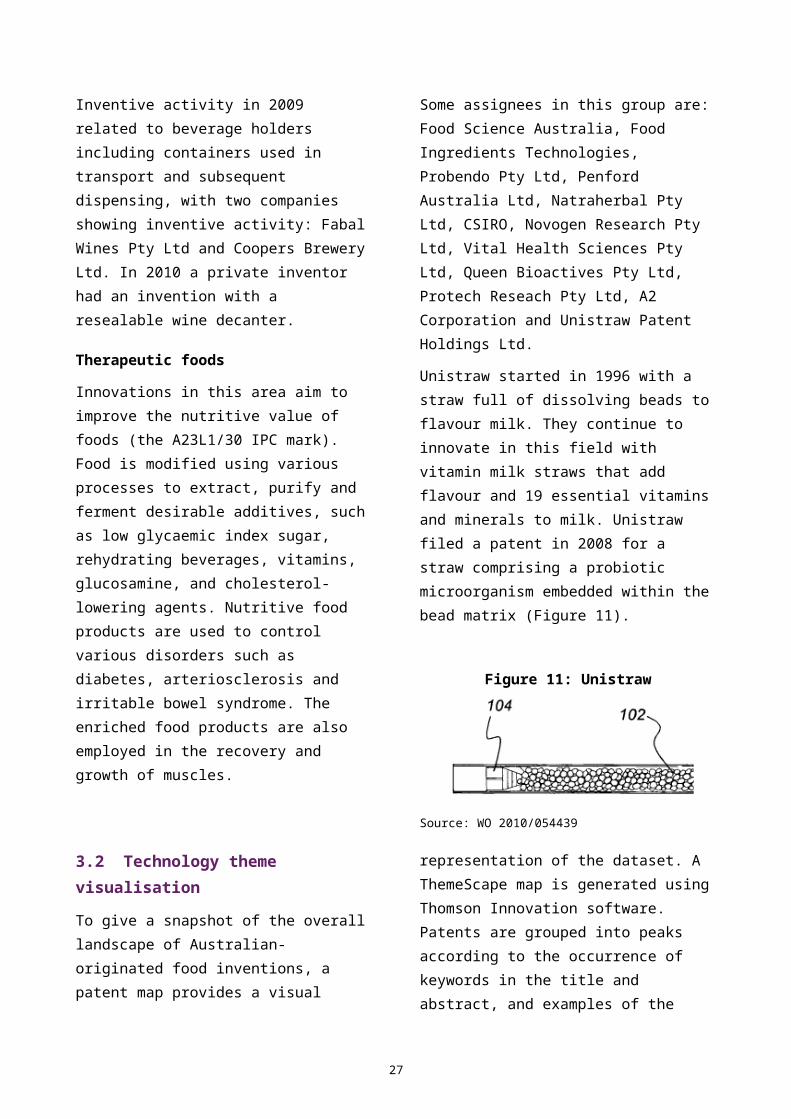
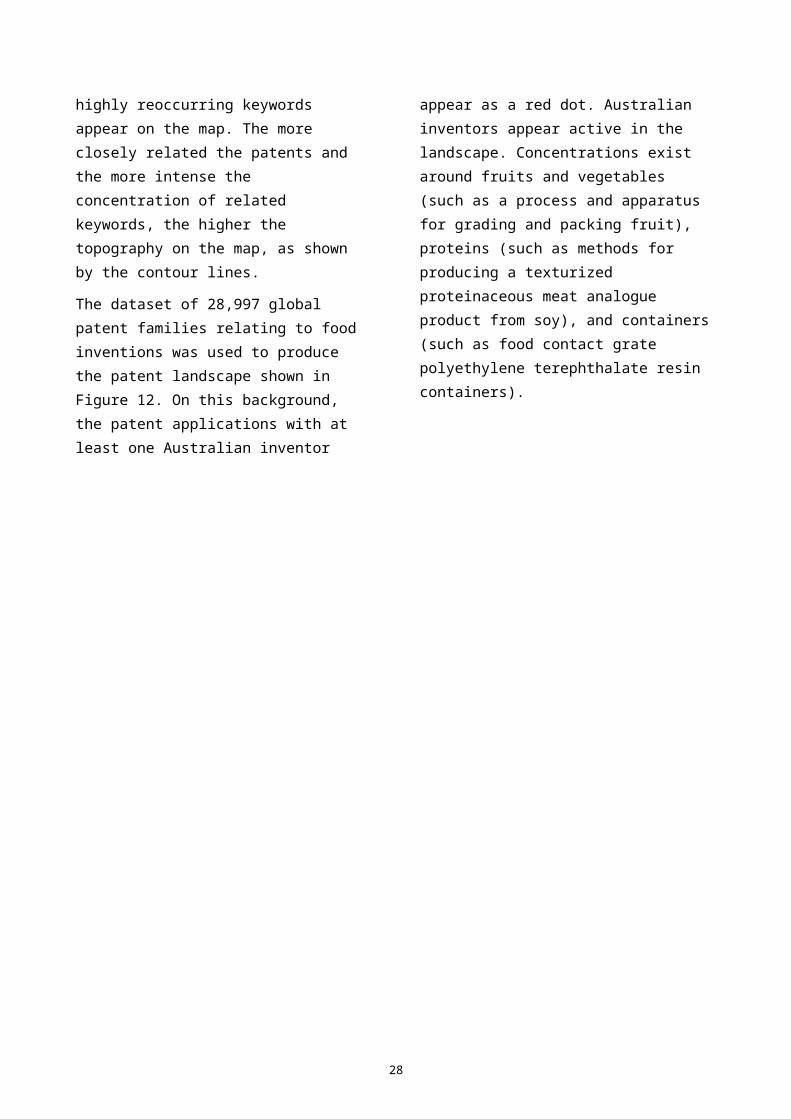
To give a snapshot of the overall landscape of Australian-originated food inventions, a patent map provides a visual representation of the dataset. A ThemeScape map is generated using Thomson Innovation software. Patents are grouped into peaks according to the occurrence of keywords in the title and abstract, and examples of the highly reoccurring keywords appear on the map. The more closely related the patents and the more intense the concentration of related keywords, the higher the topography on the map, as shown by the contour lines.
The dataset of 28,997 global patent families relating to food inventions was used to produce the patent landscape shown in Figure 12. On this background, the patent applications with at least one Australian inventor appear as a red dot. Australian inventors appear active in the landscape. Concentrations exist around fruits and vegetables (such as a process and apparatus for grading and packing fruit), proteins (such as methods for producing a texturized proteinaceous meat analogue product from soy), and containers (such as food contact grate polyethylene terephthalate resin containers).
Figure 12: Global food patent landscape with Australian inventions highlighted in red dots
19
fruit & veg
protein
containers
4 National and regional relative specialisationObjective: Assess the relative specialisation in food patenting originating from Australia.
The Relative Specialisation Index (RSI) is calculated as a correction to absolute numbers of patents in order to account for the fact that some countries file more patent applications than others in all fields of technology. In particular, inventors in the United States and Japan are prolific patentees. RSI compares the fraction of patents originating from each country in the search results to the fraction of patents originating from that country overall. A logarithm is applied to scale the fractions more suitably. The formula is given below:
RSI=log10(nintotalN iN total
)where ni = number of food patents from country i ntotal = total number of food patents in dataset Ni = total number of patents from country i Ntotal = total number of patents in dataset
The effect of this is to highlight countries which have a greater level of patenting in the searched area than expected from their overall level of patenting, and which would otherwise languish much further down in the lists, unnoticed.
In this study, the RSI is based on patent applications filed under the PCT and a country’s share of the 28,997 PCTs in the
food technology field divided by the country’s share in all patent fields. The index can also be calculated at a regional level (in this case, state or territory) as an indicator of a region’s relative technological specialisation. To calculate the RSI at the state level, we replace “country” in the above equation with the state or territory of interest.
The index is equal to zero when the region’s share in the sector equals its share in all fields (no specialisation) and is positive when a specialisation is observed.
4.1 Overall food RSI
Australia exhibits a positive technological specialisation in food patenting (0.09). Figure 13 lists the countries in order of the indices, with the most specialised countries on top, and least specialised on the bottom. Each country’s number of food inventions is also listed.
For instance, Australia has an RSI of 0.09 (greater than zero and hence exhibits a specialisation). Australia has 544 food inventions, which includes the 501 inventions wherein all inventors are from Australia, plus 43 inventions equivalent to the share of inventions attributed to Australia out of the 115 inventions listing both Australian and international inventors.
Patenting activity does not equate with specialisation. For instance, while Australia, Canada and Sweden all have similar shares of global food inventions (Figure 3) only Australia exhibits a specialisation. The US has the largest global share but does not have a specialisation.
20
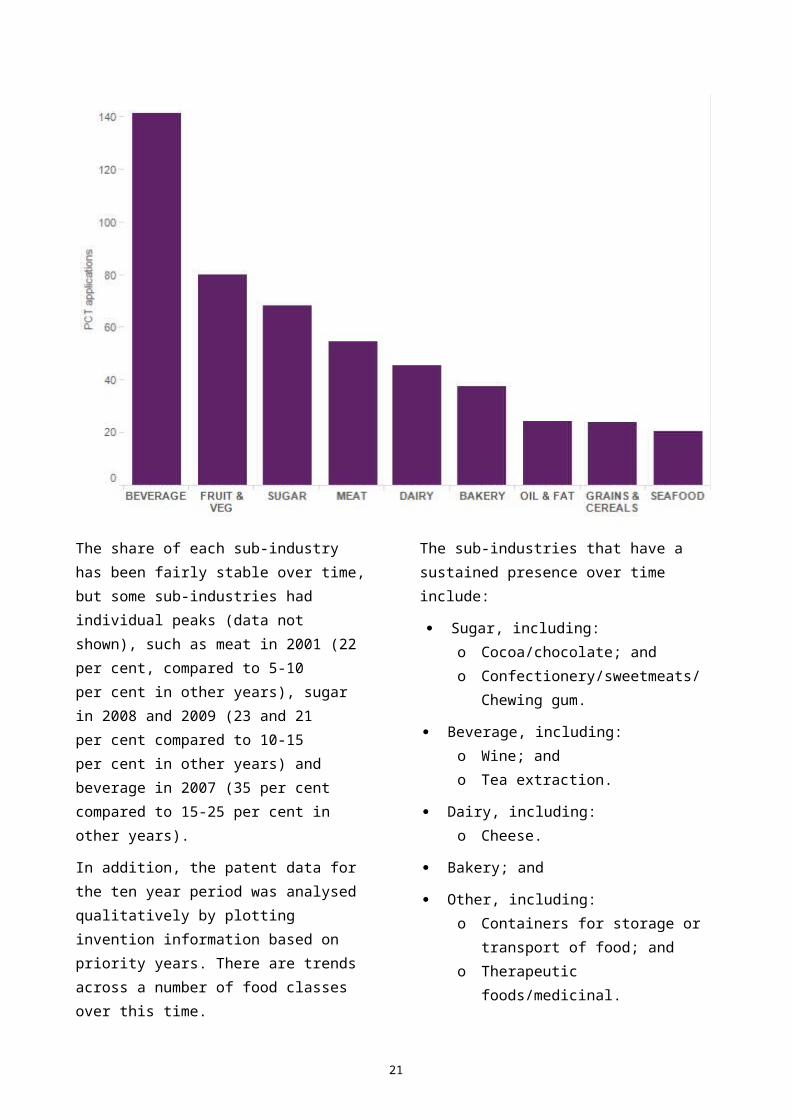
Figure 13: Relative Specialisation Index and number of food inventions, by country
21
Australia has a positive technological specialisation in food inventions.
The US has the largest global share of food inventions but does not exhibit a technological specialisation.
While Canada and Sweden have similar overall numbers of food patents to Australia they do not specialise in food patents
Number of food inventions by inventor participation
4.2 Food processing industries relative specialisation
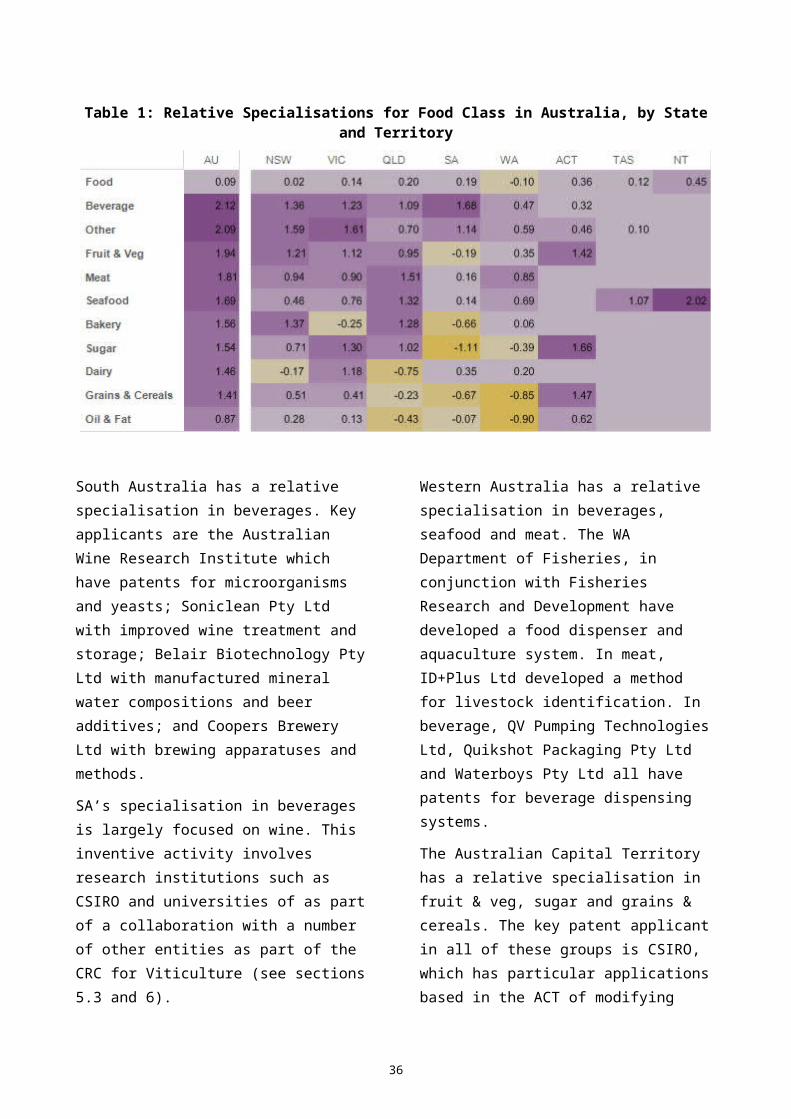
The RSIs for each food class in Australia and each state and territory are reported in Table 1. The sub-industries are sorted by the RSI for Australia.
All Australian states, except for Western Australia show a relative specialisation in food patenting. There are very few patents with inventors based in the Northern Territory, hence the RSI for the NT is relatively high (0.46). The RSI for the ACT (0.36) is high because of the large numbers of food inventions developed at CSIRO.
New South Wales has relative specialisations in bakery, beverage and other sub-industries. Key applicants for bakery inventions in NSW are George Weston Foods Ltd (crosslinked waxy wheat starch, production of lupin extracts, production of food products having reduced fat content and low GI white bread), Serrol Ingredients Pty Ltd (leavening and emulsifier compositions), and the Value Added Wheat CRC (a novel storage protein). Key applicants in beverages are Breville (juicers, tea and coffee grinding appliances) and Valent Biosciences (a synergistic combination to improve grape colour and alter sensory characteristics of wine). A key applicant in the other sub-industry is Probiomics Ltd with probiotic bacterium and their use in the treatment of skin disorders.
Victoria has relative specialisations in beverage, sugar and other. Key applicants in beverages are Carlton and United Breweries with methods for refining beverages; Flextank Pty Ltd with storage containers to control the oxygenation of wine; Memstart Pty Ltd with methods to reduce alcohol in beverages; and Ozmox with a method and apparatus for oxygenating wine. Key applicants in Sugar are Cadbury with processes for preparing chocolate crumb; Horizon Science Pty Ltd with natural sweeteners and extracts derived from sugar cane.
Queensland has relative specialisations in meat, seafood and bakery. A key patent applicant in bakery is Moffat Pty Ltd with many and varied production methods and apparatus. Key applicants in meat are CSIRO with DNA markers for meat tenderness and automatic cutting of carcasses; and meat and Livestock Australia Ltd with meat processes and implements. Key applicants in seafood are Queensland Bioprocessing Technology Pty Ltd with use of abalone processing wastes; and Seafood Innovations with the processing and rotation of fish.
22
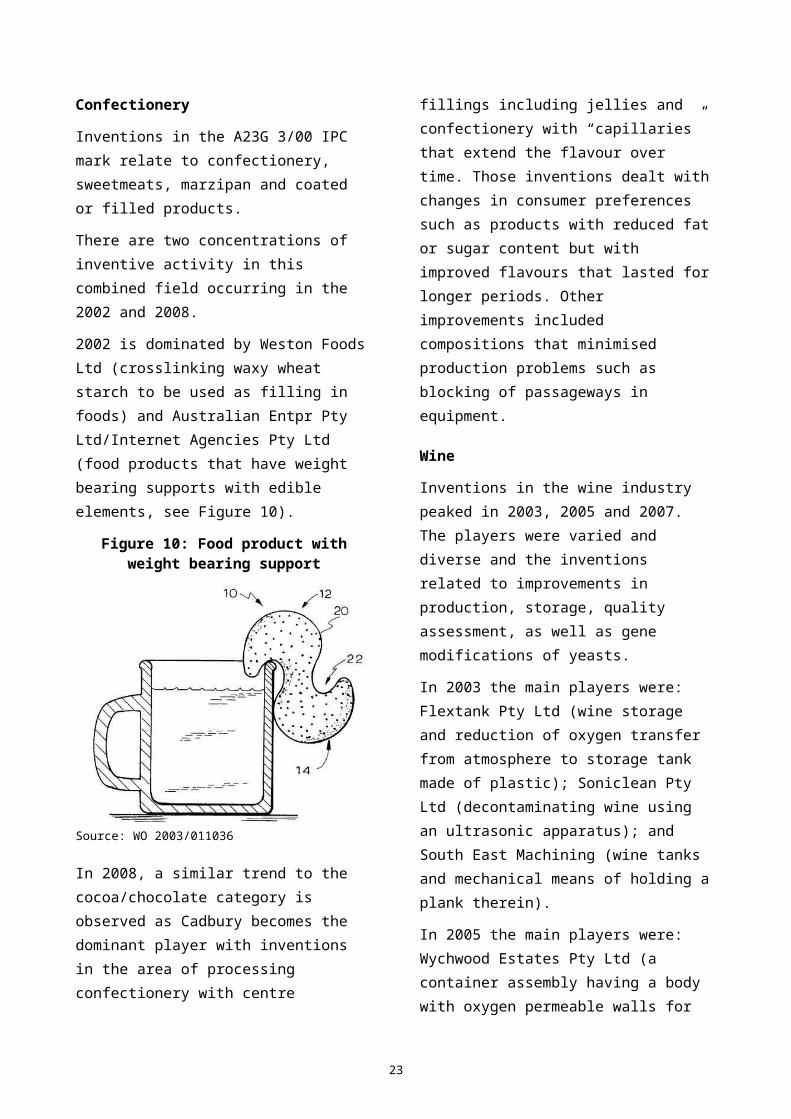
Table 1: Relative Specialisations for Food Class in Australia, by State and Territory
South Australia has a relative specialisation in beverages. Key applicants are the Australian Wine Research Institute which have patents for microorganisms and yeasts; Soniclean Pty Ltd with improved wine treatment and storage; Belair Biotechnology Pty Ltd with manufactured mineral water compositions and beer additives; and Coopers Brewery Ltd with brewing apparatuses and methods.
SA’s specialisation in beverages is largely focused on wine. This inventive activity involves research institutions such as CSIRO and universities of as part of a collaboration with a number of other entities as part of the CRC for Viticulture (see sections 5.3 and 6).
Western Australia has a relative specialisation in beverages, seafood and meat. The WA Department of Fisheries, in conjunction with Fisheries Research and Development have developed a food dispenser and aquaculture system. In meat, ID+Plus Ltd developed a method for livestock identification. In beverage, QV Pumping Technologies Ltd, Quikshot Packaging Pty Ltd and Waterboys Pty Ltd all have patents for beverage dispensing systems.
The Australian Capital Territory has a relative specialisation in fruit & veg, sugar and grains & cereals. The key patent applicant in all of these groups is CSIRO, which has particular applications based in the ACT of modifying wheat, barley and rice with altered starch branching enzymes and the use of an esterase with lipase activity for the production of emulsifiers for various food products.
Tasmania has a relative specialisation in seafood. The only applicant in this class is Buhi International Group Pty Ltd and they have developed a method of conditioning fish.
The sole patent from the Northern Territory is for the farming of crocodiles, invented by Wildlife Management International Pty Ltd.
23
5 Key patent applicantsObjective: To identify key patent applicants developing food-related technology in Australia.
5.1 Top filing applicants
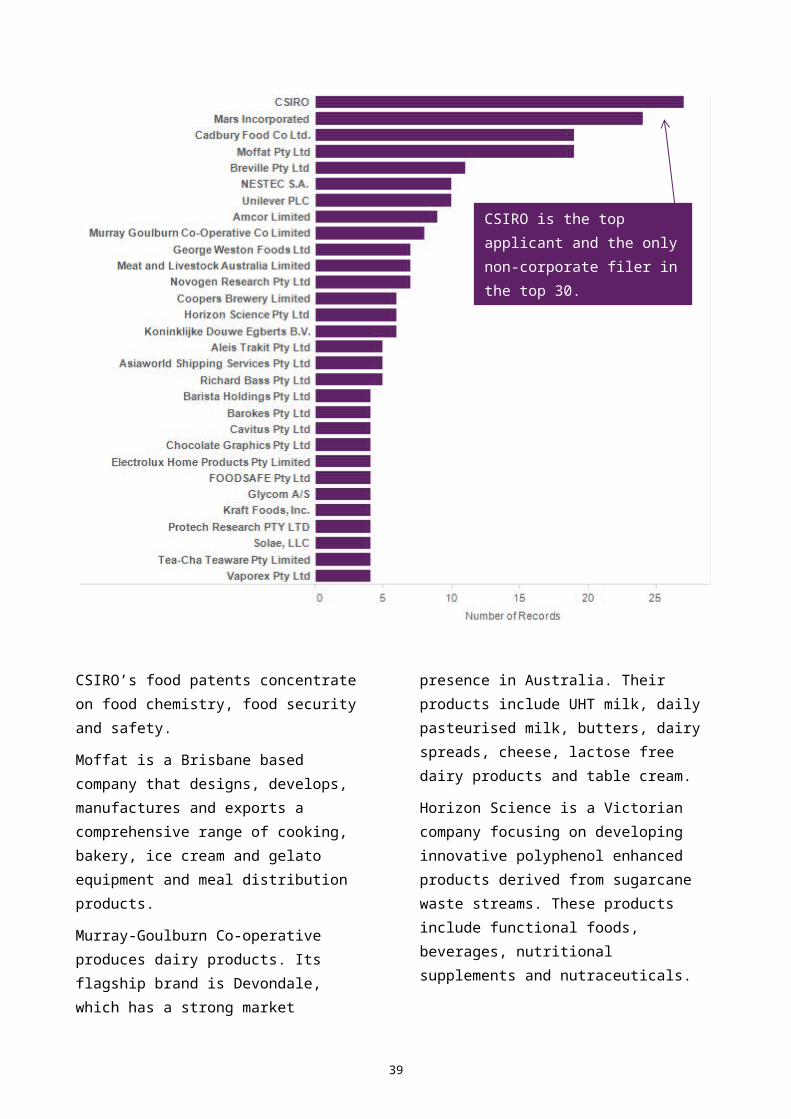
The top 30 entities with at least 4 inventions filed in Australia are listed in Figure 14. These entities account for approximately 22 per cent of Australian food patents.
Applicants can be the inventor, their employer or any party to whom the inventor(s) assigns their rights. Private individuals tend to file under their own name. Most employees of a
firm who contribute to patenting do so under their employment contract and therefore assign their patent rights to their employer.
The vast majority of food patents originating from Australia are filed by corporate entities. The exception is the top filer, CSIRO. The data also show that some Australian inventors participated in the development of inventions filed by applicants from other countries.
Australian applicants with higher filings appear to be larger employers with a focus on food research and production.
Figure 14: Top filers of Australian food patents over 2000 – 2012
24
CSIRO is the top applicant and the only non-corporate filer in the top 30.
CSIRO’s food patents concentrate on food chemistry, food security and safety.
Moffat is a Brisbane based company that designs, develops, manufactures and exports a comprehensive range of cooking, bakery, ice cream and gelato equipment and meal distribution products.
Murray-Goulburn Co-operative produces dairy products. Its flagship brand is Devondale, which has a strong market presence in Australia. Their products include UHT milk, daily pasteurised milk, butters, dairy spreads, cheese, lactose free dairy products and table cream.
Horizon Science is a Victorian company focusing on developing innovative polyphenol enhanced products derived from sugarcane waste streams. These products include functional foods, beverages, nutritional supplements and nutraceuticals.
Offshore companies that show a high degree of food patenting originating from Australian
inventors include Mars, Cadbury, Unilever, Nestec SA, Koninklijke Douwe Egberts BV, Kraft foods, Glycom and Solae.
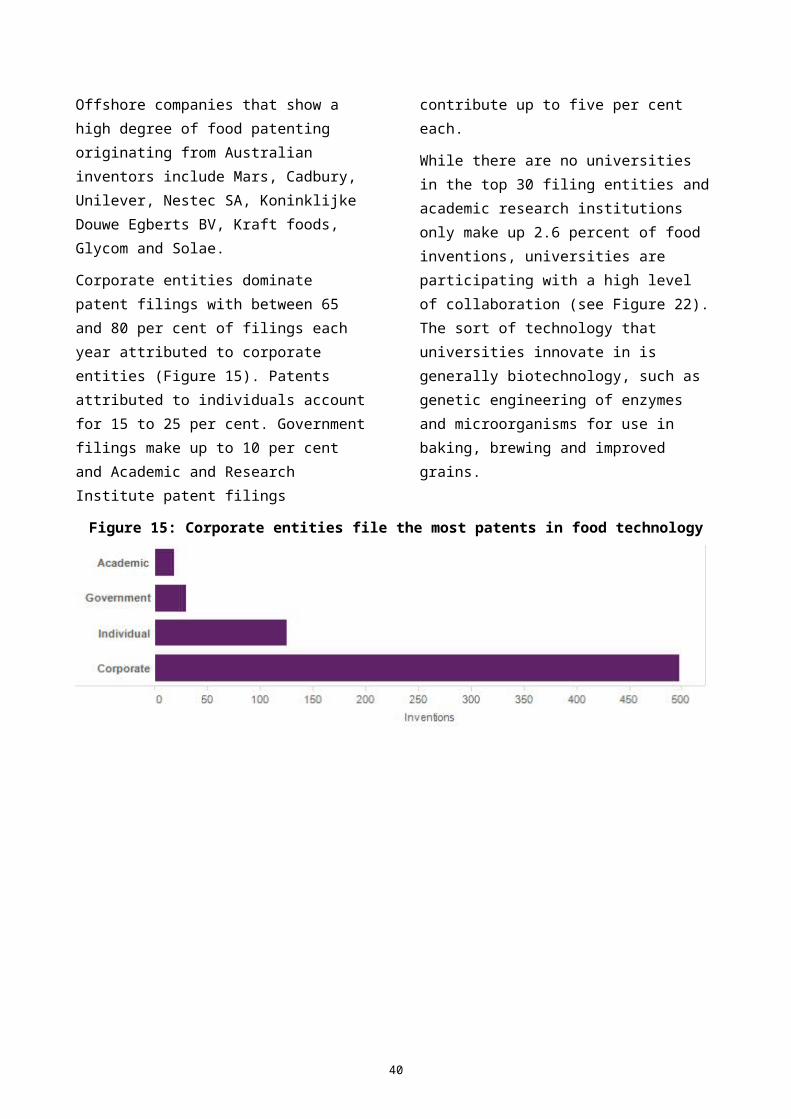
Corporate entities dominate patent filings with between 65 and 80 per cent of filings each year attributed to corporate entities (Figure 15). Patents attributed to individuals account for 15 to 25 per cent. Government filings make up to 10 per cent and Academic and Research Institute patent filings contribute up to five per cent each.
While there are no universities in the top 30 filing entities and academic research institutions only make up 2.6 percent of food inventions, universities are participating with a high level of collaboration (see Figure 22). The sort of technology that universities innovate in is generally biotechnology, such as genetic engineering of enzymes and microorganisms for use in baking, brewing and improved grains.
Figure 15: Corporate entities file the most patents in food technology
25
5.2 Grant recipients
The following small businesses involved in the food processing industry have received grant money from the Australian Government to develop their product or to protect their product using IP rights:
Bacchus Distillery Pty Ltd – grant of $335,748 for production of a taste-neutral wine spirit (WO 2006/108232).
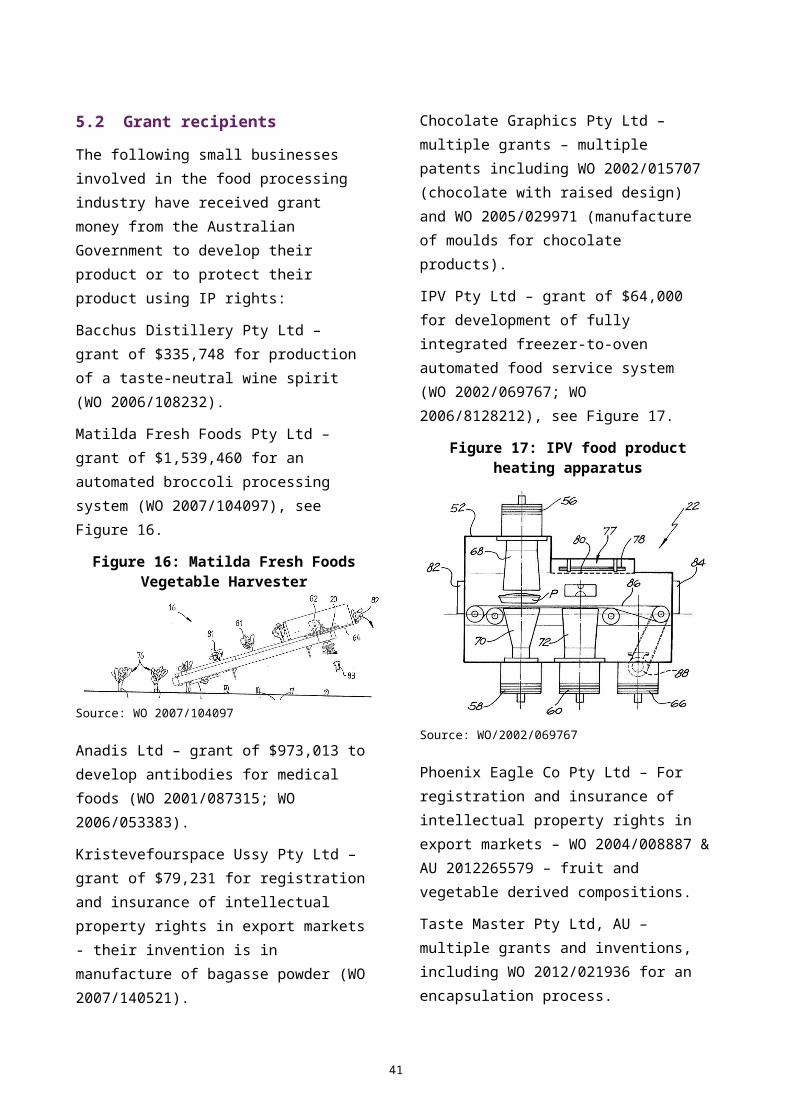
Matilda Fresh Foods Pty Ltd – grant of $1,539,460 for an automated broccoli processing system (WO 2007/104097), see Figure 16.
Figure 16: Matilda Fresh Foods Vegetable Harvester
Source: WO 2007/104097
Anadis Ltd – grant of $973,013 to develop antibodies for medical foods (WO 2001/087315; WO 2006/053383).
Kristevefourspace Ussy Pty Ltd – grant of $79,231 for registration and insurance of intellectual property rights in export markets - their invention is in manufacture of bagasse powder (WO 2007/140521).
Chocolate Graphics Pty Ltd – multiple grants – multiple patents including WO 2002/015707 (chocolate with raised design) and WO 2005/029971 (manufacture of moulds for chocolate products).
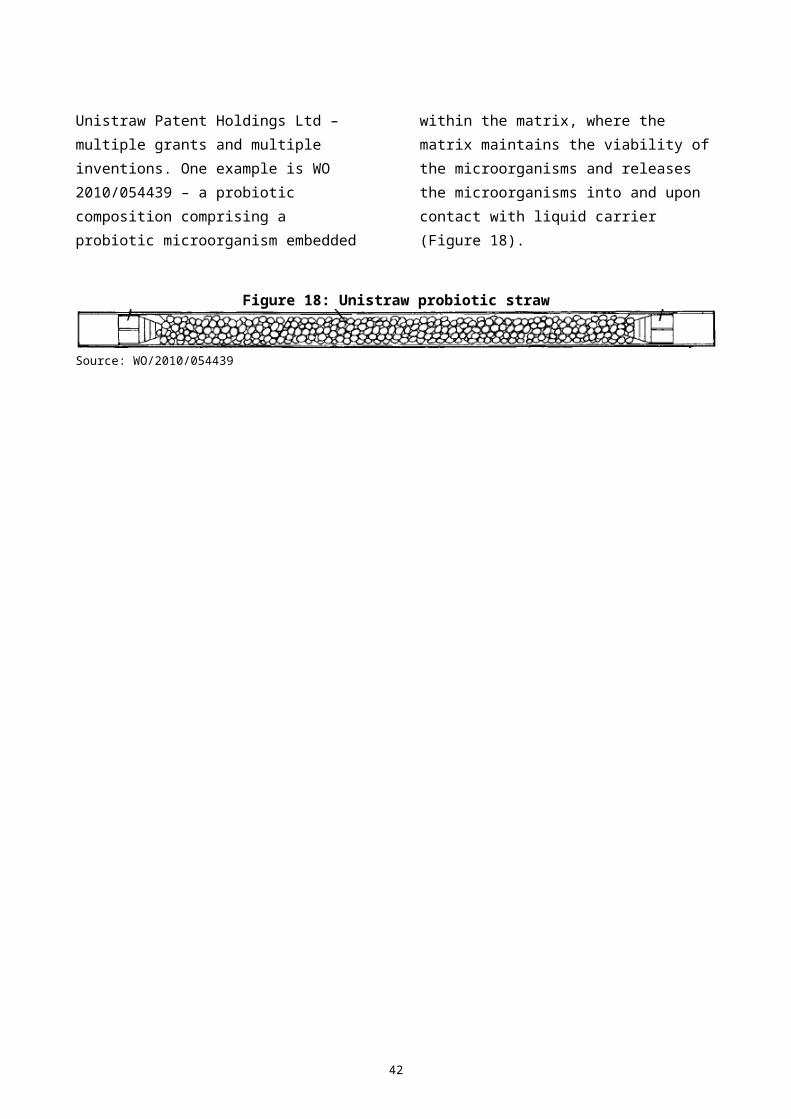
IPV Pty Ltd – grant of $64,000 for development of fully integrated freezer-to-oven automated food service system (WO 2002/069767; WO 2006/8128212), see Figure 17.
Figure 17: IPV food product heating apparatus
Source: WO/2002/069767
Phoenix Eagle Co Pty Ltd – For registration and insurance of intellectual property rights in export markets – WO 2004/008887 & AU 2012265579 – fruit and vegetable derived compositions.
Taste Master Pty Ltd, AU – multiple grants and inventions, including WO 2012/021936 for an encapsulation process.
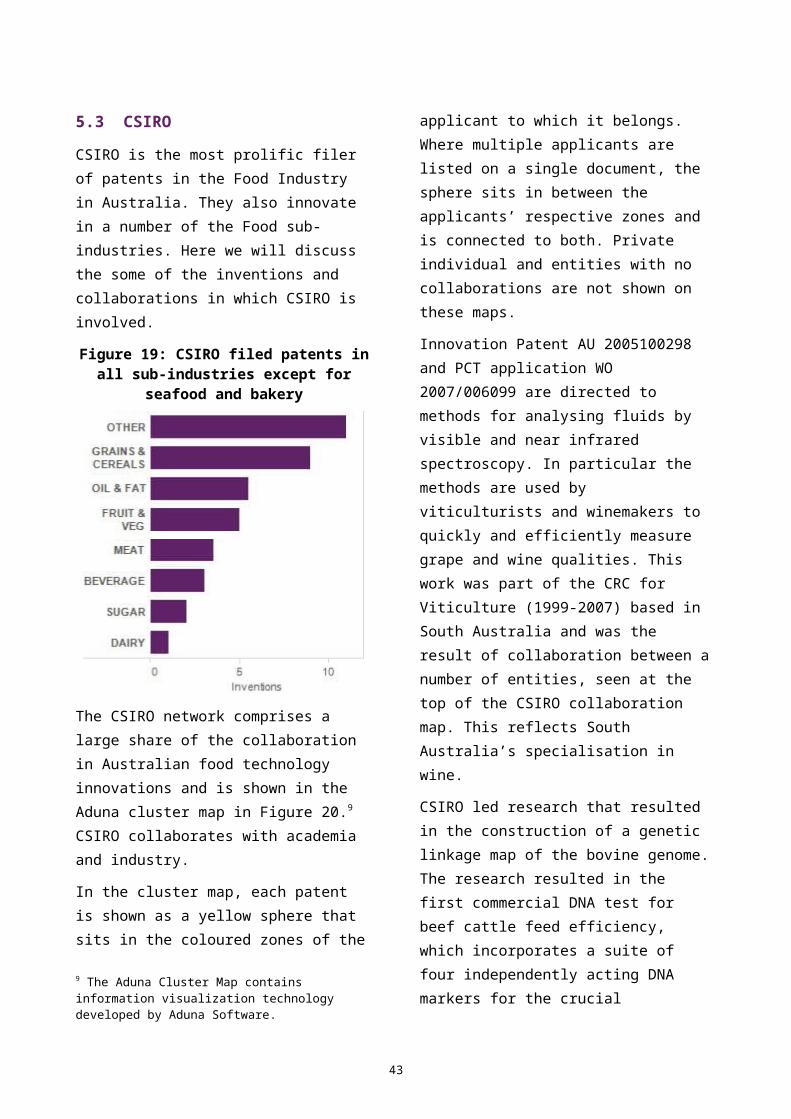
Unistraw Patent Holdings Ltd – multiple grants and multiple inventions. One example is WO 2010/054439 – a probiotic composition comprising a probiotic microorganism embedded within the matrix, where the matrix maintains the viability of the microorganisms and releases the microorganisms into and upon contact with liquid carrier (Figure 18).
Figure 18: Unistraw probiotic straw
Source: WO/2010/054439
26
5.3 CSIRO
CSIRO is the most prolific filer of patents in the Food Industry in Australia. They also innovate in a number of the Food sub-industries. Here we will discuss the some of the inventions and collaborations in which CSIRO is involved.
Figure 19: CSIRO filed patents in all sub-industries except for seafood and bakery
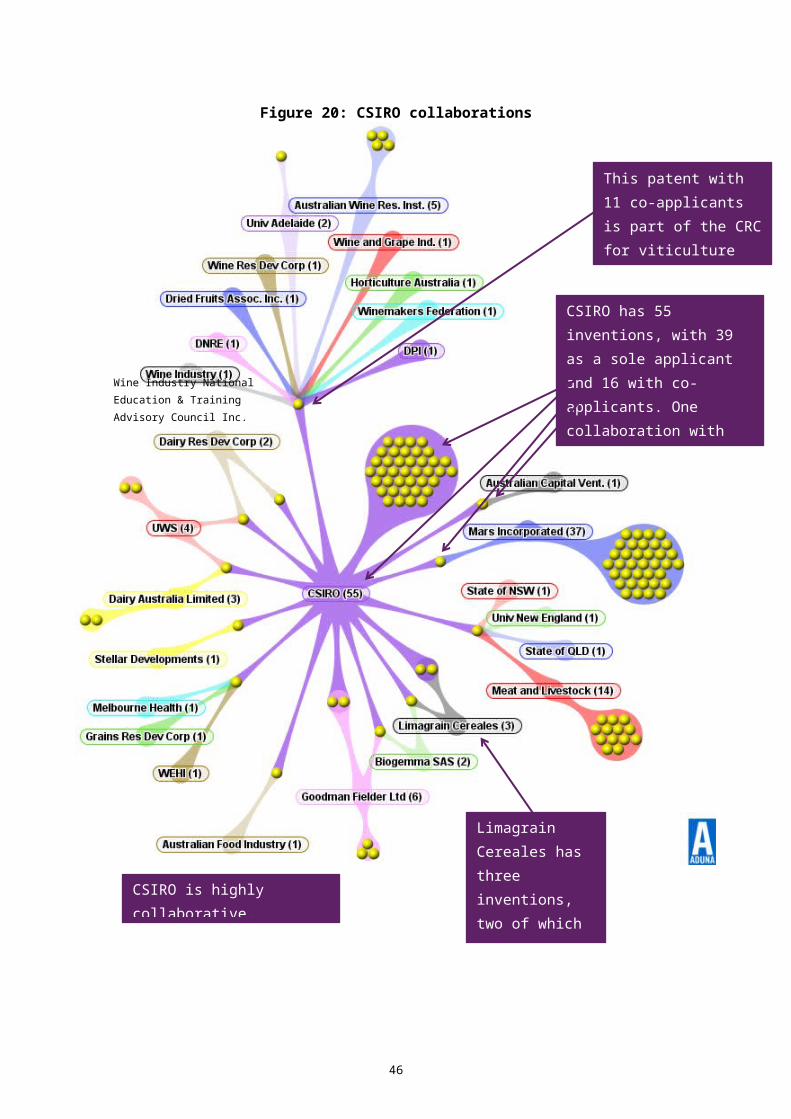
The CSIRO network comprises a large share of the collaboration in Australian food technology innovations and is shown in the Aduna cluster map in Figure 20.9 CSIRO collaborates with academia and industry.
In the cluster map, each patent is shown as a yellow sphere that sits in the coloured zones of the applicant to which it belongs. Where multiple applicants are listed on a single document, the sphere sits in between the applicants’ respective zones and is connected to both. Private individual and entities with no collaborations are not shown on these maps.
Innovation Patent AU 2005100298 and PCT application WO 2007/006099 are directed to methods for analysing fluids by visible and near infrared spectroscopy. In particular the methods are used by viticulturists and
winemakers to quickly and efficiently measure grape and wine qualities. This work was part of the CRC for Viticulture (1999-2007) based in South Australia and was the result of collaboration between a number of entities, seen at the top of the CSIRO collaboration map. This reflects South Australia’s specialisation in wine.
CSIRO led research that resulted in the construction of a genetic linkage map of the bovine genome. The research resulted in the first commercial DNA test for beef cattle feed efficiency, which incorporates a suite of four independently acting DNA markers for the crucial production trait of converting feed into saleable meat (WO 2002/064820). This work was done in conjunction with the CRC for Cattle and Beef Quality.
The CSIRO Plant Industry, Food and Nutritional Sciences group developed a number of patents, such as: Starch branching enzyme
(WO 2001/062934), in collaboration with Limagrain Cereales Ingredients SA;
Barley with reduced SSII activity and starch containing products with a reduced amylopectin content (WO 2002/037955);
Barley with altered branching enzyme activity and starch and starch containing products with an increased amylose content (WO 2003/094600);
Wheat with altered branching enzyme activity and starch and starch containing products derived therefrom (WO 2005/001098), in collaboration with Limagrain Cereales Ingredients SA;
Rice and products thereof having starch with an increased proportion of amylose (WO 2005/040381), in collaboration with Limagrain Cereales Ingredients SA and Biogemma SAS;
9 The Aduna Cluster Map contains information visualization technology developed by Aduna Software.
27
Method and means for improving bowel health (WO 2006/069422); and
Barley and uses thereof (WO 2011/011833), in collaboration with Australian Capital Ventures Ltd.
The result of this interdisciplinary research effort across plant genetics and human nutrition led to the development and commercialisation of BARLEYmax, a novel grain developed with substantiated health benefits and high consumer acceptance.
Research at the Food and Nutritional Sciences site at Werribee has resulted in food processing, food delivery, microencapsulation and dairy inventions, such as: Powdered food formulations that resist
oxidation due to an oxygen sensitive oil encapsulated within a film forming protein (WO 2001/074175);
A fortified milk with extra calcium that does not produce a gritty mouth feel and is heat stable (WO 2001/072135);
Gastrointestinal tract delivery systems where the invention relates to encapsulating agents combining food grade treated carbohydrate with water-soluble protein (WO 2005/048998); and
High amylose starches are pre-processed to retain resistance while improving water binding properties and can be used as fat replacement ingredients (WO 2005/105851).
Preservative compositions and materials were other inventions developed in the Food Sciences Division: Oxygen scavenging composition for use
in food and beverage packaging to scavenge unwanted oxygen and improve
shelf life and/or if incorporated into packaging materials to reveal leaks in packages or to indicate package damage caused by handling or tampering (WO 2002/051825; WO 2002/076916);
A method of improved storage for fruit where gaseous unsaturated compounds such as ethylene are removed from the environment using tetrazine esters incorporated in a hydrophobic polymeric substrate (WO 2004/076545); and
A method for inactivating microbiological spores in packaged food products which improves shelf life (WO 2005/041694).
Finally, the Oilseeds Group of CSIRO Plant Industry’s Metabolic Engineering of New Plant Products program have been developing new plant oils for edible and industrial uses: Improved seed oils (including
cottonseed) useful for treating or
preventing disease selected from obesity, heart disease, hypertension, cancer, and diabetes (WO 2010/009500 and WO 2010/009499).
Rice with improved health benefits including stability and storage with a fatty acid composition comprising greater oleic acid and less palmitic and/or linoleic acids (WO 2008/006171).
28
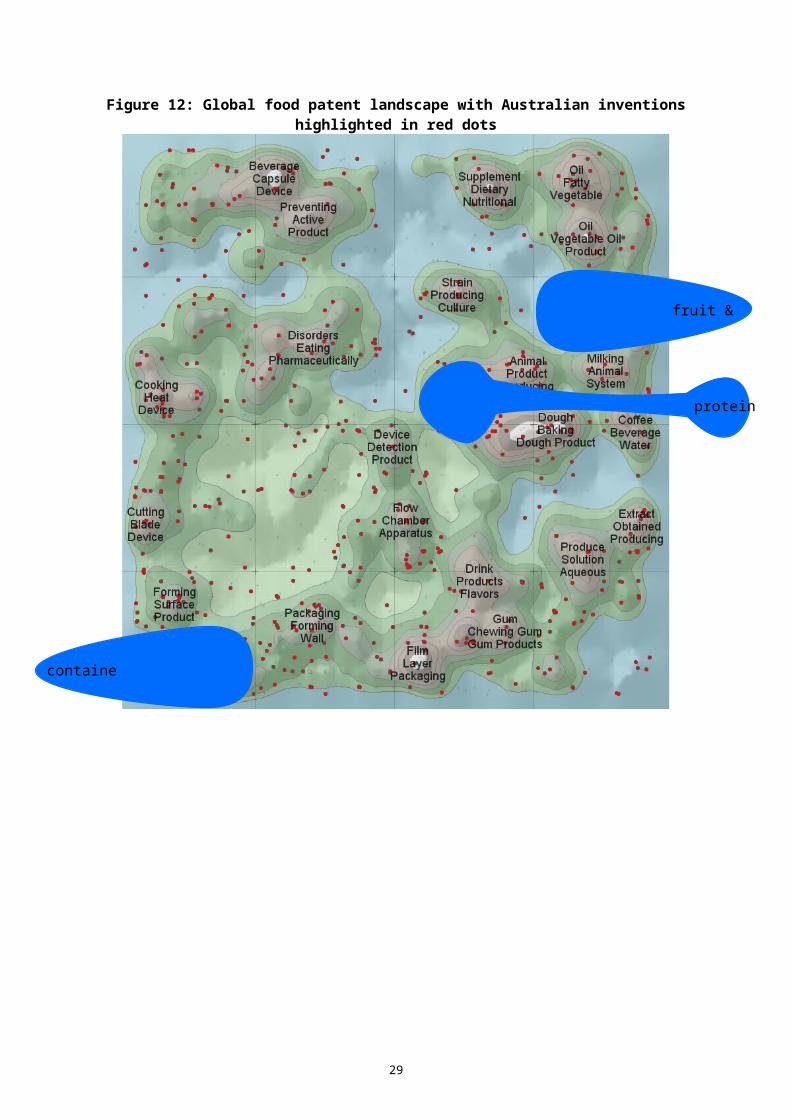
Figure 20: CSIRO collaborations
29
CSIRO is highly collaborative.
CSIRO has 55 inventions, with 39 as a sole applicant and 16 with co-applicants. One collaboration with Australian Capital Ventures, one collaboration with Mars, Inc., and so on.
This patent with 11 co-applicants is part of the CRC for viticulture
Limagrain Cereales has three inventions, two of which are collaborations with CSIRO.
Wine Industry National Education & Training Advisory Council Inc.
Table 2: Full names of entities in Figure 20 Dairy Res Dev Corp Dairy Research and Development Corporation
DNREState of Victoria as represented by Department of Natural Resources and Environment
DPIMinister for Primary Industries, National Resources and Regional Development
Dried Fruits Assoc. Inc. The Australian Dried Fruits Association Inc.
Grains Res Dev Corp Grains Research And Development Corporation
Meat and Livestock Meat and Livestock Australia Limited
UWS University of Western Sydney
Wine and Grape Ind. National Wine and Grape Industry Centre
Wine Industry Wine Industry National Education & Training Advisory Council Inc.
Wine Res Dev Corp Grape and Wine Research & Development Corporation
Winemakers Federation Winemakers' Federation of Australia Inc
30
6 Collaboration measured through co-applicantsObjective: To determine the level of collaboration in Australian food inventions.
Inventions often result from cumulative and collaborative work. Multiple individuals from different companies, universities or research centres collaborate to invent and their respective employers are listed on patent documents as co‐applicants. Co-application is therefore an indicator of collaboration.
The share of Australian food inventions with more than one applicant is 23 per cent, which is higher than peer countries such as Canada (18 per cent), Norway (17 per cent) and Sweden (8 per cent) (Figure 21).
Figure 21: Collaboration in food inventions in Australia and peer countries
Collaboration tends to be more pervasive among universities and research institutes than it is for private sector entities. The cluster map in Figure 22 illustrates the collaboration network among Australian universities. The vast majority of university inventions involve collaboration.
The University of Queensland (UQ) is highly collaborative, while CSIRO has collaborated with three universities.
There are some notable UQ collaborations, such as the extraction of colour proteins from coral to improve the colour of plant cells; the collaboration with the IAMS Company for methods of modulating glucose metabolism by providing diet formulations comprising carbohytrates and fat in combinations with higher amounts of protein. Another UQ collaboration involved a nanoemulsion comprising edible oil for food preservative compositions and compositions of controlled release bioactives.
Collaboration occurs outside the research sector albeit to a lesser extent. Murray Goulbourn Co-operative and Agriculture Victoria Services are among the more collaborative entities (figure 23). There are numerous smaller networks as well.
31

Figure 22: Australian university collaborations
32
These are the only university inventions that do not have a co-applicant.
CSIRO has collaborated with three universities
The University of Queensland is the most collaborative university
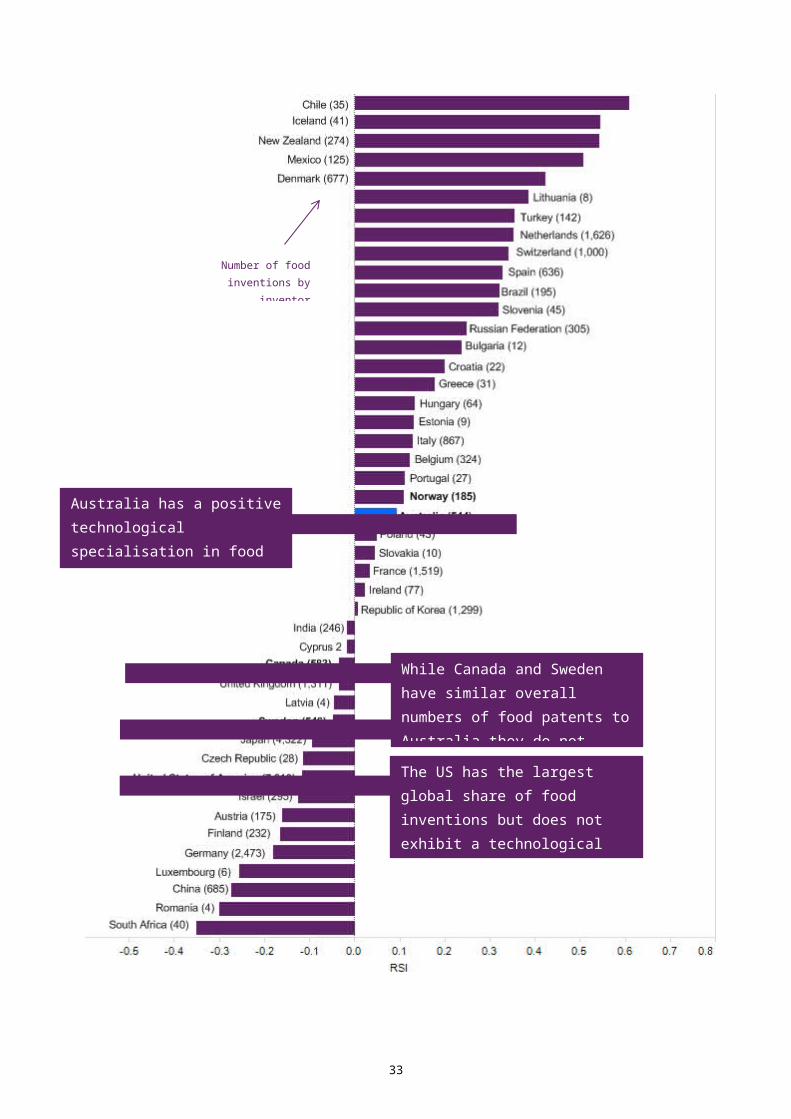
Table 3: Full names of entities in Figure 22 and Figure 23ANU The Australian National University
Australian Wine Res. Inst. The Australian Wine Research Institute
Dairy Res Dev Corp Dairy Research and Development Corporation
DNREState of Victoria as represented by Department of Natural Resources and Enviroment
DPIMinister for Primary Industries, National Resources and Regional Development
Dried Fruits Assoc. Inc. The Australian Dried Fruits Association Inc.
Fisheries Res Dev Corp Fisheries Research and Development Corporation
Fonterra Coop Fonterra Co-Operative Group Limited
Land OLakes Farm Feed Land O'Lakes Farmland Feed LLC
Murray Goulburn Coop Murray Goulburn Co-Operative Co Limited
National Herd Imp. National Herd Improvement Association of Australia Inc
Obschestvo Ogranichen. Obschestvo S Ogranichennoi Otvetstvennostiyu Sibex
QLD DEEDIThe State of Queensland acting through the Department of Employment, Economic Development and Innovation
QUT Queensland University of Technology
Technion Technion Research and Development Foundation Ltd
UNSW University of New South Wales
UQ The University of Qeensland
UWS University of Western Sydney
VUT Victoria University of Technology
Wine and Grape Ind. National Wine and Grape Industry Centre
Wine Industry Wine Industry National Education & Training Advisory Council Inc.
Wine Res Dev Corp Grape and Wine Research & Development Corporation
Winemakers Federation Winemakers' Federation of Australia Inc
33
Figure 23: Collaborations outside CSIRO and universities
The Murray-Goulburn Co-operative and Agriculture Victoria Services network involve inventions in milking and improved dairy compositions.
Just five out of the top 30 applicants have collaborated — CSIRO, Mars, Amcor, Murray Goulburn and Protech. The large
corporations do not appear to engage in collaboration in terms of patent co-applications. This may reflect the extensive in-house R&D capabilities of large private entities. It is also possible collaboration occurs but the contractual terms on which private firms operate result in them being the sole applicant.
34
Murray Goulburn Co-operative and Agriculture Victoria Services are the most collaborative entities outside the research sector

7 Patent citation analysisObjective: To provide patent citation analysis and to establish who cites food patents originating from Australia.
Patent citation frequency is often used as an indicator of technological impact. Patent examiners and innovators worldwide routinely cite previous inventions, which are then recorded on the patent. The frequency of these citations is one metric for the impact of patents in terms of follow-on innovation.
Figure 24 illustrates how to read a patent citation tree. There are two types of patent citations: citations to previous documents (backward citations) and citations of a patent
document after its publication (forward citations). Entities are colour-coded.
Backward citations can be indicative of the multi-disciplinary extent of a patent. For instance, multiple fields in the backwards citations indicate a patent that draws on several disciplines.
Once a patent has been filed and is published, then others can cite it. Forward citations therefore can be indicative of the impact a patent has had on follow on innovation – the higher the count of forward citations, the greater the impact the patent has had on follow on innovation.
Figure 24: An example of a patent citation tree with two generations of backward and forward citations relating to the subject patent
35
Subject patent
Forward citations:These patent documents are citing the subject patent.
Backward citations:These patent documents are cited by the subject patent.
36
Research has shown that the number of citations a patent receives is positively related to its economic value.10 A positive association between the frequency of forward citations and company value has also been established.11 As such, forward patent citation counts are often used to measure the impact or the value of a patent.
7.1 Patent citation frequency
The frequency with which a patent is cited is one indicator of a patent’s impact in terms of follow on innovation. Generally, inventions with higher citation rates are considered to be of higher impact. Figure 25 shows the citation frequency for PCTs with an Australian inventor. Nearly half of all Australian PCT inventions have been cited by follow on inventors; and 56 have been cited over ten times.
Figure 25: Citation frequency for food PCTs with an Australian inventor
Table 4 lists the average citation rates of Australian food inventions with countries that have similar portfolios. Australian food inventions have less impact on follow on innovation than Sweden, Norway and
10 Harhoff D., Scherer F. M. and Vopel K. (2002), Citations, Family Size, Opposition and the Value of Patent Rights, Research Policy 32(8), 1343 – 63; see also Trajtenberg M. (1990), A Penny for Your Quotes: Patent Citations and the Value of Innovations, The RAND Journal of Economics 21(7), 172 – 187.11 Hall B. H., Jaffe A. B and Trajtenberg M. (2005), Market Value and Patent Citations, The RAND Journal of Economics 36, 16 – 38.
Canada. Australia’s citation rate is also less than the world average.
Table 4: The average citation rate per invention
Region Average citings per invention
Australia 3.85Sweden 4.57Norway 4.64Canada 5.80World 4.86
Figure 26 depicts the citation frequency for Australian-originated food PCT inventions by priority year. The inventions which were cited more than 20 times had priority dates between 2000 and 2005. PCT inventions published in earlier years generally have more citations as these patents have had more time to be cited.
The top 20 entities with the most highly cited and high impact Australian food patents are listed in Figure 27. The number of inventions in each entity’s is also listed. Figure 27 does not account for the age of the patents in each portfolio.
CSIRO is the most highly cited entity with nearly 250 citations (and 30 inventions). The patent by the Mars Inc. relates to foodstuff comprising colostrum, a probiotic and a prebiotic for gastrointestinal health. This patent is the most cited on average (4.5 cites per year since publication), and is the subject patent in Figure 24.
A Sydney-based company called Probiomics Ltd. has a high impact patent portfolio based on a proprietary probiotic using Lactobacillius fermentum. This product promotes intestinal health. Queensland-based inventor Richard Bass developed a high impact patent portfolio around electric stunners used to slaughter animals humanely.
37
Figure 26: Citation frequency for Australian food inventions by priority year
Figure 27: Highly cited and high impact Australian food inventors
38
Breville has developed citrus fruit squeezers, beverage making apparatuses, and mechanically driven liquid shakers. The Coffee Innovation Group has developed centrifuges for producing filtered coffee.
Multinational food giants Mars and Unilever also own highly cited patents concerning foods and meat substitutes with long shelf lives (Mars) and various food production processes (Unilever).
For the purposes of this analysis, the top cited patent families are ranked by average
citings per year, which controls for the age of the patent. Table 3 ranks the top 10 cited Australian food technology inventions.
The only invention in the top cited list with multiple applicants is by CSIRO and Biogemma SAS. The invention offered a method to improve bowel health and was part of a suite of inventions relating to improved barley for better digestion (see section 5.3).
Table 5: Top cited Australian food technology inventions
Title of inventionAverage cites per year
Applicants Publication Number
Foodstuff 4.5 Mars, Incorporated WO2003041512A plasma formed in a fluid 3.9 Chang, Chak Man Thomas WO2003096767Nutritional composition comprising immunoglobulins and oligosaccharides
3.8 Nutricia N.V. WO2006022543
Aerated food products containing hydrophobin 3.3 UNILEVER WO2006010425
Encapsulation of food ingredients 2.8 CSIRO WO2001074175Ice-making system for refrigeration appliance 2.8 Electrolux Home Products, Inc. WO2007084824
Method and means for improving bowel health 2.4 CSIRO; Biogemma SAS WO2006069422
Microemulsion & sub-micron emulsion process & compositions 2.2 Stiefel Research Australia Pty Ltd WO2006024095
Use of proline specific endoproteases to hydrolyse peptides and proteins
2.0 DSM IP Assets B.V. WO2005027953
39
8 ConclusionAustralia ranks 14th in food inventions on a global scale. This performance is similar to other industrialised countries, namely Canada and Sweden.
Australia exhibits a specialisation in food technologies — the share of food patents filed by Australian inventors is more than the overall proportion of food patents worldwide.
The majority of Australian food processing patents are in the beverage, sugar, and dairy sectors.
Regional specialisations include South Australia’s wine and beer brewing, Queensland’s slaughtering, New South Wales’ bakery and Victoria’s beverages.
This study identified 1,050 food related inventions that originated from Australia between 2000 and 2011.
Nearly half of Australian inventions are cited by another inventor.
Collaboration is a defining characteristic of many prolific Australian food inventors and occurs in 23 per cent of patent filings, which is above collaboration rates in comparable countries.
Collaboration is prevalent among Australian universities and research institutes while large private firms tend to be the sole applicants.
40
Appendix A – Search strategyThis study drew on patent data from:
AusPat – Australian patent database administered by IP Australia.
EPO Worldwide Patent Statistical Database (PATSTAT) – developed by the European Patent Office (EPO), covering data from over 100 countries
REGPAT database, January 2013 edition – developed by the OECD and derived from the PATSTAT and the EPOline database.
Derwent World Patent Index (DWPI) developed by Thomson Reuters. This database covers patent records from 47 jurisdictions, including Australia.
The search used Boolean logic and encompasses Australian originating applications containing at least one food-related IPC and/or at least one combination of the food-related keywords.
AUSPAT:
Priority = AustraliaANDPriority year = 1995-2012AND(IPC = A01J* OR A21* OR A22* OR A23B* OR A23C* OR A23D* OR A23F* OR A23G* OR A23J* OR A23L* OR A23N* OR B02B* OR C12C* OR C12F* OR C12G* OR C12H* OR C12J* OR C12L* OR C13*ORTitle = (food* OR edib?? OR eatab?? OR comestib?? OR eating OR snack? OR confection* OR beverage? OR soft_drink? OR condiment? OR fruit? OR vegetable?) AND (fridge? OR refrigerat* OR (cold ADJ room?) OR processing OR cook* OR evapo?rat* OR dissolv* OR filter* OR blend* OR cut? OR cutting OR chop? OR chopping OR corer? OR coring OR boil* OR steam* OR (deep_fry*) OR nozzle? OR spray* OR valve? OR conveyer? OR extrusion? OR extrud* OR form OR forming OR dehydrat* OR electrolyte? OR membrane? OR packag* OR container? OR jar OR bottle? OR bottling OR canning OR storing OR storage OR wrap* OR measur* OR weigh* OR analy* OR temperature? OR thermometer? OR instrument? OR device?)ORAbstract = (food* OR edib?? OR eatab?? OR comestib?? OR eating OR snack? OR confection* OR beverage? OR soft_drink? OR condiment? OR fruit? OR vegetable?) AND (fridge? OR refrigerat* OR (cold ADJ room?) OR processing OR cook* OR evapo?rat* OR dissolv* OR filter* OR blend* OR cut? OR cutting OR chop? OR chopping OR corer? OR coring OR boil* OR steam* OR (deep_fry*) OR nozzle? OR spray* OR valve? OR conveyer? OR extrusion? OR extrud* OR form OR forming OR dehydrat* OR electrolyte? OR membrane? OR packag* OR container? OR jar OR bottle? OR bottling OR canning OR storing OR storage OR wrap* OR measur* OR weigh* OR analy* OR temperature? OR thermometer? OR instrument? OR device?))
41
PATSTAT:
Filing year = 1998-2012AND(IPC = A01J* OR A21* OR A22* OR A23B* OR A23C* OR A23D* OR A23F* OR A23G* OR A23J* OR A23L* OR A23N* OR B02B* OR C12C* OR C12F* OR C12G* OR C12H* OR C12J* OR C12L* OR C13*ORTitle = (food* OR edib?? OR eatab?? OR comestib?? OR eating OR snack? OR confection* OR beverage? OR soft_drink? OR condiment? OR fruit? OR vegetable?) AND (fridge? OR refrigerat* OR (cold_room?) OR processing OR cook* OR evapo?rat* OR dissolv* OR filter* OR blend* OR cut? OR cutting OR chop? OR chopping OR corer? OR coring OR boil* OR steam* OR (deep_fry*) OR nozzle? OR spray* OR valve? OR conveyer? OR extrusion? OR extrud* OR form OR forming OR dehydrat* OR electrolyte? OR membrane? OR packag* OR container? OR jar OR bottle? OR bottling OR canning OR storing OR storage OR wrap* OR measur* OR weigh* OR analy* OR temperature? OR thermometer? OR instrument? OR device?)ORAbstract = (food* OR edib?? OR eatab?? OR comestib?? OR eating OR snack? OR confection* OR beverage? OR soft_drink? OR condiment? OR fruit? OR vegetable?) AND (fridge? OR refrigerat* OR (cold_room?) OR processing OR cook* OR evapo?rat* OR dissolv* OR filter* OR blend* OR cut? OR cutting OR chop? OR chopping OR corer? OR coring OR boil* OR steam* OR (deep_fry*) OR nozzle? OR spray* OR valve? OR conveyer? OR extrusion? OR extrud* OR form OR forming OR dehydrat* OR electrolyte? OR membrane? OR packag* OR container? OR jar OR bottle? OR bottling OR canning OR storing OR storage OR wrap* OR measur* OR weigh* OR analy* OR temperature? OR thermometer? OR instrument? OR device?))
Note: * denotes unlimited truncation
? denotes one or zero character
_ denotes white space or a hyphen
42
Description of searched IPC marks:
IPC Description
A01J Manufacture of dairy products.
A21B Bakers' ovens; machines or equipment for baking.
A21CMachines or equipment for making or processing doughs; handling baked articles made from dough.
A21DTreatment, e.g. preservation, of flour or dough for baking, e.g. by addition of materials; baking; bakery products; preservation thereof.
A22# Butchering; meat treatment; processing poultry or fish.
A23B
Preserving, e.g. by canning, meat, fish, eggs, fruit, vegetables, edible seeds; chemical ripening of fruit or vegetables; the preserved, ripened, or canned products.
A23CDairy products, e.g. milk, butter, cheese; milk or cheese substitutes; making thereof.
A23D Edible oils or fats, e.g. margarines, shortenings, cooking oils.
A23F Coffee; tea; substitutes; manufacture, preparation, or infusion thereof.
A23GCocoa; cocoa products, e.g. chocolate; substitutes for cocoa or cocoa products; confectionery; chewing gum; ice-cream.
A23JProtein compositions for foodstuffs; working-up proteins for foodstuffs; phosphatide compositions for foodstuffs.
A23L
Foods, foodstuffs, or non-alcoholic beverages; their preparation or treatment, e.g. cooking, modification of nutritive qualities, physical treatment; preservation of foods or foodstuffs, in general.
A23N
Machines or apparatus for treating harvested fruit, vegetables, or flower bulbs in bulk, not otherwise provided for; peeling vegetables or fruit in bulk; apparatus for preparing animal feeding-stuffs.
A23P Shaping or working of foodstuffs, not fully covered by a single other subclass.
B02BPreparing grain for milling; refining granular fruit to commercial products by working the surface.
C12C Brewing of beer.
C12FRecovery of by-products of fermented solutions; denaturing of, or denatured, alcohol.
C12G Wine; other alcoholic beverages; preparation thereof.
C12HPasteurisation, sterilisation, preservation, purification, clarification, ageing of alcoholic beverages or removal of alcohol therefrom.
C12J Vinegar; its preparation.
C12L Pitching or depitching machines; cellar tools.
C13# Sugar industry
# denotes any letter
43
Appendix B – OECD definitions of subregions: TL2 and TL3 regions of Australia
44
Appendix C – Classification into Food Sub-Industries
IPC Subclass
IPC Maingroup Food Sub-industry
A01B Fruit & Veg
A01C Fruit & Veg
A01D Fruit & Veg
A01F Fruit & Veg
A01G
1-15/--
16-17/--
23-33/--
Fruit & Veg
Grains & Cereals
Fruit & Veg
A01H Fruit & Veg
A01J Dairy
A01K
1-45/-- Meat
47-59/-- Sugar
61-97/-- Seafood
A01M21/-- Fruit & Veg
23-31/-- Meat
A01N1/-- Meat
3/-- Fruit & Veg
A21B Bakery
A21C Bakery
A21D Bakery
A22B Meat
A22C Meat
A23B 1-5/-- Meat
A23B 7/-- Fruit & Veg
IPC Subclass
IPC Maingroup Food Sub-industry
A23B 9/-- Grains & Cereals
A23C Dairy
A23D Oil & Fat
A23F Beverage
A23G Sugar
A23J Various
A23L Various
A23N Fruit & Veg
A23P Other
C05B Fruit & Veg
C07H Sugar
C08B Sugar
C11B Oil & Fat
C11C Oil & Fat
C11D Oil & Fat
C12C Beverage
C12G Beverage
C12H Beverage
C12J Other
C13B Sugar
C13D Sugar
C13F Sugar
C13K Sugar
45
FoodSub-industry
Keywords in title
Fruit & Veg Grapes, Pulp, Fruit, Juice, Berries, Espalier, Harvest, Salad, Plant, Bean, Legume, Pear, Peel, Citrus, Apple, Potato, Onions, Garlic, Banana, Melon, Tomato, Flowers, Juicing, produce
Grain & Cereal Corn, Rice, Grits, Grain mill, Cereal, Grain, Flour, Sunflower, Polenta, *meal, Hull, Seed, Soy, Tofu, Barley
Dairy milk, whey, dairy, teats, cream, butter, cheese
Seafood Fish, Scale, Shuck, Oyster, Tuna, Seaweed
Bakery cake , bread, dough, pastry, baguette, loaf, baked
Meat Egg, Carcass, Beef, Chicken, Lamb, Poultry, Butcher, Slaughter
Oil & Fat Fat, Oil, Sterol
Sugar Molasses, Chocolate, Cocoa, Sugar, Honey, Confection, Sweet, Marzipan, Sucrose, Sacchari
Beverage beverage, drink, wine, beer, brew, sake, coffee, ethanol, alcohol, potable water, distill, tequila, ice, liqueur, cocktail
Other food, protein, carbohydrate, condiment, edible, table salt, kitchen, oven, masticate, vending, foodstuff, cook, calorif, curly puff, chewing gum, flavour, flavour, nutrient, nutritive, nutritional, gelatin , roasting, pasteurisation, eatab, comest, herbal, palatability, probiotic, Steamer, Rotisserie, chopstick, Container, Bag, Closure, Carrier, Package, Closure, Bottle, pouch vessel, Vacuum, Dispenser, Tap, Slicing, Blade, Dispensing, Filling, Metering, Portioning, Extractor, Convey, Trolley, Knife, Cutting, Blade, Cutter, Extract, Extrude, Portion, Blank, Valve, Spout, pouch, Refrigerator, Refrigeration, Cooling, Frost, Freeze, Frozen, Cooler, Icing, ice
If a patent was in one of the main classes, it was removed from the “other” class
Classes/keywords ignored for the purposes of report:o Medicinal (methods for treating obesity, eating disorders, heartburn, gastric bypass,
feeding infants, feeding via tubes, antioxidants, dental products for removing food)o polymers (films, polymers, foam mattress, recycling processes, adhesive label
feedstock)o microorganisms & enzymes (enzyme extraction, production of compounds by
fermentation, anaerobic digestion of lignocellulosic feedstocks)o pest control (pesticide compositions, insect barriers, monitoring termite activity,
rodent bait)o animal foddero tobaccoo other not related (building materials, concrete, paper, games, toys, waster water
treatment, fuels, methods of weight management and evaluating dietary information)
46
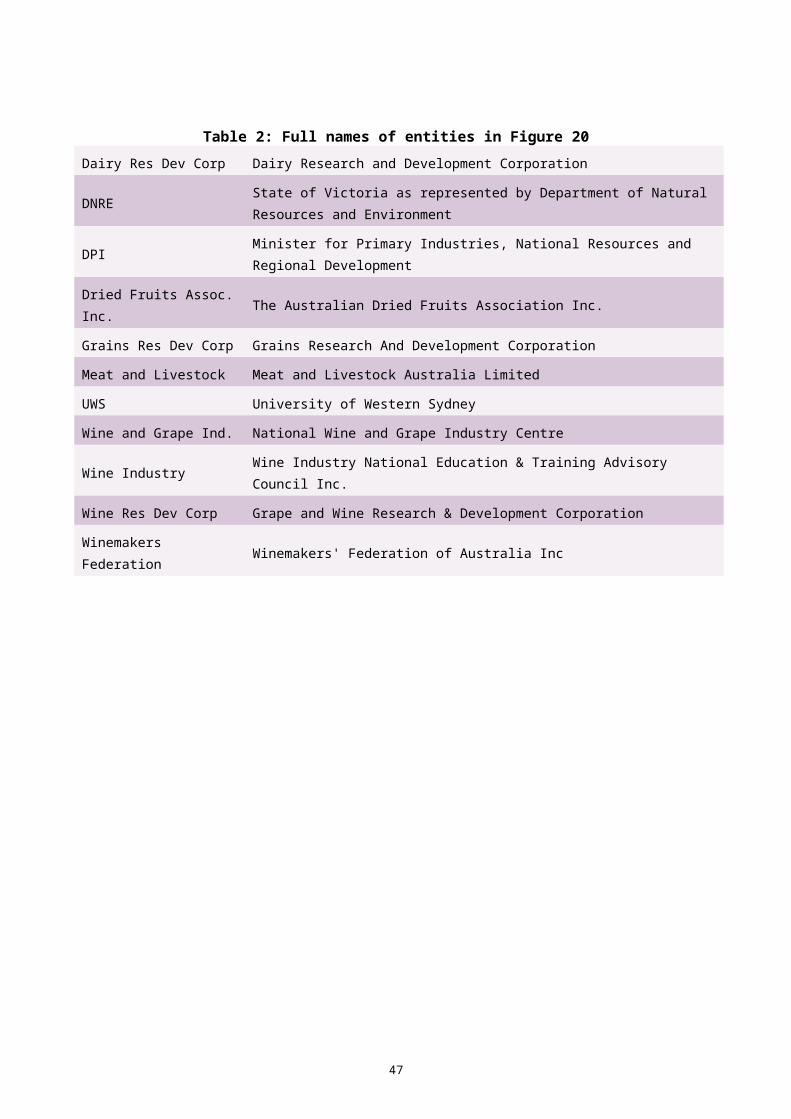
47

Appendix D – Complete list of PCT contracting states
two-letter code
name of state
AE United Arab Emirates
AG Antigua and Barbuda
AL Albania
AM Armenia2
AO Angola
AT Austria
AU Australia
AZ Azerbaijan
BA Bosnia and Herzegovina
BB Barbados
BE Belgium
BF Burkina Faso
BG Bulgaria
BH Bahrain2
BJ Benin
BN Brunei Darussalam
BR Brazil
two-letter code
name of state
BW Botswana
BY Belarus2
BZ Belize
CA Canada
CF Central African Republic
CG Congo
CH Switzerland
CI Côte d’Ivoire
CL Chile2
CM Cameroon
CN China3, 4
CO Colombia
CR Costa Rica
CU Cuba2
CY Cyprus
CZ Czech Republic
DE Germany
48
two-letter code
name of state
DK Denmark
DM Dominica
DO Dominican Republic
DZ Algeria2
EC Ecuador
EE Estonia
EG Egypt
ES Spain
FI Finland5
FR France2, 6
GA Gabon
GB United Kingdom7
GD Grenada
GE Georgia2
GH Ghana
GM Gambia
GN Guinea
GQ Equatorial Guinea
GR Greece
GT Guatemala
GW Guinea-Bissau
HN Honduras
HR Croatia
HU Hungary2
ID Indonesia2
IE Ireland
IL Israel
IN India2
IR Islamic Republic of Iran
IS Iceland
IT Italy
two-letter code
name of state
JP Japan
KE Kenya
KG Kyrgyzstan2
KM Comoros
KN Saint Kitts and Nevis
KPDemocratic People’s Republic of Korea
KR Republic of Korea
KZ Kazakhstan2
LALao People’s Democratic Republic
LC Saint Lucia2
LI Liechtenstein
LK Sri Lanka
LR Liberia
LS Lesotho
LT Lithuania
LU Luxembourg
LV Latvia
LY Libya
MA Morocco
MC Monaco
MD Republic of Moldova2
ME Montenegro
MG Madagascar
MKThe former Yugoslav Republic of Macedonia
ML Mali
MN Mongolia
MR Mauritania
MT Malta2
MW Malawi
49
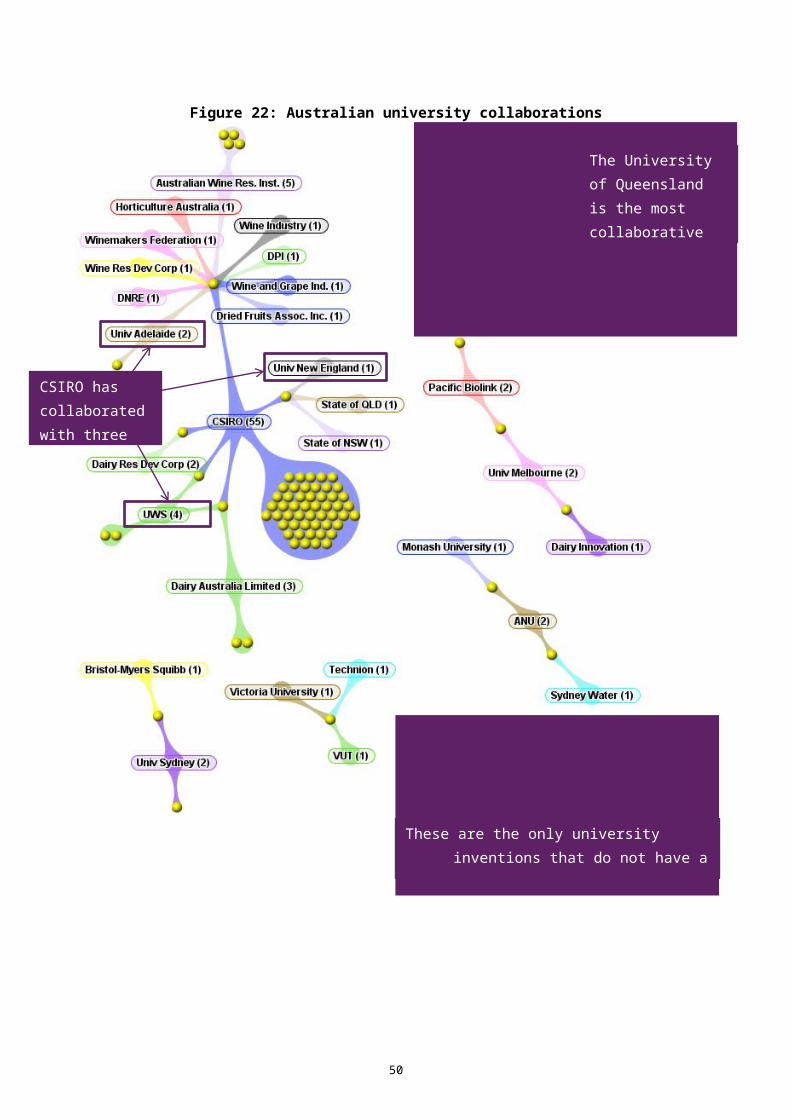
two-letter code
name of state
MX Mexico
MY Malaysia2
MZ Mozambique2
NA Namibia
NE Niger
NG Nigeria
NI Nicaragua
NL Netherlands8
NO Norway5
NZ New Zealand
OM Oman2
PA Panama
PE Peru
PG Papua New Guinea
PH Philippines
PL Poland5
PT Portugal
QA Qatar2
RO Romania2
RS Serbia9
RU Russian Federation2
RW Rwanda
SA Saudi Arabia
SC Seychelles
SD Sudan
SE Sweden5
SG Singapore
SI Slovenia
two-letter code
name of state
SK Slovakia
SL Sierra Leone
SM San Marino
SN Senegal
ST Sao Tome and Principe
SV El Salvador
SY Syrian Arab Republic
SZ Swaziland
TD Chad
TG Togo
TH Thailand2
TJ Tajikistan2
TM Turkmenistan2
TN Tunisia2
TR Turkey
TT Trinidad and Tobago
TZ United Republic of Tanzania
UA Ukraine2
UG Uganda
US United States of America11,12
UZ Uzbekistan2
VCSaint Vincent and the Grenadines2
VN Viet Nam
ZA South Africa2
ZM Zambia
ZW Zimbabwe
50
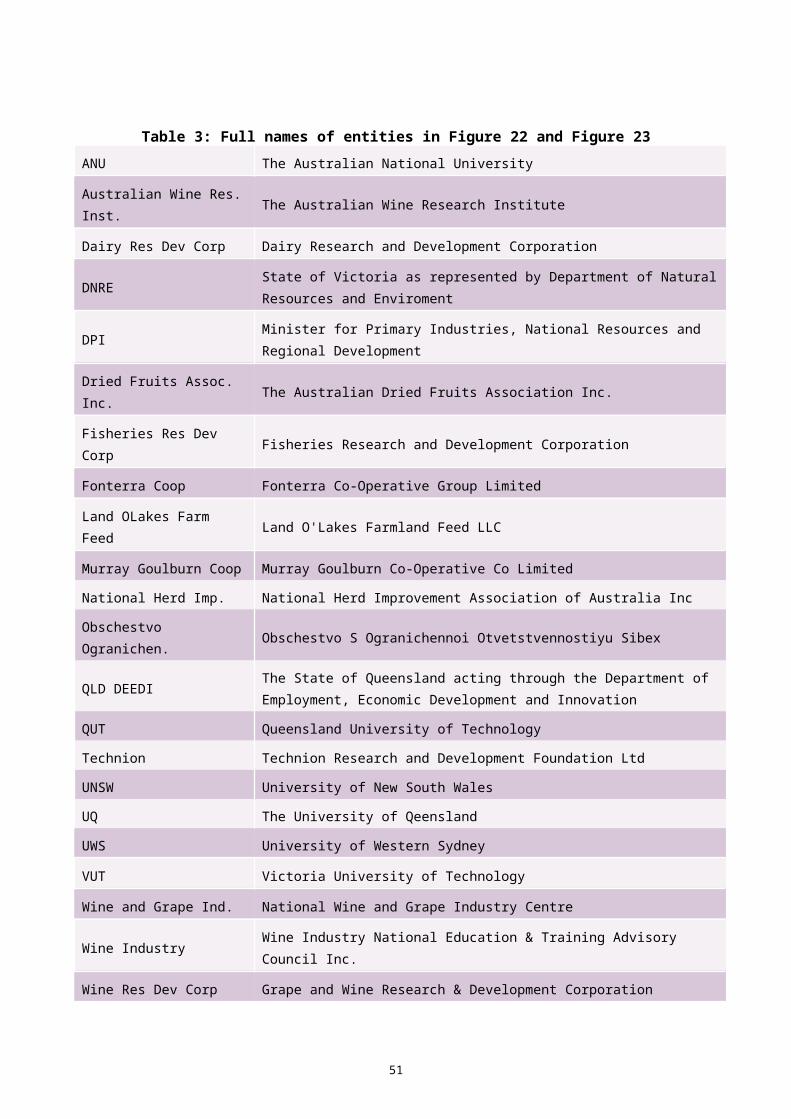
1 All PCT Contracting States are bound by Chapter II of the PCT relating to the international preliminary examination.2 With the declaration provided for in PCT Article 64(5).3 Applies also to Hong Kong, China with effect from 1 July 1997.4 Not applicable to Macau, China.5 With the declaration provided for in PCT Article 64(2)(a)(ii) .6 Including all Overseas Departments and Territories.7 The United Kingdom extended the application of the PCT to the Isle of Man with effect from 29 October 1983.8 Ratification for the Kingdom in Europe, the Netherlands Antilles and Aruba. The Netherlands Antilles ceased to exist on 10 October 2010. As from that date, the PCT continues to apply to Curaçao and Sint Maarten. The PCT also continues to apply to the islands of Bonaire, Sint Eustatius and Saba which, with effect from 10 October 2010, have become part of the territory of the Kingdom of the Netherlands in Europe.9 Serbia is the continuing State from Serbia and Montenegro as from 3 June 2006.10 Date of ratification of the Soviet Union, continued by the Russian Federation as from 25 December 1991.11 With the declarations provided for in PCT Articles 64(3)(a) and 64(4)(a).12 Extends to all areas for which the United States of America has international responsibility.
51