Embed Size (px)
Citation preview
Journal of Postsecondary Education and Disability
Volume 20 Number 2, 2008
Executive Editor
James Martin, University of Oklahoma
Managing EditorRichard Allegra, AHEAD
Editorial Associate
John W. Graham, University of Oklahoma
Editorial Review Board
Manju Banerjee; University of Connecticut
Joan Bisagno; Stanford University
Ron Blosser; Green River Community College
Loring Brinckerhoff; Educational Testing Service
Connie Chiba; University of California, Berkeley
Aaron Cohen; University of California, Berkeley
Justine Cooper; Eastern Kentucky University
Joanie Friend; Metropolitan Community College
Elizabeth Evans Getzel; Virginia Commonwealth University
Stephanie Gaddy, Lincoln College
Christie L. Gilson; University of Illinois
Sam Goodin; University of Michigan
Wendy S. Harbour; Harvard University
Cheri Hoy; University of Georgia
Charles A. Hughes; The Pennsylvania State University

Kristina Krampe; Eastern Kentucky University
Ruth C. Loew; Educational Testing Service
Pamela Luft; Kent State
Joseph W. Madaus; University of Connecticut
Elaine Manglitz; Calyton College & State University
Joan McGuire; University of Connecticut
Janet Medina; McDaniel College
Deborah Merchant; Windham Southeast Supervisory Union
Ward Newmeyer; Dartmouth College
Christine O’Dell; University of California, Davis
Nicole Ofiesh; California State University, East Bay
David Parker; University of Connecticut
Betty Preus; College of St. Scholastica
Kelly Drew Roberts; University of Hawaii at Manoa
Frank R. Rusch; The Pennsylvania State University
Daniel Ryan; SUNY at Buffalo
Charles Salzberg; Utah State University
Mary Catherine Scheeler; The Pennsylvania State University Green Valley
Sally Scott; Longwood University
Stan Shaw; University of Connecticut
Sharon K. Suritsky; Upper St. Clair School District
Colleen A. Thoma; Virginia Commonwealth University
Susan A. Vogel; Northern Illinois University
Ruth Warick; University of British Columbia
Kristine Webb; University of North Florida
Marc Wilchesky; York University
Practice Brief Review Board
Doris A. Bitler; George Mason University
Melinda S. Burchard; James Madison University
Trey J. Duffy; Cal Poly San Luis Obispo
Alberto Guzman; University of Illinois, Chicago
Andrew Jason Kaiser; St. Ambrose University
Angela S. Mooneyham; University of Alabama, Birmingham
Lori R. Muskat; Georgia School of Professional Psychology, Argosy - Atlanta
Jack Trammell; Randolph-Macon College
Mary Lee Vance; University of Wisconsin, Superior
Margaret P.Weiss; Virginia Tech
The Journal of Postsecondary Education and Disability is available in accessible formats. Please contact AHEAD to discuss accommodation requests. All members of the Association on Higher Education And Disability receive the Journal.
© 2008, The Association on Higher Education And Disability, 107 Commerce Centre Drive #204, Huntersville, NC 28078 USA
AHEAD Board of Directors
Carol Funckes, President; The University of Arizona
Michael Shuttic, President-Elect; Oklahoma State University
L Scott Lissner, Secretary; The Ohio State University
Jim Marks, Treasurer; University of Montana

Stephan J. Hamlin-Smith, Executive Director; AHEAD
Emily Singer, Director; Catholic University of America
Mary Lee Vance, Director; University of Wisconsin - Superior
Kathleen McGillivray, Director; Bethel University
Jose Soto, Director; Southeast Community College
Troy A. Odom, Director; The University of Pennsylvania
Anne Jannarone, Director; University of Arkansas
Jean Ashmore, Director; Rice University
Journal of Postsecondary Education and Disability
Table of ContentsJournal of Postsecondary Education and DisabilityVolume 20, Number 2, 2008(page numbers refer to print version of JPED)
From the Editor 79James Martin
ADHD Rating Scales’ Susceptibility to Faking in a College Student Sample 81 – 92April Bryington FisherMarley W. Watkins
Requesting Accommodation for a Disability: A Telephone Survey of American Medical Schools Committee on Disabilities: Group for the Advancement of Psychiatry 93 – 99William SackJohn GaleSanjay GulatiMichael GuntherRobert NesheimFrederick StoddardRachel St. John
The Effects of Teaching Text-Structure Strategies Postsecondary Students with LearningDisabilities to Improve Their Reading Comprehension on Expository to Science Text Passages100 – 121Stephanie A. GaddyJeffrey P. BakkenBarbara M. Fulk
Practice BriefThe Chronic Illness Initiative: Supporting College Students With Chronic Illness Needs atDePaul University 122 – 127Lynn RoysterOlena Marshall
Book Review 128 - 129Rebecca Daly Cofer
Author Submission Guidelines Inside Back Cover
From the EditorJames Martin
Welcome to JPED’s Volume 20, Number 2 issue. This issue provides three research studies, one innovative Practice Brief, and a book review to stimulate discussion and the generation of improved practice and research. This will be the last JPED volume to contain two issues. Starting with Volume 21, JPED will publish three annual issues, with a new issue arriving in your mail box late spring, another in the fall, and the last will arrive before the end of 2008.
This issue begins with Fisher and Watkins’ study of college students attempting to fake ADHD assessment results. Fisher and Watkins asked college students without a history of ADHD to see if they could fake results after studying ADHD classification criteria. This study raises the interesting possibility that if college students can fake the results of ADHD assessments, these students may unfairly receive accommodations, and may also have the documentation needed to obtain medications for illicit use. Read this paper to discover if students can fake ADHD assessment results.
In the second paper of this issue, The Committee on Disabilities from the Group for the Advancement of Psychiatry lead by William Sack undertook a telephone survey of medical schools to determine the number of medical students requesting accommodations, the type of disability, and subsequent accommodations. They found that 2.3% of the medical students request disability accommodations for attention deficit disorder or learning disabilities. Little data exists on the number of students with disabilities receiving accommodations at our nation’s medical schools. This study will begin to address this important knowledge gap.
Next, Gaddy, Bakken, and Fulk undertook an experimental study to determine the effects of text-structure strategies in improving the reading comprehension of students with disabilities on science text passages. They compared the text structure approach to typical instruction. The text-structure method improved science text reading comprehension results. They end their paper with an interesting discussion suggesting that college students with learning disabilities may benefit from additional reading instruction.
Royster and Marshall’s paper represents the first JPED Practice Brief. Practice Briefs provide a means for disability resource center providers and postsecondary educators to disseminate innovative practical programs and best practice strategies. We hope that the Practice Briefs will serve as an incubator for future research studies. In this paper, Royster and Marshall describe an innovative approach at DePaul University to support college students who have chronic illness.
Last, Rebecca Daly shares with us a review of a book entitled Learning Outside the Lines: Two Ivy League Students with Learning Disabilities and ADHD Give You the Tools for Academic Success and Educational Revolution. We hope her review will inspire you to read this interesting book.
ADHD Rating Scales’ Susceptibility to Faking in a College Student Sample
April Bryington Fisher
Pennsylvania State University
Marley W. Watkins
Arizona State University
Abstract
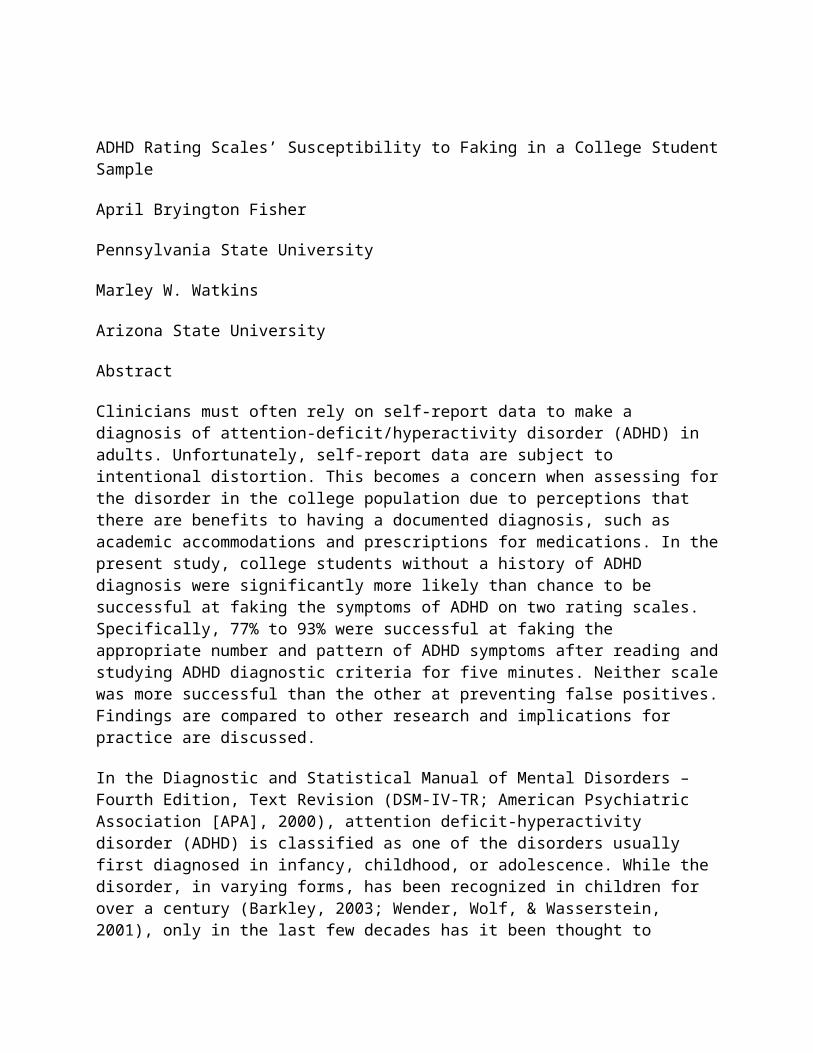
Clinicians must often rely on self-report data to make a diagnosis of attention-deficit/hyperactivity disorder (ADHD) in adults. Unfortunately, self-report data are subject to intentional distortion. This becomes a concern when assessing for the disorder in the college population due to perceptions that there are benefits to having a documented diagnosis, such as academic accommodations and prescriptions for medications. In the present study, college students without a history of ADHD diagnosis were significantly more likely than chance to be successful at faking the symptoms of ADHD on two rating scales. Specifically, 77% to 93% were successful at faking the appropriate number and pattern of ADHD symptoms after reading and studying ADHD diagnostic criteria for five minutes. Neither scale was more successful than the other at preventing false positives. Findings are compared to other research and implications for practice are discussed.
In the Diagnostic and Statistical Manual of Mental Disorders – Fourth Edition, Text Revision (DSM-IV-TR; American Psychiatric Association [APA], 2000), attention deficit-hyperactivity disorder (ADHD) is classified as one of the disorders usually first diagnosed in infancy, childhood, or adolescence. While the disorder, in varying forms, has been recognized in children for over a century (Barkley, 2003; Wender, Wolf, & Wasserstein, 2001), only in the last few decades has it been thought to continue into adulthood. This change in thinking was the result of several longitudinal studies that followed children who had been diagnosed with ADHD into adulthood (Young, 2000).
Identification and treatment of adults with ADHD is important, but the increased awareness of the disorder in adulthood poses difficulties for those who must accurately diagnose it. As Young (2000) cautioned, even though there has been a growing recognition of the disorder in adults, similar progress has not been made in the area of adult ADHD assessment. Further, the number of students seeking accommodations for ADHD in college has increased in recent years
(Glutting, Sheslow, & Adams, 2002). This is a factor because these students may be different from the general population in important ways, including ability level, academic success, and compensatory skill. Consequently, even less is known about the clinical presentation and assessment of ADHD in this population (Glutting, Monaghan, Adams, & Sheslow, 2002).
The diagnosis of ADHD in childhood and the resulting plan for treatment and accommodation is often based on an assessment battery which includes multiple types of assessment measures and data from multiple sources. A wealth of data exists to aid in documenting symptoms of ADHD in children. However, this is not typically the case when documenting symptoms in adults (DeQuiros & Kinsbourne, 2001). Generally, an adult comes to the physician’s or psychologist’s office unaccompanied. School records may no longer be available, and the adult may not have a parent or spouse who can report observations. This leaves the clinician dependent upon the client’s self-reports when documenting symptoms and impairment (DeQuiros & Kinsbourne). Consequently, self-report measures may carry a great deal of weight in making diagnostic decisions.
While self-report measures are easy to use and allow clinicians to objectively determine the severity of ADHD symptoms in comparison to the rater’s peers, they are subject to intentional distortion on the part of the rater (McFarland & Ryan, 2000). This becomes a major concern when assessing for the disorder in the college population because students may perceive that there are benefits to having a documented diagnosis. For example, students with ADHD may receive accommodations such as extra time on tests, alternative exam formats, and a personal tutor (U.S. Department of Education, 2000). Given the emphasis on self-report in the diagnosis of adult ADHD as well as these potential benefits to obtaining a diagnosis, knowledge of the relative ease with answers on self-report scales for ADHD can be faked is important.
Researchers have investigated how the properties of self-report instruments in general may make them more or less susceptible to faking (e.g., McFarland & Ryan, 2000; McFarland, Ryan, & Ellis, 2002). Thus, the properties of the rating scale, such as the transparency of items and item arrangement, have been found to affect the scale’s susceptibility to faking. However, such studies have generally focused on the use of personality measures in employee selection contexts. Less is known about how the properties of behavior rating scales used to diagnose clinical disorders, such as those used in identifying ADHD, affect the ease with which a person can falsify the results.
Quinn (2003) conducted the first published study that specifically looked at whether attempts to malinger could be detected with diagnostic tests for adult ADHD, including the ADHD Behavior Checklist (Murphy & Barkley, 1995), which consists of a list of DSM-IV criteria. Using three groups of undergraduate students, including students with ADHD, a control group, and a group of simulated malingerers who had been told the symptoms of ADHD, Quinn found that the ADHD Behavior Checklist was unable to distinguish between students with ADHD and the malingerers. Both of these groups scored significantly higher than the control group, which was asked to complete the scale honestly. Quinn attempted to create an impairment index to identify those who were malingering by setting a cut score of greater than six inattention symptoms or greater than six hyperactivity symptoms, but correct identification rates were low. Specifically,

13 of the 23 simulated malingerers and 11 of the 16 students with a current diagnosis of ADHD were identified as malingering based on this index.
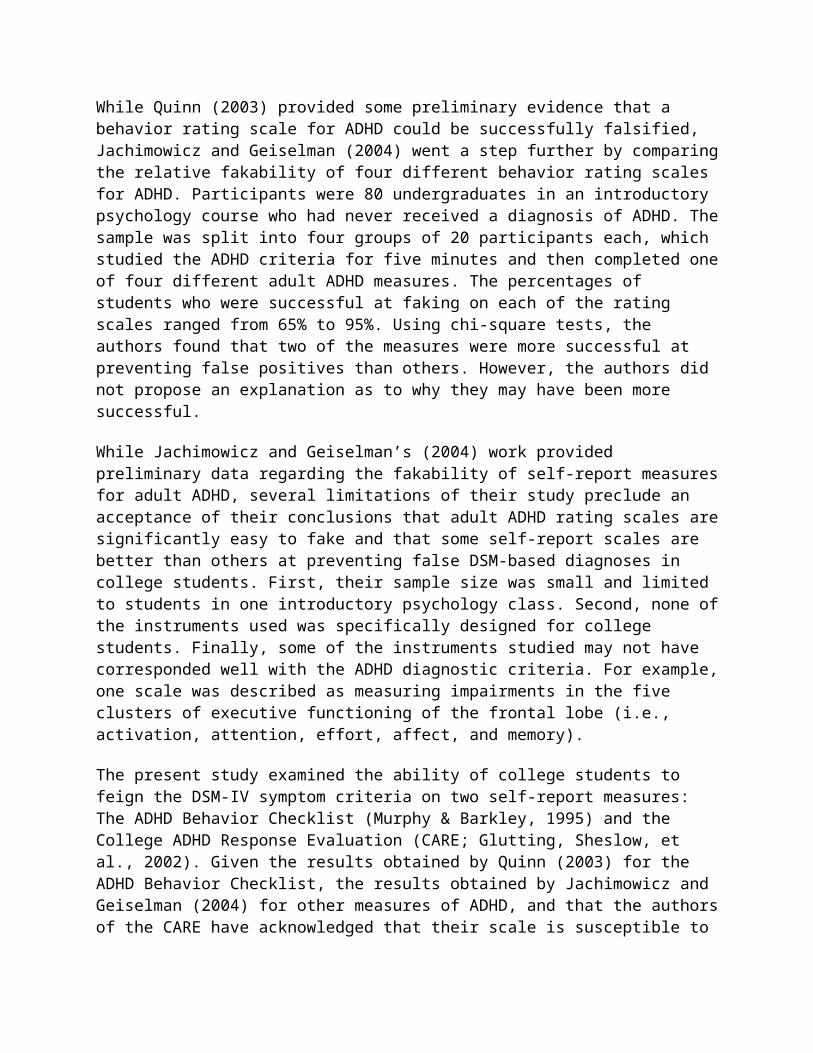
While Quinn (2003) provided some preliminary evidence that a behavior rating scale for ADHD could be successfully falsified, Jachimowicz and Geiselman (2004) went a step further by comparing the relative fakability of four different behavior rating scales for ADHD. Participants were 80 undergraduates in an introductory psychology course who had never received a diagnosis of ADHD. The sample was split into four groups of 20 participants each, which studied the ADHD criteria for five minutes and then completed one of four different adult ADHD measures. The percentages of students who were successful at faking on each of the rating scales ranged from 65% to 95%. Using chi-square tests, the authors found that two of the measures were more successful at preventing false positives than others. However, the authors did not propose an explanation as to why they may have been more successful.
While Jachimowicz and Geiselman’s (2004) work provided preliminary data regarding the fakability of self-report measures for adult ADHD, several limitations of their study preclude an acceptance of their conclusions that adult ADHD rating scales are significantly easy to fake and that some self-report scales are better than others at preventing false DSM-based diagnoses in college students. First, their sample size was small and limited to students in one introductory psychology class. Second, none of the instruments used was specifically designed for college students. Finally, some of the instruments studied may not have corresponded well with the ADHD diagnostic criteria. For example, one scale was described as measuring impairments in the five clusters of executive functioning of the frontal lobe (i.e., activation, attention, effort, affect, and memory).
The present study examined the ability of college students to feign the DSM-IV symptom criteria on two self-report measures: The ADHD Behavior Checklist (Murphy & Barkley, 1995) and the College ADHD Response Evaluation (CARE; Glutting, Sheslow, et al., 2002). Given the results obtained by Quinn (2003) for the ADHD Behavior Checklist, the results obtained by Jachimowicz and Geiselman (2004) for other measures of ADHD, and that the authors of the CARE have acknowledged that their scale is susceptible to faking, it was expected that the proportion of students who met diagnostic criteria in each group would be significantly greater than that expected by chance.
A second area of inquiry for the present study was whether the CARE is more effective at preventing attempts to feign ADHD than the ADHD Behavior Checklist. The factor-based items from the CARE are not included in the DSM-IV criteria, so they may not be as transparent as the DSM-IV items. Therefore, the proportion of students who are able to successfully obtain T scores greater than the recommended cut-off of 70 on the norm-referenced, factor-based scales without simply endorsing all of the items may be lower than the proportion of students who are able to successfully endorse the number of ADHD Behavior Checklist items needed for a DSM-IV diagnosis. However, previous research indicates that the majority of students, and in some cases almost all students, may be able to falsely meet diagnostic criteria on a variety of ADHD measures. Although the item transparency and arrangement of items on the ADHD Behavior Checklist may suggest that the measure is easier to falsify than the CARE, this may not be the case. Consequently, the present study also examined whether the CARE’s factor based scales

and/or DSM-IV scales are less susceptible to faking than the scales of the ADHD Behavior Checklist.
Method
Participants
The sample included data from 189 undergraduate students enrolled in one of two different classes at The Pennsylvania State University. Participants were 37 males (20%) and 152 females (80%) ranging in age from 18 to 35 years (mean age = 19.56 years, SD = 1.97). Self-reported class standing was as follows: freshman (35%), sophomore (46%), junior (14%), senior (4%), other (1%). Class majors were varied, but the most frequently occurring major was education, which was reported by approximately 58% of the sample. The ethnic makeup of the sample was self-reported as follows: Asian American/Pacific Islander (1%), Black/African American (4%), Hispanic/Latino (1%), Native American (1%), White/Caucasian (92%), Other (1%).
Materials
Upon entering a research session, participants received a packet that included scripted instructions, a copy of the DSM-IV-TR criteria for ADHD, and a demographic questionnaire. The demographic questionnaire consisted of items requesting information used to describe the demographics of the sample as well as questions assessing participants’ prior knowledge of ADHD and their history of ADHD and learning problem symptoms and diagnoses. Participants also received either the CARE or the ADHD Behavior Checklist.
ADHD Behavior Checklist. The ADHD Behavior Checklist was chosen because it is simply a list of diagnostic criteria for ADHD. It was constructed by taking the 18 DSM-IV symptoms for ADHD and making slight changes in the wording to make them appropriate for adults. The items alternate inattention symptoms with hyperactivity/impulsivity symptoms. Respondents are to rate the 18 items on a scale of 0 to 3, corresponding to Rarely or Never, Sometimes, Often, and Very Often, respectively. If an item is rated as Often or Very Often, it is considered an endorsement of that symptom. The scales of the ADHD Behavior Checklist include Inattention, Hyper-Impulsive, and Total Score. As originally designed, the ADHD Behavior Checklist is administered twice. First, respondents rate the items based on their experiences with the symptoms between the ages of 6 and 12. Then they rate the items based on their experiences over the past six months. For the present study, students were only asked to rate the items once based on their experiences over the past six months so as to facilitate comparison with the sample taking the CARE.
College ADHD Response Evaluation. The CARE was chosen because it is a measure that was designed for and normed with college students. The CARE assessment system includes both a Parent Response Inventory (PRI) and a Self Response Inventory (SRI), which were co-normed. For the present study, only the self-report scale was used. The authors reported that the CARE’s items came from reviews of the child and adult ADHD literature and their own clinical experience. Over 20 professionals were also interviewed and asked to contribute items. Respondents’ scores can be interpreted in comparison to either the general population (for the
DSM-IV scales) or to a sample of college students (for the DSM-IV scales and the scales based on factor analysis).
The CARE’s 18 DSM-IV items were taken directly from the DSM-IV and are embedded in the overall measure, which consists of 59 items. Respondents rate all items on a 3-point scale by indicating whether they Agree, Disagree, or are Undecided that each item applies to their day-to-day lives. Students are instructed to base their ratings on how typical each description is of their behavior over the last several months. For the DSM-IV scales, items marked Agree count toward a diagnosis of ADHD. For the factor scales, answers correspond to a point value between 0 and 2. Each factor-based scale’s item total can then be transformed into a T score and a percentile. The DSM-IV scales include an Inattention Scale and a Hyperactivity Scale, and the factor-based scales include an Inattention Scale, a Hyperactivity Scale, and an Impulsivity Scale. Data to support the reliability and validity of the CARE’s scores has been reported elsewhere (i.e., Glutting, Sheslow, et al., 2002; Glutting, Youngstrom, & Watkins, 2005).
Procedure
Undergraduate students were recruited from multiple sections of an introductory educational psychology class and a communication arts and sciences class at The Pennsylvania State University. The classes enrolled students from multiple majors and with multiple class standings. The students in these classes were informed of the opportunity to earn extra credit for participating in a study on the assessment of ADHD during their class time. Students who chose to participate attended one of nine data collection sessions held outside of class time.
As the students entered a data collection session, they were given one of two research packets in an alternating order. Each research session was conducted by two of five school psychology doctoral students who were trained on the data collection procedure by the first author. At the beginning of each session, participants were told that the purpose of the study was to examine the susceptibility to faking of different ADHD rating scales. Next, they were informed that participation would involve answering a few questions about themselves, looking at diagnostic criteria, and then completing a rating scale while pretending that they met the criteria. To begin, the session leaders read an overview of the procedure. Next, they asked the students to complete the demographic questionnaire. After the demographic questionnaires were completed, the session leaders read a slightly modified version of a scenario used by Quinn (2003). This scenario asked participants to imagine that they were having trouble in school. The remainder of the scenario described a college student who hears about ADHD on television and then speaks to a friend about the disorder and potential benefits to having the disorder. The college student in the scenario decides to try to obtain a diagnosis of ADHD in order to obtain accommodations in school. Research has indicated that people who are able to successfully feign a mental disorder tend to endorse significantly fewer legitimate symptoms than those who are able to be identified as malingering (Edens, et al., 2001). Consequently, students were warned that one way a professional might detect faking is to look at over-endorsement of symptoms. Therefore, in order to be convincing, they should not simply give every question the highest rating.
Before the students were instructed to turn to the diagnostic criteria page in their research packets, they were offered an incentive for successfully faking ADHD. Specifically, they were
told that surveys that were successfully faked would be entered into a drawing for two $25.00 cash awards. A monetary award was chosen to increase the incentive for successful faking. Because there are strong incentives for someone who desires a false diagnosis of ADHD (e.g., academic accommodations, medication), it was determined that an incentive should be included. Previous studies of malingering and ADHD assessment (e.g., Jachimowicz & Geiselman, 2004; Quinn, 2003) have not used incentives for successful faking. The present study attempted to improve upon previous research by adding an incentive to increase generalizability. However, the small monetary incentives used are clearly not equivalent to the powerful incentives available outside of the research context. Rogers (1997) identified this type of problem as inherent in malingering research. He indicated that “data from research participants may have limited generalizability simply because these individuals trivialized their involvement as a necessary chore (e.g., extra credit for routine participation)” (p. 400). Rogers suggested that one way to manage this issue may be to increase the relevance of the project for the participants by explaining the magnitude of the problem. Based on this recommendation, part of the scripted instructions in the present study included a statement of why the knowledge gained from the study would be relevant to college students.
After the directions were given, the session leaders asked students to turn to the page in their packets that listed the diagnostic criteria for ADHD. The research assistants read the criteria aloud to ensure that all students in the session were informed of the criteria, including those who may have chosen not to read them. Students were then given approximately five minutes to continue to study the criteria independently. Next, they were asked to separate the criteria page from the packet and turn it in to the session leaders so that it was not available while they completed the survey. Students were reminded to independently complete the surveys as if they had experienced these symptoms of ADHD.
Data Analyses
Descriptive statistics for each group’s data were calculated, including the mean scores and standard deviations for each scale. Each scale was then examined to determine whether or not the student met criteria for successful faking. For the ADHD Behavior Checklist, if a student rated six or more symptoms on the Inattention scale and or six or more symptoms on the Hyper-Impulsive scale as Often or Very Often, he or she was considered positive for successful faking. Similarly, if a participant who completed the CARE rated six or more DSM-IV Inattention items and or six or more DSM-IV Hyperactivity symptoms as Agree, he or she was considered positive for successful faking. When analyzing the CARE’s factor scales, students who obtained a cut score of 70 or greater on one or more of the factor scales was considered positive for successful faking. The five participants who simply endorsed all DSM-IV symptom items as Agree, Often, or Very Often were not considered positive for successful faking. For students with missing data (n = 15), surveys were still scored according to the above criteria. It was determined that surveys with some missing data should still be included in the analyses due to the nature of the task. Students who did not complete all of the items may not have been sure how to answer them in order to be successful at faking. This should be reflected in the proportions of each sample that are not successful at faking the characteristics of ADHD.
Results

In order to obtain a sample of students without a history of ADHD diagnosis or treatment, and to learn more about the sample’s knowledge of and experience with ADHD, data from the screening questions were reviewed. The majority of the 189 participants (78%) indicated that they had some knowledge of the symptoms of ADHD. Less than 1% had never heard of ADHD, 8% had heard of ADHD, but did not know specific information about the disorder, another 10% self-reported that they had a thorough understanding of the characteristics of ADHD, and 5% described their knowledge of ADHD as Other.
When the 189 participants were asked whether they had ever sought professional help for problems with attention and/or hyperactivity, 13 participants (7%) answered that they had. Of these, 9 had a self-reported history of ADHD diagnosis, and 4 had sought professional help for symptoms but had not obtained a diagnosis. Finally, one additional participant indicated a diagnosis of ADHD, but no history of seeking treatment. Consequently, 10 participants (5%) indicated a past history of ADHD diagnosis. Of the 179 participants who had never had a formal diagnosis of ADHD, 37 (21%) reported that they have felt as if they may have had the disorder, but had never been formally diagnosed, and 31 of the 179 participants (17%) had previously been told by a friend, parent, teacher, or other acquaintance that they probably had the disorder. Taken together, 47 participants (26%) out of the 179 who had no formal diagnosis of ADHD had (a) sought help for ADHD, (b) had thought they might have the disorder, or (c) had been told by another person that they probably had ADHD. Of all 189 participants, 30 (16%) had an immediate family member who had been diagnosed with ADHD. The screening questions for learning disabilities indicated that 9 of the 189 participants (5%) had previously sought professional help for learning disabilities. Three participants (1.5%) had been formally diagnosed with a learning disability.
Removing the data from the 14 participants (4 males, 10 females) who had previously sought professional help for and/or who had received a diagnosis of ADHD resulted in a sample of 175. Among these students, 88 completed the CARE and 87 completed the ADHD Behavior Checklist. The mean number of inattention symptoms reported on the ADHD Behavior Checklist was 5.8 (SD = 2.4), and the mean number of hyperactive/impulsive symptoms was 5.1 (SD = 2.6). On the CARE, the mean number of diagnostic inattention symptoms was 5.7 (SD = 2.1), and the mean number of diagnostic hyperactive/impulsive symptoms was 5.7 (SD = 2.2). For the CARE factor-based scales, the mean scores obtained in the present study were, on average, about 30 points higher than the mean scores reported for the CARE standardization sample (Glutting, Sheslow, et al., 2002). Mean scores ranged from 73.5 (SD = 17.8) for the Hyperactivity scale to 88.7 (SD = 11.6) for the Inattention scale.
Success at Faking
Of the 88 participants without a history of ADHD who completed the CARE, 82 (93%) were determined to have met the pre-determined criteria for successful faking based on one or more of the four factor-based scores (i.e., Inattention, Hyperactivity, Impulsivity, Total). Of the same 88 participants, 61 (69%) were determined to be successful at faking based on answers to the DSM-IV items. Of the 87 students who completed the ADHD Behavior Checklist, 67 (77%) were considered positive for successful faking after the rating scales were scored.

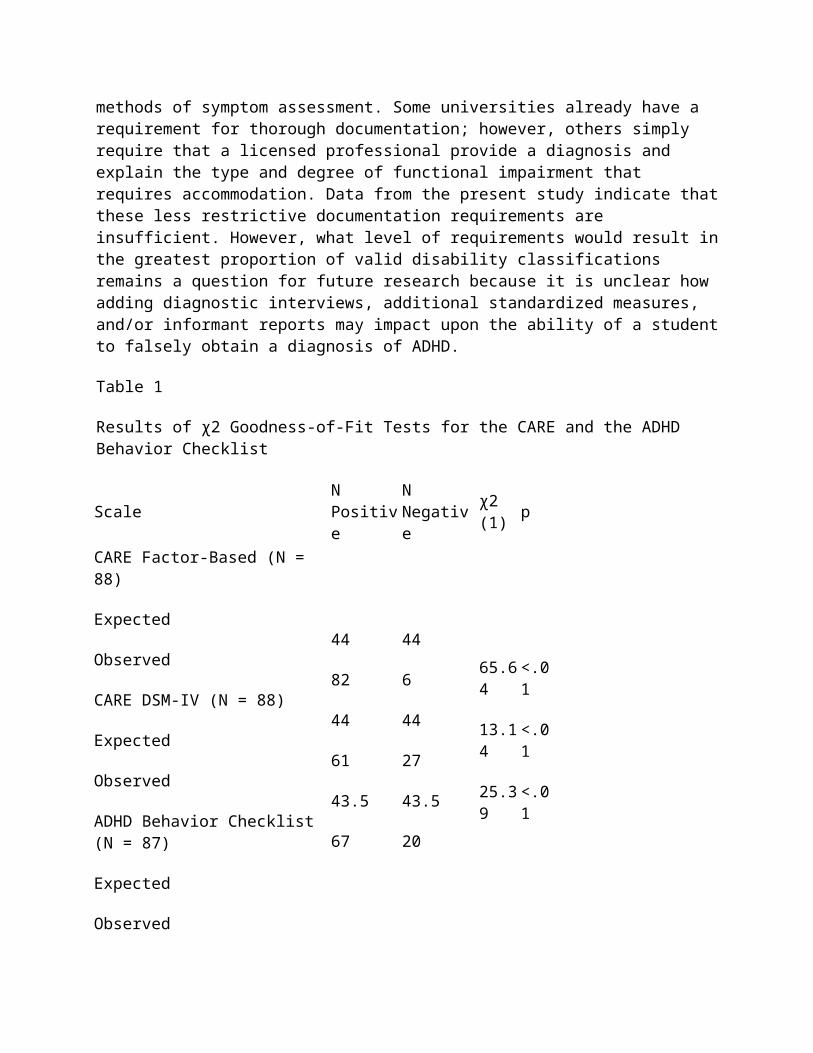
To test whether the proportion of students in each sample who met criteria for ADHD was significantly greater than chance, chi-square goodness-of-fit tests were conducted. Results indicated that the participants who had no self-reported history of seeking professional help for or of having a diagnosis of ADHD were significantly more likely to be successful at faking responses on an ADHD rating scale than would be expected by chance. This conclusion was observed for responses on the CARE factor-based scales, the CARE DSM-IV items, and the ADHD Behavior Checklist scales. Results of the chi-square goodness-of-fit tests are summarized in Table 1.
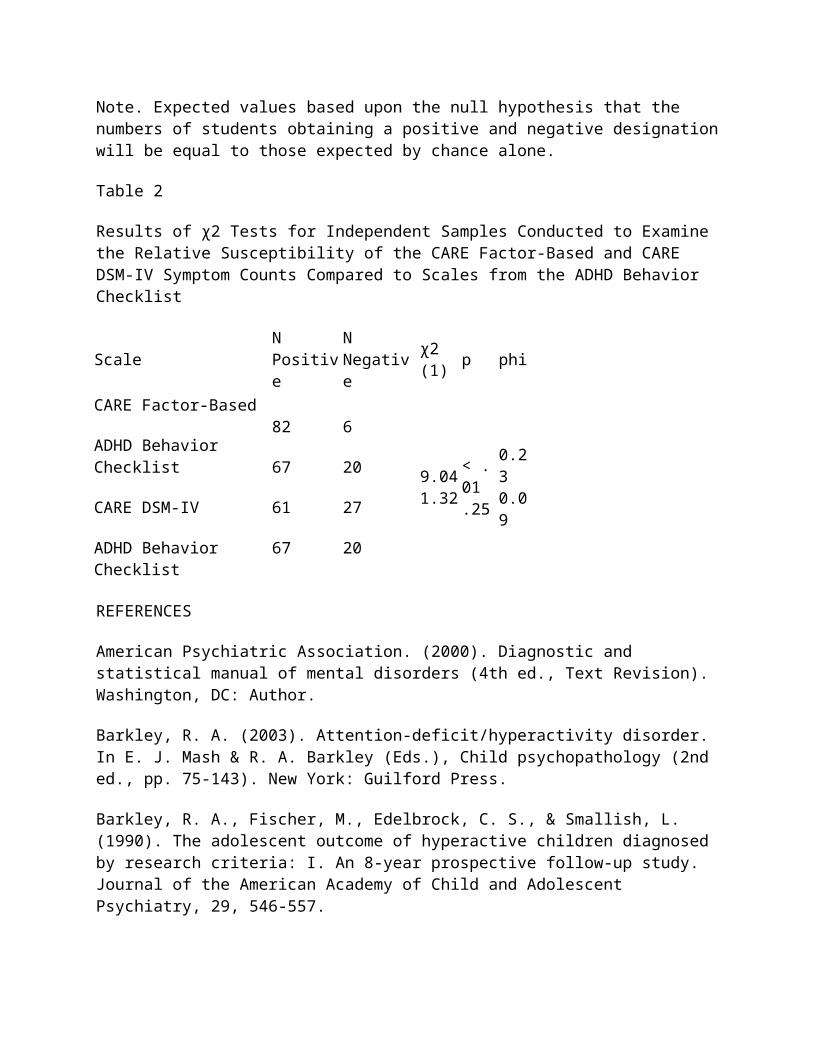
To test the association between a particular rating scale and the frequency of ADHD diagnosis, 2 (CARE, ADHD Behavior Checklist) x 2 (Positive, Negative for successful faking) chi-square tests for independent samples were conducted. The test was conducted twice, first using the CARE factor-based scales and then using the CARE DSM-IV symptom counts as the basis for determining whether participants were considered positive or negative for successful faking. Results indicated that there was no significant difference in success rate for faking when comparing the responses on the ADHD Behavior Checklist and the responses on the CARE DSM-IV scales. However, a significant difference was found for responses on the CARE factor-based scales when compared to responses on the ADHD Behavior Checklist. That is, participants whose responses on the CARE factor-based scales served as the basis for determining success at faking were significantly more likely to be designated as successful than the participants whose scores on the ADHD Behavior Checklist were examined. Results of these two chi-square tests are summarized in Table 2.
The chi-square analyses were repeated for the 128 participants who reported that they (a) had never sought help for or acquired a diagnosis of an attention or learning disorder, (b) had never felt as if they had ADHD, and (c) had never been told by someone they knew that they probably had the disorder. Results remained similar to those obtained for the sample that only excluded participants with a history of seeking treatment for or a diagnosis of ADHD. No different conclusions were reached with the more restrictive screening sample.
Discussion
Rating Scales’ Susceptibility to Faking
The results of the preceding analyses indicate that both the ADHD Behavior Checklist and the CARE are susceptible to attempts by college students to feign the symptoms of ADHD. Thus, large proportions of students without histories of attention or hyperactivity problems were able to meet the pre-specified criteria for testing positive for ADHD on three different measures after reading and studying ADHD diagnostic criteria for five minutes. Approximately 77% of students who completed the ADHD Behavior Checklist and 93% of students who completed the CARE were successful at attempting to fake the appropriate number and pattern of ADHD symptoms to test positive. Despite having screened the sample for histories of seeking treatment for and/or having a diagnosis of ADHD, more participants were able to fake their answers than would have been expected by chance.

Furthermore, the degree of item transparency and the organization of items on the CARE did not make the measure less susceptible to attempts at faking ADHD symptoms. Chi-square tests of independence indicated that the CARE DSM items and the scales of the ADHD Behavior Checklist were similarly easy to fake. About 77% of participants who completed the ADHD Behavior Checklist were successful at faking, whereas 69% of participants who completed the CARE were successful at faking when their DSM-IV items were considered. However, additional chi-square analyses indicate that there was a significant difference in susceptibility to faking when the CARE factor-based scales and the ADHD Behavior Checklist scales were compared. Based on percentages of positive diagnoses, it appears that the CARE factor-based scales are more susceptible to faking attempts than the scales of the ADHD Behavior Checklist.
Data from the standardization sample of the CARE (Glutting, Sheslow, et al., 2002), provide some insight into why a greater percentage of students may have been able to fake their answers on the CARE factor-based scales. In the standardization sample, a cut score of 6 or more symptoms of inattention and/or hyperactivity led to positive ADHD identification for 2.1% of the 1,080 students. However, a cut score of 70 or greater on one or more factor-based scales positively identified 18% of the standardization sample, indicating that even in a normative sample comprised of honest responders, a student is almost nine times more likely to obtain a positive designation for ADHD when the factor-based scores are interpreted. In addition to this consideration, the comparative ease with which a person could obtain high scores on the CARE factor scales should be noted as well. Whereas meeting DSM-IV criteria requires knowledge of the particular diagnostic symptoms and pattern of those symptoms, obtaining high factor scores simply requires one to be able to distinguish which symptoms appear to be measuring inattention and/or hyperactivity and provide high ratings on those items.
Comparison and Contribution to the Existing Literature
The results of the present study both support and expand upon the published literature. For example, the percentages of participants who were successful at faking (ranging from 69% to 93%) were similar to those reported by Jachimowicz and Geiselman (2004), who found successful faking rates ranging from 65% to 95% on four different ADHD rating scales when using samples of 20 students. It expanded upon previously published studies by including a larger sample of students from varying majors and class standings than what has been used to study ADHD rating scales’ susceptibility to faking in the past. Furthermore, it demonstrated that even a measure designed specifically for assessment of ADHD in college students is susceptible to faking in this population – both when scores on factor-based scales and DSM-IV diagnostic criteria are used as the basis for determining whether a participant is successful at faking. Making an additional contribution to the literature, the present study included results for samples based on two sets of screening criteria.
The high percentage of individuals who are able to falsely meet diagnostic criteria based on a rating scale is not unique to ADHD. Researchers have found similarly high or even higher rates of successful faking of psychiatric disorder symptoms on rating scales for other conditions. For example, Lees-Haley and Dunn (1994) reported that 96.9% of their samples of introductory psychology students were able to meet diagnostic criteria for major depression on a symptom checklist, even though they were not provided with any specific information about the disorder.
Similarly, 96.9% of their sample was able to meet criteria for generalized anxiety disorder, 86% were able to meet criteria for posttraumatic stress disorder, and 63.3% were able to select at least 5 of 10 criteria for mild brain injury. The authors noted that for all of these disorders, self-report information is needed to make a diagnosis. However, symptom checklists can be of such a leading nature that even individuals who have common knowledge of psychiatric disorders can pick out the symptoms needed to obtain a diagnosis. Consequently, it appears that susceptibility to faking is a characteristic of many conditions that rely upon self-reported information to make a diagnosis, as opposed to solely being characteristic of ADHD.
Mediators of Success
It was expected that a high percentage of students would be able to falsely meet criteria for ADHD based on their responses to a rating scale. However, it is somewhat surprising that not all of the students were successful, given the seemingly easy nature of the task. One potential mediator could be motivation. If participants were not motivated by the monetary incentive or the appeal to help make disability guidelines more restrictive, they may have chosen not to study the ADHD criteria and/or to carefully consider their answers to the rating scale. However, other research suggests that some individual characteristics and personality differences may also affect the validity of self-reports. For example, a study of self-reported grade-point averages (GPA), found that students with lower grades and lower ability levels were more likely to misrepresent their grades, even though there was no obvious incentive for doing so (Kuncel, Credé, & Thomas, 2005). Kuncel et al. also reviewed research that suggested personality variables, such as a tendency to self-monitor in order to manage the impression others receive, may affect the validity of self-reported grades. Similarly, Book, Holden, Starzyk, Wasylkiw, and Edwards’ (2006) research suggests personality differences could affect success at malingering. Specifically, they found that introductory psychology students who scored higher on a measure of psychopathy were less likely to be detected as faking well on a measure of psychological disorders than those who had lower psychopathy scores. However, this relationship was not present for faking poorly, which would be a situation similar to the one being studied in the present analysis. Overall, it is unclear which factors prevented some students from successfully faking diagnostic criteria of ADHD, but motivation and individual differences may have served as mediators.
Scale Characteristics
Descriptive statistics of each scale were calculated in order to compare the properties of the falsified scale responses to those of responses provided in other research. As noted by comparing the present study’s results to those of Quinn (2003), the obtained mean scores on the ADHD Behavior Checklist fall in a range similar to those obtained from both her ADHD group and from the group that was asked to fake their responses, adding further support to Quinn’s conclusion that ADHD rating scales cannot discriminate students who are deliberately faking their responses from those with a valid diagnosis of ADHD.
On average, the mean CARE T scores obtained in the present study were almost 30 points higher than the mean scores obtained from the CARE’s standardization sample. Given the degree to which CARE scores were higher for the current sample, it was questioned whether or not an
“impairment index” such as that tested by Quinn (2003) for the ADHD Behavior Checklist might have sufficient sensitivity and specificity to be of use in the detection of malingering. To adequately test such an index, the inclusion of a sample with ADHD would be needed. However, it is unlikely that such an index would have the clinical utility necessary to discriminate between individuals with ADHD and those who are malingering. One reason is that some students who are true positives for ADHD would obtain very high T scores on the CARE. For example, 2.4% of the CARE’s standardization sample obtained T scores greater than or equal to 85 (Glutting, Sheslow, et al., 2002). Consequently, high scores alone do not help detect false positives. Furthermore, when individuals have been coached on information about the disorder they are trying to feign as well as on characteristics of the scales that may help a clinician detect faking well or faking poorly (i.e., validity scales), their scores tend to become less susceptible to detection (Berry, Baer, Rinaldo, & Wetter, 2002; Lamb, Berry, Wetter, & Baer, 1994). Finally, because the base rate of malingering in various contexts is unknown, the positive and negative predictive power of a “sign” for detection of malingering on a rating scale is also unknown (Faust, Hart, & Guilmette, 1988).
Implications for Adult ADHD Criteria and Assessment
As part of the screening questions used in the present study, participants were asked whether they had ever felt as if they had ADHD and if they had ever been told that they probably had the disorder by a family member or friend. As reported previously, 26% of the participants who had never been formally diagnosed with ADHD had sought help for ADHD, had thought they might have the disorder, or had been told by another person that they probably had ADHD. This suggests that about a quarter of the sample may have been valid referrals for an ADHD evaluation. This is not entirely unexpected given the nature of ADHD symptoms. The symptoms are not qualitatively different from experiences most people have. Rather, it is the severity and frequency of symptoms that characterize the problem as a disorder. The nature of this distinction may not be clear to the general population. However, it may also cause some concern regarding the validity of the disorder, as defined, in adults.
Currently, information in the literature both supports the validity of ADHD as a disorder that can be experienced by adults and calls into question the criteria used to define the disorder. Several longitudinal studies and studies of parents of children with ADHD (e.g., Barkley, Fischer, Edelbrock, & Smallish, 1990; Barkley, Fischer, Smallish, & Fletcher, 2006; Biederman et al., 1996; Biederman et al., 2006; Mannuzza et al., 1991; McGough et al., 2005; Weiss, Hechtman, Milroy, & Perlman, 1985) have demonstrated that ADHD symptoms can be impairing into adulthood and that the presence of the disorder is often comorbid with many other psychiatric conditions, such as depression, anxiety disorders, and externalizing behavior disorders. However, there is also consistent concern over using diagnostic criteria that were validated with a sample of children and adolescents to diagnose the condition in adulthood. Several researchers have called for a reduction in the number of criteria needed to be diagnosed with the disorder, most noting that four symptoms are sufficient to identify a subgroup that is substantially different from the norm (e.g., Kooij, et al., 2005; McGough & Barkley, 2004; Murphy & Barkley, 1996; Riccio, et al., 2005). Others have noted that a refinement of the criteria is needed because the current DSM-IV symptoms are insensitive to the characteristics of adult lifestyles (Faraone, Biederman, & Mick, 2005; McGough & Barkley; Riccio et al., 2005)
In conclusion, it appears that certain behavioral correlates support the impairing nature of adulthood ADHD. However, there is also consensus in the literature that the criteria for adult ADHD are in need of refinement. Taken together, this information adds further support for the need for in-depth assessment that goes beyond the use of a self-report scale and considers the impact symptoms have on a person’s ability to work and learn.
Limitations and Future Research
The participants in this study differed from those who may try to malinger in several important ways. Most notably, they were only offered a small incentive, and were given only five minutes to study the diagnostic criteria for ADHD. Individuals who attempt to obtain a diagnosis on the basis of false self-reports are likely to have strong motivation for doing so, such as a perceived need to obtain accommodations or a desire to obtain medications. Additionally, such individuals would be free to spend as much time as they wanted researching the disorder in order to be able to give a convincing presentation. Although not including a sample more representative of persons who would feign ADHD symptoms represents a limitation, the results are likely an underestimate, rather than an overestimate, of the percentage of college students who, with sufficient time and motivation, could falsely obtain a diagnosis of ADHD based on self-reports on a rating scale.
A related limitation is that it is unclear how carefully the participants tried to feign the symptoms of ADHD as they were completing the rating scales. Anecdotally, it was noted that many of the participants finished their rating scales quickly and did not use all of the available 15 minutes to consider their answers. A motivated malingerer is most likely willing to spend more time carefully considering his or her answers. However, even without careful consideration, the majority of the participants were able to successfully fake criteria so, again, it is likely that this limitation led to an underestimate of the percentage of college students who would be able to obtain a false diagnosis of ADHD if motivated to do so.
An additional limitation is that the sample was less representative of a general college population than expected. Although the sample reflected the gender make-up of the classes from which students were recruited, it did not reflect the gender balance of the general college student population. A more equitable gender distribution may have allowed for additional information regarding whether males and females are similarly successful at faking, and whether males and females have different success rates at faking the various ADHD subtypes.
Using a warning to not endorse all items to avoid detection may also have affected the results. The decision to use a warning was based on malingering research (e.g., Edens et al., 2001; Rogers, 1997). The warning was meant to serve as a way of encouraging participants to use a strategy to be successful at the task that did not involve simply endorsing every item. However, if no warning were included, more of the participants may have endorsed every diagnostic symptom item , which may have increase the likelihood of being detected as malingering in a clinical situation.
Finally, the study is limited in that it only examined the susceptibility to faking of ADHD rating scales. Although the present findings, in conjunction with previously published results, provide
strong support that rating scales alone are insufficient for making reliable and valid diagnoses of ADHD in college students, it does not provide information that may be used to support detailed guidelines for ADHD documentation. It remains unclear which assessment methods, in which combinations, lead to a valid group of college students whose ADHD symptoms are predictive of dysfunction without accommodation and treatment. Future research should examine the susceptibility to faking of different types of assessments in conjunction. For example, studies could examine whether students would be successful at faking, and indistinguishable from true cases of ADHD, if a battery of assessment methods, possibly including self-reports, observer reports, objective measures of attention and discrimination, psycho-educational assessments, and a thorough diagnostic interview, were used. This type of research would provide additional information for those who write documentation guidelines for determination of disabilities in postsecondary institutions.
Conclusion
The participants who were successful at faking the diagnostic criteria for ADHD had a small incentive and very brief amounts of time to study criteria. The results suggest that a college student with very strong motivation to obtain accommodations and enough time to carefully study the symptoms of the disorder, using Internet and library resources, would have little trouble at meeting the criteria for and obtaining a diagnosis of ADHD if the diagnosis were primarily based upon self-report data from rating scales. This finding provides sufficient data to conclude that diagnoses should not be based solely on rating scale data, and consequently, that documentation guidelines at postsecondary institutions should consistently require multiple sources and/or methods of symptom assessment. Some universities already have a requirement for thorough documentation; however, others simply require that a licensed professional provide a diagnosis and explain the type and degree of functional impairment that requires accommodation. Data from the present study indicate that these less restrictive documentation requirements are insufficient. However, what level of requirements would result in the greatest proportion of valid disability classifications remains a question for future research because it is unclear how adding diagnostic interviews, additional standardized measures, and/or informant reports may impact upon the ability of a student to falsely obtain a diagnosis of ADHD.
Table 1
Results of χ2 Goodness-of-Fit Tests for the CARE and the ADHD Behavior Checklist
Scale N Positive N Negative χ2 (1) pCARE Factor-Based (N = 88)
Expected
Observed
CARE DSM-IV (N = 88)
44
82
44
61
44
6
44
27
65.64
13.14
25.39
<.01
<.01
<.01
Expected
Observed
ADHD Behavior Checklist (N = 87)
Expected
Observed
43.5
67
43.5
20
Note. Expected values based upon the null hypothesis that the numbers of students obtaining a positive and negative designation will be equal to those expected by chance alone.
Table 2
Results of χ2 Tests for Independent Samples Conducted to Examine the Relative Susceptibility of the CARE Factor-Based and CARE DSM-IV Symptom Counts Compared to Scales from the ADHD Behavior Checklist
Scale N Positive N Negative χ2 (1) p phiCARE Factor-Based
ADHD Behavior Checklist
CARE DSM-IV
ADHD Behavior Checklist
82
67
61
67
6
20
27
20
9.041.32
< .01.25
0.230.09
REFERENCES
American Psychiatric Association. (2000). Diagnostic and statistical manual of mental disorders (4th ed., Text Revision). Washington, DC: Author.
Barkley, R. A. (2003). Attention-deficit/hyperactivity disorder. In E. J. Mash & R. A. Barkley (Eds.), Child psychopathology (2nd ed., pp. 75-143). New York: Guilford Press.
Barkley, R. A., Fischer, M., Edelbrock, C. S., & Smallish, L. (1990). The adolescent outcome of hyperactive children diagnosed by research criteria: I. An 8-year prospective follow-up study. Journal of the American Academy of Child and Adolescent Psychiatry, 29, 546-557.
Barkley, R. A., Fischer, M., Smallish, L., & Fletcher, K. (2006). Young adult outcome of hyperactive children: Adaptive functioning in major life activities. Journal of the American Academy of Child and Adolescent Psychiatry, 45, 192-202.

Berry, D.T.R., Baer, R. A., Rinaldo, J. C., & Wetter, M. W. (2002). Assessment of malingering. In J. N. Butcher (Ed.), Clinical personality assessment: Practical approaches (2nd ed., pp. 269-302). New York: Oxford University Press.
Biederman, J., Faraone, S., Milberger, S., Curtis, S., Chen, L., Marrs, A., et al. (1996). Predictors of persistence and remission of ADHD into adolescence: Results from a four-year prospective follow-up study. Journal of the American Academy of Child and Adolescent Psychiatry, 35, 343-351.
Biederman, J., Monuteaux, M. C., Mick, E., Spencer, T., Wilens, T. E., Silva, J. M., et al. (2006). Young adult outcome of attention deficit hyperactivity disorder: A controlled 10-year follow-up study. Psychological Medicine, 36, 167-179.
Book, A. S., Holden, R. R., Starzyk, K. B., Wasylkiw, L., & Edwards, M. J. (2006). Psychopathic traits and experimentally induced deception in self-report assessment. Personality and Individual Differences, 41, 601-608.
DeQuiros, G. B., & Kinsbourne, M. (2001). Adult ADHD: Analysis of self-ratings on a behavior questionnaire. In J. Wasserstein, L. E. Wolf, & F. F. Lefever (Eds.), Adult attention deficit disorder: Brain mechanisms and life outcomes (pp. 140-147). New York: New York Academy of Sciences.
Edens, J. F., Guy, L. S., Otto, R. K., Buffington, J. K., Tomicic, T. L., & Poythress, N. G. (2001). Factors differentiating successful versus unsuccessful malingerers. Journal of Personality Assessment, 77, 333-338.
Faraone, S. V., Biederman, J., & Mick, E. (2005). The age-dependent decline of attention deficit hyperactivity disorder: A meta-analysis of follow-up studies. Psychological Medicine, 35, 1-7.
Faust, D., Hart, K., & Guilmette, T. J. (1988). Pediatric malingering: The capacity of children to fake believable deficits on neuropsychological testing. Journal of Consulting and Clinical Psychology, 56, 578-582.
Glutting, J.J., Monaghan, M. C., Adams, W., & Sheslow, D. (2002). Some psychometric properties of a system to measure ADHD among college students: Factor pattern, reliability, and one-year predictive validity. Measurement and Evaluation in Counseling and Development, 34, 194-207.
Glutting, J. J., Sheslow, D., & Adams, W. (2002). CARE: College ADHD response evaluation manual. Wilmington, DE: Wide Range.
Glutting, J. J., Youngstrom, E. A., & Watkins, M. W. (2005). ADHD and college students: Exploratory and confirmatory factor structures with student and parent data. Psychological Assessment, 17, 44-55.
Jachimowicz, G., & Geiselman, R. E. (2004). Comparison of ease of falsification of attention deficit hyperactivity disorder diagnosis using standard behavioral rating scales. Cognitive Science Online, 2, 6-20. Retrieved February 15, 2005, from http://cogsci-online.ucsd.edu/2/2-1.pdf
Kooij, J.J.S., Buitelaar, J. K., van den Oord, E. J., Furer, J. W., Rijnders, C. A., & Hodiamont, P. P. G. (2005). Internal and external validity of attention-deficit hyperactivity disorder in a population-based sample of adults. Psychological Medicine, 35, 817-827.
Kuncel, N. R., Credé, M., & Thomas, L. L. (2005). The validity of self-reported grade point averages, class ranks, and test scores: A meta-analysis and review of the literature. Review of Educational Research, 75, 63-82.
Lamb, D. G., Berry, D.T.R., Wetter, M. W., & Baer, R. A. (1994). Effects of two types of information on malingering of closed head injury on the MMPI-2: An analog investigation. Psychological Assessment, 6, 8-13.
Lees-Haley, P. R., & Dunn, J. T. (1994). The ability of naive subjects to report symptoms of mild brain injury, post-traumatic stress disorder, major depression, and generalized anxiety disorder. Journal of Clinical Psychology, 50, 252-256.
Mannuzza, S., Klein, R. G., Bonagura, N., Malloy, P., Giampino, T. L., & Addalli, K. A. (1991). Hyperactive boys almost grown up V. Replication of psychiatric status. Archives of General Psychiatry, 48, 77-83.
McFarland, L. A., & Ryan, A. M. (2000). Variance in faking across non-cognitive measures. Journal of Applied Psychology, 85, 812-821.
McFarland, L. A., Ryan, A. M., & Ellis, A. (2002). Item placement on a personality measure: Effects of faking behavior and test measurement properties. Journal of Personality Assessment, 78, 348-369.
McGough, J. J. & Barkley, R. A. (2004). Diagnostic controversies in adult attention deficit hyperactivity disorder. American Journal of Psychiatry, 161, 1948-1956.
McGough, J. J., Smalley, S. L., McCracken, J. T., Yang, M., Del’Homme, M., Lynn, D. E., et al. (2005). Psychiatric comorbidity in adult attention deficit hyperactivity disorder: Findings from multiplex families. American Journal of Psychiatry, 162, 1621-1627.
Murphy, K., & Barkley, R. A. (1995). Preliminary normative data on DSM-IV criteria for adults. The ADHD Report, 3(3), 6-7, 16.
Murphy, K., & Barkley, R. A. (1996). Prevalence of DSM-IV symptoms of ADHD in adult licensed drivers: Implications for clinical diagnosis. Journal of Attention Disorders, 1, 147-161.
Quinn, C. (2003). Detection of malingering in assessment of adult ADHD. Archives of Clinical Neuropsychology, 18, 379-395.
Riccio, C. A., Wolfe, M., Davis, B., Romine, C., George, C., & Lee, D. (2005). Attention deficit hyperactivity disorder: Manifestation in adulthood. Archives of Clinical Neuropsychology, 20, 249-269.
Rogers, R. (1997). Researching dissimulation. In R. Rogers (Ed.), Clinical assessment of malingering and deception (2nd ed., pp. 398-426). New York: Guilford Press.
U.S. Department of Education, National Center for Educational Statistics (2000). Postsecondary students with disabilities: Enrollment, services, and persistence. (NCES No. 2000-092). Washington, DC: Author.
Weiss, G., Hechtman, L., Milroy, T., & Perlman, T. (1985). Psychiatric status of hyperactives as adults: A controlled prospective 15-year follow-up of 63 hyperactive children. Journal of the American Academy of Child Psychiatry, 24, 211-220.
Wender, P. H., Wolf, L. E., & Wasserstein, J. (2001). Adults with ADHD: An overview. In J. Wasserstein, L. E. Wolf, & F. F. Lefever (Eds.), Adult attention deficit disorder: Brain mechanisms and life outcomes (pp. 1-16). New York: New York Academy of Sciences.
Young, S. (2000). ADHA children grown-up: An empirical review. Counseling Psychology Quarterly, 13, 191-200.
About the Authors
April Bryington Fisher, Ph.D. is a school psychologist for the Quakertown Community School District in Pennsylvania. She received her Ph.D. in school psychology from The Pennsylvania State University. She can be reached via email at [email protected]
Marley W. Watkins, Ph.D. is Training Director and Professor in the School Psychology Program at Arizona State University. He received his Ph.D. in school psychology from the University of Nebraska-Lincoln and is a Diplomate of the American Board of Professional Psychology. He can be reached via email at [email protected]
Authors Notes
The authors wish to thank Julie Fitzgerald, Miranda Freberg, Erin Meyer, Erin Reid, and Melissa Reid for assistance in data collection as well as Barbara Schaefer, Rayne Sperling, and Brian Rabian for their helpful critique during the design and completion of the project. A version of this paper was previously reported as the first Author’s doctoral dissertation.
Requesting Accommodation for a Disability:
A Telephone Survey of American Medical Schools
Committee on Disabilities:
Group for the Advancement of Psychiatry
William Sack, M.D.
John Gale, M.D.
Sanjay Gulati, M.D.
Michael Gunther, M.D.
Robert Nesheim, M.D.
Frederick Stoddard, M.D.
Rachel St. John, M.D.
Abstract
Members of the committee on disabilities of the Group for the Advancement of Psychiatry (GAP) contacted 107 of 126 American Medical Schools to determine the number of students requesting accommodation for a disability, the time at which the request was made, the type of disability, and the type of accommodation offered. The survey determined that 2.3% of medical students request accommodation for disabilities that are overwhelmingly cognitive in nature. Accommodations offered usually consist of extra time and/or a quiet room for examinations. Many medical students make accommodation requests only after experiencing the heavy demands of the first two years of the curriculum.
Since 1973, American medical schools that receive any federal funding have been required by Section 504 of the Rehabilitation Act to provide protection to individuals with disabilities in eight areas of service. With the passage of the Americans with Disabilities Act (ADA) in 1990 and its implementation in 1992, protections for persons with disabilities in institutions of higher learning were more specifically described by Essex-Sarbie (1994).
A college of medicine must provide reasonable accommodation for known physical or mental limitations of qualified individuals, unless the college can demonstrate that doing so would impose undue hardship on its operation. Reasonable accommodation must be extended to individuals with disabilities after they are admitted, regardless of whether the disabilities were present before the admission or occurred after the admission. The level of accommodation must be determined on a case-by-case basis and varies according to the student’s disability and limitation (Essex-Sarbie, 1994).
The Committee on Disabilities of the Group for the Advancement of Psychiatry (GAP) undertook a review of the literature regarding medical students with a reported disability. It was learned that such data are much more available on college students with learning disorders than
on graduate students or medical students. For instance, learning disabilities are the most common disability on undergraduate campuses (Cohen, 1983) making up 3%-6% of the population of college students and more than 90% of the population of college students with any form of disability (Cox & Klans, 1996; Hippolitus, 1987).
In graduate schools, the database is much more scanty. Parks et al. (1992) investigated one dental school population and reported that 5% of the sample had self-disclosed a disability. Runyan and Smith (1991) cited data on the incidence of learning disabilities in law schools and found only 0.5% having self-identified as having such a disability. In nursing graduate programs, Watson (1995) found that 45% of the 247 nursing programs that returned his survey indicated that they had admitted new students with disabilities for that academic year.
Regarding medical students, two general surveys of medical students with disabilities focused primarily on physical disabilities and were performed over a decade ago (Wainapel, 1987; Wu, Tsand, & Wainapel, 1996). In one medical school, Walters and Croen (1993) reported that from 1% to 2% of the students in each class were referred for evaluation for a learning disability. Moreover, requests for accommodation for taking the medical college admissions test grew from 69 in 1985 to 330 in 1993 (Kayes, 1993).
Our committee reviewed current technical standards for admission to U.S. medical schools preliminary to undertaking this survey and in light of ADA legislation. A sizeable majority (87%) of medical schools had language that addressed applicants with a disability (St. John et al., 2002, unpublished manuscript). Faigel (1998) conducted a survey of US and Canadian medical schools to determine changes in the admission policies of and services offered between 1991 and 1997. He concluded that medical schools had improved their services for students with learning disabilities in response to ADA legislation; yet, many questions about medical students with disabilities remained.
GAP is an organization devoted to the study and exploration of current issues in psychiatry through a variety of specific committees. The committee on Disabilities, which conducted the current survey, had previously explored issues such as office practices in caring for patients with hearing impairments (The Committee on Disabilities, 1997) and the psychosocial experiences of caregivers managing patients who experienced catastrophic physical injury (The Committee on Disabilities, 1992). The purpose of the present study was to identify information about students with disabilities who attend medical schools. Specifically, questions were: How many students with disabilities were now seeking an accommodation for a disability? What types of accommodations were being offered? And When were students making their requests for such an accommodation?
Methods
Sample
The sample consisted of the 126 medical schools listed in the Directory of American Medical Schools.
Procedures
The committee developed a brief interview format in which four questions were posed: (a) Can you estimate the number of medical students each year who request some form of accommodation for a disability? (b) What types of disabilities are most frequently reported? (c) What types of accommodation are offered? and (d) When are students most likely to make these requests- at admission or sometime later in their medical school experience? Four of the six committee members conducted the telephone interviews and the responses to these questions were recorded on a standard format.
The committee developed the interview protocol over the course of a year as it deliberated on the most efficient way to gather the relevant information in a brief telephone survey. Much of the interviewers’ time was spent in finding the appropriate person to respond to the questions. Each committee member initially requested to speak to the school’s ADA offices. In practice, interviewers were usually referred to the office of student affairs, and the respondent was often an assistant dean for student affairs. Almost all but a handful of schools responded that they did have a designated ADA officer. In medical schools closely connected to an undergraduate campus, the interviewers were then referred to the campus office of disabilities. Usually, several phone calls were required to reach the appropriate person.
Interviews ranged in length from several minutes to more than 30 minutes. Some respondents provided a rich context for their answers. In such discussions, we often learned about concerns of the impact of the ADA legislation, conflicts around testing procedure with the National Board of Medical Examiners, and particular challenges at each school. These anecdotal issues will be mentioned in the discussion session.
The sources of information received were estimates provided by respondents at the time of the phone interviews. There was no way to verify the reliability of these responses, and the respondents did not request time to obtain data from their files. Since the number of students requesting accommodation in each medical school class was small, it appeared to us that the respondent was comfortable in providing the numbers offered. In many cases the respondent seemed personally familiar with the students making the request.
The data were analyzed in the following manner: One of the committee members received the interview sheets from fellow interviewers and checked for clarity and missing data. No attempt was made to call schools for which data appeared to be missing. The interview sheets were then tallied and analyzed by a non-committee colleague who was blind to the interest and procedure of the study.
Results
The committee contacted 107 of the 126 available medical schools (85%). Five schools refused to discuss these issues. Four of the five felt it was a breach of confidentiality. The fifth noted that the school was involved in a lawsuit over a student with a disability. Repeated attempts to reach the remaining 14 schools were unsuccessful.
The 107 schools surveyed represented a collective student body of 55,360 medical students. The Association of American Medical Colleges describes the total student body of the 126 schools at 67,000 (Molear, 2003-2004). Thus, the survey includes 83% of the total number of medical students. The number of medical students requesting accommodation in the survey was 1,230, or 2.3% of the student bodies surveyed.
Figure 1 shows the percentage of students requesting disability accommodations at the surveyed schools. Four schools reported no requests, while 26 schools reported that 0 - 0.9% of their students made requests. Fifty-seven schools had received requests from 1 to 3% of their students. Fifteen schools reported such requests in the 4 to 6% range, while there were 5 schools reporting the highest request rate (9 to 10%). Examination of the data regarding reasons for accommodation showed that over 90% were for cognitive problems, such as attention deficit disorder or learning disabilities.
In terms of when students requested accommodation, responses varied widely. While some students identified themselves during the admission process as having a disability, others chose not to make such a disclosure until they were already in school. The school identified some students (one school, for example, examined the lower percentile of students for the possibility of a learning disability). Most, however, self-identified. In 43 schools, over 50% of the students made a request at the time of admission, whereas in the other 60 schools at least as many students requested an accommodation some time later than admission. No data are available for 4 schools. Most of the later requests were made in the preclinical years, but only anecdotal data are available on that point.
Discussion
To our knowledge, this is the first attempt to conduct a national survey of the use of accommodations for medical students with a disability. The three major findings from the survey were: (a) 2.3% of medical students request accommodations for some form of disability; (b) vast majority of the requests for accommodation come from students with cognitive, rather than physical disabilities; and (c) many students with disabilities delay requesting accommodation until they experience the rigors of the medical school curriculum.
We have no comparable data from other graduate schools with regard to the prevalence data reported here. We note in the Walters and Crown study (1993) that between 1% to 2% of the students in each class at Albert Einstein School of Medicine were referred for an evaluation for learning disability.
Regarding the type of disability reported, the HEATH Resource Center tracks freshmen college students with disabilities on a biannual basis. From 1998 to 2000 the prevalence rates of reported disabilities in this national sample remained between 6% and 8% percent. However, the number of freshmen students reporting a learning disability rose steadily from 16% in 1988 to more than 40% in 2000 in that 6%-8% range (Henderson, 2001). It is clear from these data that cognitive disabilities are showing a rising prevalence. Compared to the earlier surveys on national samples of medical students that focused primarily on physical disabilities, it seems safe to conclude that
cognitive disability recognition and accommodation have also risen over the same period in schools of medicine.
Somewhat surprising was the sizeable number of students who acknowledge or discover cognitive problems after entry into medical school. We heard frequent stories from respondents of students who had functioned adequately in college but who “hit the wall” during their first two years of medical school because of the demands of large amounts of material to be covered.
Accommodations for students with cognitive difficulties were predominantly extra time for examinations and/or a quiet room. For students who are hard of hearing, reported accommodations included transparent surgical masks (for lip reading), amplification stethoscopes, and sign language interpreters. Less frequently used were note takers and books on tape for students with severe reading and writing problems. For several students with hemiplegia, (paralysis in one vertical half of the body), schools offered a standing wheelchair.
Anecdotal comments occurred during our conversations with representatives of each school. Many respondents noted the academic excellence of their students with disabilities as others have emphasized (Greenbaum, Graham, & Scales, 1996). The impact of ADA legislation was also a frequent topic of interview discussions. Many credited the ADA with raising the level of consciousness about disability and lessening the stigma traditionally attached to having a disability. As one dean said, “accommodation is no longer seen as an unfair advantage, but as assistance…We are testing for ability, not disability.” Nevertheless, a few respondents felt that this law gives students an unfair advantage. Other concerns included the extra expenses involved in providing accommodation, the fear that it would generate unrealistic expectations for students, and the related fear that learning disabilities could be used for cover more serious psychological problems. Overall, the ADA legislation appeared to have generated more formal procedures for evaluating a disability and recommending accommodations, as Faigel (1998) has noted.
An additional anecdotal issue concerned occasional conflicts with the National Board of Medical Examiners (NBME) around requests for accommodations in sitting for Step One of the United States Medical Licensing Exam (USMLE) which occurs at the end of the second year of medical school. Students who had received accommodations for a disability at their school could be denied such by the NBME. Failure to pass the USMLE could jeopardize their remaining two years of medical school. This issue is complicated and has been more fully explored elsewhere (Keys, 1993; Little, 2003).
Finally, as important as accommodations were for many students, respondents at various medical schools emphasized that some students who could justifiably receive assistance were reluctant to request it. Admitting to any deviation from the norm or fear of being socially stigmatized by peers or faculty seemed the major reason for this reluctance. Efforts to assist faculty in providing flexible accommodations for medical students are underway and have shown promising results (Sowers & Smith, 2003).
Limitations
This survey is a preliminary exploration of this important topic, and the numbers reported provided must be considered estimates, given the methodology used. In some of the telephone interviews, we failed to get a full listing of students who had a disability other than cognitive, so we are reluctant to provide numbers of the smaller group of students with hearing, visual, or other forms of disability.
A more systematic and detailed study of accommodations to various forms of disabilities needs to be carried out over time to capture trends and to establish more thoroughly the magnitude of the impact of disability on medical education.
Further, lack of data from 19 medical schools may have affected the figures. Nevertheless, an 85% response rate seems adequate to describe the estimated rate of accommodation requests. No attempt was made to learn how well accommodated students were doing academically compared to classmates, nor were systematic attempts made to estimate the financial impact of providing accommodations.
Recommendations
A more detailed survey on students in medical school who request accommodation needs to be done using methodology that includes systematic reviews of actual records at each school. The progress of accommodated students from their freshman to their senior year also needs to be examined from a psychological, academic, and financial perspective. Finally, the accommodation issue between medical schools and the NBME needs to be pursued.
Summary
Over 2% of American medical students are estimated to request accommodations for some form of disability. The overwhelming type of disability is cognitive in nature, and the major form of accommodation is extra time for in-house examinations and/or a separate room for testing. Many students do not request an accommodation until they become immersed in the increased demands of their preclinical years.
Author Note
The committee would like to acknowledge the critical review of the manuscript by Jo Anne Sowers, Ph.D.
Figure 1.
Percentage of students at U.S. medical schools who requested accommodations.
References
Cohen, J, (1983). Learning disabilities and the college student: identification and diagnosis. Adolescent Psychiatry, 11, 177-198.
Committee on Disabilities. (1992). Caring for people with physical impairment: The journey back, GAP Report 135.
Committee on Disabilities. (1997). Issues to consider in deaf and hard of hearing patients. American Family Physician, 56(8), 2057-2064.
Cox, D. H., & Klas, L. D. (1996). Students with learning disabilities in Canadian colleges and universities, a premier for service education. Journal of Learning Disabilities 29, 93-97.
Essex-Sarbie, D. (1994). The American with disabilities act: I history, summary and key components. Academic Medicine, 69, 519-524.
Faigel, H. C. (1998). Changes in services for students with learning disabilities in U.S. and Canadian medical schools 1991 to 1997. Academic Medicine, 73, 1290-1293.
Greenbaum, B., Graham, S., & Scales, W. (1996). Adults with learning disabilities: Occupational and social status after college. Journal of Learning Disabilities 29,167-173.
Hafferty, F.W., & Gibson G.G. (2003). Learning difficulties, professionalism, and the practice of medical education. Academic Medicine, 78(2), 189-201.
Henderson, C. (2001). College freshman with disabilities: A biennial statistical profile. Washington, DC: HEATH Resource Center, American Council on Education.
Hippolitus, P. (1987). College freshmen with disabilities preparing for employment. Washington, DC: HEATH Resource Center, American Council on Education.
Keys, J. (1993). Medical students with disabilities: Classifications for health science programs. Presentation at the National Association of Colleges and University Attorneys, Health Sciences Section Meeting, Washington, DC.
Medical school admission requirements, U.S. and Canada, 2003-2004. Association of American Medical Colleges, (Ed.) Molear, M.T.
Little, D. (2003). Learning differences, medical students, and the law. Academic Medicine, 78(2), 187-188.
Parks, A., Antonoff, S., Drake, C., Oliver, C., Sedita, J., Weiss, I., & Daddi, B. (1992). Screening for specific learning disabilities among dental students. Journal of Dental Education, 46, 586-591.
Runyan, M., & Smith, J. (1991). Identifying and accommodating learning disabled law school students. Journal of Legal Education, 41, 317-349.
Sowers, J. A., & Smith, M. R. (2003). A field test of the impact of an in-service training program on health sciences education faculty. Journal of Postsecondary Education and Disability, 17(1), 33-48.
Wainapel, S. T. (1987). Physical disability among physicians, an analysis of 259 cases. International Disabilities Studies, 9, 138-140.
Walters, J. A., & Crown, L. G. (1993). An approach to meeting the needs of medical students with learning disabilities. Teaching and Learning in Medicine, 5, 29-35.
Watson, P. G. (1995). Nursing students with disabilities: A survey of baccalaureate nursing programs. Journal of Professional Nursing, 11(3), 147-153.
Wu, S. H., Tsand, T., & Wainapel, S. F. (1996). Physical disability among American medical students. American Journal of Physical Medicine and Rehabilitation, 75(3), 183-187.
About the Authors
William Sack, M.D. is an emeritus professor of psychiatry at the Oregon Health and Sciences University in Portland, Oregon. He was director of the Division of Child and Adolescent Psychiatry for 22 years until his retirement in 1997. He remains clinically active and continues to teach in the department. He was past chair of the Committee on Disabilities for the Group for the Advancement of Psychiatry and remains an active member of that committee. Correspondence
can be sent to him at OHSU, Mail Code DC-7P, Division of Child and AdolescentPsychiatry, Portland, OR 97239-3098. FAX 503-418 5774, e-mail: [email protected]. Phone, 503-4l4-6326
Sanjay Gulati, M.D. serves as Staff Psychiatrist, Deaf & Hard of Hearing Service, Cambridge Hospital, Cambridge, and Deaf & Hard of Hearing Program, Children's Hospital, Boston. Deaf himself, he specializes in clinical work with complex deaf populations, including those with language, cognitive, medical and multicultural complications. He is an Instructor in Psychiatry at Harvard Medical School. He can be reached via email at [email protected]
Meyer S. Gunther, M.D. is a psychoanalyst and a longtime consultant to the Rehabilitation Institute of Chicago. Until his retirement he was on the faculty of the Chicago Institute for Psychoanalysis and The Northwestern University Fineberg School of Medicine.
Frederick J. Stoddard Jr., M.D. is Associate Clinical Professor of Psychiatry, Harvard Medical School at Massachusetts General Hospital, and Chief of Psychiatry at the Shriners Burns Hospital. He is a clinical and research child psychiatrist who has published in the areas of pain, PTSD, injuries, burns, early childhood stress, and depression. He works with patients coping with disability, stigma, and rehabilitation. He can be reached via email at [email protected]
Rachel St. John, M.D. is an assistant professor of Clinical Pediatrics, and the Director of the Kids Clinic for the Deaf at Georgetown University Hospital in Washington, DC. Dr. St. John specializes in providing a culturally and language-accessible pediatric medical home for families with Deafness. She also serves as adjunct faculty in the graduate department of counseling at Gallaudet University, teaching courses in Lifespan Development and Psychopharmacology. She can be reached via email at [email protected]
The Effects of Teaching Text-Structure Strategies to Postsecondary Students with Learning Disabilities to Improve Their Reading Comprehension on Expository Science Text Passages
Stephanie A. Gaddy
Lincoln College
Jeffrey P. Bakken and Barbara M. Fulk
Illinois State University
Abstract
This study was conducted to determine the relative efficacy of text-structure strategy instruction compared to traditional instruction on the reading comprehension of 40 postsecondary students with learning disabilities (LD). Participants were randomly assigned to either a text-structure strategy condition or a traditional instruction condition. Participants completed pretests of prior knowledge, received instructional sessions using expository science passages, and completed immediate and delayed retell tests. Data analyzed with repeated-measures ANOVAs indicated
that students in the text-structure strategy condition outperformed students in the traditional instruction condition on both immediate- and delayed-retell measures. Results are discussed in terms of the participant sample, the efficacy of strategy instruction, and type of text structures. Implications for future research are also discussed.
In 1988, approximately 1% of full-time college freshmen reported that they had learning disabilities (LD) (Henderson, 2001); this percentage increased to 6% in 2000. Madaus and Shaw (2006) note that although estimates of the number of postsecondary students with LD vary, all figures are conservative, in that they exclude part-time students and those in two-year degree programs. Clearly the population of students with LD enrolled in postsecondary institutions is increasing (Wagner, Newman, Cameto, Levine, & Garza, 2006). As the number of students with LD continues to increase in colleges and universities (Wagner, et. al., 2006), increased attention to these students' specific academic needs is essential (Allsopp, Minskoff, & Bolt, 2005; Vogel & Adelman, 1992).
Research tells us that LD manifests itself, not only throughout the school years (Heiman & Kariv, 2004), but throughout the life span (Gerber, et al., 1990). It has been well documented that postsecondary students with LD exhibit difficulties in phonological processing, word reading, and rate of reading (Trainin & Swanson, 2005), which is particularly detrimental to comprehension of authentic college-level texts (Warde, 2005). Historically, few students with LD (i.e., 2%) graduate from college (National Institute of Child Health and Human Development, 1999). When these students do graduate, they have significantly lower grade-point averages (GPAs), more withdrawals from courses, and more D grades (Vogel & Adelman, 1992) than their classmates without disabilities. On a more positive note, it is encouraging to note that employment outcomes for college graduates with LD match those of others in the U.S. workforce on variables such as salaries, employment levels and benefits (Madaus, 2006).
Data from the second wave of the National Longitudinal Transition Study-2 (NLTS2; Wagner et al., 2006) indicate that of all achievement indicators, the greatest score differences between youth with disabilities and their counterparts without disabilities
occurred on passage comprehension tests. Proctor, Prevatt, Adams, Hurst, and Petscher (2006) employed profile analysis with the Learning and Study Strategies Inventory (LASSI; Weinstein & Palmer, 2002) to compare college students with LD to various other subgroups of college students. Each subgroup with LD was found to score significantly lower than their classmates without LD on five of the 10 LASSI subtests, including anxiety, concentration, information processing, motivation, and finally, selecting main ideas and important information from text. Thus, postsecondary students with LD may need to improve their reading comprehension skills as well as use additional learning strategies to achieve academic success in higher education (Allsopp et al., 2005; Mull, Sitlington, & Alper, 2001; Trainin & Swanson, 2005).
Metacognitive Strategies
Recent meta-analyses of reading comprehension have provided increasing support for the cognitive/information processing paradigm (e.g., Gersten, Fuchs, Williams, & Baker, 2001; Proctor et al., 2006; Swanson, 1999; Talbott, Lloyd, & Tankersley, 1994) that students as active
learners who use cognitive strategies. For example, students who actively apply cognitive reading strategies, such as text-structure strategies, improve their reading comprehension (e.g., Bakken, Mastropieri, & Scruggs, 1997). A specific focus on cognition also promotes metacognitive activity (e.g., Graves, 1986).
Metacognition is an active thinking process that may be described as “knowing how to know.” Metacognitive skills include self-monitoring strategies in comprehension, active participation, and self-reflection to regulate one’s learning (Chan & Cole, 1986). Students using metacognitive reading strategies evaluate the reading task demands in light of their skills for reading, including their ability to select, employ, and monitor strategy use (Deshler, Ellis, & Lenz, 1996). For example, skilled readers consciously adjust their reading speed, monitor their understanding of what they read, and ask and answer questions about the information as they read.
Unfortunately, students with LD typically do not use specific reading strategies spontaneously (Torgesen, 1986), or their use of reading strategies is limited (Worden, Malmgren & Gabourie, 1982). To increase the use of metacognitive skills, systematic instruction in specific reading strategies with a rationale for using the strategy appears effective for many students with LD (e.g., Fuchs, Fuchs, & Kazdan, 1999). Mastropieri, Scruggs, and Graetz (2003) stated that research-supported reading comprehension strategies for secondary students with LD may be divided into four different areas: (a) basic skills and reinforcement (e.g., corrective feedback, repeated readings); (b) text enhancements (e.g., spatial organizers, mnemonic illustrations); (c) self-questioning (e.g., summarizing, finding the main idea); and (d) text-structure (e.g., narrative or expository passages).
Text Structure
Text organization exists in both narrative and expository structures. For example, narrative texts include patterns of characters, events, goals, plots, and conclusions (e.g., Gurney, Gersten, Dimino, & Carnine, 1990; Idol, 1987). Specific structures within expository texts include main idea, antecedent and result, problem and solution, as well as compare-and-contrast text structures (e.g., Meyer & Freedle, 1984; Taylor, 1980). Expository texts explain concepts for academic content such as science.
As students progress through grade levels, they need to read expository texts far more often than narrative writing (Pugh, Pawan, & Antomarchi, 2000). Expository texts are more difficult to read than narrative texts (Saenz & Fuchs, 2002) because of high conceptual density, special terminology, multiple graphic ways of presenting information, and text structures that reflect the logic of the topic represented within the text (Pugh et al., 2000).
Text-Structure Strategies
Students with LD experience reading comprehension difficulties at the elementary level (Wong & Wilson, 1984), at the junior-high (e.g., Bakken et al., 1997), secondary (e.g., Horton, Lovitt, Givens, & Nelson, 1989) and postsecondary levels (Bacon & Carpenter, 1989; Wagner et al., 2006; Warde, 2005). Henderson (2001) reported that 45% of freshmen students with disabilities planned to attend college in hopes of improving their reading skills.
The use of text-structure strategies has been found to improve the reading comprehension of narrative as well as expository text passages for students at the elementary through secondary levels (e.g., Bakken et al., 1997; Idol, 1987; Smith & Friend, 1986). Further, they have been shown to be effective for postsecondary students in the comprehension of narrative-text passages (Bacon & Carpenter, 1989). However, to date, research has not been conducted to determine if text-structure strategies improve postsecondary students' reading comprehension of expository-text passages.
Postsecondary Students with LD
Section 504 of the Rehabilitation Act of 1973 protects postsecondary students with LD (Rothstein, 2000) who self-advocate for reasonable accommodations to improve access to content (Mull et al., 2001). While accommodations may be necessary, they may not be sufficient for postsecondary students with LD (Allsopp, et al., 2005) enrolled in academic courses such as science, history, foreign languages, health, art, and political science, which require reading with comprehension for successful acquisition of information (Mastropieri & Scruggs, 2004).
More than 15 years ago, (1992), Gajar lamented that only “meager research” had been conducted to identify effective reading comprehension strategies for postsecondary students with LD. Since that date, some literature has focused on the reading skills and specific problem areas of secondary students with LD (e.g., Archer, Gleason, & Vachon, 2003; Trainin & Swanson, 2005; Warde, 2005) as well as on research-supported interventions for secondary students with LD (e.g., Bryant, Goodwin, Bryant, & Higgins, 2003; Mastropieri et al., 2003). However, few interventions have been conducted to remediate the specific academic difficulties of postsecondary students with LD.
Allsopp, et al. (2005) recently described a model demonstration project that provided semester-long individualized strategy instruction relevant to specific coursework of 46 college students with LD at three postsecondary institutions. One-to-one strategy training for organizational skills, study skills, and/or reading comprehension strategies, as needed, addressed participants’ needs for the academic demands specific to their coursework. Results indicated that students who employed the trained strategies independently demonstrated sustained academic improvement.
In the present study, we wanted to determine if text- structure strategies improved reading comprehension of expository text passages in science for postsecondary students with LD. Specifically, we wanted to know if the mean scores differed among pre-, immediate, and delayed measures for students who received text-structure strategies compared to students who received traditional instruction on main idea text passages. We also wanted to know if the mean scores differed among pre-, immediate, and delayed measures for students who received text-structure strategies compared to students who received traditional instruction on compare-and-contrast text passages. Last, we wanted to determine if the mean scores differed among the pre-, immediate, and delayed means for students who received text-structure strategies compared to students who received traditional instruction on the combined measures of all main idea and compare-and-contrast text passages.
Method
Participants
Forty postsecondary students with self-identified LD from a two-year private postsecondary institution in a midwestern state volunteered to participate in this investigation. It was explained that the volunteers would learn about interventions to enable them to improve their reading comprehension. Participating students gave permission for us to obtain data from the study as well as data from their existing academic records. Because we did not wish to place additional requirements upon the students, we did not require formal documentation of their LDs. However, participants were asked to describe classroom accommodations that they had received in high school. Student records provided further evidence of an LD diagnosis.
Demographic data collected from students’ admissions records included race (optional), gender, and the approximate grade level when participants were first identified with LD (see Table 1). Additional demographic data collected from students’ records included age, high school GPA, American College Test (ACT) composite score, college reading placement test score, college writing placement test score, and college math placement test score (see Table 2).
Twenty students were randomly assigned to either a text-structure strategy condition or a traditional instruction condition. T-tests on the demographic variables showed no significant differences between participant groups on any demographic variable.
Materials
The instructional and testing workbooks used in the study contained expository text passages selected from postsecondary texts about life and physical sciences written in either main idea or compare-contrast passages. To parallel prior research (e.g., Bakken et al., 1997; Gurney et al., 1990), we shortened the text passages to approximately 150 words each and kept them each at an eighth-grade readability level, as measured by the Flesch-Kincaid Readability Formula software. Science text passages were used since the majority of postsecondary students need to successfully complete two science courses to meet general education requirements.
Scoring
Students each completed a pretest and two retells consisting of an immediate test and a delayed test. Four scoring methods were used to code the data: test strict, no test strict, test loose, and no test loose. Test and no test were levels of concept importance employed to determine whether or not the concepts appearing in the texts would appear on a teacher-made test. Strict and loose were levels employed to evaluate whether retells stated either literal information (i.e., strict) or inferential (i.e., loose) information.
To determine test-worthy concepts, 11 graduate students in special education who were also special education teachers read 10 expository science text passages and listed the key concepts. Concepts listed in 60% or more of the teachers’ rankings were determined to be test-worthy concepts, and concepts listed in 59% or less of the teacher’s rankings were determined to be concepts not important enough to be test worthy. A 60% standard was applied, as students in
many college courses who achieve a 60% will pass the course. These standards were employed to score each individual student retell.
To determine scoring reliability, interraters practiced scoring individual student retells and compared their scores to those of the other interraters until consistent reliability was achieved. Through this comparison, the scoring procedures were refined for clarity. Interraters then practiced scoring individual student retells again, using the clarified scoring procedures, until 100% agreement was reached.
A four-step process was used to calculate each student’s retell score. First, each student’s retell was scored for test-worthy concepts “strict” related to literal comprehension (i.e., to grasp the nature, significance, or meaning) of the passage. The term literal was defined as consistent with the primary meaning of the term or expression (i.e., synonyms were acceptable; e.g., two = both, and sound = noise; word shifts were acceptable, e.g., new to newly, electric to electricity; and different word orders were acceptable, e.g., animal ignores it = it is ignored by the animal). If the concepts stated in the student’s retell literally matched the concepts determined by the interrators as test worthy, two points were given. Second, the concepts not worthy of being test-worthy concepts “strict” were scored employing the same procedures as for test-worthy concepts strict. Thus, literal retells, whether both test worthy or not, were awarded two points. Third, the test-worthy concepts “loose” were scored. If the student’s concepts in the retell inferentially matched the concepts determined as test worthy, the student received one point for each concept. The term inferential was defined to indicate by association, suggestion, or reason (i.e., the student may have failed to retell the scientific term such as oligotrophic but shorten the term to the "o" lake or refer to the first lake identified in the passage). Finally, the not test-worthy concepts “loose” were scored employing the same procedures as for not test-worthy strict, also earning one point.
Design
The study employed an experimental design with random assignment of students to two conditions: text-structure strategy and traditional instruction. We shuffled the student sign-up sheets and then randomly placed the sheets in Condition One or Condition Two. Students were not informed whether they participated in the text-structure strategy condition or the traditional instruction condition. Regardless of the condition, students received the same expository passages for instruction.
Each student was pretested on the first day (Monday) followed by 30 minutes of condition-specific individual instruction. On the second day (Tuesday), each student received 30 minutes of condition-specific individual instruction. On the third day (Wednesday), each student completed an immediate test. One day then elapsed, and on the fifth day (Friday), each student completed a delayed test. In the text-structure strategy condition, students received direct instruction in two types of text-structure strategies, main idea and compare-and-contrast. In the traditional instruction condition, students received traditional instruction consisting of reading and answering questions about the content of the text passages.
Dependent Measures

All participants took a pretest, an immediate test, and a delayed test. Students completed an untimed pretest where they told everything they knew about the specific content of four expository science text topics that were on the immediate test. The immediate test employed four text passages with two main idea text-structure passages and two compare-and-contrast text-structure passages. The delayed test asked the students to recall what they had read about on the passages of the immediate test.
Pilot Testing
A first pilot study was implemented with four participants from the participant sample. The first pilot was conducted to determine the validity of the design and methods as well as the appropriateness of the materials and the procedures. The pilot test indicated the materials, including the text passages and the implementation scripts, were practical and the procedures were effective. However, it was determined that a longer study time was given to the text-structure strategy condition. Consequently, the study time for both conditions was adjusted to 3.5 minutes.
A second pilot study was conducted with two new participants. Materials were identical to those of the first pilot, but this time each participant was given 3.5 minutes study time, which resulted in equivalence of time between groups. Because an alteration was made during the first pilot study, data from the students who participated in the first pilot were not included in the final results of this study.
Pretest Procedures
Students completed an untimed pretest and were asked to tell everything they knew about the specific content of four expository science text topics. For example, they were asked to tell what they knew about kinetic energy and potential energy. This information was written down verbatim as well as tape-recorded. This was done to ensure that the results obtained on the immediate and delayed tests completed on the third and fifth days accurately measured students' comprehension of the expository science text passages, rather than any prior knowledge.
Instructional Procedures Common to Both Conditions
We used common instructional procedures in both the text-structure strategy intervention condition and the traditional instruction control condition. On the first day, each student completed the pretests and received 30 minutes of instruction on main idea passages. On the second day, each student again received 30 minutes of instruction on compare-and-contrast passages with a review of main idea passages. Implementation scripts included the instructional sequence, the presentation, and the practice phases to ensure all students received the same condition-specific instruction. The scripts also regulated the time of instruction to ensure equal time on task for students in both conditions.
The instructional procedures followed a model of an effective instructional design by Mastropieri and Scruggs (2004). The order included (a) presentation and modeling of the strategy to be
learned, (b) guided practice, (c) independent practice, and (d) retell and review. Prior to instruction on the second day, each student in both conditions also participated in a review of the content presented on the first day.
On each day, students participated in three phases - presentation of the material to be learned, guided practice, and independent practice. We taught students about expository texts and asked them to read eight text passages. The presentation phase included many opportunities for students' responses, retells, and think-alouds. Then the students studied the passages to help them to remember as much as they could about the text passage. In the guided practice phase, the students worked to identify, review, and study the text passages. Instruction was implemented through modeling, using think-alouds, and reviewing. In the independent practice phase, students read along and listened to two text passages. One text passage included written prompts and the other text passage included no written prompts. Students then practiced retells and reviewed the text passages independently.
Text-structure strategy condition procedures. Each day, students learned about expository texts and, more specifically, main idea text structures and strategies as well as compare-and-contrast text structures and strategies. Text-structure strategies for main idea text structures included asking students to underline the main idea and then write the important concepts that explain the main idea. For example, students asked questions and stated the steps of the strategy (e.g., what will I do now? I will underline the main idea in this text passage.), Text-structure strategies for compare-and-contrast text structures asked students to: underline the two primary ideas and then write what was the same and different about the two ideas. Last, the students studied what they wrote to help them to remember the text passage information.
Traditional instruction condition procedures. Each day, students learned about expository text passages via traditional instruction similar to instruction in science courses at the postsecondary level. The students read along and listened to the text passages as well as wrote answers to questions that followed the text passages. Students also answered aloud open-ended comprehension questions that followed the text passage.
Test procedures common to both conditions. Participants in both conditions received test procedures that followed an implementation script to ensure that all received identical testing protocols. Tests consisted of an immediate test and a delayed test. The immediate test, administered one day after the completion of instruction, employed four text passages. The first text passage (i.e., kinetic energy and potential energy) and the fourth text passage (i.e., oligotrophic lakes and eutrophic lakes) used compare-and-contrast text structure, whereas the second and third text passages (i.e., solar cells and habituation) used main idea text structure. The delayed test, which was administered two days after the immediate test, tested only the four topics from the text passages employed during the immediate test (i.e., no new text passages were read).
During the immediate test, students first read and then listened to tapes of each text passage. Second, they had 3.5 minutes to study independently. Finally, students were asked to retell, without prompts, everything they could remember about the text passage. All immediate tests were tape recorded, but not timed. Similarly, during the delayed test, students had to retell,
without prompts, everything they could remember about the text passages they had read for the immediate test. We recorded all student responses with the delayed tests.
Instructional fidelity. To help ensure instructional fidelity, all instructional sessions were tape recorded and random reviews of five of the 40 tape-recorded instructional sessions were conducted. An independent person not involved with the research project listened to each tape and compared it with the instructional script. A percentage of agreements versus disagreements was calculated, and a 100% agreement was obtained.
Results
The data were analyzed using repeated-measures ANOVAs. The type of instruction received, either text-structure strategy or traditional instruction, served as the independent variable, and the number of points earned on the retell after instruction served as the dependent variable. The mean scores indicated that students in the text-structure strategy condition generally outperformed students in the traditional instruction condition on immediate and delayed tests. Results for the repeated-measures ANOVAs between groups suggested that on the delayed tests, students in the text-structure strategy condition significantly outperformed students in the traditional instruction condition on compare-and-compare text structures.
Main Idea Text Passages
Test interaction tests of the mean differences between the text-structure strategy and the traditional instruction conditions for the main idea text passage, solar cells, habituation, and the combination of both passages on immediate and delayed test were nonsignificant, p > .05, for each combination of concept importance, scoring method, and passage type (see Tables 3, 4, and 5).
Compare-and-Contrast Text Passages
The Treatment x Test interaction tests of the mean differences between the text-structure strategy and the traditional instruction conditions for the compare-and-contrast text passage, kinetic energy and potential energy on the immediate and delayed tests were also nonsignificant, p > .05, for each combination of concept importance, scoring method, and passage type (see Table 6).
The Treatment x Test interaction test was significant on immediate and delayed test mean differences for the combination of test-worthy concept importance, loose scoring method, oligotrophic and eutrophic lakes passage, F(2,76) = 4.21, p = .02 (see Table 7).
The Treatment x Test interaction test was not significant for not test-worthy concept importance and loose scoring method, oligotrophic and eutrophic lakes passage, p = .05, (the actual p value was .052; hence, the Treatment x Test interaction test was nonsignificant, p > .05).
The Treatment x Test interaction tests of the mean differences were significant, p < .05, for the combined compare-and-contrast text passages, kinetic energy and potential energy and oligotrophic lakes and eutrophic lakes, on immediate and delayed tests for the combination of
test-worthy concept importance, loose scoring method, as well as not test-worthy concept importance, loose scoring method (see Table 8). The Treatment x Test interaction tests were nonsignificant, p > .05, for the combinations of test-worthy concept importance, strict scoring method and not test-worthy concept importance, strict scoring method.
The Treatment x Test interaction test of the mean differences between the immediate and delayed tests was significant for the combined compare-and-contrast text passages for the combination of concept importance of test-worthy and scoring method of loose, F(2,76) = 5.73, p =.01. Finally, the Treatment x Test interaction test on the immediate and delayed test means was also significant for the combined compare-and-contrast text passages for the combination of not test-worthy concept importance and loose scoring method, F(2,76) = 4.11, p =.02.
Main Idea and Compare-and-Contrast Text Passage
The Treatment x Test interaction tests were significant, p > .05, for the sum of the combined scores of all main idea and compare-and-contrast text passages for test-worthy as well as not test-worthy concept importance using the loose scoring method (see Table 9).
The Treatment x Test interaction test of the mean differences for the sum of the combined scores on all main idea and compare-and-contrast text passages on the pre-, immediate, and delayed tests was significant for the combination of test-worthy concept importance and loose scoring method, F(2,76) = 3.30, p =.04. The Treatment x Test interaction test of the mean differences for the sum of the combined score of all main idea and compare-and-contrast text passages on the pre-, immediate, and delayed tests was significant for each combination of not test-worthy concept importance and loose scoring method, F(2,76) = 6.31, p = .00. Finally, the Treatment x Test interaction test was approaching significance for the sum of the combined score of all main idea and compare-and-contrast text passages for the not test-worthy concept importance and strict scoring method, p = .06.
Students' Answers to Open-Ended Questions
Students also responded to two open-ended questions, "Can you tell me what kinds of passages we worked on?” and "Can you tell me what strategy we used to help our reading comprehension?" In the text-structure strategy condition, 8 of 20 students reported the structures of the passages they had worked on were main idea and compare-and-contrast text-structure passages. In the traditional instruction condition, none of the participants was able to report a specific structure of the passages. In the text-structure strategy condition, 20 of 20 students reported the strategy was a text-structure strategy where they underlined the main idea or the same and different ideas. In the traditional instruction condition, only 13 of 20 students were able to report using a reading strategy, consisting of reading text and answering questions.
Summary and Discussion
This study was conducted to determine the relative efficacy of text-structure strategy instruction compared to traditional instruction on the reading comprehension of postsecondary students with LD. Participants were randomly assigned to either a text-structure strategy condition or a
traditional instruction condition. Data analyzed using repeated-measures ANOVAs indicated that students in the text-structure strategy condition outperformed students in the traditional instruction condition on the sum of combined scores across all measures. However, effect sizes were negligible on the immediate measures, whereas they were extremely large (i.e., greater than 1.00 across all four scoring methods) on the sum of delayed retell measures. These findings suggest that instruction in text-structure strategies did improved reading comprehension for postsecondary students with LD, particularly on delayed recall measures for compare/contrast passages.
Reading Comprehension
The use of text-structure strategies in this investigation improved students’ reading comprehension, with significant improvement on delayed recall on compare-and-contrast text structures. Effect sizes ranged from high medium (i.e., .69) to very large (i.e., 1.36) across the four scoring methods. We believe that students in the text-structure strategy condition could remember more information from the text page because they employed strategies that promoted metacognition. Students with LD who employed more metacognitive learning strategies achieved higher GPAs than those who did not (Trainin & Swanson, 2005). Thus, postsecondary students with LD who improve their metacognitive skills may improve their chances of completing postsecondary programs and successfully entering into the workforce (Madaus, 2006). This study extends previous research on students with LD by demonstrating the efficacy of instruction in expository-text-structure strategies. The most important aspect of this study is that it investigated the population of postsecondary students with LD who have been extremely underrepresented to date in reading comprehension investigations.
Text-Structure Strategies
Main idea text-structure strategy. Although students in the text-structure strategy condition obtained higher immediate and delayed test mean scores than the students in the traditional instruction condition, these scores were not significantly higher on main idea text structure passages. Effect sizes on the immediate tests were small, with three of four scoring methods ranging from .24 to .44; effect sizes on the delayed measures on main idea passages were also small, on three of four scoring methods ranging from .22 to .53. The only significant effect size for main idea passages on the delayed recall measures occurred with the strict scoring of test-worthy concepts.
Main idea text structure occurs when the first sentence states the main idea followed by supporting ideas and details. Main idea text structure is identifiable, yet often the most important supporting ideas related to the topic are not stated explicitly and may be confused with incidental ideas such as examples, definitions, or analogies. The deductive nature of main idea text structure presents challenges to students who have problems discriminating main ideas from incidental details. This finding supports previous research conducted by Worden et al. (1982). In the Worden et al. study (1982), postsecondary students' performance on main idea units of stories recalled was compared to the performance of third graders. However, the students who received main idea text structure strategy obtained higher mean scores when compared to students who received traditional instruction.
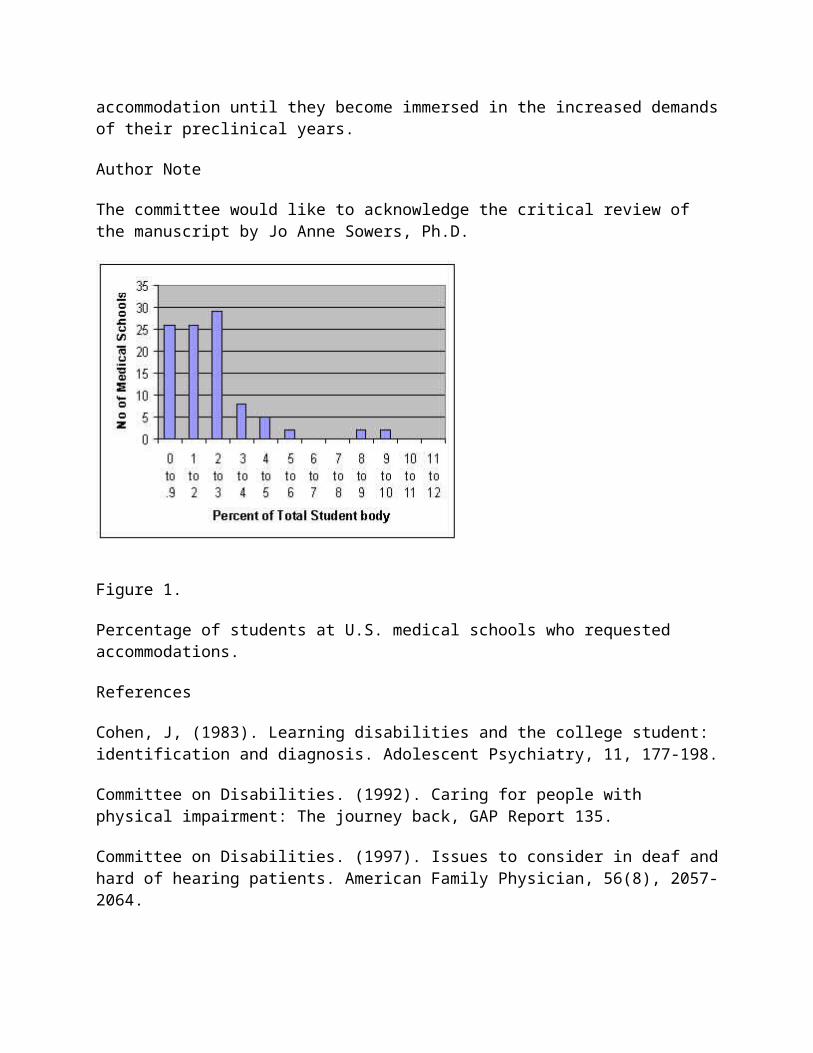
On the combined main idea text passages, solar cells and habituation, the immediate and delayed mean test scores of students in the text-structure strategy condition were higher than those of students in the traditional instruction condition. Again, these findings may be attributed to the main idea text-structure strategy, which required students to underline the main idea in the first sentence and then to paraphrase and write the supporting ideas and details. We gave students who participated in the text-structure strategy condition specific steps to follow for organizing and identifying important elements of the texts. Students in the text-structure strategy condition used their study time not only to recall, but also to implement the strategy steps. However, students in the traditional instruction condition used their study time simply to try to memorize the text.
Compare-and-contrast text-structure strategy. Results also indicated that students in the text-structure strategy condition achieved test scores significantly higher than those of students in the traditional instruction condition on the two delayed recall measures. These findings may be attributed to use of the compare-and-contrast text-structure strategy. Steps of this strategy instructed students to list the two concepts on their workbook pages and then to paraphrase and write what was the same and different about the two concepts.
Students in the text-structure strategy condition had to organize and identify similarities and differences between the concepts to complete the strategy task. Thus, they remembered the text passages by focusing on the structure of the passages rather than simply rehearsing the text information, as did students in the traditional instruction condition. Moreover, when students in the text-structure strategy condition performed the retells, they began by identifying the two concepts that precisely matched the concepts ranked as most important by the interraters. The text-structure strategy enabled students to retell more information because the information was organized clearly and, thus, held more meaning for them.
Students’ answers to open-ended questions. We asked students in both conditions open-ended questions before the delayed retells. Students in the text-structure strategy condition reported they learned a strategy to help them to comprehend text passages better. All students in this condition noted that the strategy was easy to follow and easy to use, and that they did not have to rely on basic memorization of the text passages. They believed that if they used the strategy, they could remember the text passages due to the organization the strategy provided to them.
In contrast, students in the traditional instruction condition could not report a specific organizational strategy that they could use in the future to improve their text comprehension. As the traditional instruction consisted of answering comprehension questions, students in this condition could only attempt to memorize the words of the text passages, instead of actually comprehending the meaning of the text passages.
Limitations
As noted in previous research, many students with LD have difficulty with reading (e.g., Bakken et al., 1997; Chan & Cole, 1986; Graves, 1986; Warde, 2005; Worden et al., 1982). This study suggests that postsecondary students with LD do improve their reading comprehension with text-
structure strategy use. However, some limitations present in this study do affect generalization of these findings to other populations.
Adapted text passages. One limitation of this study is that the text passages averaged at 150 words with an eighth-grade readability level. This may limit generalization of the results, as most authentic college-level texts exceed 150 words and have readability levels at grade 12 and higher. Thus, postsecondary students are expected generally to be able to comprehend lengthy text passages written at difficult rather than controlled readability levels (Warde, 2005).
ACT scores. Another limitation relates to the ACT scores of the participants in this sample. These students had ACT scores lower than the national mean and would be considered at risk in college. Thus, these results may not generalize to other students with LD with higher ACT scores, who might not be at risk. Learning strategies are only effective for students who need them.
Instructional and study time. In addition, the study strictly controlled instructional time, with only two 30-minute instructional sessions that used scripts and a stopwatch across conditions. During the instructional presentation, students could not ask clarification questions, even if such questions occurred to them. In a typical postsecondary class, by comparison, students usually have the opportunity to ask questions and receive clarifications. Further, students in the study were limited to 3 1/2 minutes of independent study time whereas study time is a factor within the control of most postsecondary students. In fact, Trainin and Swanson (2005) found that students with LD often spent considerably longer on their schoolwork than their peers to compensate for their other academic deficits.
Individual instruction. The study provided one-to-one direct instruction based on an effective teaching model (Mastropieri & Scruggs, 2004). By comparison, most instruction in today’s postsecondary classes delivers content through lectures and to large groups rather than individual students. Lecture models of instruction do not provide time for guided practice and independent practice of skills as did this direct instruction format. Thus, these results may not be generalized to instruction as presented in other postsecondary classes.
Voluntary participation. Finally, a further limitation of this study is that the participants were volunteers. Participation may have been motivated by students’ desire to improve their reading comprehension and concern about their low academic performances (Henderson, 2001). Clearly, volunteers cooperated more and maintained a higher level of motivation than non-volunteers, and these factors may have enhanced the benefits of the strategy instruction.
Implications
Text-structure strategies. The results of this study confirm that postsecondary students with LD who received instruction in text-structure strategies outperformed students who received traditional instruction, thus extending previous text-structure strategy research conducted at K-12 grade levels, (e.g., Bacon & Carpenter, 1989; Bakken et al., 1997; Smith & Friend, 1986; Wong & Wilson, 1984) The use of text-structure strategies did improve these students’ reading comprehension of expository texts.

A recent meta-analysis of reading comprehension research (e.g., Swanson, 1999) supports the cognitive/information-processing paradigm. Students in the present study who received text-structure strategy instruction demonstrated better long-term memory of science content than did students in the traditional instruction condition on delayed retell measures. Students in the traditional instruction condition who only rehearsed phrases from the text passages could not recall those phrases on the delayed measures, perhaps because they did not organize the meaning or access long-term memory.
Reading comprehension and expository texts. To succeed in college and beyond, postsecondary students with LD must improve their reading comprehension, particularly of expository text, which has been determined to be more difficult than narrative text (Pugh et al., 2000). Not only is expository text the most prevalent type of text at the postsecondary level, but students are also expected to read increasing amounts of text as they proceed through school (Deshler et al., 1996). This study employed expository text passages from science for both main idea and compare-and-contrast text structures, which closely represents the types of text experienced at the postsecondary level.
Students in the text-structure strategy condition also significantly improved their reading comprehension on delayed tests of retell. Because postsecondary students generally take fewer tests (e.g., midterms and finals) than students at lower grade levels, postsecondary students will benefit from a strategy that improves long-term comprehension rather than short-term rote memorization.
Recommendations
Additional research needs to address strategies to improve reading comprehension for postsecondary students. It is well documented that LD does not disappear with age (e.g., Gerber et al., 1990). As LD is not “cured”, it is fairly certain that postsecondary students with LD exhibit the same characteristics as younger students with LD (e.g., Deshler, 2005); however, the nature of postsecondary institutions does not mirror K-12 environments. Most students with LD have specific accommodations in place in their K-12 environments. Although some students with LD may have access to accommodations in the postsecondary environment, the lack of research to determine effective interventions for this age group is insufficient to ensure the accommodations at the postsecondary level are appropriate.
This study suggests that postsecondary students would benefit from additional academic assistance such as instruction in reading strategies, which can be provided through tutoring or mentoring programs. Postsecondary institutions that provide this type of academic assistance might see better outcomes for postsecondary students with LD. This type of academic assistance could easily be through tutoring services or mentoring programs provided (see Alsopp et al., 2005). As more and more students with LD attend postsecondary institutions, their needs must be addressed to benefit them and to improve their graduation rates from postsecondary institutions.
This study demonstrated the efficacy of text-structure strategies with postsecondary students with LD. However, there are also other reading strategies that may be effective. We must identify additional reading strategies that might be useful for postsecondary students with LD,
particularly those that focus on expository text. This study provided support that postsecondary students with LD can learn and apply a cognitive strategy to improve their retell of expository texts. Since most postsecondary textbooks are written using expository structures, further investigation in this area is warranted.
Although it may seem remedial to provide reading instruction to postsecondary students with LD, such reading instruction is necessary. It should include reading strategy, text structure, and reading text-structure strategies. In addition, it is not assumed that this relatively short amount of intervention can remediate postsecondary students’ complex reading comprehension difficulties. However, this study confirms that reading instruction that includes strategy use can be extremely valuable. As indicated by the results, students in the text-structure strategy condition outperformed students in the traditional instruction condition. Moreover, this performance was greater in the delayed measures and can be attributed to the use of a reading strategy.
Table 1
Frequencies and Percentages of the Categorical Demographic Variables
Variable Text Structure Traditional
Strategy Condition Instruction Condition
(n =20) (n =20)
f % f %
Race
Caucasian American 16 80 16 80
African American 3 15 3 15
Hispanic American 1 5 - -
Middle East American - - 1 5
Gender
Male 10 50 13 65
Female 10 50 7 35
Grade Identified with LD
1 3 1 3 15

2 1 5 2 10
3 6 30 3 15
6 1 5 - -
7 1 5 1 5
8 1 5 - -
9 1 5 3 15
10 1 5 3 15
11 1 5 - -
12 4 20 5 25
Table 2
Means and Standard Deviations of the Continuous Demographic Variables
Variable Text Structure Traditional F-value
Strategy Condition Instruction Condition
(n =20) (n =20)
M (SD) M (SD)
Age 19.30 0.66 19.02 0.51 1.001
High School-Grade Point Average 2.46 0.71 2.37 0.57 1.732
American College Test (ACT) 15.25 3.43 13.90 1.21 2.656
Reading Placement Test 13.05 4.73 13.65 2.76 2.677
Writing Placement Test 17.68 4.23 17.45 3.39 1.303
Math Placement Test 15.79 12.19 15.75 11.19 0.570
Note. The high school grade point average was based upon a 4.00 grading scale. Placement test
data were not available for one of the 20 participants in the text structure strategy condition.

T-tests were implemented to compare all demographic data; no significant differences were
found between the two groups.
Table 3
Means and Standard Deviations for the Pre-, Immediate, and Delayed Tests for the Text-Structure
Strategy and Traditional Instruction Conditions for Main Idea Text Passage, Solar Cells
Test Text Structure Traditional Effect Size
(Xe-Xc/SDc)
Test-Worthy Concept Importance, Strict Scoring
M (SD) M (SD)
Pre 0.00 (0.00) 0.10 (0.45) -0.22
Immediate 3.60 (2.11) 3.00 (2.71) 0.22
Delayed 0.40 (0.82) 0.30 (0.98) 0.10
Test-Worthy Concept Importance, Loose Scoring
M (SD) M (SD)
Pre 0.10 (0.45) 0.25 (0.64) -0.23
Immediate 5.50 (2.42) 5.10 (3.34) 0.12
Delayed 1.10 (1.37) 1.00 (1.78) 0.06
Not Test-Worthy Concept Importance, Strict Scoring
M (SD) M (SD)
Pre 0.00 (0.00) 0.10 (0.31) -0.32
Immediate 2.25 (1.41) 2.25 (2.40) 0.00
Delayed 0.80 (1.32) 0.50 (0.95) 0.32
Not Test-Worthy Concept Importance, Loose Scoring

M (SD) M (SD)
Pre 0.00 (0.00) 0.20 (0.41) -0.49
Immediate 4.25 (1.89) 3.75 (2.51) 0.20
Delayed 1.35 (2.03) 1.00 (1.49) 0.23
______________________________________________________________________________
Note. Effect sizes around .20 are considered small, around .50 medium, and around .80 high
(Cohen, 1988).
Table 4
Means and Standard Deviations for the Pre-, Immediate, and Delayed Tests for the Text-Structure
Strategy and Traditional Instruction Conditions for Main Idea Text Passage, Habituation
Test Text Structure Traditional Effect Size
(Xe-Xc/SDc)
Test-Worthy Concept Importance, Strict Scoring
M (SD) M (SD)
Pre 0.00 (0.00) 0.00 (0.00) --------
Immediate 1.50 (2.14) 0.70 (1.17) 0.68
Delayed 1.25 (2.92) 0.00 (0.00) --------
Test-Worthy Concept Importance, Loose Scoring
M (SD) M (SD)
Pre 0.00 (0.00) 0.00 (0.00) --------
Immediate 3.50 (1.82) 2.80 (1.88) 0.37
Delayed 1.10 (1.65) 0.70 (1.34) 0.30
Not Test-Worthy Concept Importance, Strict Scoring
M (SD) M (SD)
Pre 0.00 (0.00) 0.00 (0.00) --------
Immediate 1.85 (2.80) 1.75 (1.29) 0.08
Delayed 0.70 (0.70) 0.30 (0.66) 0.61
Not Test-Worthy Concept Importance, Loose Scoring
M (SD) M (SD)
Pre 0.00 (0.00) 0.00 (0.00) --------
Immediate 3.15 (1.69) 2.85 (1.46) 0.21
Delayed 1.15 (1.69) 0.65 (1.31) 0.38
______________________________________________________________________________
Note. Effect sizes around .20 are considered small, around .50, medium, and around .80, high
(Cohen, 1988).
Table 5
Means and Standard Deviations for the Pre-, Immediate, and Delayed Tests for the Text-Structure
Strategy and Traditional Instruction Conditions for the Combined Main Idea Text Passages,
Solar Cells and Habituation
Test Text Structure Traditional Effect Size
(Xe-Xc/SDc)
Test-Worthy Concept Importance, Strict Scoring
M (SD) M (SD)
Pre 0.00 (0.00) 0.00 (0.45) 0.00
Immediate 5.10 (3.01) 3.70 (3.20) 0.44
Delayed 1.65 (3.30) 0.30 (0.98) 1.38
Test-Worthy Concept Importance, Loose Scoring
M (SD) M (SD)
Pre 0.10 (0.45) 0.25 (0.64) -0.23
Immediate 9.00 (3.52) 7.90 (4.42) 0.25
Delayed 2.20 (2.42) 1.70 (2.27) 0.22
Not Test-Worthy Concept Importance, Strict Scoring
M (SD) M (SD)
Pre 0.00 (0.00) 0.10 (0.31) -0.32
Immediate 4.10 (2.27) 4.00 (3.15) 0.03
Delayed 1.50 (2.12) 0.80 (1.32) 0.53
Not Test-Worthy Concept Importance, Loose Scoring
M (SD) M (SD)
Pre 0.00 (0.00) 0.20 (0.41) -0.49
Immediate 7.40 (2.80) 6.60 (3.30) 0.24
Delayed 2.50 (2.98) 1.65 (1.87) 0.45
______________________________________________________________________________
Note. Effect sizes around .20 are considered small, around .50, medium, and around .80, high
(Cohen, 1988).
Table 6
Means and Standard Deviations for the Pre-, Immediate, and Delayed Tests for the Text-
Structure Strategy and Traditional Instruction Conditions with the Compare-and-Contrast Text Passage,
Kinetic Energy and Potential Energy
Test Text Structure Traditional Effect Size

(Xe-Xc/SDc)
Test-Worthy Concept Importance, Strict Scoring
M (SD) M (SD)
Pre 0.40 (1.05) 0.30 (1.00) 0.10
Immediate 4.80 (3.33) 6.10 (5.00) -0.26
Delayed 2.10 (2.20) 1.10 (2.00) 0.50
Test-Worthy Concept Importance, Loose Scoring
M (SD) M (SD)
Pre 0.90 (2.00) 0.50 (1.82) 0.22
Immediate 6.90 (3.08) 7.00 (3.87) -0.03
Delayed 3.70 (2.92) 1.65 (2.46) 0.83
Not Test-Worthy Concept Importance, Strict Scoring
M (SD) M (SD)
Pre 0.20 (0.70) 0.00 (0.00) --------
Immediate 2.80 (1.91) 3.70 (3.18) -0.28
Delayed 1.45 (2.16) 0.65 (1.31) 0.61
Not Test-Worthy Concept Importance, Loose Scoring
M (SD) M (SD)
Pre 0.50 (1.00) 0.05 (0.22) 2.05
Immediate 4.50 (2.28) 5.10 (2.86) -0.21
Delayed 2.45 (2.48) 1.40 (1.79) 0.59
_____________________________________________________________________________________
Note. Effect sizes around .20 are considered small, around .50, medium, and around .80, high

(Cohen, 1988).
Table 7
Means and Standard Deviations for the Pre-, Immediate, and Delayed Tests for the Text-Structure
Strategy and Traditional Instruction Conditions for Compare-and-Contrast Text Passage,
Oligotrophic Lakes and Eutrophic Lakes
Test Text Structure Traditional Effect Size
(Xe-Xc/SDc)
Test-Worthy Concept Importance, Strict Scoring
M (SD) M (SD)
Pre 0.00 (0.00) 0.00 (0.00) --------
Immediate 7.10 (4.52) 6.50 (4.58) 0.13
Delayed 3.50 (3.30) 2.30 (2.99) 0.40
Test-Worthy Concept Importance, Loose Scoring
M (SD) M (SD)
Pre 0.00 (0.00) 0.00 (0.00) --------
Immediate 8.75 (4.24) 8.70 (4.12) 0.01
*Delayed 6.30 (3.96) 3.15 (3.54) 0.89
Not Test-Worthy Concept Importance, Strict Scoring
M (SD) M (SD)
Pre 0.05 (0.22) 0.00 (0.00) --------
Immediate 2.70 (2.62) 2.10 (1.55) 0.39
Delayed 1.00 (1.21) 0.45 (0.76) 0.72
Not Test-Worthy Concept Importance, Loose Scoring

M (SD) M (SD)
Pre 0.05 (0.22) 0.00 (0.00) --------
Immediate 3.05 (1.57) 3.45 (1.85) -0.22
Delayed 2.10 (1.74) 1.25 (1.16) 0.73
*p < .05.
Note. Effect sizes around .20 are considered small, around .50, medium, and around .80, high
(Cohen, 1988).
Table 8
Means and Standard Deviations for the Pre-, Immediate, and Delayed Tests for the Text-Structure
Strategy and Traditional Instruction Conditions for the Combined Compare-and-Contrast Text Passages,
Kinetic Energy and Potential Energy and Oligotrophic Lakes and Eutrophic Lakes
Test Text Structure Traditional Effect Size
(Xe-Xc/SDc)
Test-Worthy Concept Importance, Strict Scoring
M (SD) M (SD)
Pre 0.40 (1.05) 0.30 (0.98) 0.10
Immediate 11.90 (5.96) 12.60 (8.26) -0.08
Delayed 5.60 (4.52) 3.40 (3.19) 0.69
Test-Worthy Concept Importance, Loose Scoring
M (SD) M (SD)
Pre 0.90 (2.00) 0.50 (1.82) 0.22
Immediate 15.65 (5.87) 15.70 (7.12) -0.00

*Delayed 10.00 (5.91) 4.80 (3.82) 1.36
Not Test-Worthy Concept Importance, Strict Scoring
M (SD) M (SD)
Pre 0.25 (0.72) 0.00 (0.00) --------
Immediate 5.50 (3.75) 5.80 (4.21) -0.07
Delayed 2.45 (2.93) 1.10 (1.89) 0.71
Not Test-Worthy Concept Importance, Loose Scoring
M (SD) M (SD)
Pre 0.55 (1.00) 0.05 (0.22) 2.27
Immediate 7.55 (2.84) 8.55 (4.08) -0.25
*Delayed 4.55 (3.71) 2.65 (2.48) 0.77
*p < .05.
Note. Effect sizes around .20 are considered small, around .50, medium, and around .80, high
(Cohen, 1988).
Table 9
Means and Standard Deviations for the Pre-, Immediate, and Delayed Tests for the Text-Structure
Strategy and Traditional Instruction for the Sum of the Combined Score of All Main Idea and
Compare-and-Contrast Text Passages
Test Text Structure Traditional Effect Size
(Xe-Xc/SDc)
Test-Worthy Concept Importance, Strict Scoring
M (SD) M (SD)
Pre 0.40 (1.05) 0.40 ( 1.39) 0.00

Immediate 17.00 (7.75) 16.30 (10.39) 0.07
Delayed 7.25 (6.32) 3.70 ( 3.45) 1.03
Test-Worthy Concept Importance, Loose Scoring
M (SD) M (SD)
Pre 1.00 (2.10) 0.75 ( 2.27) 0.11
Immediate 24.65 (7.27) 23.60 (10.19) 0.10
*Delayed 12.20 (7.48) 6.50 ( 5.16) 1.10
Not Test-Worthy Concept Importance-Strict Scoring
M (SD) M (SD)
Pre 0.25 (0.72) 0.10 ( 0.31) 0.48
Immediate 9.60 (5.42) 9.80 ( 6.49) -0.03
Delayed 7.25 (6.32) 3.70 ( 3.45) 1.03
Not Test-Worthy Concept Importance, Loose Scoring
M (SD) M (SD)
Pre 0.55 (1.00) 0.25 ( 0.55) 0.55
Immediate 14.95 (4.66) 15.15 (6.77) -0.03
*Delayed 12.20 (7.48) 6.50 (5.16) 1.10
*p < .05.
Note. Effect sizes around .20 are considered small, around .50, medium, and around .80, high
(Cohen, 1988).
Allsopp, D. H., Minskoff, E. H., & Bolt, L. (2005). Individualized course-specific strategy instruction for college students with learning disabilities and ADHD: Lessons learned from a model demonstration project. Learning Disabilities Research & Practice, 20(2), 103-118.
Anderson, R., Hiebert, E., Scott, J., & Wilkinson, I. (1985). Becoming a nation of readers: The report of the commission on reading. Washington, DC: National Institute of Education.

Archer, A. L., Gleason, M. M., & Vachon, V. L. (2003). Decoding and fluency: Foundation skills for struggling older readers. Learning Disability Quarterly, 26, 89-101.
Bacon, E. H., & Carpenter, D. (1989). Learning disabled and nondisabled college students' use of structure in recall of stories and text. Learning Disability Quarterly, 12, 108-118.
Bakken, J. P., Mastropieri, M. A., & Scruggs, T. E. (1997). Reading comprehension of expository science material and students with learning disabilities: A comparison of strategies. Journal of Special Education, 31(3), 300-324.
Bryant, D. P., Goodwin, M., Bryant, B. R., & Higgins, K. (2003). Vocabulary instruction for students with learning disabilities: A review of the research. Learning Disability Quarterly, 26, 117-128.
Chan, L. K. S., & Cole, P. G. (1986). The effects of comprehension monitoring training on the reading competence of learning disabled and regular class students. Remedial and Special Education, 7(4), 33-40.
Cohen, J. (1988). Statistical power analysis of the behavioral sciences (2nd ed.). Hillsdale, NJ: Lawrence Erlbaum Associates, Inc.
Deshler, D. D. (2005). Adolescents with learning disabilities: Unique challenges and reasons for hope. Learning Disability Quarterly, 28, 122-124.
Deshler, D. D., Ellis, E. S., & Lenz, B. K. (1996). Teaching adolescents with learning disabilities (2nd ed.). Denver, CO: Love.
Fuchs, L. S., Fuchs, D., & Kazdan, S. (1999). Effects of peer-assisted learning strategies on high school students with serious reading problems. Remedial and Special Education, 20(5), 309-318.
Gajar, A. (1992). Adults with learning disabilities: Current and future research priorities. Journal of Learning Disabilities, 25(8), 507-519.
Gerber, P. J., Schnieders, C. A., Paradise, L. V., Reiff, H. B., Ginsberg, R. J., & Popp, P. A. (1990). Persisting problems of adults with learning disabilities: Self-reported comparisons from their school-age and adult years. Journal of Learning Disabilities, 23(9), 570-573.
Gersten, R., Fuchs, L. S., Williams, J. P., & Baker, S. (2001). Teaching reading comprehension strategies to students with learning disabilities: A review of research. Review of Educational Research, 71(2), 279-320.
Graves, A. W. (1986). Effects of direct instruction and meta-comprehension training on finding main ideas. Learning Disabilities Research, 1(2), 90-100.

Gurney, D., Gersten, R., Dimino, J., & Carnine, D. (1990). Story grammar: Effective literature instruction for high school students with learning disabilities. Journal of Learning Disabilities, 23(6), 335-348.
Heiman, T., & Kariv, D. (2004). Manifestations of learning disabilities in university students: Implications for coping and adjustment. Education, 125(2), 313-324.
Henderson, C. (2001). College freshman with disabilities: A biennial statistical profile. Washington, DC: American Council on Education, Heath Resource.
Horton, S. V., Lovitt, T. C., Givens, A., & Nelson, R. (1989). Teaching social studies to high school students with academic handicaps in a mainstreamed setting: Effects of a computerized study guide. Journal of Learning Disabilities, 22(2), 102-107.
Idol, L. (1987). Group story mapping: A comprehension strategy for both skilled and unskilled reading. Journal of Learning Disabilities, 20(4), 196-205.
Madaus, J. W. (2006). Employment outcomes of university graduates with learning disabilities. Learning Disability Quarterly, 29, 19-31.
Madaus, J. W., & Shaw, S. F. (2006).The impact of the IDEA 2004 on transition to college for students with learning disabilities. Learning Disabilities Research & Practice 21(4), 273-281.
Mastropieri, M. A., & Scruggs, T. E. (2004). The inclusive classroom (2nd ed.). Upper Saddle River, NJ: Merrill; Prentice Hall.
Mastropieri, M. A., Scruggs, T. E., & Graetz, J. E. (2003). Reading comprehension instruction for secondary students: Challenges for struggling students and teachers. Learning Disability Quarterly, 26, 103-116.
Meyer, B.J.F., & Freedle, R. O. (1984). Effects of discourse type on recall. American Educational Research Journal, 21(1), 121-143.
Mull, C., Sitlington, P. L., & Alper, S. (2001). Postsecondary education for students with learning disabilities: A synthesis of the literature. Exceptional Children, 68(1), 97-118.
National Institute of Child Health and Human Development. (1999). Why children succeed or fail at reading. Retrieved March 27, 2001, from http://www.nichd.nih.gov/publications/pubs/readbro.htm.
Proctor, B. E., Prevatt, F., Adams, K., Hurst, A., & Petscher, Y. (2006). Study skills profiles of normal-achieving and academically-struggling college students. Journal of College Student Development, 47(1), 37-51.

Pugh, S. L., Pawan, F., & Antommarchi, C. (2000). Academic literacy and the new college learner. In R. F. Flippo & D. C. Caverly (Eds.), Handbook of college reading and study strategy research (pp. 25-42). Mahwah, NJ: Lawrence Erlbaum.
Rothstein, L. F. (2000). Special education law (3rd ed.). New York: Addison Wesley Longman.
Saenz, L. M., & Fuchs, L. S. (2002). Examining the reading difficulty of secondary students with learning disabilities. Remedial and Special Education, 23(1), 31-41.
Section 504 of the Rehabilitation Act. Pub. L. No. 93-112. (1973).
Smith, P. L., & Friend, M. (1986). Training learning disabled adolescents in a strategy for using text structure to aid recall of instructional prose. Learning Disabilities Research, 2, 38-44.
Swanson, H. L. (1999). Reading research for students with LD: A meta-analysis of intervention outcomes. Journal of Learning Disabilities, 32(6), 504-532.
Talbott, E., Lloyd, J. W., & Tankersley, M. (1994). Effects of reading comprehension interventions for students with learning disabilities. Learning Disability Quarterly, 17(3), 223-232.
Taylor, B. (1980). Memory for expository text. Reading Research Quarterly, 15(3), 399-411.
Torgesen, J. K. (1986). Learning disabilities theory: Its current state and future prospects. Journal of Learning Disabilities, 19(7), 399-407.
Trainin, Gl, & Swanson, H.L. (2005). Cognition, metacognition, and achievement of college students with learning disabilities. Learning Disabilities Quarterly, 28(4), 261-272.
U.S. Department of Education, 2005
Vogel, S. A., & Adelman, P. B. (1992). The success of college students with learning disabilities: Factors related to educational attainment. Journal of Learning Disabilities, 25(7), 430-441.
Wagner, M., Newman, L., Cameto, R., Levine, P., & Garza, N. (2006). An overview of findings from Wave 2 of the National Longitudinal Transition Study-2 (NLTS2) (NCSER 2006-3004). Menlo Park, CA: SRI International.
Warde, B. A. (2005). Reading miscues of college students with and without learning disabilities. Journal of College Reading and Learning, 36(1), 21-36.
Wong, B.Y.L., & Wilson, M. (1984). Investigating awareness of a teaching passage organization in learning disabled children. Journal of Learning Disabilities, 17(8), 477-482.

Worden, P. E., Malmgren, I., & Gabourie, P. (1982). Memory for stories in learning disabled adults. Journal of Learning Disabilities, 15(3), 145-152.
References
About the Authors
Stephanie Gaddy, Ed.D., is the founder and the director of the Office for Disability Services and the ACCESS Program, an academy for students with ADHD, at Lincoln College in Lincoln, Illinois. Her main research interest is the promotion of success for students with disabilities at the postsecondary level. She can be reached by email at [email protected].
Jeffrey P. Bakken, Ph.D., is Professor and Interim Chair in the Department of Special Education at Illinois State University. His specific areas of interest include transition, teacher effectiveness, assessment, learning strategies, and technology. He has written more than 75 academic publications, including a book, journal articles, chapters, monographs, reports, and proceedings; and he has made over 180 presentations at local, state, regional, national, and international levels. Additionally, he is on the editorial boards of many scholarly publications, including Multicultural Learning and Teaching, Remedial and Special Education, and Multiple Voices. He can be reached by email at [email protected].
Barbara M. Fulk, Ph.D., is a Professor in the Department of Special Education at Illinois State University. She teaches courses related to methods for teaching diverse learners, consultation and collaboration, and assessment. Barbara has published about cognitive strategies for students with mild disabilities, motivation and transition planning. She can be reached by email at [email protected].
Practice Brief
The Chronic Illness Initiative:
Supporting College Students with Chronic Illness
Needs at DePaul University
Lynn Royster
DePaul University
Olena Marshall
DePaul University
Abstract
College students with chronic illness find it difficult to succeed in traditional degree programs due to disruptions caused by relapses and unpredictable waxing and waning symptoms. College disability offices are often unable to help, both because their standard supports are not appropriate and because students with chronic illness frequently do not identify themselves as having a disability. This Practice Brief discusses the need for specific programs tailored to the culture of postsecondary students with chronic illness. The Chronic Illness Initiative at DePaul University is presented as a model for such programs.
People who suffer from severe and debilitating chronic illnesses such as chronic fatigue syndrome (CFS), lupus, rheumatoid arthritis, cancer, or heart disease represent a large segment of the U.S. population.1 Childhood chronic illnesses are affecting ever more children, and college students are also increasingly unhealthy (Perrin, Bloom, & Gortmaker, 2007; Shieu, 2001). This development has led to rising insurance, health care, and social costs, as well as increased attention to the needs and rights of people with chronic illness in the workplace. However, we believe that the nation’s colleges and universities have yet to recognize both the significance of this development and its implications for traditional faculty-student relationships, student support services, and the strict time structures that frame college life. The Chronic Illness Initiative (CII) at DePaul University offers specific, research- and experience-based approaches to serve chronically ill students. These approaches provide a model for accommodating the needs of students with chronic illness in the university setting.
In the fall of 2000, U.S. four-year colleges enrolled nearly 10,000 students with health-related disabilities, which included conditions such as severe allergies, cystic fibrosis, cancer, lupus, or multiple sclerosis. Students with these conditions represented 15% of all students with disabilities enrolled as first-time, full-time students in four-year colleges (American Council on Education, 2001). However, this number does not begin to reflect the actual number of students with health-related disabilities in the higher education system. Many do not identify themselves as having a disability and are, therefore, not counted in disability rolls. Others enroll in two-year programs or return after contracting an illness after their freshmen year.
Students with disabilities often experience difficulties related to attaining a postsecondary degree (National Council on Disability, 2003). In addition to problems that are common to all students with disabilities, students with chronic illness face specific issues such as an inability to qualify for some financial aid options, unpredictable relapses during the term, and the invisibility of their illnesses, which can make them subject to disbelief and claims of malingering. Furthermore, needs of students with chronic illness are often overlooked by college disability staffs who do not understand the waxing and waning symptoms and unpredictable relapses experienced by the chronically ill (Jung, 2003). As Beatty (2001) points out, diseases such as multiple sclerosis, asthma, and lupus are characterized by flares of activity followed by periods of remission. These unpredictable shifts in wellness level lead to loss of spontaneous behavior, uncertainty, ambiguity, loss of independence and control, reduced options for employment, and inability to complete college courses.
In the context of a university, the needs and wants of students with chronic illness tend to differ from the institutional resources and privileges that can be routinely offered. Unlike students whose disabilities can be accommodated through a one-time expenditure of funds and

administrative activity (e.g., students who simply need access to a building or require a piece of specialized adaptive equipment), students with chronic illness require accommodations that must continually be negotiated, adapted, and arranged (Jung, 2003). Often, students themselves have little understanding of their illnesses or how to address their illness needs, are not skilled at self-advocacy, and do not know how to find a postsecondary option that will meet their needs. “This lack of information and inability to develop coping strategies in postsecondary settings often results in students dropping out of the educational program,” before they can acquire a degree or other credentials for employment (Edelman, Schuyler, & White, 1998, p. 2). This is unfortunate because education, which leads to better paid and more professional employment, is an important social determinant of health and a crucial component in resisting downward mobility for those with chronic, incurable illness (Jung, 2002).
Problem
Support for the health-related educational needs of students with chronic illness plays a large role in whether these students succeed in college. Traditional college and university programs do not systematically offer students accommodations that take into account the unpredictable nature of their chronic conditions, in part because students do not disclose information about their health conditions, in part because their needs are not well understood. From the students who have joined the CII, DePaul faculty and administrators have learned that students frequently end up distressed academically, financially, and emotionally, having made multiple attempts to attend school that have resulted in strings of withdrawals, incompletes, or failing grades despite often outstanding academic capabilities. Most of the CII students are low-income; yet they have spent thousands trying to attend college, losing much of it because they could not finish courses within the traditional constraints of time and place. The CII was developed to serve this large population of people with health-related disabilities and significant unmet educational support needs.
Students and Location Information: The Chronic Illness Initiative at DePaul University
The CII is a comprehensive educational assistance program that focuses specifically on accommodations for students with chronic illness. The program fits well with DePaul University’s mission of providing educational access.2 Housed within the School for New Learning (SNL), the CII reaches out to students who, in the words on one student, may have experienced setbacks due to illness but did not lose all hope for a college education. She wrote: “I’m 20 years old and have chronic fatigue, fibromyalgia, and Crohn’s disease. In the past three years since I graduated high school, I’ve tried to go to college twice and always ended up getting sick and never making it.”
The program was founded in late 2003 by one part-time person, who acted as administrator, advisor, and faculty. This person, one of the co-authors, Lynn Royster, JD, PhD, created the concept for the CII after watching her own chronically ill son try to get an education. Since then, the CII has grown rapidly to recruit more than 200 students, and has expanded its administrative, advising, research, and support staff.
Students who sign up to participate in the CII enroll in degree programs offered by SNL. Nationally known for serving nontraditional students, SNL embodies many features (e.g.,

commitment to distance learning, a student-centered approach to college education, and faculty and staff skilled at educating students who lead complex lives) that make it a natural home for the CII. Students may earn a BA degree from SNL on campus and via a state-of-the-art distance education program; even the MA program includes some on-line features. The on-line option makes it possible for homebound and even bedridden students to earn college degrees and allows students, faculty, and administrators to manage relapses and hospitalizations more smoothly. Because the on-line option adds flexibility to the education process, specific class times or the demands of physical travel do not prevent students from taking a class. Not surprisingly, about 80% of the CII students take advantage of this option for all or a part of their degree programs.
Strategy
The hallmark of the CII is respect and compassion for students and a sincere desire to help them. All CII staff members operate from this perspective. CII staff also work to educate faculty and staff about issues related to chronic illness so that they may respond appropriately and compassionately. By actively advocating on students’ behalf, CII staff help both students and faculty to avoid the misunderstanding and mistrust that many students have experienced prior to coming to DePaul. At the core of the program are student support services, which aim to accommodate students’ health-related needs as they pursue undergraduate and graduate degrees at DePaul’s SNL. The staff include a director, an advisor/assistant director for student services, and a research associate (all part time) as well as several student workers, each of whom is engaged for a few hours each week to perform administrative tasks, develop an instructional video about the CII, create a financial aid resource guide, and serve as a buddy. The CII is also forming a Family and Friends Group that will engage additional volunteers. One parent of a CII student is working part-time for the CII as a public awareness coordinator.
Student Support Services
Although chronic illnesses encompass a wide range of symptoms and health conditions, they share an important characteristic: an unpredictable waxing and waning course of illness with recurring relapses and hospitalizations. Unlike more traditional and better understood disabilities that can be addressed by specific solutions, such as wheelchair access, hearing aids, or readers, chronic illnesses require ongoing flexible accommodations. For this reason, CII services assist students with health crises and the administrative burdens that arise from them, including college financing. CII staff work with the school’s faculty and administration to craft exceptions to traditional policies when necessary.
Several specific supports are offered. A special CII advisor advocates for students with chronic illness, coordinates their questions and accommodations, acts as a liaison between students and faculty, and minimizes administrative issues that can be overwhelming for an ill person. This advisor also works closely with the financial aid office to help navigate the confusing maze of financial aid options.
The CII has an endowed scholarship of $57,000 and also receives occasional annual scholarship donations from other sources. It offers an annual service award to a person (usually a student) who has supported the program. The CII employs students with chronic illness to provide them

with work experience and with additional income that helps offset education costs. The CII staff networks with internal student support services at DePaul and with community providers (ranging from support groups to service agencies) to help CII students take advantage of external supports.
CII staff members pay attention to the social integration of CII students, whether they attend classes on campus or online. The staff design academic and social events that allow students to validate their experiences, discuss effective strategies for managing illness and college, or simply build new relationships. A special program for 18 to 23-year-olds called Inside Track helps students adapt to the college environment and acquire skills that their older peers have developed. The CII’s Buddy Program links each new student, regardless of age, to an experienced CII peer. Each fall, the CII conducts a meet-and-greet gathering for all students, setting a stage for social and academic interactions throughout the academic year. Two new programs pioneering fall 2007 are a counselor-led support group, and a peer discussion forum. Other social interaction venues, such as interactive guest chats, are in the works.
The CII director has designed and teaches a new undergraduate course on self-determination and self-advocacy and is planning a course on disability issues. Such courses serve a dual purpose: They engage CII students and also inform others about disability issues, disability rights and advocacy. For example, a student who took an advocacy and self-determination course began an active veterans group at DePaul as part of his class project.
Outreach
To reach potential students and serve others enrolled at DePaul, the CII has developed networks among disability-related groups, private and governmental service agencies, and counselors in high schools and community colleges. For example, the Chronic Fatigue Syndrome, Fibromyalgia, and Chemical Sensitivity Coalition of Chicago, the Chronic Fatigue and Immune Dysfunction Syndrome Association of America, the Lupus Foundation of Illinois, the Pediatric Network, the National Association for the Mentally Ill, and the Multiple Sclerosis Society have all worked with DePaul on disability-related issues. These and many other groups (a) direct parents, potential students, and education and medical professionals to the CII via web links and publications; (b) advise the CII on research, disability services, and community resources; and (c) participate in an annual symposium on higher education and health-related disability issues. So far, the CII has hosted three successful symposia (May 2005, 2006, and 2007), whose audiences have evolved from local to national. The symposia bring together community service agencies, government agencies, hospitals, other colleges and universities, high school guidance counselors, patient support groups, experts on chronic illness, students, and parents.
Through its extensive collaborations and public awareness efforts, the CII reaches program beneficiaries (students, potential students, parents, employers, educational institutions, and disability groups) well beyond DePaul. Because most ill students find the distance education program very accessible, the program serves CII students all over the country. It has recently received inquiries from Canada, Thailand, England, Italy, and Ireland. In recent months the program has received, on average, five inquiries per week from potential students. About 50% of such inquiries result in people applying to the CII.
Rapidly growing CII enrollment, reflecting a considerable demand for chronic illness-related services, has moved DePaul University to expand the breadth and depth of services and outreach, build internal and external partnerships, and undertake efforts to build national awareness about the capacities and needs of people with chronic illness among employers, colleges, universities, and the public. The CII has also raised more than $60,000 in scholarship funds and more than $80,000 in program funds to support the services provided to students.
Infrastructure Development
One of the most important, yet least heralded, aspects of the CII has been the development of an administrative structure to support the services offered to students with chronic illness and integration of the CII into the administrative and budget structures of the university. From its founding, CII obtained support and approval from the dean of the SNL and the faculty organization, who recognized that the issue of chronic illness was connected to the School’s mandate to educate non-traditional students and reflective of DePaul’s Vincentian mission to serve the disadvantaged.
Outcomes
The CII has brought about several important positive outcomes. First, awareness of and interest in the program have increased, as evidenced in accelerating inquiries from parents, potential students, and counselors, and in growing college enrollments (from 50 students in 2005 to more than 200 students in 2007). Local and national illness-related groups enthusiastically support the CII. Media have also praised the program in detailed publications about the educational needs of college students with chronic illnesses. Most recently, two articles appeared in the Chicago Sun-Times (Newbart, 2007, pp. 12 & 13), highlighting the program and several of its students, and both Inside Higher Ed and University Business have featured it.
As an academic support program just approaching its four-year mark, the CII is beginning to generate sufficient longitudinal data on student academic performance, retention, and progress toward degrees to allow for valid comparisons with other reference groups such as the general undergraduate population or the non-CII student population within the SNL. The DePaul University Office of Institutional Planning and Research has generated some preliminary comparisons that cast CII student performance in positive light. The end-of-year grade-point average (GPA) for CII students of 2.31 is comparable to that of the non-CII students (2.06). The inactive not-passing rates for CII students are lower than those for non-CII students. Overall, CII students are more likely to continue to their second academic year than non-CII students: Average first-year retention rate for CII students was significantly greater than the average first-year retention rate for non-CII students. Five students have graduated with BA degrees. Finally, in addition to helping students to get an education, the CII has provided work opportunities to several students, thus showcasing their abilities and giving them much needed job experience and extra income.
Implications

Given the increased incidence of and national attention to chronic illness, the CII’s targeted educational support program is likely to be one that other American colleges and universities may have to adopt. Growing numbers of young people with illnesses such as asthma and diabetes, war veterans returning from the Middle East with permanent health-related problems, and increasing numbers of adults returning to school will swell the numbers of such students. The CII combines compassionate attitudes and specific methods within a flexible program to help students with chronic illness succeed in college and builds public awareness about the needs and capabilities of this population.
References
American Council on Education. (2001). College freshmen with disabilities. A biennial statistical profile. Retrieved September 11, 2007, from http://www.heath.gwu.edu/files/active/0/college_freshmen_w_disabilities.pdf
Beatty, J. E. (2001). Chronic illness identity in the workplace. Submitted to the Gender and Diversity in Organizations Division for the 2001 Conference of the Academy of Management. Retrieved July 12, 2004, from http://www2.bc.edu/~beattyjc/ci_acad_4-24-01.html
Edelman, A., Schuyler, V., & White, P. (1998). Maximizing success for young adults with chronic health-related illnesses. Transition planning for education after high school. American Council on Education. Health Resource Center. Retrieved September 11, 2007, from http://eric.ed.gov
Jung, K. (2003). Chronic illness and academic accommodation: Meeting disabled students’ “unique needs” and preserving the institutional order of the university. Journal of Sociology and Social Welfare, 30(1), 91-112.
Jung, K. (2002). Chronic illness and educational equity: The politics of visibility. National Women’s Studies Association Journal, 14(3), 178-200.
National Council on Disability. (2003). People with disabilities and postsecondary education. Retrieved September 11, 2007, from http://www.ncd.gov/newsroom/publications/2003/education.htm
Newbart, D. (2007, May 28). A chronic problem on campus: Illnesses such as chronic fatigue syndrome and MS make it tough for college kids to make it through. Chicago Sun-Times, p. 12.
Newbart, D. (2007, May 28). DePaul may be first school with program that can help. Students can take courses online, miss tests and not worry. Chicago Sun-Times, p. 13.
Perrin, J. M., Bloom, S. R., & Gortmaker, S. L. (2007). The increase of childhood conditions in the United States. Journal of the American Medical Association, 297, 2755-2759.
Redden, E. (2007, Nov. 8). Reaching students with Chronic Illness. Inside Higher Ed.
Shieu, S. (2001). Issues in the education of students with chronic illness. International Journal of Disability, Development and Education, 48(3), 269-281.
30 Smart Business Ideas: succesful business processes and practices to consider. University Business, (2007, December).
Endnotes
1 According to the U.S. Department of Health and Human Services, Center for Disease Control and Prevention, “chronic diseases such as heart disease, cancer, and diabetes are leading causes of disability and death in the United States. Every year, chronic diseases claim the lives of more than 1.7 million Americans. These diseases are responsible for 7 of every 10 deaths in the United States. Chronic diseases cause major limitations in daily living for more than 1 of every 10 Americans, or 25 million people. These diseases account for more than 70% of the $1 trillion spent on health care each year in the United States.” http://www.cdc.gov/nccdphp/publications/index.htm#2 accessed on September 10, 2007.
2 Founded in 1898, DePaul University was named for and inspired by the life of St. Vincent de Paul, who dedicated his life to giving voice to the poor and disenfranchised. The university’s historic mission is to offer special assistance to students of high potential who have been handicapped by educational, personal or societal obstacles beyond their control. DePaul has always been committed to educating children of immigrants and first-generation college students, especially those from Chicago’s many diverse cultural and ethnic groups: nearly 30% of DePaul freshmen students are from minority groups and about 30% are first in their families to attend college. With 23,000 students, DePaul is the 10th largest private not-for-profit university.
About the Authors
Lynn Royster, J.D., Ph.D., is founder and Director of the Chronic Illness Initiative at the School for New Learning, DePaul University where she also teaches in the on-line program. She is Vice Chair of the Chronic Fatigue and Immune Dysfunction Syndrome Association of America and the parent of a young man with chronic illness. She can be reached by email at [email protected].
Olena M. Marshall is a senior proposal writer for DePaul University. She has contributed to articles on information systems in the health care industry, issues concerning post-secondary education in computer science, and fundraising. Presently she is researching the occupational identity of elite restaurant chefs. She has an MA in Sociology from DePaul University and a BA in the English Language and Literature from the V.N. Karazin Kharkiv National University (Ukraine). She can be reached by email at [email protected].
Book Review
Rebecca Daly Cofer
Texas Tech University
Mooney, J., & Cole, D. (2000). Learning outside the lines: Two Ivy League students with learning disabilities and ADHD give you the tools for academic success and educational revolution. New York: Simon & Schuster, 286 pp., $14.95.
Learning Outside the Lines, by Jonathan Mooney and David Cole, provides a guide for students with learning disabilities and attention deficit/hyperactivity disorder (ADHD) to maneuver the world of academe, a world that is often challenging and sometimes seems impossible for these students. Mooney and Cole (2000) describe their book as “the guide we wished we had when we began our journey” (p. 21). The book is targeted largely for students struggling with the same learning challenges these authors grew up with, but it can also help parents and professionals alike to understand the difficulties that these “unusual learners” (Mooney and Cole’s term), deal with on a daily basis.. Many professionals in Disability Services deal with challenges that they may have never experienced in school; Learning Outside the Lines allows them to see what a student with a disability deals with every day, not only in terms of academics, but also in terms of self-esteem and performing the more mundane activities of daily living.
Broken in to three separate parts, Learning Outside the Lines begins with the authors’ biographical information, detailing how they met, obstacles that each had to overcome to be successful, and the self-esteem issues that accompanied their disabilities. Mooney, diagnosed with dyslexia in elementary school, dropped out of school in the sixth grade and turned to soccer as a way to value himself. After enrolling in another school, he went on to attend Loyola University and later Brown University, where he met Cole. Cole, diagnosed with ADHD, dropped out of high school at the age of 15. He later turned to drugs to help him deal with the difficult world of academe and life in general, and eventually graduated from the Putney School, a less judgmental and more positive school. The dean had ADHD. Cole then attended Brown University where he met Mooney at transfer orientation.
The second part addresses academic success, such as the stages of the writing process, cramming and test-taking anxiety. Each chapter offers in-text descriptions of the processes presented. For instance, when explaining how to physically use the library when writing research papers, the authors provide three main suggestions: “love the librarian”... “less is more”…”hitting the books, better” (P. 168-169). These authors know what the reader is dealing with, so their explanations are detailed and descriptive, even going so far as to tell the student exactly how to set his/her paper up for a useful set of notes.
Mooney and Cole also give positive affirmation to the reader, interjecting the text with anecdotes about their own struggles with writing, reading, and testing. The last chapter in this second section entitled “Beating the Exam Game,” addresses an issue that many students with ADHD and learning disabilities deal with - test anxiety. Starting with the emotional and physical preparation for the exam and ending with a review of the test from which to learn, the chapter covers every type of exam and the stresses that can arise from each type. Mooney and Cole offer the reader tips for each type of exam, suggesting steps to take when approaching such a test. When dealing with multiple-choice exams, for instance, they write: “[Professors] hide answers by tweaking details or using complicated language like double negatives” (p. 235).
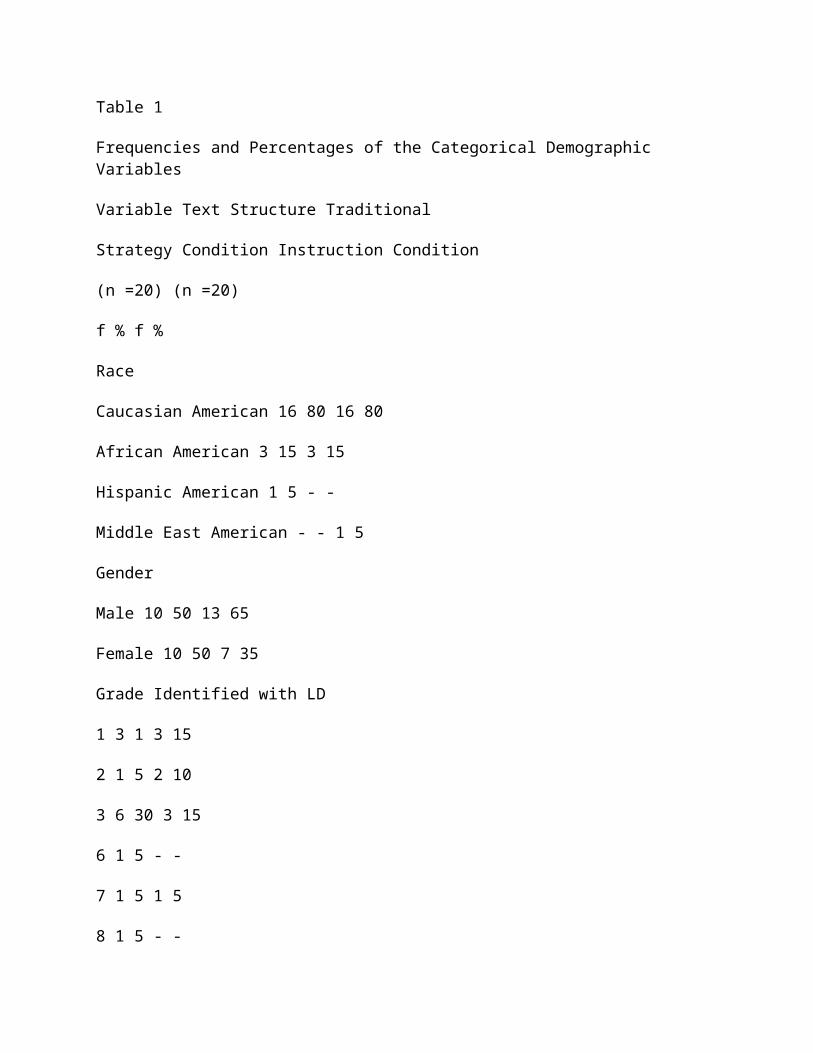
In the concluding part, Learning Outside the Lines dives deeper into its underlining theme, normalcy does not have to be the goal, in fact, living a life less ordinary is a more positive option for many. The final section, aspire the authors to discover “how to find personal empowerment outside of school and how to obtain true academic success by creating new learning environments” (P. 247-248). Mooney and Cole describe an emotional yet sometimes humorous, journey through their own educational experiences, while also providing a how-to guide for academic success for students with learning disabilities and ADHD.
Learning Outside the Lines is not like any other study/guidebook because it is often brutally honest in its discussion of the institution of education and the gauge of academic success used. This is given the extremely negative learning experiences these authors had during their youths. However, Mooney and Cole give the reader solid tools by which to succeed in the academic world. The order of these chapters and sections within the book follows that of a student’s schedule throughout one semester of classes. The conclusion of the text even goes so far as to explain how to succeed outside of college.
The book is written in reader-friendly prose. In addition, it also includes boxes of information and summaries to help the readers digest the material as effectively and smoothly as possible. Mooney and Cole’s Learning Outside the Lines not only provides an emotional account of their own academic successes and failures, but also serves as a tool for students ranging from high school to college age.

Author Guidelines
The Journal of Postsecondary Education and Disability welcomes manuscript submissions that are of an innovative nature and relevant to the theory and practice of providing postsecondary support services to students with disabilities. Manuscripts must be submitted electronically via e-mail to [email protected]
Guidelines for authors are as follows:
Content
Manuscripts should demonstrate scholarly excellence in at least one of the following categories:
• Research: Reports original quantitative, qualitative, or mixed-method research
• Integration: Integrates research of others in a meaningful way; compares or contrasts theories; critiques results; and/or provides context for future exploration.
• Innovation: Proposes innovation of theory, approach, or process of service delivery based on reviews of the literature and research
• Policy Analysis: Provides analysis, critique and implications of public policy, statutes, regulation, and litigation.
Format
All manuscripts must be prepared according to APA format as described in The Publication Manual (5th ed.), American Psychological Association, 2001. For information on changes in the fifth edition, see http://www.apastyle.org/fifthchanges.html. For responses to frequently asked questions about APA style, consult the APA web site at http://www.apastyle.org/faqs.html
• Manuscripts should not exceed 20-25 pages.
• Authors should use terminology that emphasizes the individual first and the disability second (see pages 63-65 of APA Manual). Authors should also avoid the use of sexist language and the generic masculine pronoun.
• Manuscripts should have a title page that provides the names and affiliations of all authors and the address of the principal author. (Authors should refrain from entering their names on pages of the manuscript.)
• An abstract of 100-150 words should accompany all manuscripts. Abstracts must be double-spaced on a separate page.
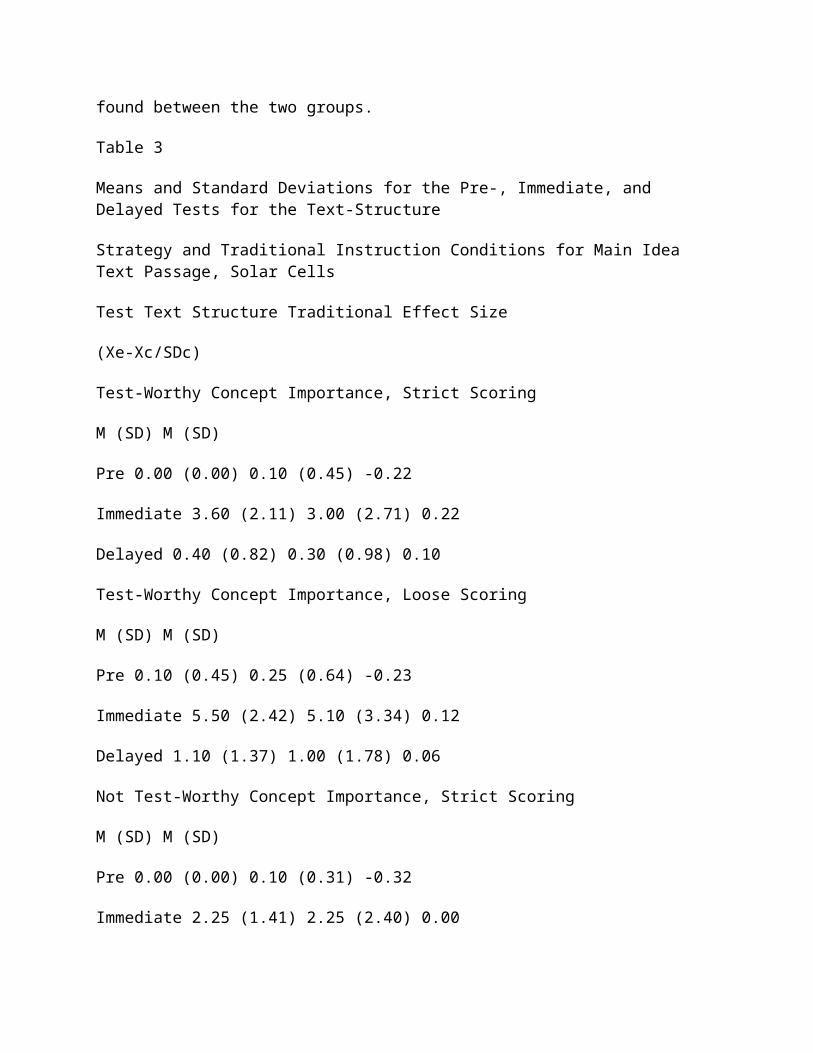
• A cover letter should indicate whether or not the manuscript has been published or submitted elsewhere for consideration of publication.
Please note:
• Do not send original artwork during the manuscript review process; it will be requested upon article acceptance.
Manuscripts must be submitted as email attachments in either Microsoft Word or .RTF format to [email protected]
Upon acceptance for publication
For manuscripts that are accepted for publication, the following items must be provided to the Executive Editor:
• An electronic copy of the final manuscript as an email attachment.
• A 40-50 word bibliographic description for each author.
• A signed and completed Copyright Transfer form.
Manuscript submissions by AHEAD members are especially welcome. The JPED reserves the right to edit all material for space and style. Authors will be notified of changes.
Practice Brief Manuscripts
JPED will devote a few pages of future general issues to a new Practice Brief Section to expand the usefulness of JPED papers to a larger audience. Practice Briefs will consist of good practical strategies and programs used to support postsecondary students with disabilities. The body of the Practice Brief papers will be no more than four typed pages (excluding title page, abstract, reference page, Tables, and Figures). The Practice Briefs will not replace the regular research-based JPED papers. They will provide an opportunity for Postsecondary Disability Service staff to share their best practices. To write a Practice Brief for publication consideration, use the following to develop the paper:
• Title page
• Abstract (no more than 60 words)
• Literature Review (no more than two paragraphs, cite references using APA 5th edition style)
• Problem (one paragraph)
• Students and Location Information

• Strategy
• Observed Outcomes
• Implications
• References
• Tables and Figures (if needed)
If any questions, contact the JPED Editor James Martin at 405-325-8951 or e-mail to: [email protected]
Send your finished papers via e-mail to: [email protected] for publication consideration. Each Practice Brief will be sent to three postsecondary disability direct service staff for review.
![[XLS]events.crewnetwork.orgevents.crewnetwork.org/2012convention/resources/c12_public.xls · Web viewMary Pat Dunleavy CREW Orlando ... Antioch Energy Jaclyn McNally McNeill ... Senior](https://img.pdfslide.net/doc/110x75/5aa0cb757f8b9a7f178e9f21/xls-viewmary-pat-dunleavy-crew-orlando-antioch-energy-jaclyn-mcnally-mcneill.jpg)