Embed Size (px)
Citation preview
Greater Launceston Metropolitan Passenger Transport Plan By foot,
bike or bus
ContentsExecutive Summary............................................................................................................... 5Introduction............................................................................................................................ 7
Vision.................................................................................................................................. 8Plan structure and scope.....................................................................................................8Stakeholder consultation.....................................................................................................9Governance......................................................................................................................... 9Links to other initiatives......................................................................................................9
Background.......................................................................................................................... 11Population growth and demographic change....................................................................11Settlement and transport patterns....................................................................................13Travel patterns..................................................................................................................14
Journey to work..............................................................................................................14Non-commuter travel.....................................................................................................15Student travel................................................................................................................ 16Car travel....................................................................................................................... 16
Bus network.......................................................................................................................... 18Context.............................................................................................................................. 18
Student-only bus services..............................................................................................20General access bus services..........................................................................................22Bus operator contracts...................................................................................................22
Opportunities....................................................................................................................22Reallocation of student-only services.............................................................................22Improving general access services................................................................................23Service integration.........................................................................................................27Bus frequency and timetabling......................................................................................27Bus reliability measures.................................................................................................27Passenger information...................................................................................................28Bus stops........................................................................................................................ 28Bus stop spacing............................................................................................................29Transfers........................................................................................................................ 29
2
Active travel......................................................................................................................... 30Context.............................................................................................................................. 30
Low incidence of active travel to school.........................................................................31Pedestrian demand is not well understood....................................................................32Cars are given higher priority........................................................................................32High speed environment on local streets.......................................................................33Cycling is an under represented mode of transport.......................................................34
Opportunities....................................................................................................................35Travel to school..............................................................................................................35New roads and subdivisions...........................................................................................35Retrofitting walking and cycling infrastructure..............................................................35Address the missing links...............................................................................................37Pedestrian and cyclist friendly activity centres..............................................................38Safer crossing points......................................................................................................39Ensuring new infrastructure is accessible......................................................................40Implement existing plans and proposed projects...........................................................40Develop street design guidelines...................................................................................40Interim design strategies...............................................................................................41Consistent signage and way-finding...............................................................................42
Land use planning................................................................................................................ 43Context.............................................................................................................................. 43
Development patterns...................................................................................................43Opportunities....................................................................................................................44
Integration of land use and transport planning..............................................................44Residential density.........................................................................................................44Development that supports the effective provision of public transport, walking and cycling............................................................................................................................ 45
Transport culture..................................................................................................................46Context.............................................................................................................................. 46
Better data collection to understand travel needs.........................................................46Better provision of transport information can assist behaviour change.........................47Travel plans....................................................................................................................47
3
Implementation.................................................................................................................... 51Action plan 2016-21..........................................................................................................51
Appendix A - Stakeholder consultation.................................................................................58Appendix B - Plan scope.......................................................................................................59Appendix C - Total kilometres travelled................................................................................60Appendix D - Time-area effects............................................................................................62Appendix E - Launceston metropolitan area bus patronage forecast analysis.....................64Appendix F - Travel to school patterns.................................................................................68
4

Final Plan April 2016Front cover photographs courtesy of Metro Tasmania and City of Launceston.
5

Executive SummaryThe Greater Launceston Metropolitan Passenger Transport Plan (the Plan) is a ten-year strategic plan which is designed to improve accessibility, liveability and health outcomes in Greater Launceston by enhancing transport options for those travelling by foot, bike or bus.The Plan contains strategies that are designed to encourage more people to use public transport through improvements in bus travel time and frequency. Identifying and addressing inefficiencies in the bus network, including under-utilised student-only services, is a key element of the Plan. For those with limited mobility, ensuring new bus stops are compliant with the requirements of the Disability Discrimination Act (DDA) will help to improve accessibility.Supporting people to walk and cycle for transport-oriented trips is another key focus area, with the Plan recommending the provision of supporting infrastructure for cyclists and pedestrians. Better integration of transport and land use planning through urban consolidation and locating development more strategically, can reduce the need for travel and encourage use of non-car modes. Improving access to public transport, walking and cycling will help reduce car dependency and enhance access to employment, education and training, particularly for those in the community who may be disadvantaged as a result of economic circumstances, age or disability. Encouraging more people to use active travel will also lead to better health outcomes.This Plan has been developed in consultation with local government, Metro Tasmania, private bus operators and cycling groups. On-going cooperation between these key stakeholders and the Tasmanian Government is vital to the success of this Plan.
6

The objectives and strategies within the Plan are as follows:
Bus networkA more efficient, reliable and accessible public transport network.
Objectives Strategies
Increase bus patronage across the network and increase mode share for bus travel, particularly during peak times.
Improve travel time, frequency and reliability of buses on the network, particularly on key corridors.
Optimise efficiency and effectiveness, and reduce redundancy in the network.
Develop new service standards for public transport provision to guide the development of public transport networks.
Create direct, simple and efficient route patterns that connect activity centres.
Improve co-ordination and integration of services.
Develop bus stops that provide passenger amenity and are accessible, and support wider network improvements such as bus transfers and efficient route design.
Ensure the design and management of our roads supports efficient and reliable bus services.
Improve the provision of consistent, reliable and accessible service information to bus passengers through the use of technology.
Work towards providing consistent branding and marketing of public transport information, services and infrastructure.
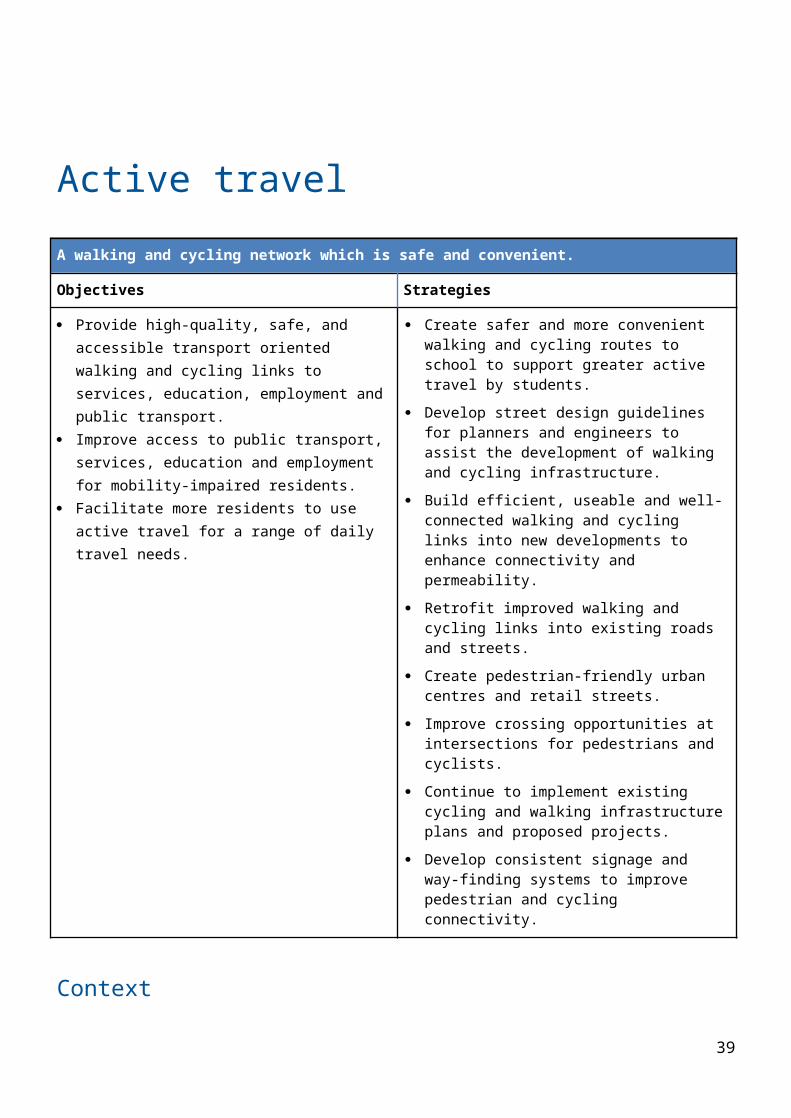
Active travel A walking and cycling network which is safe and convenient.
Objectives Strategies
Provide high-quality, safe, and accessible transport-oriented walking and cycling links to services, education, employment and public transport.
Improve access to public transport, services, education and employment for mobility-impaired residents.
Facilitate more residents to use active travel for a range of daily travel needs.
Create safer and more convenient walking and cycling routes to school to support greater active travel by students.
Develop street design guidelines for planners and engineers to assist the development of walking and cycling infrastructure.
Build efficient, useable and well-connected walking and cycling links into new developments to enhance
7

connectivity and permeability. Retrofit improved walking and cycling
links into existing roads and streets. Create pedestrian-friendly urban centres
and retail streets. Improve crossing opportunities at
intersections for pedestrians and cyclists. Continue to implement existing cycling
and walking infrastructure plans and proposed projects.
Develop consistent signage and way-finding systems to improve pedestrian and cycling connectivity.
Land use planningMore liveable and well connected communities.
Objectives Strategies
A greater level of strategic integration between land use and passenger transport planning.
Development that better supports effective and efficient provision of public transport services.
Greater urban consolidation to increase the number of residents living within walking and cycling distance of activity centres and higher frequency bus routes.
Investigate planning and regulatory mechanisms to provide a stronger link between land use planning and passenger transport.
Provide a bus network plan that is tailored for land use planning purposes to facilitate better integration of land use and transport planning.
Ensure fit for purpose walking and cycling links are incorporated in the design of new developments prior to planning approval.
Transport cultureAn improved understanding of the wider benefits of walking, cycling and public transport.
Objectives Strategies
Work with local Government to develop and implement agreed priorities to support walking, cycling and public transport.
Improve information about public transport, walking and cycling options and ensure it is easily accessible.
Understand passenger travel demand and needs.
Develop quality information for the public to support the wider utilisation of public transport, and uptake of walking and cycling for transport.
Support the development of targeted travel plans and programs to encourage behaviour change toward more
8

sustainable modes, including the development of school-based travel plans.
9

Introduction The Tasmanian Urban Passenger Transport Framework (the Framework) provides the overarching plan for improving passenger transport in Tasmania’s urban areas. In this context, ‘passenger transport’ is defined as the movement of people, focusing on public transport, walking and cycling. As part of the Framework’s development, a study of passenger transport issues was undertaken for Greater Hobart through the Hobart Passenger Transport Case Study. The development of the Greater Launceston Metropolitan Passenger Transport Plan (the Plan) provides the equivalent investigation of passenger transport issues in Greater Launceston. The Plan is a ten-year strategic plan which will guide future passenger transport development and investment in Greater Launceston. Development of the Plan is substantially underpinned by work undertaken in the Background Report (2012) which identifies gaps and problems with the existing passenger transport system in the region.The Plan focuses on improving public transport, walking and cycling, which will lead to higher levels of public transport use and active travel participation. Increasing public transport patronage maximises our investment in the existing road network and bus system and will ensure it is more viable. Providing better public transport services and pedestrian improvements benefits local businesses, by increasing pedestrian presence or ‘footfall’ in activity centres. It also benefits individuals by reducing car dependency and improving affordable access to employment, education and training. Public transport also plays an important role in ensuring people are socially included and improving accessibility for those sectors of the community who are transport disadvantaged. Improving walking and cycling contributes to greater levels of physical activity which has health benefits and enhances the liveability of our urban areas.
VisionThe Plan, in conjunction with the Framework, seeks to create a safe and responsive passenger transport system that supports improved accessibility, liveability and health outcomes for our communities.The Plan seeks to support the following for Greater Launceston:
a more efficient, reliable and accessible public transport network a walking and cycling network which is safe and convenient more liveable and well-connected communities a more vibrant CBD and surrounding activity centres an improved understanding of the wider benefits of walking, cycling and public
transport greater cooperation across government agencies, stakeholders and the community
10

ensuring the transport system can adapt to changing travel needs, preferences and threats by providing more travel choices.
Plan structure and scope The Plan is structured around four strategic areas:
1. bus network2. active travel3. land use planning4. transport culture.
The four strategic areas are linked, and the strategies developed within the Plan reflect the connections between each area. Objectives and strategies underpin each of these strategic areas. A five-year action plan (2015-2020) has also been developed to provide guidance on implementing the strategies identified in this Plan.There are issues closely related to passenger transport that are beyond the scope of this Plan. These include community transport, taxis, ferries and cars. Appendix B provides a more detailed discussion of the Plan’s scope.
Stakeholder consultationA wide range of stakeholders have been involved in the development of the Plan. A working group consisting of representatives from Metro Tasmania and the three councils (City of Launceston, Meander Valley and West Tamar) have guided the development of the Plan. Private bus operators and stakeholders from community and industry advocacy groups have participated in workshops regarding specific issues which have informed the development of strategies within the Plan (refer Appendix A).
GovernanceOn-going coordination and cooperation between key stakeholders is vital to the success of this Plan. Both the Tasmanian and local government, together with Metro and private bus operators have vital roles to play in implementing the Plan. Joint agreement on the strategies and actions is important to gaining funding and resource commitments to implement the Plan successfully. Advocacy and community groups will also play a role in implementing some elements of the Plan.
Links to other initiativesThere are a number of related initiatives that have informed the Plan’s development (see Table 2). The Plan integrates with both the Northern Integrated Transport Plan (2013) and the Greater Launceston Plan (2014). The Northern Integrated Transport Plan provides the regional context for transport issues, while this Plan - Greater Launceston Metropolitan Passenger Transport Plan, provides specific measures for improving public transport, walking and cycling within Greater Launceston.
11

The Greater Launceston Plan provides a long-term strategy for land use planning within Greater Launceston. A number of projects within the Greater Launceston Plan align strongly with the Plan, and are listed below. Mowbray ‘Turn Up and Go’ CBD revitalisation study Metropolitan shared pathways Upgrades to Kings Meadows and Mowbray urban centresThe Tasmanian Government is also developing a Transport Access Strategy, which will focus on improving the coordination and integration of passenger transport services for all Tasmanians, especially the transport disadvantaged.
12

Table 1: Related Initiatives
Level Title AuthorityNational
Urban Transport Strategy 2013 Infrastructure AustraliaOur Cities, Our Future – A national urban policy for a productive, sustainable and liveable future
Department of Infrastructure and Transport
National Cycling Strategy 2011-2016: Gearing up for active and sustainable communities.
AustRoads
State Tasmanian Urban Passenger Transport Framework (2009)
Department of State Growth
Tasmanian Walking and Cycling for Active Transport Strategy
Department of State Growth
Tasmania’s Plan for Physical Activity 2011-2021 Premiers Physical Activity Council
Transport Access Strategy (under development) Department of State GrowthTasmanian Open Space Policy and Planning Framework
Sport and Recreation Tasmania
Positive Provision Policy for Cycling Infrastructure Department of State GrowthTasmanian Planning Scheme Department of Justice
Regional
Northern Integrated Transport Plan (2013) Department of State GrowthRegional Land Use Strategy of Northern Tasmania Northern Tasmania
DevelopmentGreater Launceston Plan Northern councilsPrincipal Urban Cycling Network Department of State GrowthSustainable Transport Strategy 2012-16 UTASNorthern Tasmania Development Housing Study (to be completed)
Northern Tasmania Development
Local Transport Futures City of LauncestonLaunceston Pedestrian Strategy City of LauncestonLaunceston Bike Strategy City of LauncestonLaunceston Safer Roads Strategy City of LauncestonLaunceston City Heart Project City of LauncestonLaunceston CBD Bus Interchange Study City of LauncestonParking and Sustainable Transport Strategy for the City of Launceston
City of Launceston
13

Launceston Traffic Study City of LauncestonLaunceston Public Spaces and Public Life City of LauncestonLaunceston Residential Strategy 2009-2029 City of LauncestonInterim Planning Schemes for Launceston, Meander Valley and West Tamar Councils
Tasmanian Planning Commission and relevant councils
BackgroundGreater Launceston is the major commercial and retail centre for the Northern Region, with a population of around 140 000. The urban area of Launceston, which also includes parts of Meander Valley (Prospect Vale) and West Tamar Councils (Riverside), has a population of 82 000 1.This Plan defines the ‘Greater Launceston’ area as all the Launceston suburbs serviced by Metro Tasmania, and the nearby satellite towns that have an urbanised town centre, such as Legana to the north-west, and Longford, Perth and Evandale to the south (refer Figure 1).
Population growth and demographic changeAlthough under current forecasts Greater Launceston will be the main location for population growth in the Northern Region, future growth is expected to be modest, with an increase of 10 000 by 2032. If this growth occurs in outer urban areas which generally have poor public transport, walking and cycling options, this will increase car dependency and create challenges for the transport network. Greater Launceston has an ageing population, with a declining proportion of young people under 15 years of age (refer Figure 2) and this trend is predicted to continue. The Northern Region has a medium level of physical inactivity with 60 per cent of the population over 18 being inactive2 which is just slightly higher than the national average being 57 per cent. Physical inactivity in conjunction with a poor diet, has contributed to an increase in lifestyle diseases such as cardiovascular disease, obesity and Type-2 diabetes. Launceston and the Northern Region has a very high incidence of cardiovascular disease at 29.9 per cent, resulting in the region being ranked sixth in the worst 20 regions in Australia for this illness.3 The combination of an ageing and a less active community is likely to result in greater numbers of residents with reduced personal mobility. There is evidence of strong links between our health and the built environment4. Improving access to public transport and 1 Based on ABS 2011 Census data at the ‘Significant Urban Area’ geographical classification.2 ABS, Australian Health Survey, 2011-2012.3 Heart Foundation, top twenty regions of CVD prevalence, 2014.4 B Giles-Corti, P Hopper, S Foster, M Javad Koohsari, J Francis, prepared for the Heart Foundation, Low density development: impacts of physical activity and associated health outcomes, 2014.
14

to active travel options such as walking and cycling will contribute to increased physical activity and improve the health and wellbeing of our communities5. In turn, this will deliver long-term financial benefits to the state.
5 Premier’s Physical Activity Council, Support for a State Policy for Healthy Spaces and Places, 2013.
15
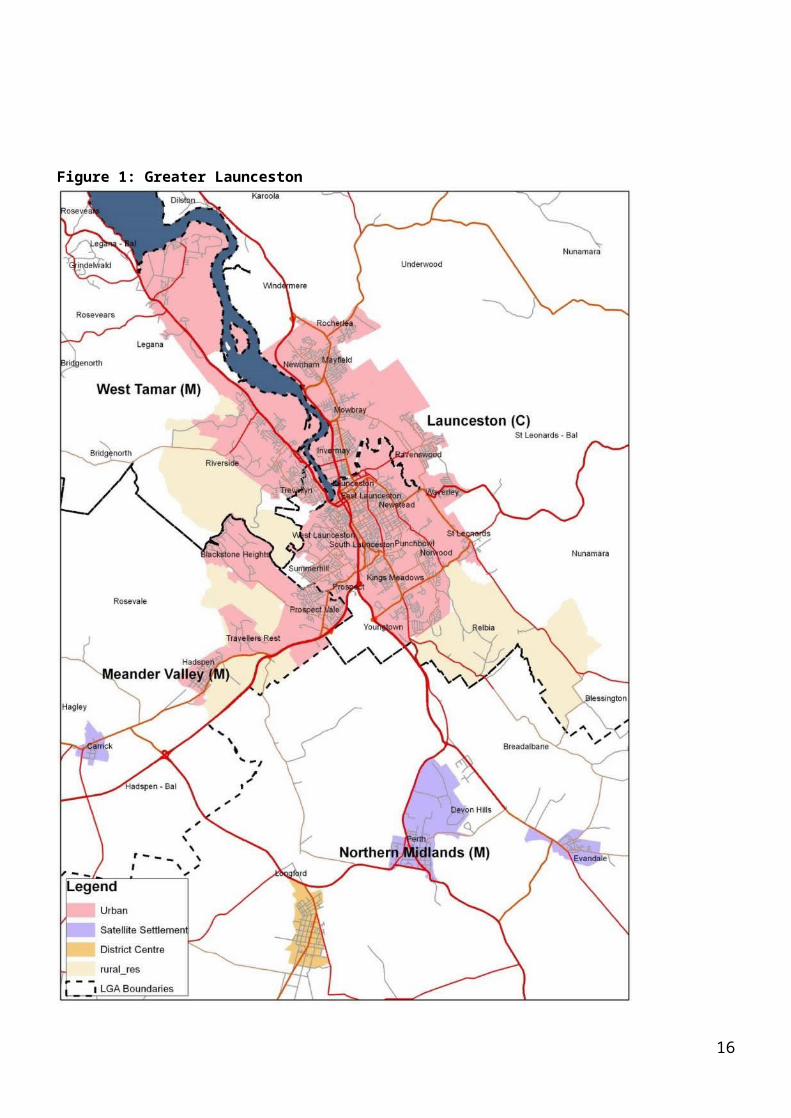
Figure 1: Greater Launceston
16

Figure 2: Demographic change in Greater Launceston6
Settlement and transport patternsFirst settled by Europeans in 1806, Launceston is one of Australia’s oldest cities. As a result, the inner area of Launceston was developed during the pre-car era and so exhibits a compact and walkable street layout. Trams provided the first public transport network in Launceston, commencing in 1911 (refer Figure 3) and operating until 1952, when they were superseded by trolley buses from 1952 to 1968 and then petrol buses. The tram network opened up new areas of Launceston for suburban development, with routes to Kings Bridge, Mowbray, Newstead, Trevallyn, West Launceston, Kings Meadows and East Launceston. Post-World War II, development patterns were increasingly shaped by the flexibility of car travel, and featured a distinct separation of land uses across the different suburbs. Public housing development in outer suburban areas, such as Ravenswood and Rocherlea, reinforced this trend. These suburbs are now characterised by low-density detached dwellings, a lack of mixed-use development including corner shops, and are generally car-centric in nature.
6 ABS Census (2011-1986). The Greater Launceston statistical area boundary may vary across Census years.
17
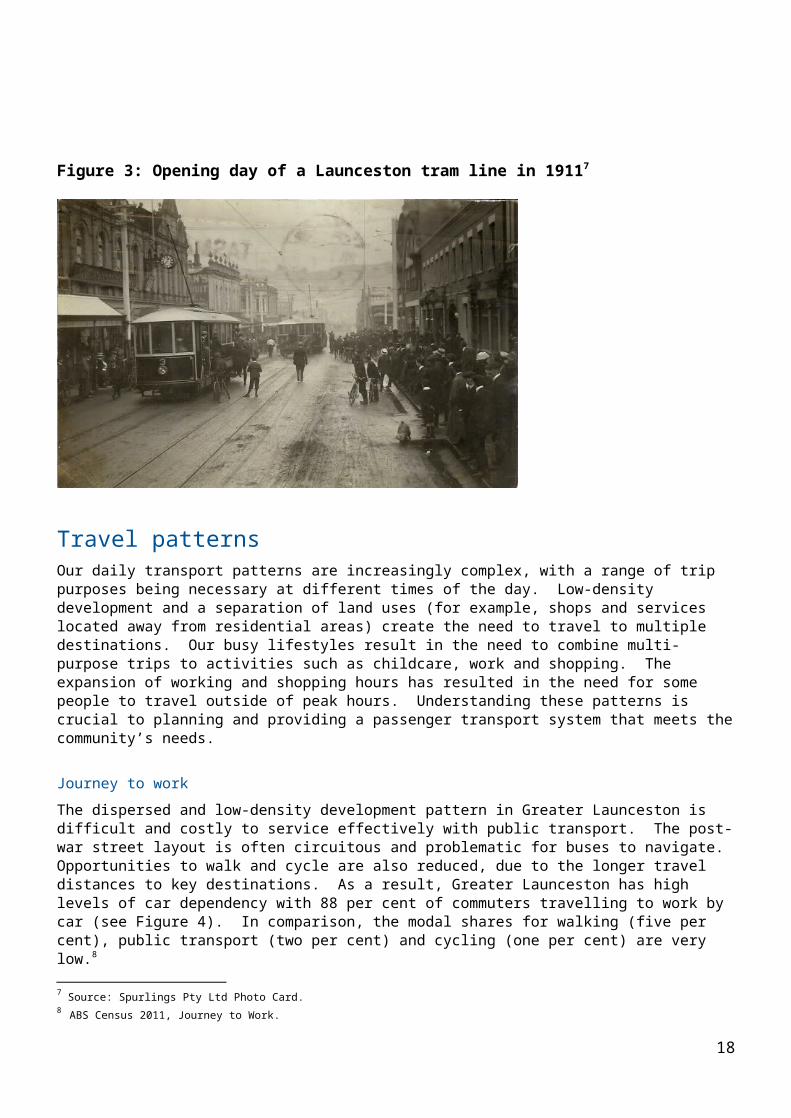
Figure 3: Opening day of a Launceston tram line in 19117
Travel patternsOur daily transport patterns are increasingly complex, with a range of trip purposes being necessary at different times of the day. Low-density development and a separation of land uses (for example, shops and services located away from residential areas) create the need to travel to multiple destinations. Our busy lifestyles result in the need to combine multi-purpose trips to activities such as childcare, work and shopping. The expansion of working and shopping hours has resulted in the need for some people to travel outside of peak hours. Understanding these patterns is crucial to planning and providing a passenger transport system that meets the community’s needs.
Journey to work The dispersed and low-density development pattern in Greater Launceston is difficult and costly to service effectively with public transport. The post-war street layout is often circuitous and problematic for buses to navigate. Opportunities to walk and cycle are also reduced, due to the longer travel distances to key destinations. As a result, Greater Launceston has high levels of car dependency with 88 per cent of commuters travelling to work by car (see Figure 4). In comparison, the modal shares for walking (five per cent), public transport (two per cent) and cycling (one per cent) are very low.8
The Launceston central business district (CBD) is the key journey to work destination in the region, attracting 42 per cent of all commuter trips, followed by Kings Meadows and Invermay both with less than 10 per cent of trips. Launceston General Hospital located just south of the CBD, and 7 Source: Spurlings Pty Ltd Photo Card.8 ABS Census 2011, Journey to Work.
18

key educational facilities University of Tasmania (UTAS) in Newnham and Invermay, TAFE campuses in the CBD and Newnham, plus large colleges and high schools are also significant destinations. The journey to work statistics are important because commuter trips are predictable travel movements that usually occur during am and pm peak periods, and place the greatest demands on the transport network. There are limitations to using journey to work data, as only 37 per cent of the population reported undertaking a journey to work in Launceston in the 2011 Census9. A range of other trip purposes should also be considered for a more complete picture of overall travel patterns.
Figure 4: Share of mode of journey to work to Launceston10
Non-commuter travelAccessing essential services, shopping, recreation and entertainment and visiting friends are other significant trip generators, but little information is available in relation to these trips11. There is a need for better travel data to inform the planning of transport networks. For those less likely to have access to a car such as students, the unemployed and the aged, a high proportion of non-commuter trips are likely to be undertaken by public transport, walking and cycling. This is confirmed by the fact that 92 per cent of bus
9 Based on the 2011 ABS Census, (excluding those who worked from home or did not attend work on the day). 10 ABS Census 2011.11 The Greater Hobart Household Travel Survey highlights that 68% of all trips in Hobart are for non-commuting trip purposes.
19
Car, as driver81%
Car, as pas-senger
8%
Walked only6%
Bus2%
Motorbike/scooter1%
Bicycle1%
Taxi<1% Other
2%

passengers in Launceston are either students or concession ticket holders and 10 per cent of Launceston’s population walk regularly to their shopping destination12.
Student travelTravelling to school is a critical transport need, particularly in peak periods. While a large proportion of school age students travel by bus, it is estimated that 10-15 per cent of car traffic in the am peak is generated by school-related trips. Around 15 per cent of students in Launceston walk to school (refer Appendix F). UTAS conducts a bi-annual travel survey of its campuses. Data for 2015 indicates that at the Newnham campus 32 per cent of students and staff either catch a bus, walk or cycle to the campus, for the Inveresk campus the percentage is higher at 42 per cent.13
Car travelCar travel in Greater Launceston is generally fast and convenient, with only minor congestion experienced in peak periods. Typically it takes around 15-25 minutes in the peak to travel to the CBD from Launceston’s outer suburbs14. As a result, travelling by car is an understandable mode choice. Travel time by bus compares unfavourably with the car, and consequently very few people who have the option to drive choose public transport. High car usage results in an increase in vehicle kilometres travelled (VKT),15 which can impose significant costs to government both in terms of the direct capital expense to increase road capacity through road building and widening and recurring maintenance expenditure. There are also environmental and social costs associated with increasing car usage such as pollution, road safety, amenity, social exclusion and personal health. With increasing population and continued low-density development on the urban fringe, the number of car trips and the average trip distance increases, resulting in a growing VKT. In Tasmania, VKT appears to have reached a peak in 2004 and has since stabilised, but has increased significantly since the 1960s (refer Appendix C). A growing VKT increases levels of congestion and results in public pressure for the capacity of the road network to be expanded. In addition to the high cost of such projects, expanding road capacity encourages more people to travel by car, further increasing VKT. Increasing road capacity actually creates induced demand, as it encourages more people to drive which intensifies congestion in the medium to long-term.To accommodate a greater demand for travel in a more cost-effective manner, overall VKT, car mode share and average trip distance needs to be reduced. This can partly be achieved
12 Launceston Pedestrian Strategy, 2013.13 University of Tasmania Travel Behaviour Survey 2015, University of Tasmania14 Department of Infrastructure, Energy and Resources, GLMPTP: Background Report, 2012.15 A product of the number of vehicle trips by the average trip distance.
20

by enabling more people to live closer to their daily destinations and investing in public transport, walking and cycling networks. Cars are a spatially inefficient form of transport, with the average trip occupancy being 1.2 people per vehicle. This underutilised capacity results in road space being dominated by cars, with lower priority given to other passenger transport modes. A study of time-area effects (which is the travel time multiplied by the space requirement) in Greater Launceston, also demonstrates that although cars have faster travel times than other modes, they are spatially inefficient because of their parking requirements (refer Appendix D). Car parking (both on and off-street) is an inefficient use of space, particularly within the CBD, where land values are higher and the area could be used for more productive land uses such as services and shops or to increase road space for other transport modes. Walking and buses have a negligible parking requirement16 and are, therefore, a highly spatially efficient form of travel for urban areas (see Figure 5). While bicycles and motorcycles have a parking requirement, their space requirements are significantly less than cars.
Figure 5 Time-area effects for commuter travel in Launceston17
Walking Cycling Bus Car - urban -
50 100 150 200 250 300 350
Parking time-areaTravel time-area
Tim
e-ar
ea (
m2.
min
s /k
m)
16 It is assumed buses are being utilised after dropping passengers to their destination in the morning. There is some spatial requirement for bus stops, however each stop is utilised by a number of services and has a low impact on a per passenger basis.17 Department of State Growth, 2014 (see Appendix D).
21

Bus networkA more efficient public transport network
Objectives Strategies
Increase bus patronage across the network and increase mode share for bus travel, particularly during peak times.
Improve travel time, frequency and reliability of buses on the network, particularly on key corridors.
Optimise efficiency and effectiveness, and reduce redundancy in the network.
Develop new service standards for public transport provision to guide the development of public transport networks.
Create direct, simple and efficient route patterns that connect activity centres.
Improve co-ordination and integration of services.
Develop bus stops that provide passenger amenity and are accessible, and support wider network improvements such as bus transfers and efficient route design.
Ensure the design and management of our roads supports efficient and reliable bus services.
Improve the provision of consistent, reliable and accessible service information to bus passengers through the use of technology.
Work towards providing consistent branding and marketing of public transport information, services and infrastructure.
ContextThe public transport system in Greater Launceston is largely bus-based. Metro Tasmania is the largest service provider, delivering general access and student-only services predominantly in the urban area. Private bus operators deliver both general access and student-only services within the urban, urban fringe and rural areas.Buses are highly effective at moving large numbers of people, particularly to key activity centres (retail and service centres) such as the CBD where the spatial efficiency of bus travel is highly beneficial. If greater numbers of people, especially commuters, use public transport, this has the potential to relieve traffic congestion when it occurs during the am and pm peaks. It will also reduce the demand for car parking. Public transport is also essential for the transport disadvantaged, therefore services need to operate at a reasonable level of frequency throughout the day. Public transport in
22

Launceston caters primarily to the transport disadvantaged, with students and concession holders comprising 92 per cent of all patronage, while full-fare paying adults represent only eight per cent (refer Figure 6). By comparison, the Metro statewide average for full-fare paying adults is 15 per cent (based on first boardings)18.Metro Tasmania carries around 86 per cent of Launceston’s bus daily patronage and approximately 76 per cent of the student patronage, with private bus operators carrying the remainder.The heavy focus on the student market (see Figure 6) results in a large proportion of bus resources being diverted to student-only services. This reduces the number of buses available for carrying commuters and other passengers in peak periods.As a result, bus patronage in Greater Launceston is low and has been slightly declining over the past two decades19. Falling market share and fare revenue undermines the on-going viability of the bus system, which is heavily subsidised by the Tasmanian Government.A primary objective of this Plan is to increase the modal share of the bus system. To do this, bus services must better meet the needs of full-fare paying adults, especially commuters. With limited funding available, identification of inefficiencies within the existing bus system for reallocation presents the best opportunity to ‘create’ the additional bus resources required for network improvements.
Figure 6: Weekday Launceston boardings by passenger type20
18 Metro Tasmania, Annual Report 2012/1319 Total bus passenger boardings in 2013/14 are slightly lower than in 1997/98. 20 Metro Tasmania, 2013.
23

24

Figure 7: Weekday student travel by service type21
0600-
0629
0630-
0659
0700-
0729
0730-
0759
0800-
0829
0830-
0859
0900-
0929
0930-
0959
1000-
1029
1030-
1059
1100-
1129
1130-
1159
1200-
1229
1230-
1259
1300-
1329
1330-
1359
1400-
1429
1430-
1459
1500-
1529
1530-
1559
1600-
1629
1630-
1659
1700-
1729
1730-
1759
1800-
1829
1830-
1859
1900-
1929
1930-
1959
2000-
2029
2030-
2059
2100-
2129
2130-
2159
2200-
2229
2230-
2259
0
100
200
300
400
500
600
700
800
Weekday Student TravelAnalysis of student travel by bus service type, including non-Metro services
Students on timetabled Metro GA servicesMetro student-only servicesStudents on non-Metro services
Dai
ly B
oard
ings
Student-only bus services Student-only bus services account for a large proportion of the overall bus system in Greater Launceston, with 69 per cent of total passenger boardings being students and 81 per cent of students travelling on student-only buses (refer Table 3). Analysis of daily Metro Tasmania passenger boardings shows distinct ‘needle peaks’ for student passengers in the am and pm school peak (refer Figure 7).The provision of a large number of student-only services diminishes the availability of bus resources to deliver general access services, especially during peak periods. As a consequence, there are significant gaps in service frequency for general access routes, particularly in the outer suburbs: Alanvale/Mayfield, Norwood, Youngtown, Kings Meadows and Prospect Vale experience
gaps in the am peak. Ravenswood, Waverly, St Leonards, West Launceston, Summerhill, Prospect Vale,
Trevallyn and West Riverside experience gaps in the am peak.
21 Metro Tasmania, 2013
25

These gaps increase the waiting time for passengers, discourage bus travel by commuters and lead to a perception of reduced service reliability. Public transport in terms of the total travel time (walking to stop, waiting and travel time) is already uncompetitive with the car, so service gaps further intensify the disincentives to use public transport. The operation of a large number of student-only services is inefficient, with many running below capacity (less than 30 passengers). Around 70 per cent of student-only services in the am peak (8:00-8:30 am) and the pm student peak (3:00-3:30 pm) are running under capacity (refer Table 3). There are also examples in Launceston of multiple school buses duplicating routes and overlapping with general access bus corridors. All of these services are being largely funded by the taxpayer. In 2013-2014, the Tasmanian Government paid approximately $16 million to private bus operators and Metro to provide passenger transport services in the Greater Launceston area. There is a strong case for re-allocating bus resources from student-only services to improve the general access network where student-only services are under-patronised or duplicate general access services, unless student-only services can be provided more cost effectively than general access services. Reallocating services can result in a more efficient network by addressing service gaps and therefore decreasing waiting times. A comprehensive bus system review, including general access and student-only services provided by both Metro and private operators, is recommended as an action within this Plan to ensure a more efficient and effective use of these transport resources.
Table 2: Comparison of student bus travel in Greater Launceston, based on average daily boardings22
Bus service
Boardings am
Boardingspm#
Share of total student trips23
Number of bus servicesam*
Number of bus servicespm#
Students per service
Services carrying <30 students
Student-only Metro
595 775 42% 32 31 22 34 out of 63
Student-only non-Metro
593 673 39% 13 15 45 6 out of 28
Students on
396 229 19% 20 19 16 n/a
22 Metro Tasmania and Department of State Growth, 2013. Note the number of am and pm bus services shown in this table is indicative only and is used to provide an estimate of bus resources devoted to student-only services. 23 This represents the share of total student patronage, such as 19 per cent of all student trips are on general access services. There are some students who are using general access services outside of the school peak periods, which have not been captured in this table.
26

general access24
* am 8:00-8:30 am # pm 3:00-3:30 pm
General access bus services For largely historical reasons the bus network in Greater Launceston operates as a high-penetration, low frequency network which has the following characteristics: Indirect and circuitous routes, which increases the travel time for passengers. Duplicated and closely-spaced bus routes, which creates inefficiencies in the network.
This is partly caused by the majority of private bus operators of urban fringe services being unable to pick up passengers in the Launceston metropolitan area.
Multiple route variations which makes it difficult for passengers to understand the route structure and timetables.
Lack of integration between different operators, including an absence of coordinated timetabling, different ticketing systems and unrelated fare structures.
Bus stops that are too closely spaced, which increases bus travel times. Relatively low service frequency and irregular timetabling, which makes bus travel less
convenient and can increase passenger wait times. At present the network does not meet the needs of time-sensitive commuters, as travel times are not competitive with the car and services are too infrequent. Services that target commuters need to be fast and reliable, with routes and timetables that are easily understood. Such improvements also benefit all bus users.As previously stated, a comprehensive bus system review would enable the identification of inefficiencies and the design of a more effective and financially sustainable network.
Bus operator contractsThe existing contracts between the Tasmanian Government and bus operators are currently in place until 2018 (or 2019, depending on the individual contract). The Department of State Growth will consider changes to existing routes and services as part of the post 2018 bus service procurement process in close consultation with the bus industry.
Opportunities24 Includes Metro and private operators.
27

Reallocation of student-only servicesThere is potential to reallocate some student-only bus resources to the general access network, in order to service both students and the wider public. This would provide a cost-neutral way of increasing service frequency along key routes. Most schools in Launceston are located within 500 metres (five minute walk) of either the current or proposed general access network (refer to Figure 8), enabling them to be effectively serviced by general access buses. Many student-only services will still be required, particularly in rural areas and in locations which are not serviced by the general access network. Schools may elect to continue to provide their own targeted bus services, at their own cost.Any reallocation of student-only services will be limited, at least initially, by the number of Disability Discrimination Act (DDA) compliant buses available to perform general access services. It is a requirement under the Commonwealth’s Disability Discrimination Act Transport Standards that 55 per cent (2012 target) of general access services must be operated with a DDA compliant bus, with 100 per cent of services to be compliant by 2022. Student-only services are not currently required to be DDA compliant.Metro is also developing a policy to reduce the number of bus stops within walking distance of schools, as most students living within walking distance, can walk to school. Reducing the number of stops will increase bus service efficiency, by reducing the number of times the bus has to stop, permitting further resources to be reallocated to the general access network. Reducing the number of student-only services may result in some students needing to walk further to access a bus. While this has health and wellbeing benefits, a possible adverse outcome is an increase in the number of students being driven to school, or to a bus stop by car. This can be overcome by developing school travel plans and focusing on active travel infrastructure (see strategies in the Active Travel and Transport Culture sections of this Plan). Currently, most of Metro’s student-only services ‘drop off’ and ‘pick up’ within a ten minute timeframe of school starting and finishing times, while private operators work within a 30 minute timeframe. Applying a consistent 30 minute window for bus drop-off and pick-up for Metro student-only services would greatly increase flexibility for Metro buses to provide additional services, thus freeing-up additional resources for the general access network. This opportunity represents a short-term efficiency gain within the current network, which is cost-neutral. While beyond the scope of this Plan, extending school start and finish times (known as ‘peak spreading’), is another approach that might be considered to reduce the needle peak demand for student-only bus services.
Improving general access services
28

A number of changes are required to improve general access services in order to increase patronage, especially for commuters and to cater for a potential increase in reallocation of student-only services.The Department of State Growth is developing statewide service standards for public transport, which will enable a more consistent and effective procurement of public transport services by the Tasmanian Government. The standards will provide a guiding framework for undertaking a bus services review in Greater Launceston. The standards will be a key tool in determining the appropriate level of service frequency for particular routes and areas.The means by which the bus services review may be able to improve the efficiency of the Greater Launceston network are listed below:1. Increasing service frequency on key public transport corridors, especially those that
already demonstrate higher demand, such as Mowbray to Launceston CBD. 2. Removing route deviations and loop services. Routes should be as direct as possible,
producing a more efficient and reliable service that keeps total travel times to a minimum.
3. Eliminating bus routes on closely spaced parallel roads. Typically, there should be approximately 1000 metres separation between parallel routes.
4. Reducing the number of route variations, in order to create a network that is easier for passengers to understand.
5. Ensuring buses penetrate the core of activity centres and pass through trip attractors and higher density residential areas, whilst maintaining a direct route.
6. Facilitating convenient transfers at major bus stops to ensure passengers can reach more destinations.
7. Optimisation and improvement of bus stops in order to provide a balance between access to stops and speed of services.
8. Coordinating the provision of privately-operated urban fringe and Metro’s urban services, including consideration of integration of some routes such as allowing urban fringe providers to ‘pick up’ in urban areas where this is efficient and effective. Currently, only some private operators can pick up within an urban area.
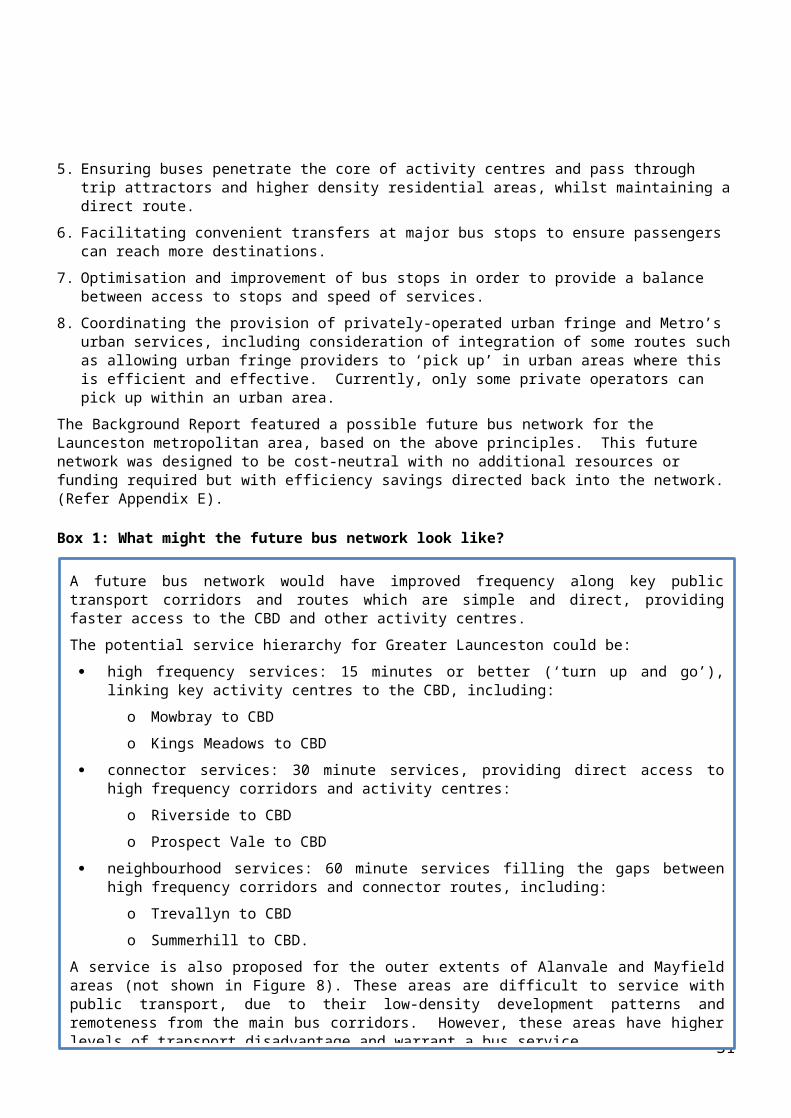
The Background Report featured a possible future bus network for the Launceston metropolitan area, based on the above principles. This future network was designed to be cost-neutral with no additional resources or funding required but with efficiency savings directed back into the network. (Refer Appendix E).
Box 1: What might the future bus network look like?
29
A future bus network would have improved frequency along key public transport corridors and routes which are simple and direct, providing faster access to the CBD and other activity centres. The potential service hierarchy for Greater Launceston could be: high frequency services: 15 minutes or better (‘turn up and go’), linking key activity
centres to the CBD, including:o Mowbray to CBD

Public transport modelling of the future Launceston metropolitan network by the Department of State Growth (Appendix E) indicated that there is potential to increase: commuter patronage by around three to 12 per cent inter-peak (10:00 am-3:00 pm) patronage by nine to 50 per cent. A more significant increase in patronage is likely if some student-only services are reallocated to the future general access network, which would enable an increase in service frequency: increasing general access bus resources by 10 per cent has the potential to produce 19
to 34 per cent growth in commuter patronage, and a 126 to 197 per cent increase during the inter-peak
a 50 per cent increase in general access resources could grow commuter patronage by 41 to 70 per cent.
This type of future network is essential to improve efficiency and will enhance the level of service for the vast majority of residents. However, there is potential that some members of the community may be personally disadvantaged through the withdrawal of inefficient services or changes to bus stop spacing and/or location.
30
A future bus network would have improved frequency along key public transport corridors and routes which are simple and direct, providing faster access to the CBD and other activity centres. The potential service hierarchy for Greater Launceston could be: high frequency services: 15 minutes or better (‘turn up and go’), linking key activity
centres to the CBD, including:o Mowbray to CBD
There is potential to utilise existing private, public and not-for-profit transport services in innovative ways in order to address existing transport ‘gaps’. That is, to offset disadvantage that may be incurred for some people through changes arising from the implementation of a ‘future bus network’. The Department of State Growth is currently developing a Transport Access Strategy that examines opportunities for developing more integrated and coordinated transport services for all Tasmanians, particularly those who are disadvantaged by age, disability or economic circumstance. The Strategy identifies a range of measures to improve transport access, including the innovative use of existing resources to fill ‘transport gaps’.
31

32

Figure 8: Potential future bus network for Launceston
Service integrationThe improved integration of Metro and private (urban fringe) bus services has the potential to increase bus patronage by making it more convenient for people to use public transport. Common ticketing, timetabling, fare structure, bus stops, marketing and branding would maximise convenience, minimise travel time and support higher public transport patronage. Currently there are some contractual limitations regarding the ability of some urban fringe private operators to pick up passengers inside the urban boundary. Allowing operators to pick up within urban areas would maximise service efficiency by creating higher bus frequencies along key routes, without the need to purchase additional services. For example, West Tamar operators could be permitted to collect passengers in the Riverside and Trevallyn areas.
Bus frequency and timetablingMore frequent bus services make bus transport a more attractive option, by reducing passenger waiting times and decreasing total trip time. Improving network efficiency has the potential to release bus resources to enable more frequent services, without increasing the total cost. Improving network efficiency may include measures such as:
more efficient network route design (see future bus network) reallocation of student-only services to the general access network better integration of Metro and private operator bus services.
The timetabling of buses to produce predictable intervals between services, for example every hour, half hour or 15 minutes, ensures that the bus system is more user-friendly and that there is no need for people to refer to timetables. Bus services should be scheduled and timetables coordinated at designated key stops, so that passengers may easily transfer between different services with minimal waiting.
Bus reliability measuresThe reliability of bus services (running neither early nor late) is vital to building patronage, particularly in the time-sensitive commuter market. There is potential to implement traffic engineering measures to support the reliability of public transport by ensuring that buses have priority on the road, particularly along high frequency bus routes in congested areas. Measures to consider in Greater Launceston include:
traffic signal priority for buses such as extended green time when buses are detected on approach or an early head-start
‘queue jump’ bus lanes at traffic lights with early head-start bus signal phase bus stop bulbs or extensions to the traffic lane edge ensures faster bus mobility in
and out of a bus stop and maintains their position in traffic
33

better sharing of road space by removal of on-street parking for buses and cars.
34

Passenger information The provision of timetable, fare and route information which is easy to access and understand encourages more people to use public transport by making journey planning easier. A ‘one stop’ web-based resource would enable people to access information about the public (Metro Tasmania), private (urban-fringe services) and not-for-profit transport services they can access including fares, routes and timetables to undertake their everyday trips. The Cradle Coast Authority is currently investigating the provision of ‘one stop’ digital information resource for passenger transport services on the North West coast. This project is being developed so that it could be suitable for future application statewide. Despite the increased uptake of technology, some people do not have access to the internet and information such as timetables and maps will need to be provided in hard copy.Information at bus stops, on buses, via phone applications/internet and in the form of real-time travel information, would all make it more convenient to use public transport ‘on the go’. All passenger transport service information is required to be accessible (DDA compliant). Information provided electronically should meet the web content accessibility guidelines.
Bus stopsBus stops which are safe, convenient and offer a reasonable level of amenity are an important component of improving the quality of the bus system. The development of a bus stop hierarchy would provide a guide to the level of infrastructure required at each stop. The bus stop hierarchy would classify each stop based on patronage and strategic importance for example for transfers, access to key attractors. The highest level of stops would be those located centrally within the main activity centres, such as the CBD, Mowbray and Kings Meadows and adjacent to major trip attractors, such as the Launceston General Hospital and Inveresk.Bus stops must be located and designed so that they provide convenient access for passengers particularly to key attractors being located closer than car parking facilities and ideally stopping at the pedestrian entrance to an activity centre. Pedestrian connectivity to major bus stops should also be improved.The existing St John Street bus interchange is the most patronised bus stop within the system and its location provides convenient access to the Brisbane Street mall, which has the highest pedestrian volumes and activity within the CBD.The City of Launceston is proposing to improve the streetscape and bus stop infrastructure at St John Street to better reflect the needs of passengers, pedestrians and local businesses. It should be noted that improving the urban environment to attract pedestrians, cyclists and public transport is beneficial for local businesses, as it increases the amount of foot traffic and passing trade.25
25 Tolley, Good for Business: The benefits of making streets more walking and cycling friendly. Commissioned by Heart Foundation, 2011
35

Improved manoeuvrability of buses for example providing longer bus stops, and operational changes to reduce bus ‘dwell time’ at the interchange can help to minimise bus congestion. The location of the interchange also needs to ensure travel time reliability for buses is improved or at least maintained to ensure passenger journey times are not increased and operational costs do not escalate. The restriction or removal of car access through the interchange would improve amenity and safety for all users.All bus stops on general access routes are required to be fully DDA compliant as per Commonwealth Government legislation by 202226. Metro has been progressively upgrading bus stops to be DDA compliant in urban zones. Any new or substantially upgraded bus stop must comply with this legal obligation. Ensuring that bus stops are compliant will assist those with limited accessibility.There are examples where the cost of improving bus stop infrastructure for example bigger shelters at major trip attractors such as UTAS has been jointly shared by Metro Tasmania, councils and UTAS. This arrangement creates benefits for all organisations as it encourages more people to use public transport as the passenger amenity is improved.
Bus stop spacingOptimising the number of bus stops to ensure their average spacing is around 400 metres (spaces can be greater on more frequent routes) will lead to improvements in bus travel time, by reducing the number of times a bus has to stop between its origin and destination. Generally, bus stops in Launceston are located too close together and a program of bus stop consolidation, which Metro has begun to implement, should continue until optimum spacing is achieved. Any changes to bus stop locations needs to consider surrounding land uses, such as major trip attractors and infrastructure for example safe pedestrian crossing points.
TransfersFacilitating fast and convenient transfers between bus services increases the range of destinations available for passengers. The ‘transfer penalty’27 – a measure of the additional time and uncertainty a transfer adds to a trip - would need to be minimised through the following actions:1. Development of key bus stops serviced by multiple bus routes.2. Coordinated timetabling to minimise the scheduled transfer wait time.28
3. Integration of Metro and private operator services, allowing utilisation of common bus stops and co-ordinated ticketing across operators.
26 The specific legislated targets are: 55 per cent (2012); 90 per cent (2017); and 100% (2022), Accessible bus stop guidelines, Australian Government.27 The perceived transfer penalty accounts for the actual time taken to transfer (i.e. the scheduled time gap between disembarking from one bus and boarding another), additional risks imposed such as service reliability (the connecting bus service may have already left) and other factors such as the level of amenity at the transfer stop.28 Options such as ‘pulse’ timetabling should be considered at key transfer stops – this would involve a lower hierarchy bus service not departing from the stop until a higher-priority bus service has arrived.
36

4. Safe and accessible bus stops with adequate passenger information (including real-time travel information) and passive surveillance such as co-location in activity centres.
37

Active travelA walking and cycling network which is safe and convenient.
Objectives Strategies
Provide high-quality, safe, and accessible transport oriented walking and cycling links to services, education, employment and public transport.
Improve access to public transport, services, education and employment for mobility-impaired residents.
Facilitate more residents to use active travel for a range of daily travel needs.
Create safer and more convenient walking and cycling routes to school to support greater active travel by students.
Develop street design guidelines for planners and engineers to assist the development of walking and cycling infrastructure.
Build efficient, useable and well-connected walking and cycling links into new developments to enhance connectivity and permeability.
Retrofit improved walking and cycling links into existing roads and streets.
Create pedestrian-friendly urban centres and retail streets.
Improve crossing opportunities at intersections for pedestrians and cyclists.
Continue to implement existing cycling and walking infrastructure plans and proposed projects.
Develop consistent signage and way-finding systems to improve pedestrian and cycling connectivity.
ContextFor the purposes of this Plan, ‘active travel’ refers to walking and cycling. People using mobility scooters and wheelchairs are classified as pedestrians, and measures to improve the accessibility, such as DDA compliant infrastructure, safety and connectivity of walking infrastructure will benefit people using these mobility aids. There are safety, connectivity and amenity issues for pedestrians and cyclists in Greater Launceston due to limited street space for walking and cycling, conflict points with vehicles, and poorly connected networks. These factors are likely to constitute a barrier to the greater uptake of walking and cycling. Mode share for walking and cycling by commuters is very low, at five per cent and one per cent, respectively.
38
Walking and cycling provide health benefits, are spatially efficient, environmentally friendly, and are the cheapest and most readily available form of travel. Encouraging people to walk and cycle for transport can assist in reducing traffic congestion and demands for parking spaces. Streets that facilitate walking and cycling through well-connected and safe infrastructure are beneficial for local business, as they attract greater foot traffic and generally increase vibrancy29. Most walking trips are typically short trips of up to two kilometres, while most people are prepared to cycle a distance of six to seven kilometres to access work and education, and generally three to five kilometres for specific purposes such as shopping. Walking is also an important part of a public transport trip.
Low incidence of active travel to schoolTravel to school in Tasmania is heavily reliant on the bus system, with 53 per cent of all school students travelling via bus, 14 per cent of students walking to school30 and only one per cent cycling., While it is positive that Tasmania has a far lower proportion of students travelling by car in comparison to other states, the level of walking and cycling is also low (refer Table 4). Table 3: Method of travel to school by state in 201131
(per cent)
ACT NSW32 NT QLD SA TAS VIC WA
Walk 18 30 11 17 21 14 19 20Bicycle 5 2 7 3 3 1 3 5Bus 25 31 35 25 19 53 26 21Car 48 40 43 50 53 30 45 47Other 5 - 5 6 4 2 7 7
It is estimated that around 10-15 per cent of existing car traffic in Greater Launceston during the am peak is generated by school travel (refer Appendix F), which represents a significant contribution to traffic movements in peak periods.Changes to the bus network proposed in this Plan aim to improve services for the general public and reduce inefficiencies. However, these changes are likely to have some impact on student travel, with the possible reallocation of some urban student-only services to the general access network. Metro is also proposing to gradually remove student-only services for students within walking distance of their local school.
29 Tolley, Good for Business: The benefits of making streets more walking and cycling friendly, commissioned by Heart Foundation, 2011. 30 City of Launceston Council estimates the percentage of children walking to school to be less than 15 per cent, Pedestrian Strategy, 2013.31 ABS, Method of travel to School, 2011. Note totals for each state may not add to 100% due to rounding errors.32 Published data for NSW appears to include an error with a summation of all travel methods being over 100%.
39

This could result in some students needing to walk (or cycle) further to their bus stop, home or school. If parents or students judge that walking and cycling routes to school are not safe or convenient, there is potential for an increase in car travel to school. ‘Part Way is OK’ is a walk to school initiative that encourages primary schools and their local council to work together to find a safe drop-off point a short distance from school, where families are encouraged to drop their children. The step-by-step guide includes tools for identifying safe drop-off points and walking routes and resources for communicating with families. ‘Part Way is OK’ is available to primary schools participating in the Move Well Eat Well Primary School Award program.
Pedestrian demand is not well understood There is little information about pedestrian movements in Greater Launceston, except for the Launceston CBD. The Gehl Report conducted pedestrian counts on a typical working day along key CBD streets in 2010. The Brisbane Street mall had the highest pedestrian volumes at around 20 000, followed by Brisbane Street at 10 000. Also of note is the change in pedestrian demand across the day with movements peaking during lunchtime (12:00 noon -2:00 pm) and being generally high between 10:00 am-4:00 pm (refer Figure 9). Pedestrian movements around the CBD are significantly higher than traffic volumes (Charles and Cimitiere Streets have around 10 000 vehicle movements per day) despite pedestrians often having lower priority than cars.
Figure 9: Pedestrian distribution per hour in Launceston Mall 21 342 pedestrian movements from 8.00 am-12.00 am33
33 Gehl Architects, Launceston Public Spaces and Public Life, 2011. Pedestrian counts completed 10 March 2010, a weekday.
40

Cars are given higher priorityHistorically cars have been given greater levels of priority on the road network than other modes of transport, including pedestrians and cyclists. Prioritisation of cars over pedestrians occurs through physical road design and visual cues, examples of which include: greater road space allocation given to cars for example wide lane widths sweeping kerb alignments that permit faster car turning movements access points which cross a footpath (private driveways, off-street commercial car parks
or service stations) while pedestrians have legal right-of-way, the physical and visual design (pavement
surface, line marking) strongly suggests that cars have priority controlled intersections, such as side streets with a ‘stop’ or ‘give-way’ sign.
Pedestrians have legal right of way across the minor road, however often the road design indicates that pedestrians should give way
signalised intersections, where pedestrian lights do not automatically activate or have a very short pedestrian phase. These features reduce legal pedestrian crossing opportunities
wide crossing distances and a lack of pedestrian refuges on roads and marked pedestrian crossing points (zebra crossings)
inadequate footpaths, in terms of width and pavement materials or in some areas, non-existent footpaths.
High speed environment on local streetsA safe and appropriate speed environment is vital on streets used by pedestrians and cyclists. Urban streets in Greater Launceston have a speed limit of 50 kilometres per hour, regardless of their traffic demand.
41

The probability of fatal injury for a pedestrian hit by a car at 50 kilometres per hour is ten times greater than at 30 kilometres per hour34. A similar difference in fatality risk exists for cyclists35. The Australian Government recommends speeds of 15-40 kilometres per hour on streets of ‘high pedestrian activity areas’, such as activity centres.
Through-traffic in activity centres can also reduce road safety and amenity, particularly where traffic speeds have not been reduced to a suitable level. Local streets which have expansive lane widths encourage faster traffic speeds and can encourage ‘rat running’, for example short-cuts through local streets, which affect pedestrian safety and amenity.
Cycling is an under represented mode of transport Cycling has very low mode share for commuting in Greater Launceston at 1 per cent. Among those who do cycle, there is an under-representation of women, children and the elderly. In 2011, Greater Launceston had a ratio of 5.9 male bicycle commuters to every female, which is well above the national urban average of 3.336. Cities with more advanced cycling networks have a more equal representation of people cycling across age and gender groupings37.
34 Based on a 50 per cent probability at 50km phr reducing to 5 per cent probability at 30km phr, Department of Infrastructure and Transport, Walking, Riding and Access to Public Transport: Draft report for discussion, 2012.35 AustRoads, Cycling on Higher Speed Roads, 2012.36Department of Infrastructure and Transport, State of Australian Cities, 2013. 37 Pucher, Buehler, At the Frontiers of Cycling: Policy Innovations in the Netherlands, Denmark, and Germany, Rutgers University, New Jersey, 2007.
42

There is significant opportunity to increase cycling mode share by catering for those who are ‘interested but concerned’ representing around 60 per cent of the population. (Refer Box 2). These potential users typically require separation from traffic for example bike lanes, or a low speed/volume environment. Cyclists in Launceston typically ride ‘on street’, sharing spaces with cars, including parked cars which increases the risk of ‘dooring’ (the car door being opened when a cyclist is riding past, resulting in a collision). A significant speed differential with cars usually exists. The bicycle infrastructure in place is often poorly connected and discontinuous, which affects the use of these routes for transport. Hilly topography and narrow streets in Launceston can also restrict viable route options. These conditions create barriers for the majority of the population, who are not confident riding on roads. The use of compliant e-bikes (power-assisted bikes) can be a more feasible option for those who are less physically fit, or where distance and hilly terrain is a barrier. In general, there is a lack of information and promotion to the community of the benefits of using legally compliant e-bikes (maximum 250 watts). It should be noted that UTAS does provide e-charging points at its new bike hub at Inveresk and a similar bike hub is proposed at Newnham.
Box 2: Types of cyclists38
OpportunitiesTravel to schoolAttitudes to travel behaviour are strongly shaped during childhood years. Supporting children to walk and cycle to school can improve health outcomes and reduce the pressure placed on the road network and bus resources during the am and pm peak. Walking and 38 Geller, Four types of cyclists, Portland Bureau of Transportation.
43
The Portland Bureau of Transportation surveyed attitudes to cycling for transport and ranked them against four characterisations: ‘strong and fearless’ (less than one per cent of the population), ‘enthused and confident’ (seven per cent), ‘interested but concerned’ (60 per cent), ‘no way no how’ (33 per cent). Those who are ‘strong and fearless’ were classed as those who ride in traffic, regardless of bike lanes, while ‘enthused and confident’ will ride on roads with bike lanes. The largest group which is ‘interested but concerned’ require separation from traffic or a low speed environment with low traffic volumes.A lack of suitable cycling infrastructure within Greater Launceston means that most cyclists need to fit the ‘strong and fearless’ category, as most trips require cyclists to share road space with cars for at least part of the journey.

cycling also represents a cost effective and independent mode of travel for students, who are typically transport disadvantaged.Safe and convenient walking and cycling routes to school from adjacent residential areas and bus stops are essential to facilitate a greater uptake of walking and cycling. In particular, primary school students require walking and cycling routes that are separated from vehicles or, where sharing of road space occurs a design that provides appropriate safety measures.
New roads and subdivisionsDesign of new subdivisions is the most cost-effective opportunity to create safe, convenient and well-connected walking and cycling links. As part of the planning process, it’s important to identify priority walking and cycling links that provide direct connections to key areas such as shops, schools and bus stops. Adequate space must be reserved within streets to enable the construction of high-quality paths in order to encourage more people to use active travel for their daily transport needs.Due to low population growth in Greater Launceston, the development of large subdivisions does not occur frequently. Therefore it is important to consider retrofitting the existing street network to better cater for walking and cycling.
Retrofitting walking and cycling infrastructureImproving (or creating) walking and cycling paths on existing roads and streets is often challenging, due to limited space and cost of construction. However, as outlined below there is scope for cost-effective retro-fitting during road upgrades and also on local streets. Road upgrades present a significant opportunity to retrofit cycle lanes/paths into existing streets: when state roads are constructed or upgraded, provision of cycling infrastructure must
be considered as per the Department of State Growth’s Positive Provision for Cycling Infrastructure Policy
local councils should actively identify opportunities for making provision for cycling when upgrading their road infrastructure.
Local streets are often short (around 200-300 metres in length), have low traffic volumes and provide access at the origin and destination of most trips. They comprise many of the streets in activity centres, residential areas and school zones. Important considerations for the retro-fitting of local roads are listed below: walking and cycling can be prioritised on local streets without significantly impacting
upon car travel times, as arterial and collector roads typically provide the conduit for car travel between key destinations
entry points to local streets should reinforce an appropriate speed environment and road user priority. ‘Gateway’ treatments, that create visual cues and assist pedestrians to cross roads, should be considered
44

road widths should be reduced to minimum lane dimensions to enable reallocation of space to cyclists and pedestrians
low speed shared zones should be established, particularly in locations where through-traffic is already restricted. Speed limits can be reduced to 30-40 kilometres per hour on streets with low traffic volumes and to even lower levels in highly pedestrianised areas
restricting through-traffic, particularly within activity centres. Car-free areas may be appropriate where there is high pedestrian use.
45

Address the missing linksIncomplete or indirect walking and cycling networks reduce options for active travel. Gaps in cycling infrastructure force cyclists to ride within traffic or on (typically narrow) footpaths and can deter people from cycling. Pedestrians are impacted when routes are not directly connected and they must take longer, indirect routes to their destination. Separation of streets may occur due to terrain (waterways or steep topography), when arterial roads are difficult to cross, or result from impermeable street layouts where private land and buildings create barriers to walking, such as cul-de-sacs. Addressing these gaps and barriers is cost-effective, as it facilitates greater utilisation of the existing network.When infill development and subdivision occurs there is opportunity for the planning process to ensure suitable walking and cycling paths are provided within the site and link directly to existing paths at the site boundary.
46
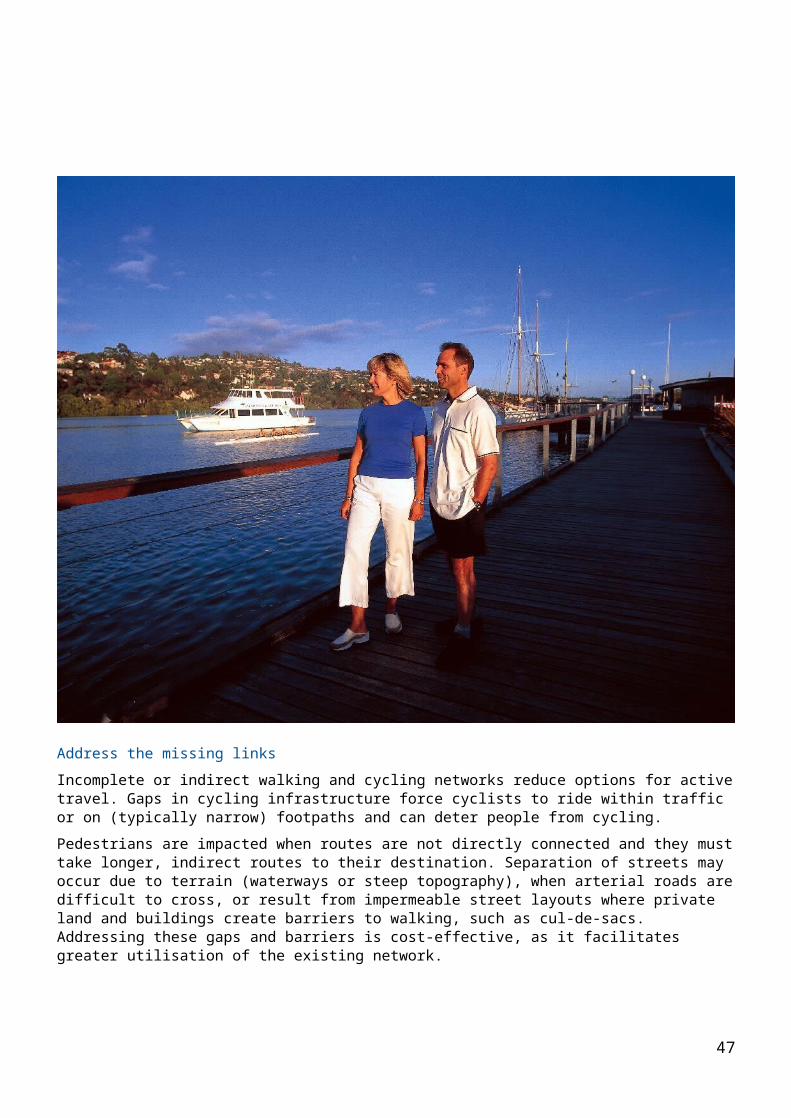
Building new infrastructure is also necessary to rectify missing links and can significantly increase the walkable catchment of an area. Figure 10 shows that by constructing a 30 metre link between two otherwise dis-connected road segments, more people are within a five minute walk to a key public transport stop. Examples of missing links include constructing short pedestrian paths to link streets, or building a bridge over a waterway (such as better connecting Inveresk to the CBD, via a shared path over the North Esk River).
47

Figure 10: Example of increasing a walkable catchment by linking dis-connected streets39
Pedestrian and cyclist friendly activity centresActivity centres need to be more people-focused and support greater use by those choosing to walk or cycle to and from the centre. Research undertaken by the Heart Foundation’s 2011 report ‘Good for Business’ highlights that encouraging more people to walk and cycle within activity centres is highly beneficial for local business, as people tend to stay longer and therefore spend more money40. Traffic management and street design measures to enhance pedestrian safety and amenity were discussed under retrofitting (page 35). In smaller centres, where shops are typically heavily concentrated on the main street, safer crossing points can ensure greater pedestrian connectivity. Box 3 highlights the potential for lunch-time traffic restrictions to improve pedestrian amenity when many people are walking on city streets. More people accessing activity centres by walking, cycling or public transport means traffic volumes and car parking requirements are reduced, which further enhances urban amenity. The City of Launceston’s City Heart Project is an initiative aimed at energising the CBD. The project focuses on improving the amenity of key pedestrian areas, such as Civic Square and the Brisbane Street mall.39 Department of Infrastructure and Transport, Walking, Riding and Access to Public Transport: Supporting active travel in Australian communities – Ministerial Statement, 2013.40 Tolley, Good for Business: The benefits of making streets more walking and cycling friendly, commissioned by Heart Foundation, 2011.
48

End-of-trip facilities for cyclists should also be incorporated into major trip attractors such as activity centres, schools, hospitals and larger retail developments. This will encourage more people to cycle to activity centres and major trip attractors as they can securely park their bicycle.Box 3: Lunch-time traffic restrictions
Safer crossing points Greater safety and connectivity for pedestrians and cyclists can be achieved by improving crossing points at driveways, intersections (including roundabouts) and mid-block. Specific measures applicable to each of these are outlined below: mid-block crossings
o pedestrian refuges (such as median islands) and kerb extensions to reduce crossing distance
o crossing treatments to improve prioritisation, and pavement treatments to improve visibility and awareness for example zebra crossings
private drivewayso installation of pavement markings to reinforce pedestrian priority. This is a short-
term, cost effective optiono alteration of physical conditions (kerb location, pavement treatments and levels)
is the most effective option to alter driver behaviour by clearly distinguishing road user priority, particularly where there is a higher risk of pedestrian/driver conflict
controlled intersections: o Installation of pavement markings and treatments to provide greater awareness
and clarity for pedestrian right-of-wayo Provision of safe crossing points at roundabouts, for example crossing points
further downstream which are clearly marked and delineatedo review of road design standards at controlled intersections to better incorporate
priority of pedestrians and cyclists travelling along the major roado incorporation of a street ‘gateway’ for local streets, to signal an appropriate
speed environment and reduce crossing distance
49
There is potential for some CBD streets to be car-free for a restricted period during the day, particularly during lunch-time when pedestrian volumes are higher. A time-restricted closure can be low cost, implemented in the short-term and not impact on am and pm peak traffic. There is strong potential for investigating this approach in Brisbane Street, between St John and George Streets.The City of Melbourne Council has time-based road closures for 19 local streets. Generally service and delivery vehicles are permitted in the morning, while other streets are only closed during lunch-time (such as Little Collins Street from 12:00 pm to 2:00

signalised intersectionso phasing time alterations to maximise pedestrian crossing time, automatic
activation of pedestrian lights, head-start for pedestrians and scatter crossings o cyclist head-start boxes (this also improves pedestrian safety and amenity by
creating an additional buffer from vehicles), bike lanes on intersection approach and exit, and bicycle traffic lights (such as ‘toucans’).
Ensuring new infrastructure is accessibleThe development of new walking and cycling infrastructure and major upgrades to existing infrastructure needs to be accessible (DDA compliant). A footpath should, as far as possible, allow for a continuous accessible path of travel so that people with a range of mobility, including those using wheelchairs or motorised scooters are able to use it without encountering barriers. A footpath should: have a gradient of no steeper than one in 20 have kerb cuts with appropriate kerb ramps incorporate tactical ground surface indicators where appropriate for example street
crossings be as smooth as possible without raised or cracked paving or tree root damage have a slip-resistant surface during dry and wet conditions.
Implement existing plans and proposed projectsThere are a number of existing plans and projects that, if implemented, will improve walking and cycling opportunities in Greater Launceston. These include: the Principal Urban Cycling Network (PUCN) projects proposed in the Greater Launceston Plan, including:
o CBD Revitalisation Studyo Metropolitan Shared Pathways project (connecting key activity areas with shared
walking and cycling paths, using the PUCN as a guide)o upgrades to Kings Meadows and Mowbray urban centres
Launceston Pedestrian Strategy Launceston Bike Strategy (draft), which includes the PUCN and the Greater Launceston
Arterial Bike Network.The PUCN and the Pedestrian Strategy provide a framework for identifying high priority walking and cycling routes and targeting improvements at these areas. As the PUCN was developed in 2011, there is a need to review routes within the network with stakeholders, in order to determine if changes are required.
Develop street design guidelines
50
Street design guidelines can ensure the planning and design of walking and cycling infrastructure is more effective, consistent and efficient. The guidelines can be used in the planning and approval process to assist planners, engineers and developers in designing and assessing cycling and walking infrastructure.There are existing guidelines in place such as: Healthy by Design: provides high level strategic direction on when to provide
infrastructure Local Government Association of Tasmania (LGAT) subdivision guidelines and standard
engineering drawings: provides minimum requirements for road design, including footpaths
Austroads: generic engineering standards and technical advice. However there is a need for guidelines which provide advice on ensuring greater connectivity and ‘real world’ technical guidance (similar to VicRoads advisory notes). The creation of guidelines should consider relevant street types, road hierarchy and typical users.The street design guidelines would need to conform to existing requirements and engineering design standards. Relevant design publications, such as NACTO’s Urban Street Design Guide, should be used to guide appropriate ‘best-practice’ designs. The street design guidelines should also include provision of end of trip facilities for major development, such as schools, hospitals and commercial development. End of trip facilities should include bicycle parking, changing facilities, lockers and showers.
Interim design strategiesThe adoption of interim design strategies can be a useful approach in testing proposals, both in terms of their effectiveness and the level of community support, prior to more permanent or costly infrastructure upgrades. Interim design strategies are particularly useful when there is complexity, innovation or stakeholder concern in relation to proposals.Temporary installations are usually implemented for a period of three to 12 months, which enables people to adjust their travel behaviour. Temporary installations are suited to low speed roads (less than 60 kilometres per hour) within activity centres or residential areas.Temporary installations enable community feedback and performance data to be collected, which can be used to assess the effectiveness of the proposal and for this to be incorporated into the final design. Installations can include pavement markings, transportable landscape modules or street furniture, which can be reused for other projects. They should be robust and attractive and replicate the functional changes proposed in the intended final design.Figure 11 highlights the potential to increase pedestrian space by utilising excess road space. The use of bollards in Salamanca Place in Hobart has created both additional space for outside dinning and a new dedicated footpath.
51

52

Figure 11 Interim design strategies – Salamanca Place
Consistent signage and way-findingThe provision of consistent signage and way-finding mechanisms will enhance connectivity for pedestrians and cyclists. The Department of State Growth has developed a resource manual for cycle infrastructure owners to utilise when developing and implementing signage for on and off-road cycle routes. Provision of consistent directional signage will help cyclists to find and use cycle routes, and easily access key attractors.Provision of way-finding is often directed at pedestrians and helps a person move safely and easily through an area by linking key attractors in a logical way. Wayfinding can include signage, maps or visual clues to direct people.It is more effective to target improvements to way-finding in areas which have high volumes of pedestrians, such as activity centres or in areas where there are large pedestrian movements between attractors for example Inveresk to CBD.
53

Land use planningMore liveable and well connected communities.
Objectives Strategies
A greater level of strategic integration between land use and passenger transport planning.
Development that better supports effective and efficient provision of public transport services.
Greater urban consolidation to increase the number of residents living within walking and cycling distance of activity centres and higher frequency bus routes.
Investigate planning and regulatory mechanisms to provide a stronger link between land use planning and passenger transport.
Provide a bus network plan that is tailored for land use planning purposes to facilitate better integration of land use and transport planning.
Ensure fit for purpose walking and cycling links are incorporated into new developments prior to planning approval.
ContextOur housing choices and land development patterns directly shape our transport networks and impact our travel choices. Suitable development provides a number of community and individual benefits, including:
Better access to, and more effective use of, existing public transport services and active travel infrastructure.
More economical provision of bus services to growth areas. Consolidated mixed use development around bus stops along key transport corridors
and within activity centres, which means better access to employment, education and services.
More opportunities for walking and cycling locally to access shops, services and public transport.
The nature of land use planning means that changing our development patterns will need to occur progressively over the longer term; immediate solutions are not feasible and it will take time for our urban environment to be more supportive of public transport, walking and cycling.
Development patternsResidential neighbourhoods in Greater Launceston are typically built at low densities, are car-dependent and geographically separated from shops, employment and services. This reflects current planning scheme provisions, a supply of affordable land within easy commuting distance of the CBD, and a new home construction market dominated by single
54

detached dwellings. The current development pattern does not adequately support the efficient provision of public transport services, or enable people to use walking and cycling for transport purposes.Greater Launceston has a large supply of ‘greenfield’ land on the urban fringe. As this land is already zoned ‘residential’, it will provide a significant portion of the housing mix over the next decade. Typically greenfield development occurs at a lower density than infill development, with an average density of only nine to 12 dwellings per hectare. This produces a land use pattern that is difficult to service effectively with public transport.A lack of integration between land use and transport planning has contributed to this situation. Early consideration of how new development can better support public transport, walking and cycling is required at the strategic planning stage.A housing study has been commissioned by Northern Tasmania Development to investigate the demand and form of housing required in Northern Tasmania, including the location of development until 2031. Increasing housing development opportunities in the inner city and ensuring new housing makes better use of existing services and infrastructure, are key objectives of this study.
OpportunitiesIntegration of land use and transport planningIntegration of land use and transport planning (particularly the planning of passenger transport services), can ensure more effective and efficient provision of public transport and improve opportunities for transport-oriented walking and cycling.The development of a bus network plan for Greater Launceston would assist in identifying land for future development which can be effectively serviced by public transport. The network plan would need to show:
1. The existing bus network.2. Planned network alterations based on the bus services review (see Bus Network
section).3. Logical extensions to bus routes.
In order to encourage greater uptake of public transport, walking and cycling, land use patterns need to provide opportunities for more people to live closer to high frequency public transport corridors and activity centres. This results in more people living closer to jobs, shops and services, thereby reducing trip length and car dependency. There is potential to encourage greater levels of infill development, in the form of higher residential densities and mixed use in the inner city, through re-developing underutilised industrial and commercial land parcels.Where greenfield development occurs, it should be focused around logical extensions of public transport corridors, with street layouts that support walking and cycling.
Residential density
55

The design of our urban areas, such as the residential density and diversity of land uses (mixed use) are important factors in supporting the effective provision of public transport and greater utilisation of walking and cycling networks. It should be acknowledged that there are other factors that affect the uptake of public transport, such as the quality and cost of public transport and supply and pricing of car parking.Research from the Heart Foundation indicates that without a minimum threshold of residential density, public transport and local shops and services are not viable, nor are there sufficient populations to create vibrant local communities.41
Residential density targets of a minimum of 15 dwellings per hectare (gross density), or 16 (net density) for greenfield sites proposed by other Australian states are modest in comparison to international targets. Recent research from the Heart Foundation suggests that density targets should be much higher, with 20 dwellings per hectare (net) to encourage walking and 35-43 (net) to ensure effective public transport provision (see Table 5).
Table 4 Minimum levels of density required to facilitate walking and public transport42
Net density(75 per cent of land area)dwellings per hectare
Gross density(81 per cent of land area)dwellings per hectare
Walking 20 18Public transport 35-43 32-40
The Greater Launceston Plan, which provides a long-term strategy for land use planning in the region, outlines a target density of nine to 12 dwellings per hectare (net) for greenfield sites, which is well below the accepted national standard and the density suggested by recent research from the Heart Foundation. While nine to 12 dwellings per hectare is an overall density target, mechanisms should be explored to encourage higher densities along key public transport corridors and around activity centres.Development that supports the effective provision of public transport, walking and cyclingThrough both its location and design, future development needs to more effectively support the provision of public transport and walking and cycling infrastructure. This could be achieved by developing planning instruments such as the Tasmanian Planning Scheme, regional land use strategies and any related policies. Genuine strategic planning (in the form of a bus network plan and structure planning) can provide guidance on how areas can be effectively serviced by public transport. Guidance is
41 B Giles-Corti, K Ryan, S Foster, prepared for the Heart Foundation, Increasing density in Australia, 2012.42 B Giles-Corti, P Hopper, S Foster, M Javad Koohsari, J Francis, prepared for the Heart Foundation, Low density development: impacts of physical activity and associated health outcomes, 2014.
56

also required at the development approvals stage in terms of residential density, street layout and design.Future developments that do not meet requirements for location, density and street layout may not qualify for the provision of public transport services.Walking and cycling needs should be identified at the planning stage of a development, so they can either be provided for when the land is developed (eg. provision of end-of-trip facilities for major trip attractors), or ensure that infrastructure can be developed at a later date through the provision of adequate space and connections. Consideration also needs to be given to walking and cycling connectivity beyond the site boundary, particularly to adjacent residential development and trip attractors, or to greenfield sites which have been identified for future development.
57

Transport cultureAn improved understanding of the wider benefits of walking, cycling and public transport.
Objectives Strategies
Work with local Government to develop and implement agreed priorities to support walking, cycling and public transport.
Improve information about public transport, walking and cycling options and ensure it is easily accessible.
Understand passenger travel demand and needs.
Develop quality information for the public to support the wider utilisation of public transport, and uptake of walking and cycling for transport.
Support the development of targeted travel plans and programs to encourage behaviour change toward more sustainable modes, including the development of school-based travel plans.
ContextIn order to encourage more people to use public transport and walk and cycle for transport, a major cultural change is required at both an individual and community level and within governments. There is a need to change the perception that buses are only for people that have no other options and that walking and cycling can be used for transport-related trips such as going to work, school or to the shops.This Plan focuses on improving conditions for active travel and public transport in order to make the conditions right for a cultural change.The wider benefits of encouraging more people to use public transport, walk or cycle are not well understood across government, local business and the community. An assessment of the economic, social and environmental benefits of increasing public transport, walking and cycling modal share can help to guide overall strategic transport priorities.Prioritisation of modes is typically required when considering funding allocations (e.g. road investment versus public transport) or street design (e.g. allocation of street space for different modes). An enhanced understanding of the relative merits of all transport modes helps the government to prioritise transport projects with the best outcomes. At a government level, greater cooperation and coordination of funding, including sharing costs is required to implement public transport, walking and cycling projects.
Better data collection to understand travel needs
58

Our daily trips are complex and more information (in terms of travel patterns, trip purposes and travel time) is needed in order to develop the most appropriate improvements to public transport, walking and cycling. Data collection should be targeted and focus on specific transport modes at certain locations, such as key public transport corridors and walking and cycling routes. A greater understanding of the travel needs and barriers of certain sections of the community is also required including the aged, those with limited mobility and young people. This provides an understanding of why certain sections of the community may not be using public transport or active travel.Developing a consistent structure for the on-going collection of these statistics is important to ensure trends and performance can be tracked over time. This information would assist in identifying priority areas and setting relevant mode share targets for future strategies.
Better provision of transport information can assist behaviour changeAt an individual level, there is a need to better educate the community about passenger transport options and improve the provision of travel information. Travel information which is easy to access and understand will increase the utilisation of public transport services. For example, a ‘one-stop’ information resource outlining different public transport options and the provision of real-time travel information for bus services make it easier for people to use public transport. Promotion of road rules, particularly related to walking and cycling, can assist in educating all road users, which will improve behaviour and reduce conflict. This can assist at busy locations such as intersections and crossing points, where a pedestrian’s legal right of way often conflicts with the prioritisation given to cars by the physical infrastructure.
Travel plansThe development of travel plans and programs for a workplace, school or community can increase the use of public transport, walking and cycling. Travel plans and programs assist to change travel behaviour, raise awareness of transport options and identify where conditions for walking and cycling need to be improved. ‘Part Way is OK’ is an example of an existing program which encourages primary school children to walk part way to school. Resources provide a guide for schools to collect travel data and audit walking routes. Part Way is OK is available to primary schools participating in the Move Well Eat Well Primary School Award program. A methodology for developing travel plans may encompass the elements listed below.43
1. Gather data on existing travel patterns to school by staff and students to assess typical travel distance and routes to school.
2. Analyse current conditions for travel modes, for example traffic congestion on surrounding roads, ease of car pick-up/drop-off, number of bus services and bus stop locations, and quality of walking and cycling routes.
43 Peddie, Somerville, Travel Behaviour Change through School Travel Planning: Mode shift and community engagement – results from 33 schools in Victoria, Department of Infrastructure, Victoria.
59

3. Identify targets for travel mode share changes for all modes.4. Develop strategies and actions for achieving targets.5. Implement the plan.6. Monitor and review measures, followed by adjustment as warranted.The development of travel plans, especially for schools should also include consultation with people already experienced in ‘transport training’ programs for people with a disability. A pilot travel behaviour change program conducted within the former Department of Infrastructure, Energy and Resources in 2012/13 found that supporting people to walk, cycle or catch a bus within the workplace resulted in a 10 per cent reduction in car use and a seven per cent increase in usage of alternative transport modes. The program focused on provision of information, improvements to change room and bike storage facilities, and individual travel planning.UTAS also has developed a Sustainable Transport Strategy 2012-16 which aims to increase the use of public transport, walking and cycling by its students and employees. The strategy includes a bi-annual survey of travel behaviour, which enables UTAS to understand what the barriers are to more people walking, cycling or using public transport, this is essential to understanding what needs improving ‘on-the-ground’.The 2015 survey showed a three per cent increase in the use of walking, cycling and public transport at the Newnham campus from 2013. Although sustainable travel at the Inveresk campus declined by nine per cent during the same time period, the campus still has a high use of sustainable modes at 42 per cent.44
Major employers or new developments such as schools and hospitals should be encouraged to develop travel plans. The example below shows how local government, the local school and the Department of Education can work together to encourage active travel to a new school.
44 University of Tasmania Travel Behaviour Survey 2013 and 2015, University of Tasmania
60

Box 4: Port Sorell Primary School - travel to school case study
61
Port Sorell Primary School, located 20 kilometres east of Devonport, opened in February 2013, and has approximately 300 students from kindergarten to year six. During the development of the new school, the Latrobe Council, Department of Education and the Port Sorell Primary School staff and community worked together to determine how to improve student safety around the school, engender health and wellbeing in the community by supporting students to walk/cycle/scoot to school and to encourage similar travel patterns to after-school activities. A cycle and bike-path committee (chaired by a parent), was formed and it initiated extensive community consultation around the development of active travel links to the school. Background research on issues and needs were completed through a UTAS student placement. With the involvement of the Latrobe Council which was represented on the committee, audits were undertaken of walking and cycling routes to the school from surrounding residential areas and engineering works were subsequently undertaken to improve connectivity and safety of paths and road crossings. Appropriate signage and extra garbage bins were installed on the most used routes to school. Latrobe Council staff have also developed appropriate plans for footpaths and cycleways to help connect the school with existing and developing residential areas. Bike racks were purchased for installation at the school and at identified recreational facilities around the town to encourage children to ride to school and to after-school activities. At the school, two secure spaces were provided for every five students.
Figure 12 Port Sorell School mode share
Prep 1-2 3-4 5-60%
10%
20%
30%
40%
50%
60%
70%
80%
90% Walk to schoolRide/scootTravel by carTravel by bus
School grade
Mod
e sh
are

62
The committee initially set out to organise ‘walking/cycling buses’, but this initiative was not pursued as parents made their own informal arrangements for escorting children to school. Most students now make their way to school independently. The school uses its newsletter to encourage and remind students and parents about the benefits of walking, cycling and ‘scooting’ to school. A large proportion of students walk/scoot/cycle to school, particularly in the summer. Even in winter the proportion is above average, with a ‘hands up’ survey on 4 July 2014 showing that 25 per cent of students used active travel to get to school that day (Port Sorell Primary School, 2014). This is well above the statewide average of 15 per cent (ABS, 2011). In particular, high levels of cycling (and on scooters) have been achieved (14 per cent - even in winter) compared to the statewide average of 1 per cent.The high rates of cycling and walking to the school is facilitated by:
proximity of students living near the school (a reported 85 per cent of students live within three kilometres of the school (a convenient distance to walk and cycle)
expenditure on safe, well-connected infrastructure, with foot and cycle paths installed and upgraded and providing links to the school gate
strong school support for active travel to school.
Figure 13 Port Sorell School bicycle infrastructure

ImplementationAction plan 2016-2021A five year action plan has been developed to support implementation of the strategies within the Greater Launceston Metropolitan Passenger Transport Plan. The Action Plan outlines the lead organisation responsible for progressing the actions and those key stakeholders who need to be involved. The Action Plan also identifies high priority actions (labelled as high), which need to be undertaken in the next three years.State, local Government, transport operators and community groups will need to work together to implement the actions as resources, opportunities and priorities allow. The Action Plan will require regular monitoring on progress of the actions. This should occur every two years.Investment decisions need to be based on the priorities outlined in the Action Plan and other relevant plans such as the Principal Urban Cycling Network, the bus services review and the service standards project.The Action Plan will be reviewed in five years (2021). The review will include an evaluation of progress on the actions. A second five-year action plan will be developed after the review based on the principles, vision and strategies outlined in this Plan. That review, in conjunction with stakeholder consultation, may highlight strategies that require updating.
63

Action PlanBus networkStrategy Actions Lead
organisationsStakeholders
Priority
Develop new service standards for public transport provision to guide the development of public transport networks.
Develop and implement Public Transport Service Standards
Department of State Growth
Bus operators
H
Create direct, simple and efficient route patterns that connect activity centres.
Undertake a Bus Services Review which will:
Identify inefficiencies in both the general access network and student-only network, such as duplication of services.
Quantify inefficiencies in terms of resources – labour, bus operation cost and peak buses.
Develop consistency in student-only bus service delivery, such as a consistent school bus pick-up/drop-off window for Metro and private operators.
Identify student-only services that can be converted to general access.
Department of State Growth
Bus operators, Department of Education, relevant schools, UTAS and TasTAFE
H
Determine levels of service frequency based on work undertaken as part of the Passenger Transport Service Standards and Bus Services Review.
Department of State Growth
Bus operators
H
Develop a revised Bus Network based on the Bus Services Review.
Department of State Growth
Bus operators
H
Improve co- Identify short-term integration of private Department of Bus H
M=Medium

ordination and integration of services.
operator and Metro services, particularly where both use the same urban routes.
State Growth operators
Investigate the improved coordination of services (Metro and private operators), including timetabling, common ticketing and fare structures and consistent branding post-2018-19.
Department of State Growth
Bus operators
M
Develop bus stops that provide passenger amenity and are accessible, and support wider network improvements such as bus transfers and efficient route design.
Investigate the Launceston CBD interchange (St John Street) to determine the most effective location and design in terms of passenger convenience, amenity and bus operational improvements including the efficiency of bus movements through the CBD.
City of Launceston Council
Department of State Growth, bus operators
H
Consider the ongoing viability of the Launceston Transit Centre in terms of ownership, location and future needs of regional and urban fringe bus operators
City of Launceston Council
Department of State Growth, bus operators
H
Develop a bus stop hierarchy, based on patronage volumes, transfer needs and proximity to trip attractors which outlines the level of infrastructure required at each stop type.
Department of State Growth
Local councils, bus operators
M
Assess the location and spacing of bus stops and access to, based on impacts on bus travel time, proximity to key trip attractors and pedestrian accessibility.
Bus operators Local councils
M
Develop a program of bus stop infrastructure upgrades focusing on priority areas and ensure stops are accessible (DDA compliant).
Local councils, bus operators
M
Improve pedestrian connectivity to high priority bus stops (high patronage bus stops within activity centres and serving key trip attractors for example schools).
Local councils Bus operators
M
65

Ensure the design and management of our roads supports efficient and reliable bus services.
Identify the location and cause of travel time delays for buses, focusing on high frequency corridors.
Local councils, bus operators
Department of State Growth
M
Identify solutions for improving travel time reliability for buses, focusing on bus priority measures.
Local councils Department of State Growth, bus operators
M
Improve the provision of consistent, reliable and accessible service information to bus passengers through the use of technology.
Review existing passenger transport information and develop new information which is simple and easy to understand and targets the user.
Bus operators Department of State Growth
M
Investigate the development of a single ‘one-stop’ web-based public transport information resource for passengers.
Cradle Coast Authority, Department of State Growth, bus operators
M
Investigate the mechanisms and benefits of the provision of real-time travel information.
Department of State Growth, bus operators
L
Work towards providing consistent branding and marketing of public transport information, services and infrastructure.
Investigating the improved coordination of services (Metro and private operators), including timetabling, common ticketing and fare structures and consistent branding post-2018/19.
Department of State Growth, bus operators
L
Active travelStrategy Action Lead
organisations
Stakeholders
Priority
Create safer and more convenient
Identify key walking and cycling routes to schools and undertake an assessment of
Local councils, schools
Department of State
M
66

walking and cycling routes to school to support greater active travel by students.
the needs to create a safer environment, including infrastructure changes and safer speeds. Develop a program of infrastructure upgrades which can be considered in future budget processes.
Growth, Department of Education, Department of Health and Human Services advocacy groups
Develop street design guidelines for planners and engineers to assist the development of walking and cycling infrastructure.
Develop street design guidelines for the provision of walking and cycling infrastructure in both new and existing development focusing on: Ensuring the layout of development
maximises connectivity and identifies the type of links required.
Technical guidance on infrastructure, including lane widths, separation from traffic and treatment at intersections and crossing points.
Provision of end of trip facilities for major trip attractors.
Department of State Growth, local councils, LGAT
Tasmanian Planning Commission, Department of Health and Human Services, advocacy groups
M
Build efficient, useable and well-connected walking and cycling links into new developments to enhance connectivity and permeability.
Ensure street design guidelines are incorporated into the planning and approval process for new developments.
Department of State Growth, local councils, LGAT
Tasmanian Planning Commission, Department of Health and Human Services, advocacy groups
M
Retrofit improved walking and cycling links into existing roads and streets.
When road upgrades are planned, incorporate the needs of cyclists, utilising the Department of State Growth’s Positive Provision for Cycling Infrastructure as a guideline.
Department of State Growth, local councils
Cycling advocacy groups
H
67

Identify local streets where opportunities exist to improve conditions for walking and cycling, including missing links. Develop a program of infrastructure upgrades which can be considered in future budget processes.
Local councils Advocacy groups
M
Create pedestrian friendly urban centres and retail streets.
Identify high-priority pedestrian areas and improve conditions for pedestrians, including: reallocation of road space; giving pedestrians priority; and creating a safer street environment (including lower speed limits).
Local councils Department of State Growth, advocacy groups
M
Improve crossing opportunities at intersections for pedestrians and cyclists.
Identify intersections and crossing points that are unsafe for pedestrians and cyclists. Focus initially on areas with higher demand, such as activity centres and between major trip attractors or vulnerable users (schools, hospitals and aged-care facilities).
Local councils Department of State Growth, Department of Education, Department of Health and Human Services, advocacy groups
M
Determine improvements with a focus on solutions that can be replicated elsewhere (e.g. pedestrian signal phasing, footpaths crossing commercial driveways).
Local councils Department of State Growth, advocacy groups
M
Continue to implement existing cycling and walking infrastructure plans and proposed projects.
Implement the Principal Urban Cycling Network, the Greater Launceston Arterial Bike Network and local Government bicycle strategies and determine route adjustments or additions as required.
Department of State Growth, local councils
Advocacy groups
M
Develop consistent Implement the State Growth Cycleway Department of Cycling H68

signage and way-finding systems to improve pedestrian and cycling connectivity.
Directional Signage Resource Manual. State Growth, local councils
advocacy groups
Identify high volume pedestrian areas to develop and implement way-finding systems
Local councils Advocacy groups
M
69

Land use planningStrategy Action Lead
organisationsStakeholders
Priority
Investigate planning and regulatory mechanisms to provide a stronger link between land use planning and passenger transport.
Investigate planning mechanisms within the Resource Management and Planning System and regulatory mechanisms within the road and open space authorities to ensure that, through its location, design and density that development supports public transport, walking and cycling.
Department of State Growth, local councils
Northern Tasmania Development, Department of Justice
M
Provide a bus network plan that is tailored for land use planning purposes to facilitate better integration of land use and transport planning.
Develop a bus network plan as part of the Bus Services Review which identifies existing and logical extensions to service new development on the urban fringe, or infill development within established areas.
Department of State Growth, local councils, bus operators
Northern Tasmania Development
H
Ensure fit for purpose walking and cycling links are incorporated in the design of new developments prior to planning approval.
Through promotion and information, ensure developers are aware of the requirements of the street design guidelines, and relevant planning provisions.
Department of State Growth, local councils, Tasmanian Planning Commission
Northern Tasmania Development
M
70

Transport cultureStrategy Action Lead
organisationsStakeholders
Priority
Understand passenger travel demand and needs
Determine passenger transport needs by reviewing existing data, identifying gaps and determining requirements for new data collection.
Department of State Growth, local councils
Bus operators, advocacy groups
L
Develop quality information for the public to support the wider utilisation of public transport, and uptake of walking and cycling for transport.
Review existing passenger transport information and develop new information which is simple and easy to understand and targets the user.
Bus operators, local councils
Department of State Growth, advocacy groups
M
Support the development of targeted travel plans and programs to encourage behaviour change toward more sustainable modes, including the development of school-based travel plans.
Develop a generic framework for the development of school travel plans, based on programs in other jurisdictions.
Department of State Growth, local councils, Department of Education
Department of Health and Human Services, Schools, advocacy groups, bus operators
M
Identify and work with schools to participate in a pilot travel plan program.
Department of State Growth, local councils, Department of Education
Department of Health and Human Services, Schools, advocacy groups, bus operators
M
71

Appendix A - Stakeholder consultationA number of key stakeholder consultation sessions were conducted to inform the development of this Plan, including: Options assessment with various stakeholders: September 2013. Bus operators: November 2013. Council land use planners: December 2013.Problem identification with various stakeholders: December 2012. A more complete list of stakeholder organisations consulted during the Plan’s development includes: City of Launceston Council West Tamar Council Meander Valley Council Metro Tasmania Private bus operators Taxi Combined Services Launceston Northern Tasmania Development Heart Foundation Bicycle Tasmania Tamar Bicycle Users Group UTAS ParaQuad TasCOSS RACT.

Appendix B - Plan scopeThe following considerations are not within the scope of this Plan:Car, motorcycling and freightPassenger transport by car and motorcycles and freight are not covered within this Plan. However, the Plan’s strategies may have an impact on these modes in terms of overall capacity and function of the road network, which needs to be taken into consideration during the implementation of the Plan’s actions.Community transport and taxisAlthough small vehicle passenger transport options (typically community transport and taxis), are an important component in the overall transport mix, the development of initiatives for this sector are outside the scope of this Plan. The Department of State Growth’s State Infrastructure Strategy and the Northern Integrated Transport Plan specify goals to integrate the commercial and community passenger transport sectors. On behalf of the Tasmanian Government, The Tasmanian Council of Social Services (TasCOSS) has undertaken a ‘Transport in the Community’ Project to identify ‘transport gaps’ and potential options for addressing those gaps using existing transport resources. The final report of this project was completed in October 2014.The Tasmanian Government will draw on TasCOSS’ work to develop a Transport Access Strategy to provide more integrated and coordinated public transport services for all Tasmanians, particularly those disadvantaged through economic circumstances, age or disability. FerriesFerry services are also beyond the scope of this Plan. Ferries are not considered viable in Launceston due to a lack of infrastructure, the nature of the Tamar River and adjacent floodplain, and lack of suitable population catchments within close proximity of the river.
73

Appendix C - Total kilometres travelledTotal vehicle kilometres travelled (VKT) is a key measure of the demand for road infrastructure and road space. It is usually the case that as a city increases in geographical extent and population, average trip distance also increases. This increases VKT, even if the mode share of cars remains the same. Cities with high car mode share will have much higher levels of VKT. What makes car dependency particularly unsustainable for growing cities is that as the city expands we drive further and for longer to access jobs, shops and services. VKT, and therefore the demand for road space, will increase at a faster rate than population growth. VKT measures are only available for Tasmania as a whole and Hobart, but it is highly likely that Launceston would display similar trends to Hobart VKT patterns. Hobart has exhibited increasing per capita private travel during the last century, with trip distances growing as the population expanded. The average private trip distance for Hobart increased from approximately 8,000 km per person in 1966/67, to 11,800 km in 2003/04, just under a 1.5 fold increase. During this time population increased by a factor of 1.7, resulting in VKT growing by a factor of 2.545. As both Launceston and Hobart are highly car-dependent and low density cities, the total VKT has increased at a much higher rate than population growth.For Tasmania, VKT has been steadily increasing, reaching a peak in 2004, with levels stabilising since this time. Cars and light commercial vehicles have had a significant increase since the 1960s (see Figure 14).Increasing the capacity of roads through road widening, or construction of entirely new roads, is expensive and only encourages more people to drive, resulting in the phenomenon of ‘induced traffic’ and, in areas of higher demand, traffic congestion. This erodes the benefit of the investment in new road infrastructure, as a congestion problem invariably reappears. The strategies outlined in this Plan aim to constrain VKT by improving alternative modes of transport that enable a modal shift away from the car. This will help to reduce the need for costly investment in the provision of new road infrastructure.
45 Hobart’s population increased from approximately 123,000 in 1966/67 to 208,000 in 2003/04. Accounting for population and average trip distance, total VKT increased from approximately 1,000 million kilometres to 2,500 million kilometres annually.
74

Figure 14 Annual Estimates of VKT by vehicle type in Tasmania46
46 Bureau of Infrastructure Transport and Regional Economics, 2012.
75
1965
1966
1967
1968
1969
1970
1971
1972
1973
1974
1975
1976
1977
1978
1979
1980
1981
1982
1983
1984
1985
1986
1987
1988
1989
1990
1991
1992
1993
1994
1995
1996
1997
1998
1999
2000
2001
2002
2003
2004
2005
2006
2007
2008
2009
2010
2011
2012
0
1
2
3
4
Car
Motor cycle
Light commercial
Rigid truck
Articulated truck
Bus
VK
T B
illio
ns)

Appendix D - Time-area effectsThe ‘time-area effect’ is an important measure of the spatial requirements for different modes of travel over a particular timeframe47. Importantly, it considers both travel and parking impacts. A transport system which can provide similar benefits and convenience of travel with a lower time-area effect, is more spatially and cost-efficient. Time-area effects do not consider other important elements of a transport system, such as the health benefits of active travel or pollution impacts from vehicles. The time-area effects of commuters using different transport modes has been analysed in Launceston based on a typical working day. Walking, cycling and cars have a similar impact for the travel component, with the larger space requirement of cars being partially offset by the faster travel speed (Table 6). However it is the parking of cars, particularly in higher value locations such as the CBD, which result in an inefficient use of space. 48 Walking and buses have a negligible parking requirement49 and are a highly spatially efficient form of travel for urban areas. These modes cater to different types of travel, with walking typically suited to short trips under two kilometres and buses for longer trips over two kilometres. Cycling is also efficient, particularly over a medium range of two to five kilometres, with a relatively minor parking requirement compared to car travel. Motorcycling, while having a similar travel speed to a car, is more spatially efficient as it has a minimal parking requirement. Someone who drives to the CBD by car and stays for 30 minutes will have a smaller time-area effect than someone who parks their car for a full work day. This is because the short-term stay frees up parking for another visitor. In contrast, a bus drops passengers off at the destination and leaves the central area, usually to deliver another service.
47 Bruun, Vuchic, Time-Area Concept: Development, meaning and applications. Transportation Research Record, Issue 1499, 2005.48 The location and value of the land used for parking is not taken into account, however the more valuable and scarce the land is, such as parking in the CBD, the greater the overall cost.49 It is assumed buses are being utilised after dropping commuters to their destination in the morning. There is some spatial requirement for bus stops, however each bus stop is utilised by a number of bus services and therefore has a low impact on a per passenger basis.
76

Table 5: Time-area effects of commuters using different modes on a typical work day in Launceston50
Mode Average speedkm/hr
Number of occupants
Travel time mins
Travel aream2
Parking aream2
Travel time area m2
mins/km
Parking time area m2
mins/km
Walking 5 1 15 3 - 9 -Cycling 15 1 15 9 2 9 64Bus 25 25 15 100 - 2 -Car 35 1.2 15 30 25 11 286Notes for Table 6: Results are given on a per commuter basis. Based on travel between the am peak (7:30 - 9:00 am) and the pm peak (4:30 - 6:00 pm). Occupants for bus travel (25 people per service) based on average Metro patronage figures for
the am and pm peak in Launceston. An equal travel time of 15 minutes is applied for each mode of travel. Accounting for the different
average speeds for each mode, the distance covered is: walking = 1.3km, cycling = 3.8km, bus = 6.3km, car = 8.8km.
50 Department of State Growth, 2014.
77

Appendix E - Launceston metropolitan area bus patronage forecast analysisThe Department of State Growth undertook a modelling exercise to estimate patronage impacts associated with implementation of a preferred bus network for the Launceston metropolitan area. The modelling was limited to the urban area, which includes Legana. The modelling was based on a passenger transport economic analysis model (LPTEAM).The aim of this analysis was to develop a more cost-effective bus system which would produce bus patronage increases. A key assumption was that the overall bus network must remain cost-neutral. Improvements to general access services need to be funded by removing inefficiencies in the current network, including reallocation of some student-only bus services.MethodThe analysis was comprised of the following stages:1. existing general access resource analysis – estimates of current operational hours and
costs2. bus stop assessment – to remove very low demand stops from the network model3. school bus service analysis – understanding of the resources and extent of the student-
only bus network, to gauge potential reallocation to the general access network4. preferred general access network model and resource analysis – identifying a preferred
network model in accordance with principles outlined in this Plan, followed by the assigning of bus frequencies
5. scenario development – three scenarios tested by LPTEAM.Existing general access resource analysisAn estimate of the current bus operational hours and costs (including labour and vehicle costs), along with the number of peak buses, was estimated. Operational hours were based on the current route network and timetabled services, along with estimates for ancillary time, such as dead running and bus driver shift change-over.Bus stop assessmentLaunceston’s general access bus stop locations and patronage were analysed to assist with identification of route sections and bus stops to be removed from the preferred general access network model. A large proportion of the bus stops removed had extremely low usage, with 47 per cent having boardings of less than two people per day.Identifying removal of these bus stops enabled the LPTEAM model to calculate the residential catchment area within walking distance of each bus stop, based on ABS Census
78

data and estimate potential patronage changes based on alterations.
School service analysisStudent-only services are not included in the LPTEAM model. However, the magnitude of bus resources dedicated to student-only services made it necessary to include them in the analysis. There are a total of 80 school services operating in Launceston, compared to 29 general access services.A key strategy of this Plan is to convert some student-only bus services to the general access network, to enable an increase in general access services on a cost-neutral basis. Student-only services could be reallocated to increase bus resources available for general access services by 10 per cent, 30 per cent or 50 per cent.Preferred general access network model and resource analysis A preferred general access network model was developed, including routes, travel times and service frequencies. Analysis was undertaken of the projected operational hours and costs, and peak number of buses required, allowing the development of three scenarios.Scenario developmentThe scenarios contain some ‘dead’ time on each run as an allowance for timetabling issues, such as dead-running and shift changeover. Each scenario tested different frequencies for the preferred network model as per resource availability:1. Low increase: (~10 per cent increase from reallocated resources): Resources for this
scenario would be mainly off-set by improving efficiency in general access services. This scenario tested patronage impacts with the following frequencies:
o 7.5 minutes from CBD to Mowbray and 15 minutes beyond to Rocherlea and UTASo 20 minutes on Elphin Road to the corner of Amy Road and 30 minutes beyond to
St Leonardso 7.5 minutes from CBD to Wellington Street via Charles Streeto 15 minutes on Hobart Road to Kings Meadows and 30 minutes beyond to
Youngtowno 15 minutes on Westbury Road to Prospect Valeo 20 minutes on West Tamar Highway through Riverside to Leganao 30 minutes to Ravenswood and Waverleyo 60 minutes to Trevallyn, Summerhill, Hadspen and along High Street/Talbot Road
to Punchbowl.
79
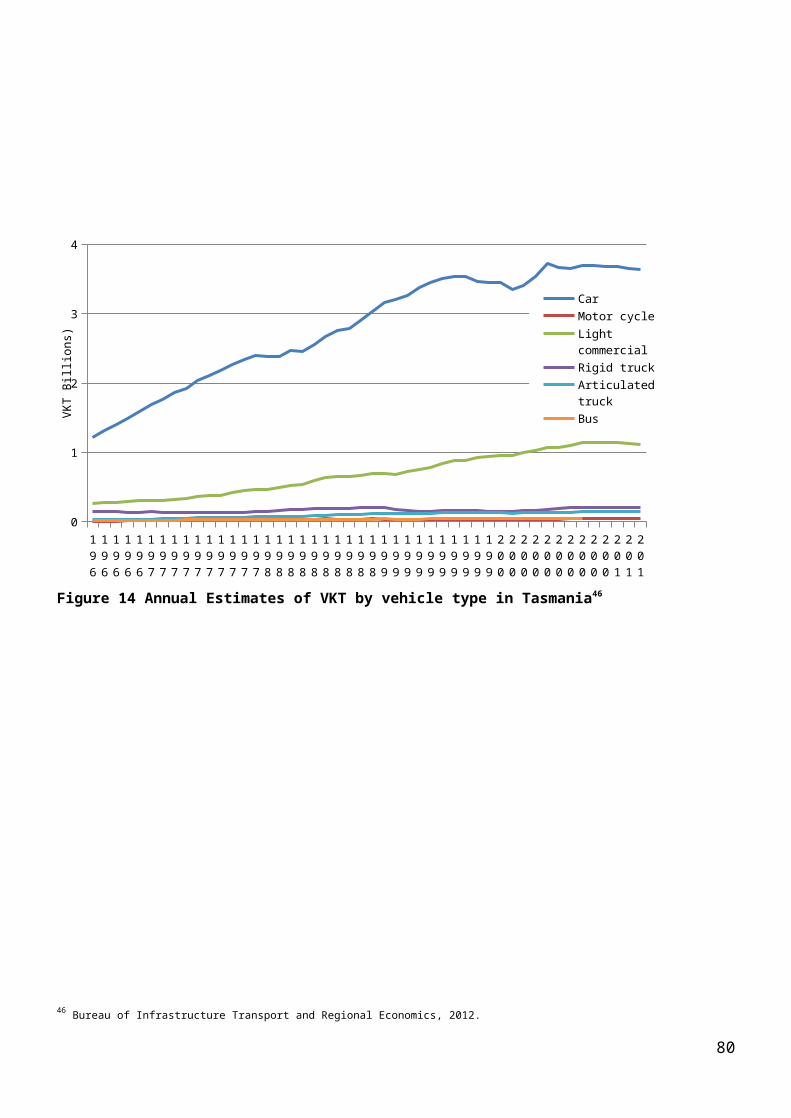
2. Medium increase: (~30 per cent increase from reallocated resources): This scenario tested the following frequencies:
o 6 minutes on from the CBD to Mowbray and 12 minutes beyond to Rocherlea and UTAS
o 15 minutes on Elphin Road to the corner of Amy Road and 30 minutes beyond to St Leonards
o 6 minutes from CBD to Wellington Street via Charles Street o 12 minutes on Hobart Road to Kings Meadows and 24 minutes beyond to
Youngtowno 12 minutes on Westbury Road to Prospect Valeo 15 minutes on West Tamar Highway through Riverside to Leganao 20 minutes to Ravenswood and Waverleyo 60 minutes to Trevallyn, Summerhill, Hadspen and along High Street/Talbot Road
to Punchbowl. 3. High increase: (~50 per cent increase from reallocated resources): This scenario
tested the following frequencies:o 5 minutes from CBD to Mowbray and 10 minutes beyond to Rocherlea and UTASo 15 minutes on Elphin Road to the corner of Amy Road and 30 minutes beyond to
St Leonardso 5 minutes from CBD to Wellington Street via Charles Street o 10 minutes on Hobart Road to Kings Meadows and 20 minutes beyond to
Youngtowno 10 minutes on Westbury Road to Prospect Valeo 12 minutes on West Tamar Highway through Riverside to Leganao 15 minutes to Ravenswood and Waverleyo 60 minutes to Trevallyn, Summerhill, Hadspen and along High Street/Talbot Road
to Punchbowl. ResultsThe results from the LPTEAM patronage forecast for these scenarios are shown in the tables below.
Table 6: Forecast average daily patronage – directed travel51
Directed travel Existing network
New network
51 Department of State Growth, 2014, LPTEAM.
80

20kph 25kph % increase
30kph % increase
Existing general access bus resources
4884 5032 3 5481 12
Increase in general access bus resources
Low - 5797 19 6537 34Medium
- 6263 28 7191 47
High - 6893 41 8318 70
81
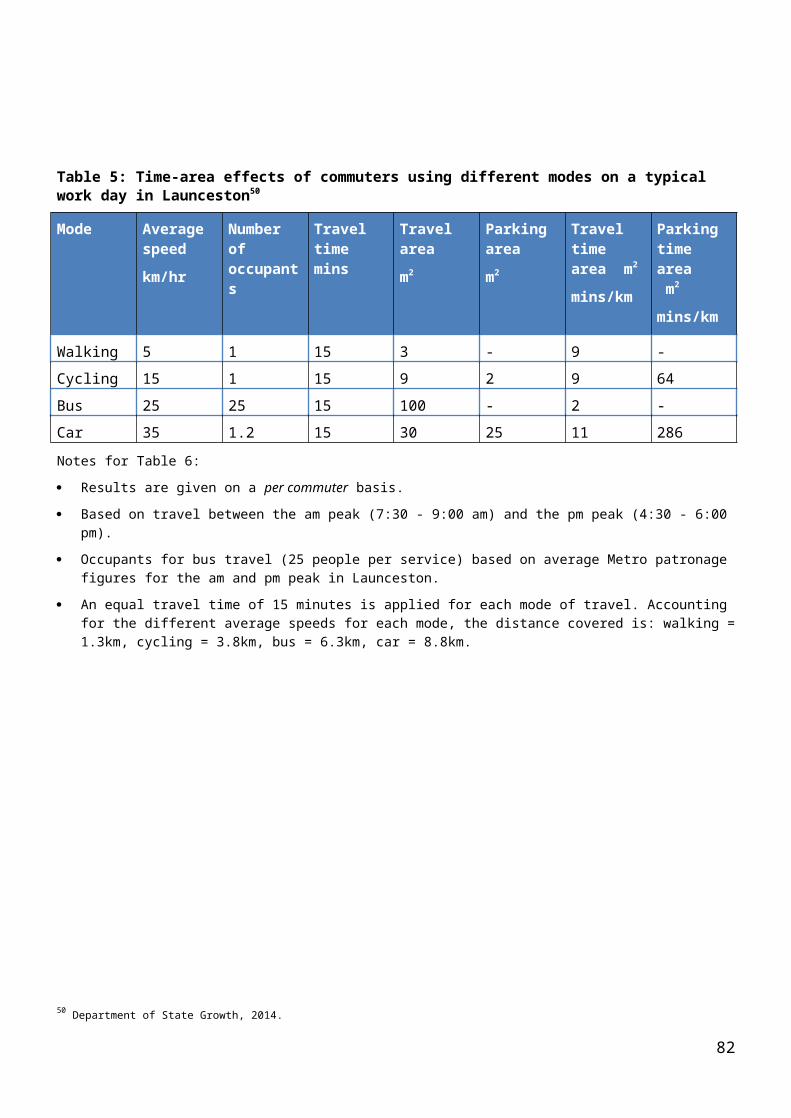
Table 7: Forecast average daily patronage – non-directed travel52
Non-directed travel Existing network
New network
20 kph 25 kph % increase
30 kph % increase
Existing general access bus resources
463 505 9 695 50
Increase in general access bus resources
Low - 1048 126 1374 197Medium - 1297 180 1615 249High - 1497 223 1977 327
Notes on Tables 7 and 8: 20 kilometres per hour (kph) is the estimated average bus speed across the existing
urban network, based on current timetables and analysis from the Background Report. 25kph is the estimated average bus speed across the proposed bus network, with faster
speeds achieved due to route consolidation along arterial corridors, removal of route deviations along residential streets.
30kph is the estimated average bus speed across the proposed bus network assuming improvements outlined above, along with implementation of bus priority measures and bus stop consolidation.
The existing general access bus resources option assumes the existing number of operational hours and buses are applied to the new network at speeds of 25kph or 30kph (depending on scale of network change, as outlined above), with improved frequency along the consolidated bus corridors.
The increase in general access bus resources option assumes some student-only bus resources will be allocated to the general access network. For example a 30 per cent increase indicates that student-only resources would be reallocated to increase overall general access resources by the same amount. The three scenarios used a 10 per cent, 30 per cent and 50 per cent increase and are considered reasonable due to the large existing allocation to student-only services.
Directed travel accounts for bus trips that are consistent and predictable, such as daily trips to work or education. Non-directed travel accounts for bus trips that are more inconsistent and unpredictable, such as to access shopping, services and leisure-related activities.
Significant patronage gains can be expected from the new network. A conservative increase in general access bus resources of 10 per cent would raise directed travel (e.g.
52Department of State Growth, 2014, LPTEAM.
82

work and educational trips) by around 19 per cent. The increase in resources results from a reallocation of some student-only bus resources to the general access network.Under this ‘low’ scenario (10 per cent increase), non-directed travel would increase significantly by around 126 per cent, likely due to the large increase in service frequency compared to the existing network. The modelling shows that directed travel for example commuters is more responsive to speed increases than to frequency. Bus reliability measures and bus stop consolidation (assumed to assist an increase in average bus speed to 30 kph) would result in a patronage increase to 34 per cent and 197 per cent, respectively. By contrast, non-directed travel appears more responsive to frequency improvements.
83

Appendix F - Travel to school patternsPatterns of travel to school for Greater Launceston are difficult to estimate, due to the absence of targeted data collection and household travel surveys. However, useful data for Tasmania and Hobart exists which provides a reasonable indication of school travel patterns in Greater Launceston. ABS survey data from 2011 shows that motorised forms of transport (bus and car trips) dominate the travel to school comprising 83 per cent, with only 15 per cent of students using active forms of travel (Table 8). In contrast, Tasmania has the highest mode share for buses (53 per cent), well above all other states which range from 19-35 per cent. This is due to widespread provision of student-only bus services and subsidised fares. Tasmania has the lowest car mode share for trips to school at 30 per cent, primarily due to the availability of student bus services. However, there is still some traffic congestion, resulting from parents driving their children to school, particularly around 8:00 am -8:30 am when the school and commuter peak overlaps.
Table 8: Method of travel to school by state in 201153
(per cent)
ACT NSW54
NT QLD SA TAS VIC WA
Walk 18 30 11 17 21 14 19 20Bicycle 5 2 7 3 3 1 3 5Bus 25 31 35 25 19 53 26 21Car 48 40 43 50 53 30 45 47Other 5 - 5 6 4 2 7 7
In comparison to other states, Tasmania has the lowest bicycle mode share (one per cent) and second lowest walking mode share (14 per cent). This is most likely a reflection of poor walking and cycling infrastructure. City of Launceston Council estimates that walking to school is undertaken by less than 15 per cent of students55, in line with the statewide average. Low rates of active travel are of concern as this contributes to poor health outcomes, such as higher rates of obesity. Travel behaviour formed during school years often extends into adulthood.
53 ABS, Method of travel to School, 2011. Note totals for each state may not add to exactly 100% due to rounding errors.54 Published data for NSW appears to include an error with a summation error.55 Launceston Pedestrian Strategy, 2013.
84

It is estimated that around 10-15 per cent of existing car traffic in Greater Launceston during the am peak is generated by school travel which represents a significant contribution to traffic movements in peak periods. This estimation is based on the household travel survey (2010) for Hobart, which showed that eight per cent of all trips are for education purposes, with 32 per cent for work purposes across the week. During the am peak, it is reasonable to consider that all trips during this time are for work and educational purposes (there is likely to be negligible travel for other purposes such as entertainment, visiting friends and shopping). Therefore, educational trips represent around 20 per cent of all trips during the am peak.
Of these educational trips, 52 per cent are classed ‘car as passenger’ and 11 per cent as driver (typically tertiary and high school students); totalling 63 per cent. This indicates around 13 per cent of all car traffic during the am peak in Hobart may be attributed to school travel purposes, based on the assumptions above.
85

86
Department of State Growth10 Murray StreetHobart TAS 7001 AustraliaPhone: 1800 030 688Email: [email protected]: www.stategrowth.tas.gov.au