Embed Size (px)
Citation preview
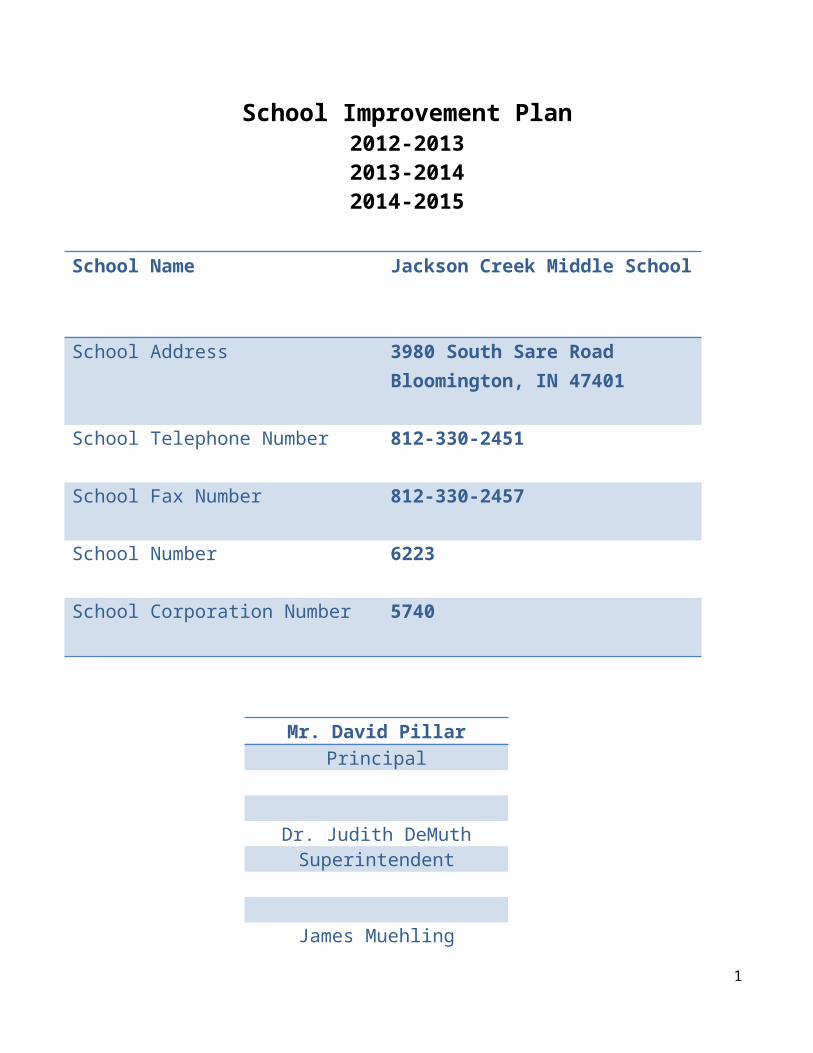
School Improvement Plan 2012-20132013-20142014-2015
School Name Jackson Creek Middle School
School Address 3980 South Sare RoadBloomington, IN 47401
School Telephone Number 812-330-2451
School Fax Number 812-330-2457
School Number 6223
School Corporation Number 5740
Mr. David PillarPrincipal
Dr. Judith DeMuthSuperintendent
James MuehlingSchool Board President
1

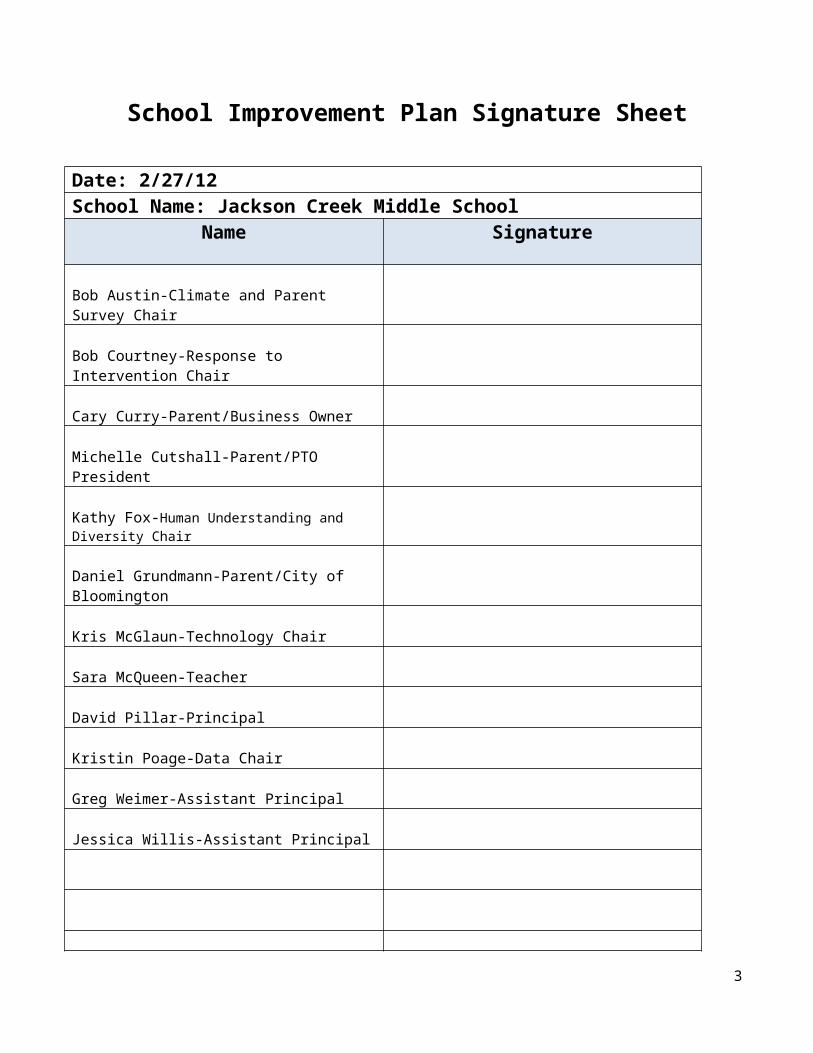
School Improvement Plan Signature Sheet
Date: 2/27/12School Name: Jackson Creek Middle School
Name Signature
Bob Austin-Climate and Parent Survey Chair
Bob Courtney-Response to Intervention Chair
Cary Curry-Parent/Business Owner
Michelle Cutshall-Parent/PTO President
Kathy Fox-Human Understanding and Diversity Chair
Daniel Grundmann-Parent/City of Bloomington
Kris McGlaun-Technology Chair
Sara McQueen-Teacher
David Pillar-Principal
Kristin Poage-Data Chair
Greg Weimer-Assistant Principal
Jessica Willis-Assistant Principal
2
I. Introduction, including the followingA. Narrative Description
Located in the rolling hills of Southern Indiana, Jackson Creek Middle School is one of three comprehensive public grade 7 and 8 middle schools within Bloomington’s Monroe County Community School Corporation. With 140,000 square feet of space located on 13 acres, Jackson Creek has an enrollment of approximately 544 students and offers a comprehensive academic program for middle school learners ranging from Community Based Special Education Programming to Accelerated Learning Programming. Jackson Creek has 38 certified and highly qualified staff members that offer courses ranging from the core curriculum subjects of science, social studies, math, and language arts, to elective offerings such as physical education, band, choir, orchestra, art, technology, family and consumer sciences, and world languages.
Since its construction in 1998, Jackson Creek Middle School has also provided numerous extra-curricular offerings including nine athletic teams, academic clubs, Science Olympiad, Jazz Band, Builder’s Club, Academic Super Bowl, Youth Network, and the National Junior Honor Society. Jackson Creek also has fostered positive partnerships with Ronald McDonald House Charities, IU Health-Bloomington’s Olcott Cancer Center, The Greater Bloomington Chamber of Commerce, The American Red Cross, and the Monroe County Humane Society.
Demographics:
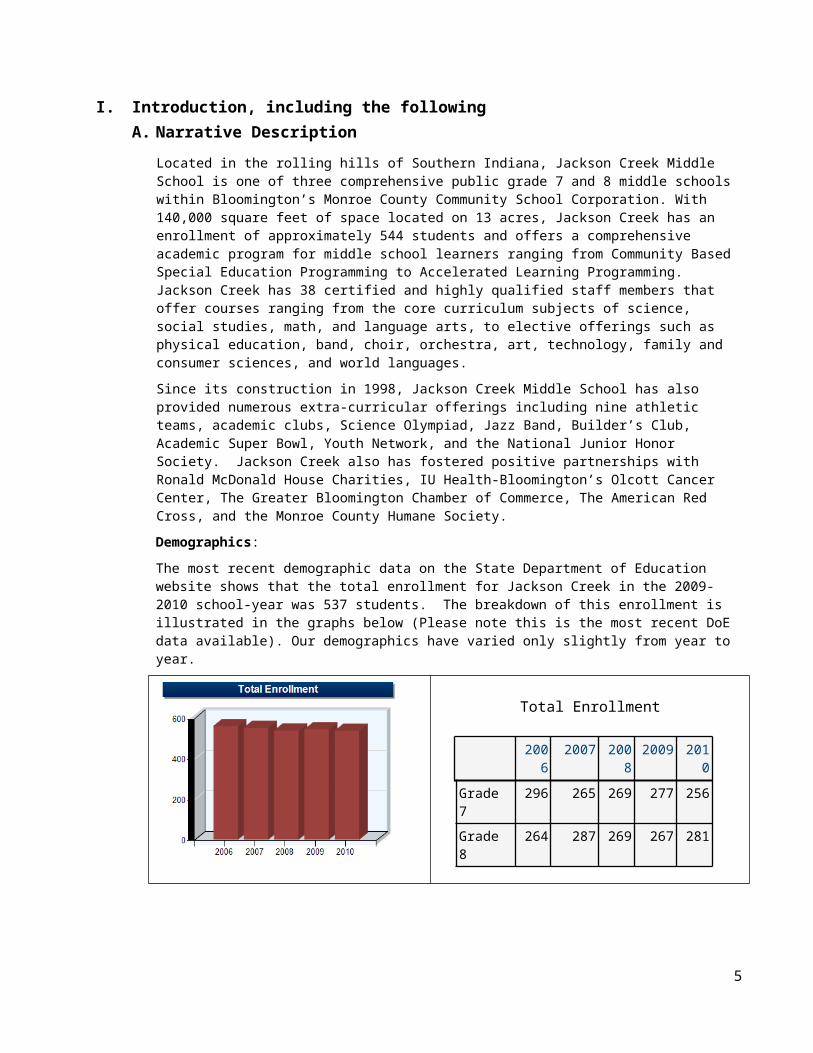
The most recent demographic data on the State Department of Education website shows that the total enrollment for Jackson Creek in the 2009-2010 school-year was 537 students. The breakdown of this enrollment is illustrated in the graphs below (Please note this is the most recent DoE data available). Our demographics have varied only slightly from year to year.
Total Enrollment
2006 2007 2008 2009 2010
Grade 7 296 265 269 277 256
Grade 8 264 287 269 267 281
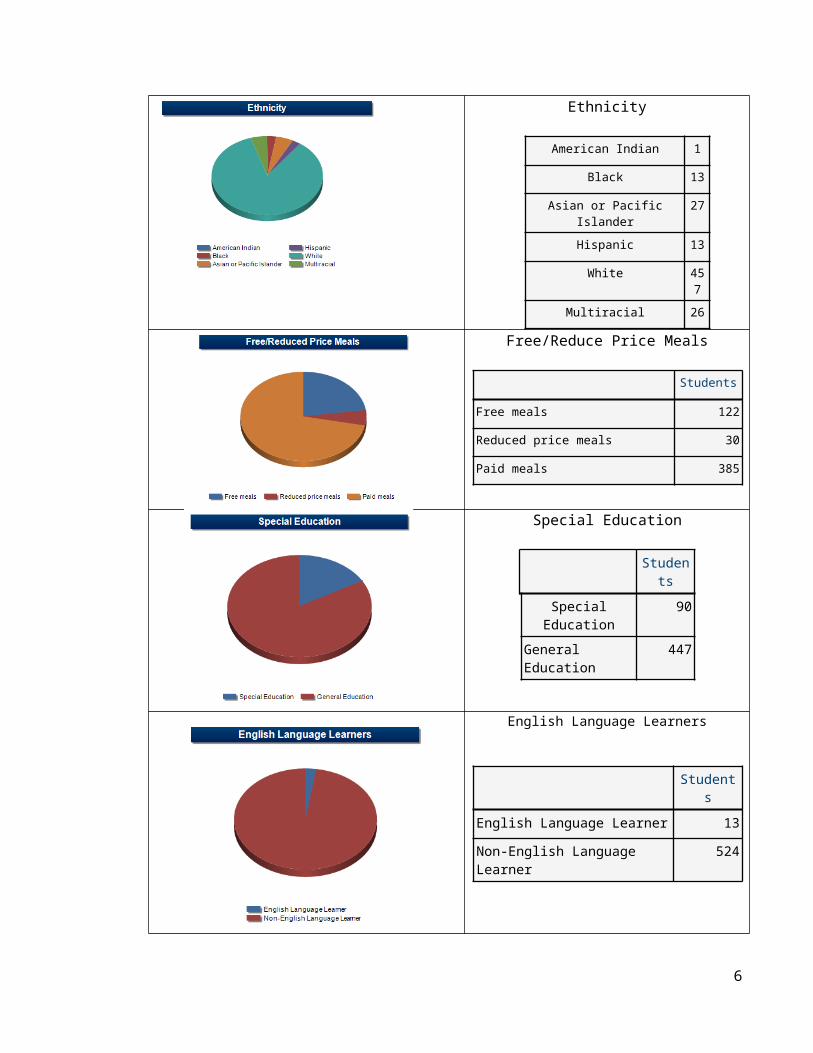
Ethnicity
American Indian 1
Black 13
Asian or Pacific Islander 27
Hispanic 13
White 457
Multiracial 26
3

Free/Reduce Price Meals
Students
Free meals 122
Reduced price meals 30
Paid meals 385
Special Education
Students
Special Education 90
General Education 447
English Language Learners
Students
English Language Learner 13
Non-English Language Learner 524
4
B. CurriculumBecoming a Professional Learning Community (PLC)Beginning in the 2010-2011, Jackson Creek made the commitment to becoming a Professional Learning Community (PLC). We use the PLC model developed by Robert DuFour, Rebecca DuFour, Robert Eaker and Thomas Many. Due to our school functioning as a Professional Learning Community, everything we do is focused on student learning. Time use and instruction has been the focus of our reorganization efforts so that learning can be the constant. This means that if a student does not learn something when it is taught then the instructional approach is changed, the length of time permitted to learn the standard is increased or other strategies are used. We do not wait for students to fail. We work to ensure that every student learns.
In order to develop Jackson Creek into a Professional Learning Community every teacher is assigned to a collaborative team of teachers based on the department in which he or she teaches. These PLC teams gather weekly for forty-five minutes (outside of their preparation time) to address four key questions. “1. What do we want students to learn? 2. How will we know that they have learned it? 3. What will we do when they don’t learn? 4. What will we do when they have learned it?” (DuFour, DuFour, Eaker, and Many, 2006). Some departments (Math and Special Education), have also been scheduled so the entire department has common preparation time for teachers to review curriculum and assessment materials. Other core subject area teachers are paired with another same-subject teacher for common preparation periods.
In order to address the first question, “what do we want students to learn?” departments of teachers have identified power standards from the state and common core standards. Next, they have “unpacked” these standards to translate the standard to what they actually want students to know, learn, and be able to do. They then have mapped out a general timeline of when those standards will be taught. PLC Teams have also developed common assessments that they implement and analyze regularly. This process targets the second question; “how will we know that they have learned it?” Data gathered from the use of common assessments provide PLC Teams with information to address the third question, “what will we do if they don’t learn?” The English Language Arts PLC has also developed scale score rubrics (using a 1-4 scale) for each of the power standards for 7th and 8th grade language arts. Other departments are working with scale scoring as well. The use of scale score rubrics ties the power standards to assessments and ensures that when teachers analyze formative, summative and common assessments that they are able to discuss student performance as it relates to learning each standard. We understand the importance of the use of scale score rubrics and continue to engage other departments in developing this tool.
Fully addressing the third and fourth questions require that our PLC Teams plan for addressing the students who have not learned and those who have already learned the standard. The framework that we are using to build these skills is Pyramid Response to Intervention (PRTI). The PRTI model was developed by Austin Buffom, Mike Mattos and Chris Weber. PRTI is “based on the premise that some students need more time and support to ensure their learning.” PRTI “provides a systemic process of intervention that is implemented school wide, rather than varying teacher to teacher.” It “provides academic and behavioral interventions – academic interventions for those who can’t learn, behavioral interventions for those who won’t learn.” It “utilizes a system of interventions that are increasingly more intensive and directive, and are commonly represented visually by pyramids with three tiers.” This year, 2011-2012, the JCMS RTI committee refined the process of identifying the tiers of support for our instructional program. We plan to continue this process, and to then use the information to identify gaps that must be addressed in order to maintain learning as the constant.
C. Assessment InstrumentsThis year, the MCCSC joined approximately 90% of other schools across the state in switching to McGraw-Hill’s Acuity test that is given three times a year in Math and Language Arts. There is also
5
an Algebra version for Acuity given to students in that class. The first Acuity Predictive is given in September and is primarily material based on standards from the previous school year. The second time the test is given, which occurs in November, the test is made up of a split between material from the current year and material from the past year. Lastly, when the test is given for the third time in February, the material is almost entirely made up of current school year standards.
Students in Algebra will take the Algebra End of Course Assessment (ECA) and students enrolled in Spanish and French will take an assessment developed in collaboration with both high school and middle school teachers to determine mastery and placement for future courses.
II. Monroe County Community School Corporation Mission
The mission of the MCCSC is to educate the students for the world of tomorrow. We commit to working with our community to deliver an appropriate and safe learning environment with a curriculum dedicated to excellence that honors the unique and diverse needs of our students.
Board of School Trustee Goals
1. Fiscal Accountability2. A Community of Quality Teachers, Leaders and Support Staff3. Rigorous Curriculum and Instruction4. Engaged Family and Community5. A Climate of Respect for Diversity and Equal Access
III. School Mission and Belief Statements
JCMS Mission:
Jackson Creek Middle School: Dream, Explore, Learn
At JCMS We Believe:
All people are unique and have the ability to learn, but with different rates and styles. All members of our school community have the right to be treated with dignity and respect. All teachers will maintain ongoing professional development and continual self-evaluation and
reflection. Communities, families, and schools share the responsibility for the education of all students. The school will provide an orderly, safe and positive environment where all members of our school
community feel welcome. The welfare of our community is dependent on how functional and adaptive all our children become. The school will open and maintain lines of communication among students, staff, parents, and the
community. Extracurricular activities will allow for growth and development of the student outside the classroom
setting. The school will have clear expectations for everyone in the school community, while allowing for the
growth of the individual. The school will focus on the intellectual, physical, emotional, social, and ethical growth and
development of the whole person. The school will foster an appreciation of creativity in all content areas and programs. The school will teach the skills necessary for all students and staff to function successfully in a
technological society.
6
The school will be involved in a continuous effort to improve and refine its services and educational programs.
All curriculum and programs of the school will be challenging, integrative, and exploratory.
IV. Current Education ProgramsA. Curriculum Supports of the Indiana Academic Standards
1. Guaranteed and Viable Curriculum
The course description and curriculum for each course are developed through building and district level committees and are based and the Indiana Standards for Learning. Curricula are developed through department PLC teams using Indiana Standards for Learning and the Common Core Standards. Additionally, MCCSC has embarked upon the process of Curriculum Mapping. All core academic subject areas have collaboratively developed power standards and curriculum maps which are available on a network drive which is available to all faculty.
2. High School Core 40/Honors Diplomas
Provisions for IAHD and Core 40
For students who have achieved advanced placement, Jackson Creek offers the following high school level courses Algebra I, Geometry, Spanish I, Spanish II, French I, and French II.
B. Instructional Strategies which support the Indiana Academic Standards
Instructional strategies are developed and refined according to the agreed upon Power Standards which have been formulated through department PLC teams using the Indiana Standards for Learning and the Common Core Standards.
C. Parental and Community Participation
Jackson Creek Middle School is focused on establishing partnerships with the community. Families of students at JCMS have the opportunity to participate in such programs as field trips, dances, athletics, textbook adoptions, library volunteers, Math Matters volunteers, Science Olympiad volunteers, Builder’s Club volunteers, and Public Law 221 committees. The principal of JCMS invites parents to have lunch with him once a month. This purpose of this informal gathering is for parents to be given the opportunity to ask questions and to learn about various topics that impact Jackson Creek Middle School. Yet another opportunity for parent involvement is the Parent-Teacher Organization (PTO). Jackson Creek Middle School PTO objectives are to: promote students’ learning and well-being in school, at home, and in the community; encourage active communication among parents, faculty, administrators, and students; advocate policies and academic programs that foster positive student development.
D. Technology as a Learning Support
The staff members, students, and parents of Jackson Creek Middle School envision a school environment that incorporates the equitable use of technology to strengthen academic achievement for all students. It is our intention to help students accomplish curricular goals by utilizing multiple instructional strategies that will be broadened with the utilization of appropriate technology. Technology is an integral part of the teaching and learning process at our school and acts as one of the primary catalysts for lifelong learning.
7
E. Recent Professional Development
In addition to monthly faculty learning meetings, fourteen JCMS certified staff members have attended “Professional Learning Communities at Work” conferences in Lincolnshire, IL or St. Charles, MO. Additionally, staff have participated in other conferences on assessment, literacy, Read 180, and technology integration at the local and national levels.
F. Cultural Competency
JCMS Cultural Competency Definition and MissionBuilding cultural competence is a process of learning to function effectively among people different from ourselves. Cultural competence requires an understanding of our own identities and values in order to relate better with others. At Jackson Creek Middle School we acknowledge that different groups of people have been more or less empowered in society and we recognize that students and educators alike can work to change institutional inequities that may exist in schools by doing the following:
Set goals for school improvement that take into consideration the differing needs of students Adapt practices to address the needs of all students Embrace differences as assets within our community Participate in and invite community involvement Create a school environment that is welcoming and safe Encourage administration, faculty, and students to explore their own cultural world views Demonstrate understanding, empathy, tolerance, and interest with other.
G. Safe and Disciplined Learning Environment
Safe and Disciplined Learning Environment
Jackson Creek Middle School provides a safe and disciplined learning environment. Reviewed annually are our Emergency and Disaster Plans and our School Handbook. These are given to the faculty and students on the first day of the school year. Faculty members review the handbook with the students and have parents also sign that they have read the contents of this document.
Student Discipline: Five Step Discipline Procedures
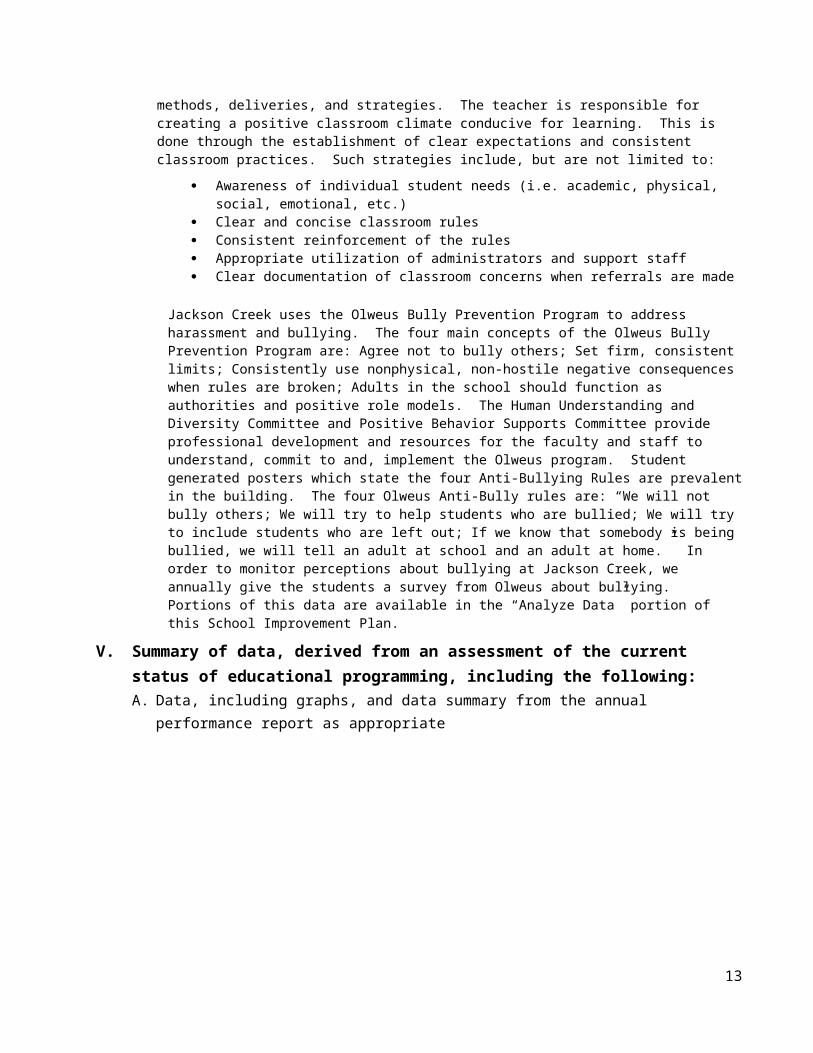
A responsible classroom is one in which a teacher exhibits an attitude of respect for students, has a positive influence in helping students develop good citizenship traits, plans a challenging curriculum to meet the needs of all students, and provides instruction utilizing various methods, deliveries, and strategies. The teacher is responsible for creating a positive classroom climate conducive for learning. This is done through the establishment of clear expectations and consistent classroom practices. Such strategies include, but are not limited to:
Awareness of individual student needs (i.e. academic, physical, social, emotional, etc.) Clear and concise classroom rules Consistent reinforcement of the rules Appropriate utilization of administrators and support staff Clear documentation of classroom concerns when referrals are made
Jackson Creek uses the Olweus Bully Prevention Program to address harassment and bullying. The four main concepts of the Olweus Bully Prevention Program are: Agree not to bully others; Set firm, consistent limits; Consistently use nonphysical, non-hostile negative consequences when rules are broken; Adults in the school should function as authorities and positive role models. The Human Understanding and Diversity Committee and Positive Behavior Supports Committee provide professional development and resources for the faculty and staff to understand, commit to and, implement the Olweus program.
8
Student generated posters which state the four Anti-Bullying Rules are prevalent in the building. The four Olweus Anti-Bully rules are: “We will not bully others; We will try to help students who are bullied; We will try to include students who are left out; If we know that somebody is being bullied, we will tell an adult at school and an adult at home.” In order to monitor perceptions about bullying at Jackson Creek, we annually give the students a survey from Olweus about bullying. Portions of this data are available in the “Analyze Data” portion of this School Improvement Plan.
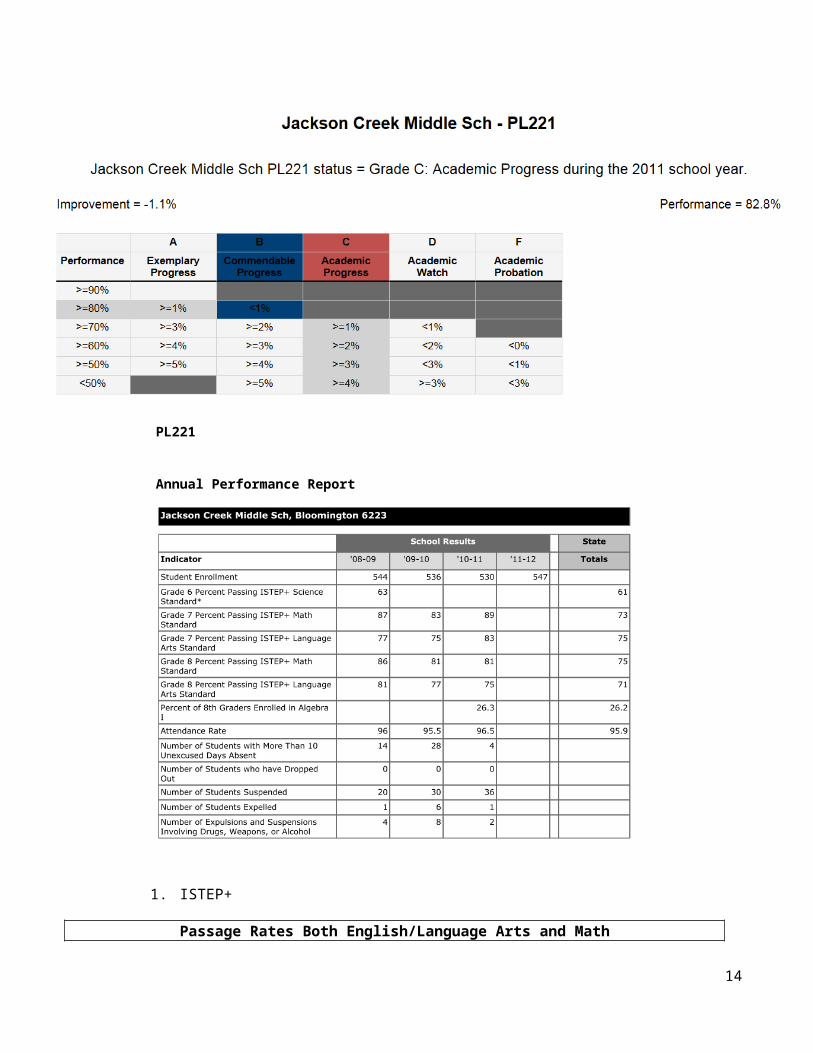
V. Summary of data, derived from an assessment of the current status of educational programming, including the following:A. Data, including graphs, and data summary from the annual performance report as appropriate
PL221
Annual Performance Report
9
1. ISTEP+
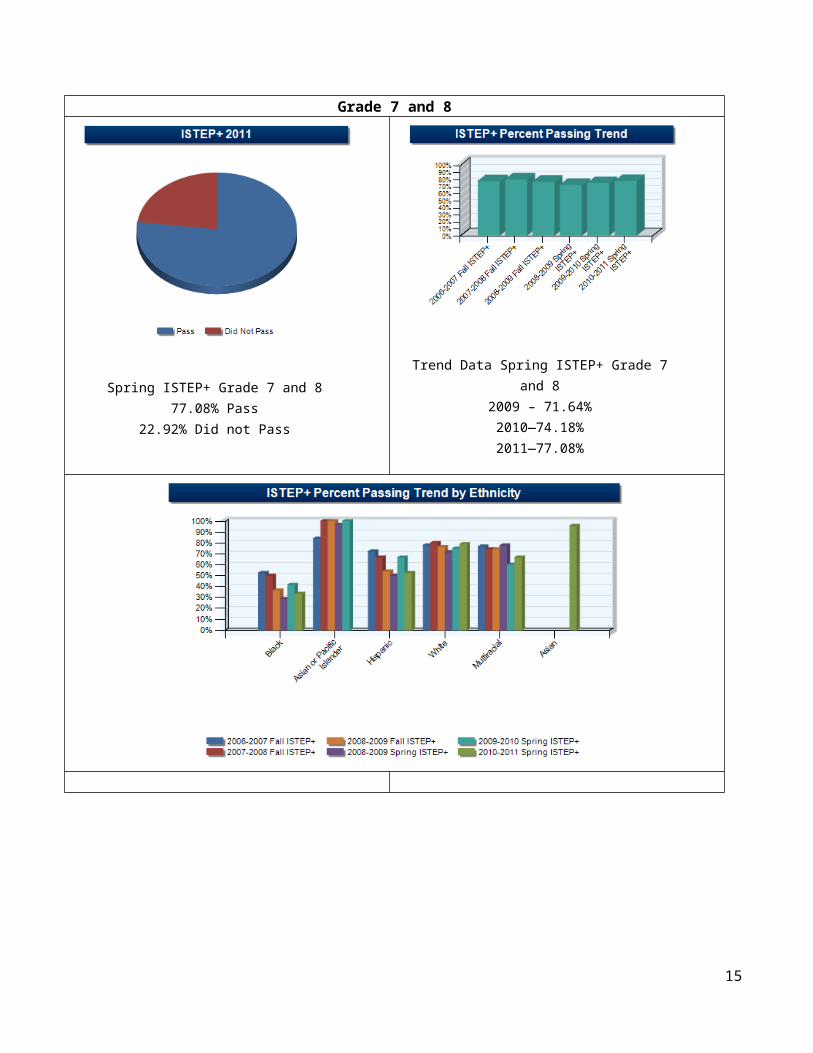
Passage Rates Both English/Language Arts and MathGrade 7 and 8
Spring ISTEP+ Grade 7 and 877.08% Pass
22.92% Did not Pass
Trend Data Spring ISTEP+ Grade 7 and 82009 – 71.64%2010—74.18%2011—77.08%
10
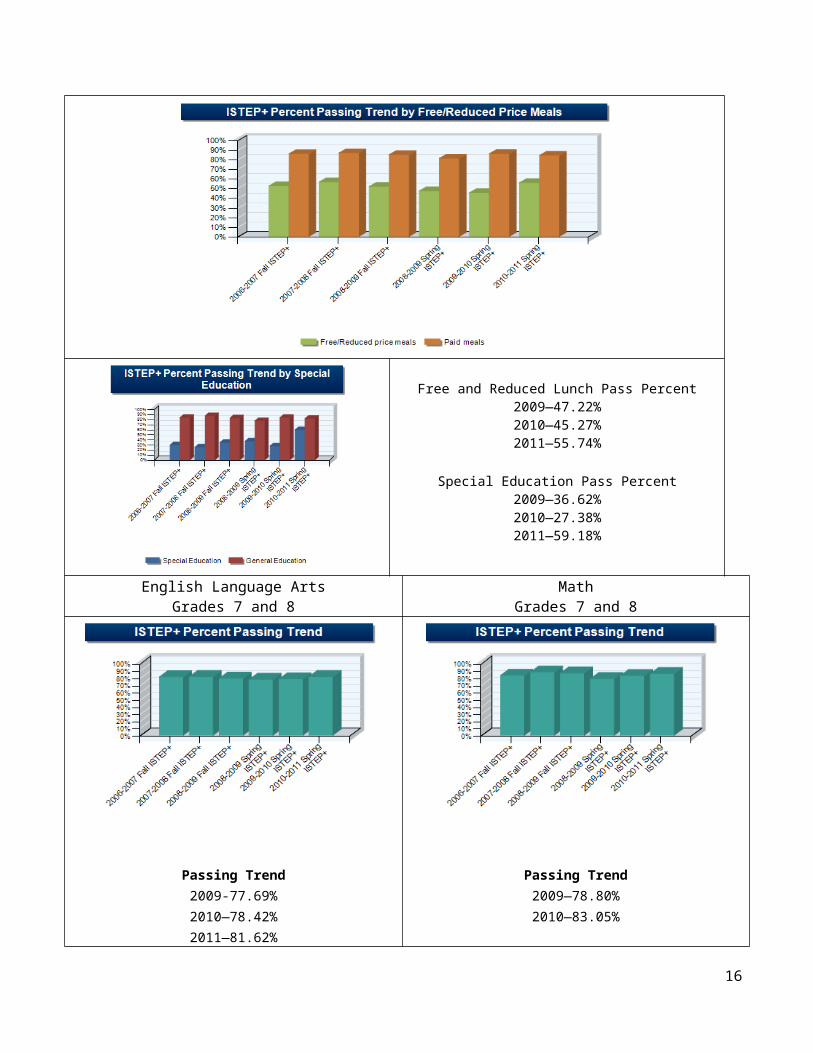
Free and Reduced Lunch Pass Percent2009—47.22%2010—45.27%2011—55.74%
Special Education Pass Percent2009—36.62%2010—27.38%2011—59.18%
English Language ArtsGrades 7 and 8
MathGrades 7 and 8
11
Passing Trend2009-77.69%
2010—78.42%2011—81.62%
Passing Trend2009—78.80%2010—83.05%2011—85.94%
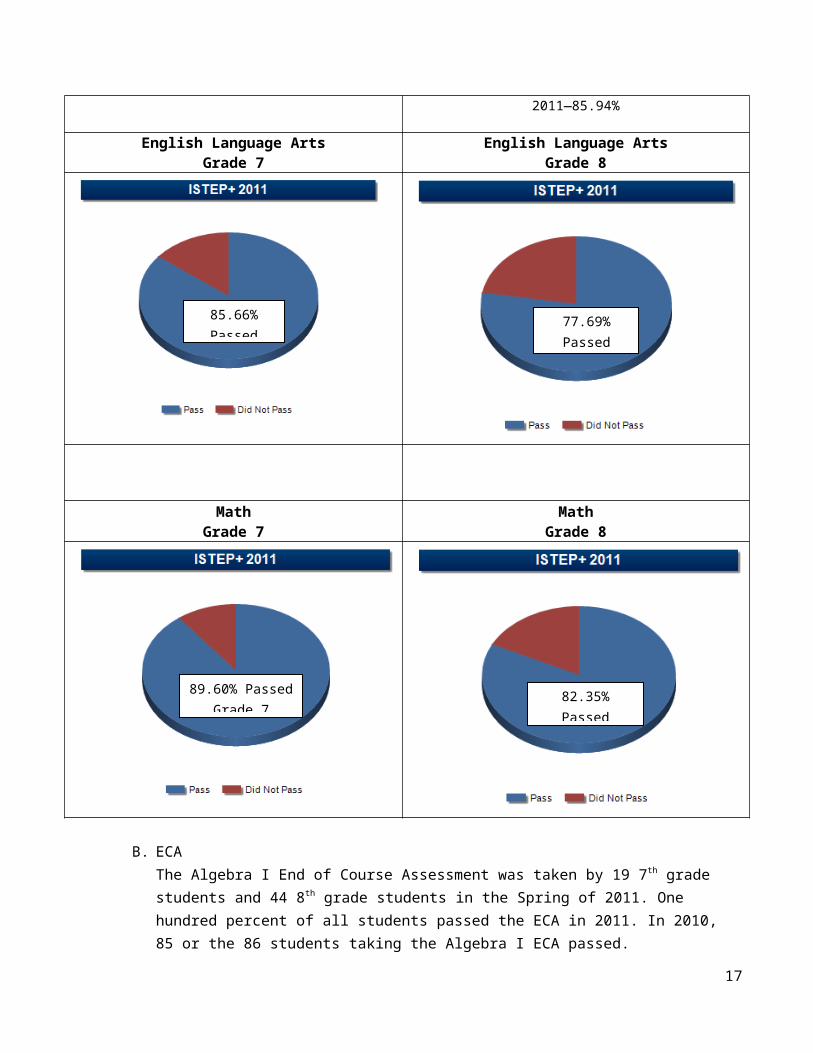
English Language ArtsGrade 7
English Language ArtsGrade 8
MathGrade 7
MathGrade 8
12
85.66% PassedGrade 7
77.69% PassedGrade 8
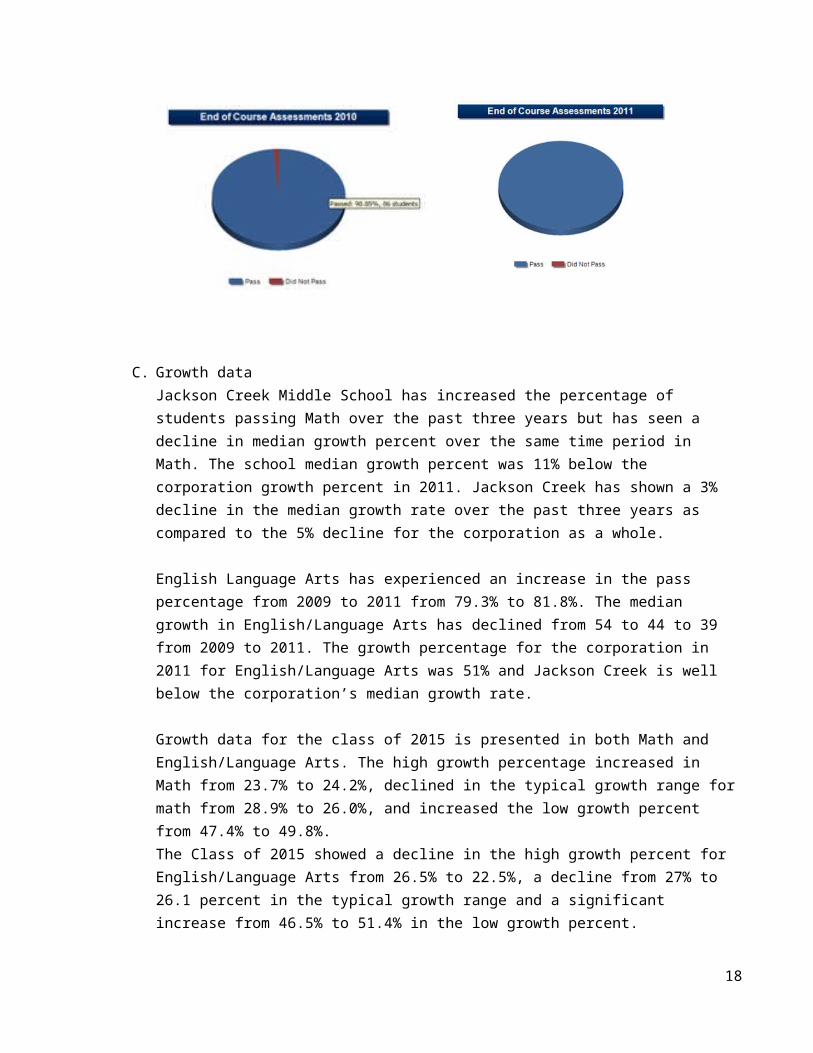
B. ECAThe Algebra I End of Course Assessment was taken by 19 7th grade students and 44 8th grade students in the Spring of 2011. One hundred percent of all students passed the ECA in 2011. In 2010, 85 or the 86 students taking the Algebra I ECA passed.
C. Growth dataJackson Creek Middle School has increased the percentage of students passing Math over the past three years but has seen a decline in median growth percent over the same time period in Math. The school median growth percent was 11% below the corporation growth percent in 2011. Jackson Creek has shown a 3% decline in the median growth rate over the past three years as compared to the 5% decline for the corporation as a whole.
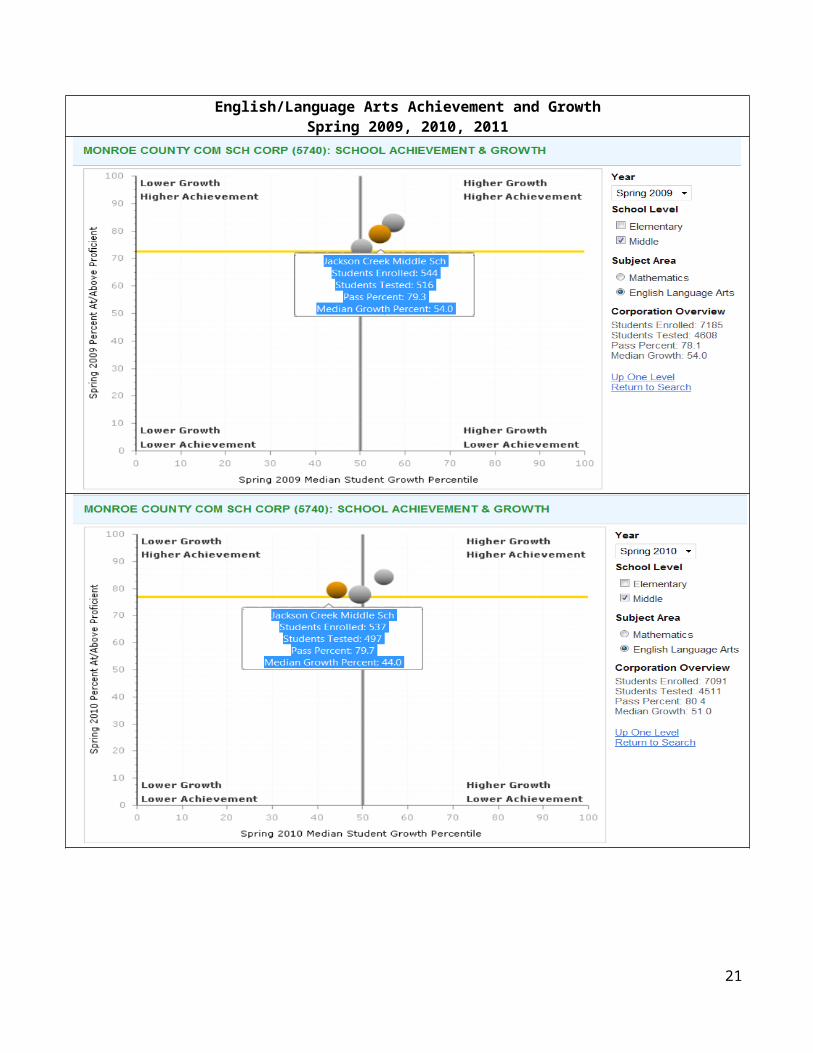
English Language Arts has experienced an increase in the pass percentage from 2009 to 2011 from 79.3% to 81.8%. The median growth in English/Language Arts has declined from 54 to 44 to 39
13
89.60% PassedGrade 7
82.35% PassedGrade 8
from 2009 to 2011. The growth percentage for the corporation in 2011 for English/Language Arts was 51% and Jackson Creek is well below the corporation’s median growth rate.
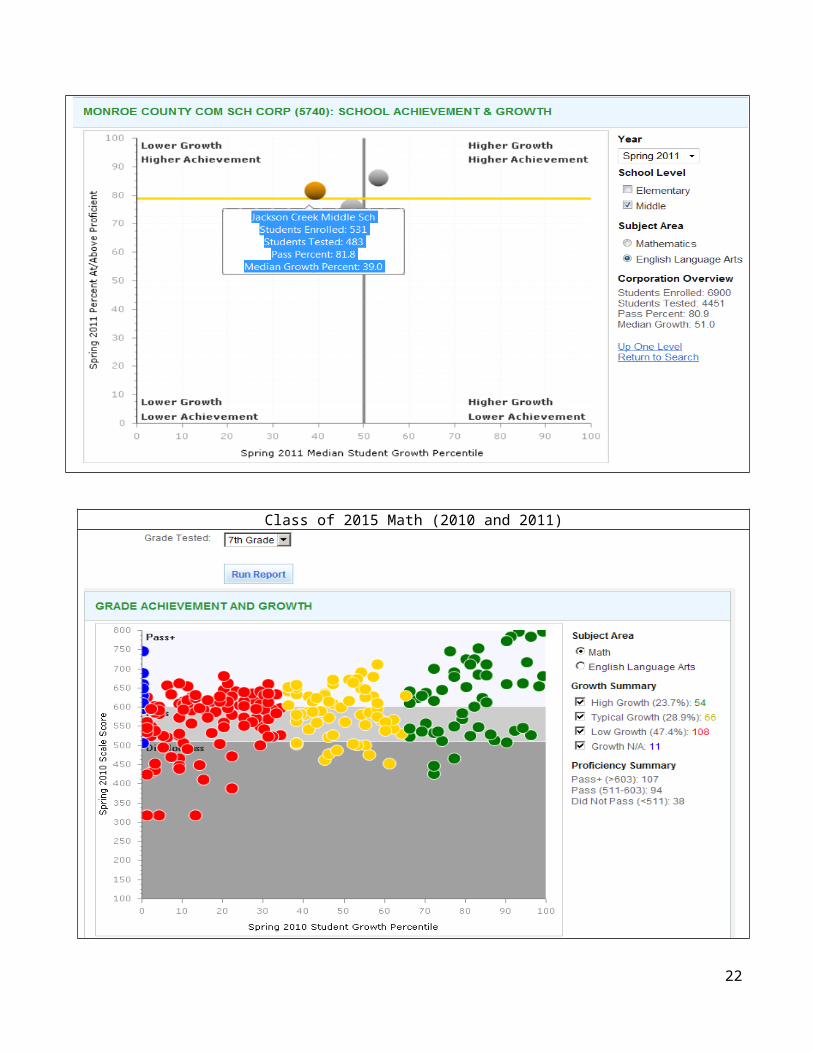
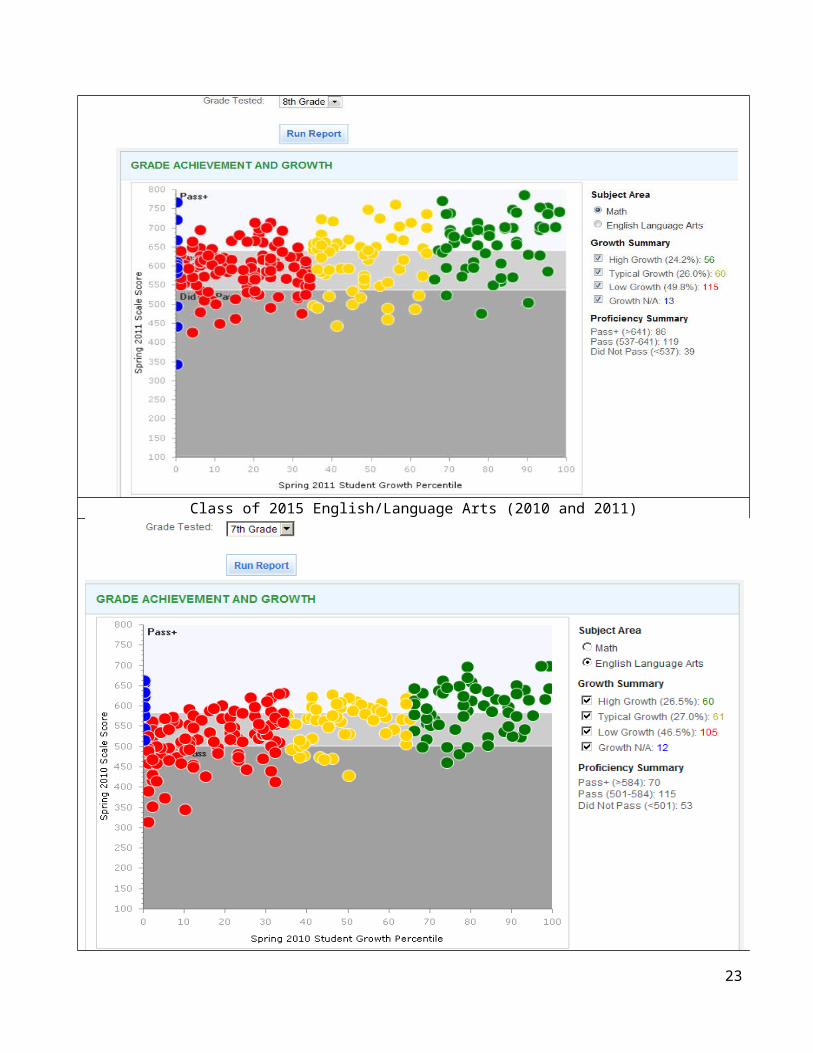
Growth data for the class of 2015 is presented in both Math and English/Language Arts. The high growth percentage increased in Math from 23.7% to 24.2%, declined in the typical growth range for math from 28.9% to 26.0%, and increased the low growth percent from 47.4% to 49.8%. The Class of 2015 showed a decline in the high growth percent for English/Language Arts from 26.5% to 22.5%, a decline from 27% to 26.1 percent in the typical growth range and a significant increase from 46.5% to 51.4% in the low growth percent.
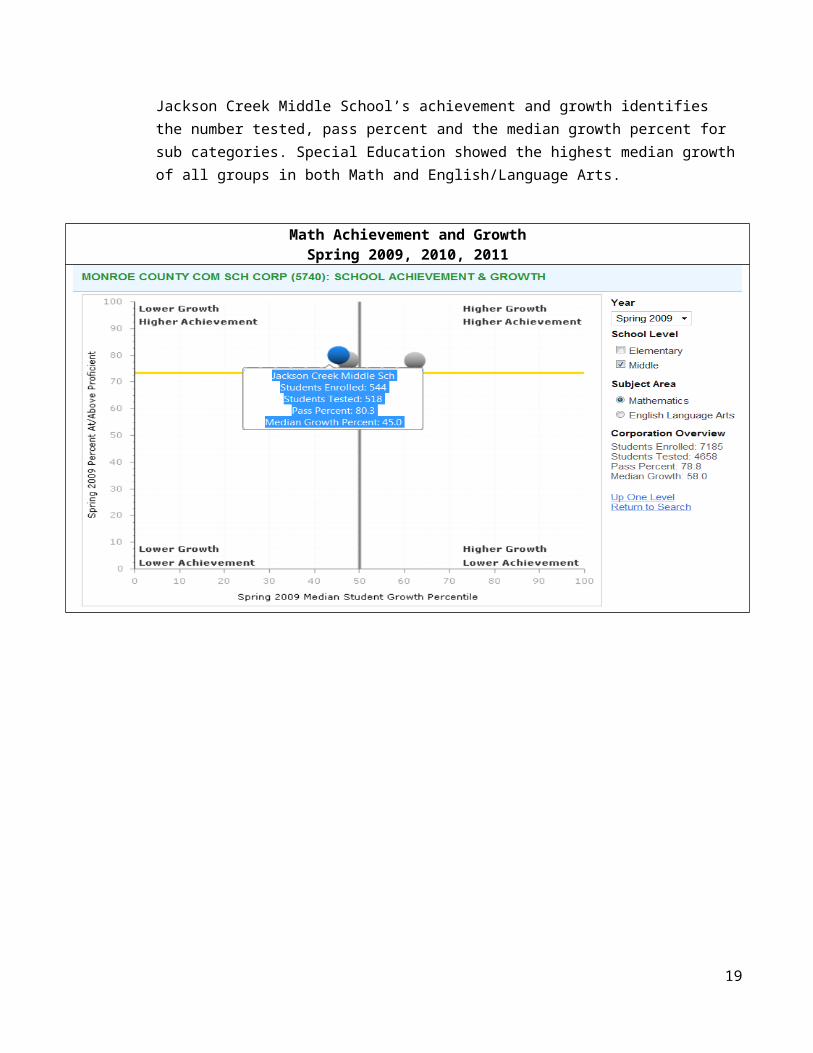
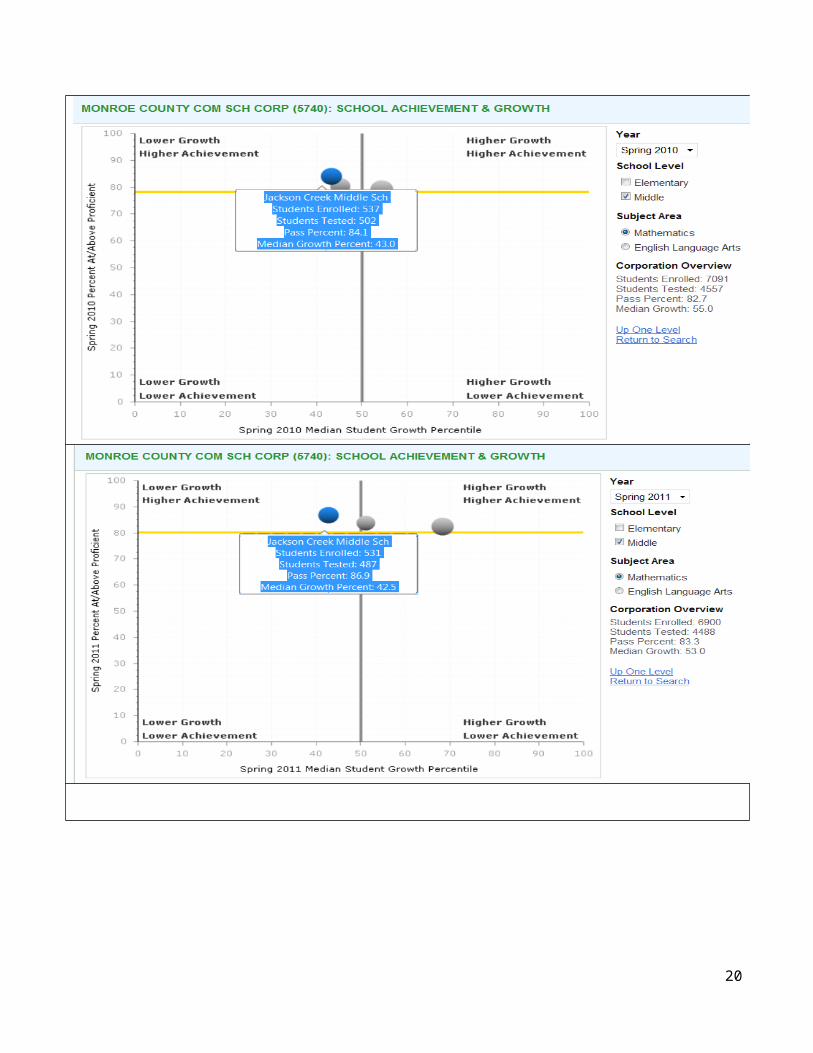
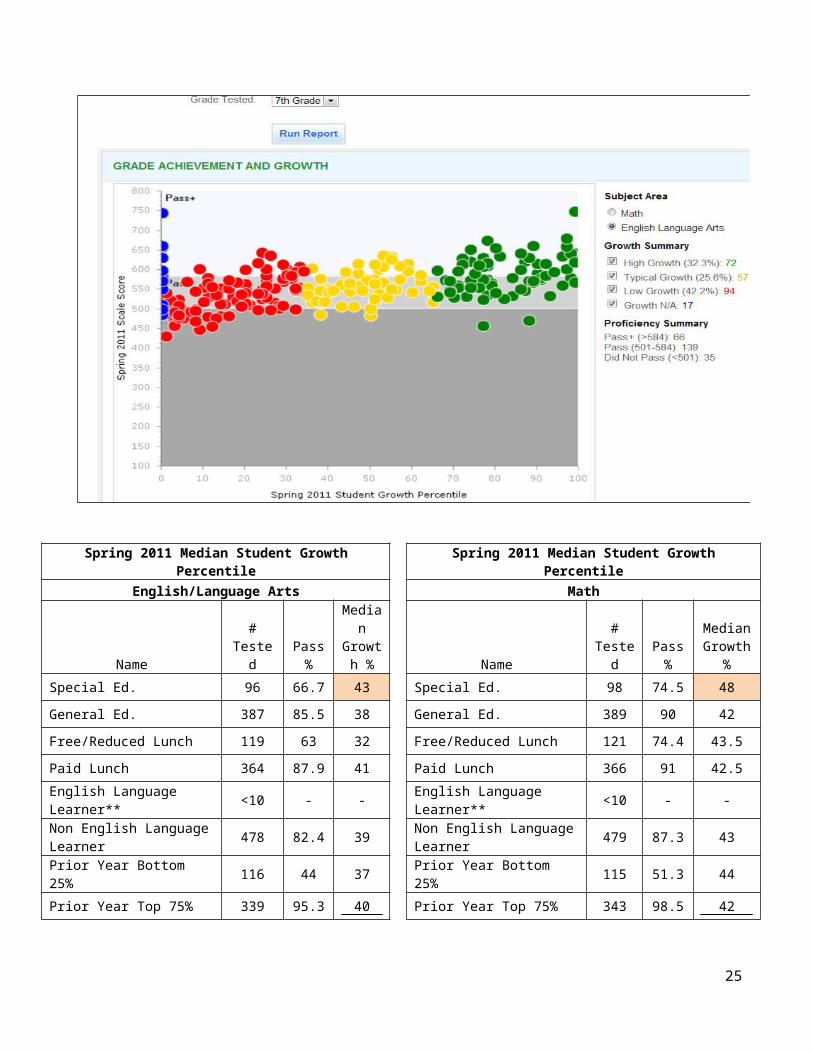
Jackson Creek Middle School’s achievement and growth identifies the number tested, pass percent and the median growth percent for sub categories. Special Education showed the highest median growth of all groups in both Math and English/Language Arts.
Math Achievement and GrowthSpring 2009, 2010, 2011
14
15
English/Language Arts Achievement and GrowthSpring 2009, 2010, 2011
16
Class of 2015 Math (2010 and 2011)
17
Class of 2015 English/Language Arts (2010 and 2011)
18
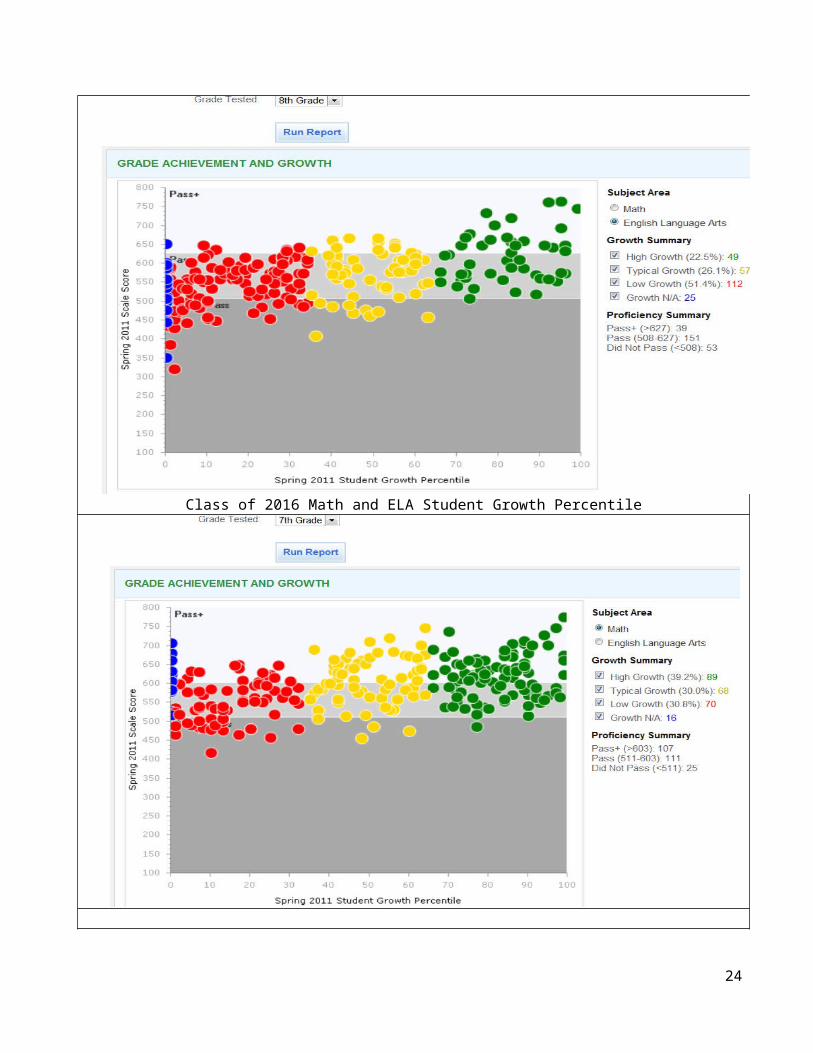
Class of 2016 Math and ELA Student Growth Percentile
19
Spring 2011 Median Student Growth Percentile Spring 2011 Median Student Growth PercentileEnglish/Language Arts Math
Name # Tested Pass %
Median Growth
% Name#
Tested Pass %
Median Growth
%
Special Ed. 96 66.7 43 Special Ed. 98 74.5 48
General Ed. 387 85.5 38 General Ed. 389 90 42
Free/Reduced Lunch 119 63 32 Free/Reduced Lunch 121 74.4 43.5
Paid Lunch 364 87.9 41 Paid Lunch 366 91 42.5
English Language Learner** <10 - - English Language Learner** <10 - -
Non English Language Learner 478 82.4 39 Non English Language Learner 479 87.3 43
Prior Year Bottom 25% 116 44 37 Prior Year Bottom 25% 115 51.3 44
Prior Year Top 75% 339 95.3 40 Prior Year Top 75% 343 98.5 42
20
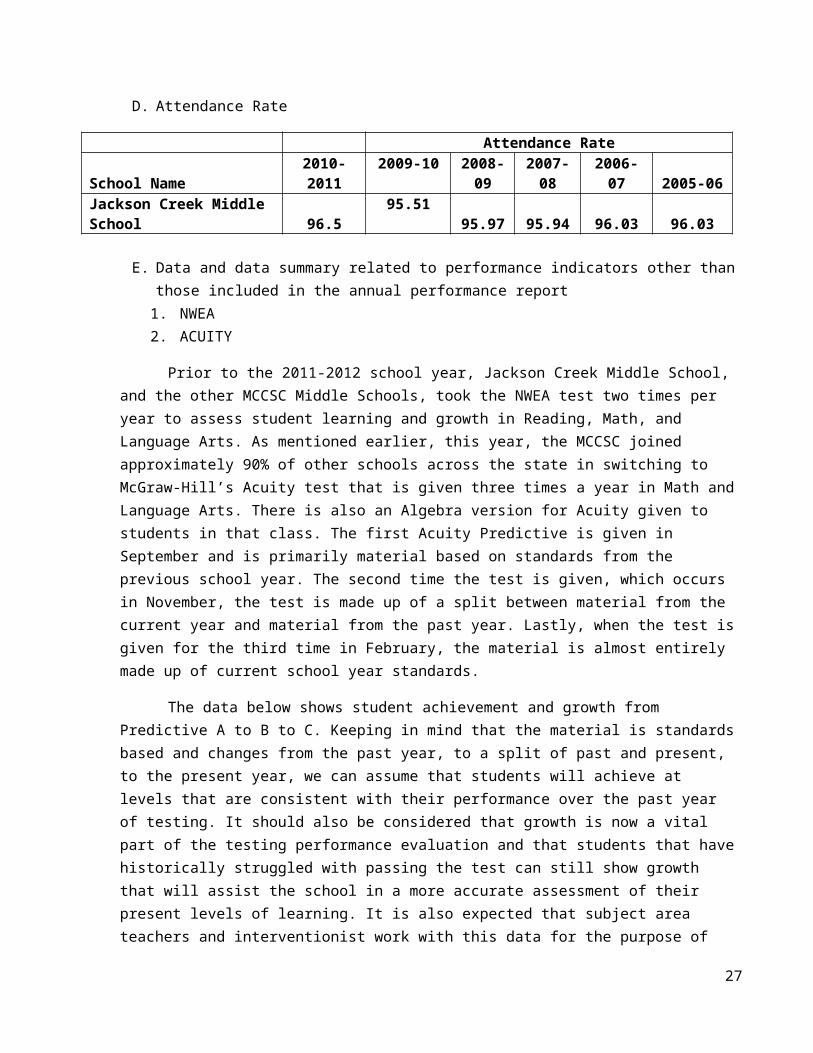
D. Attendance Rate
Attendance RateSchool Name 2010-2011 2009-10 2008-09 2007-08 2006-07 2005-06Jackson Creek Middle School 96.5 95.51 95.97 95.94 96.03 96.03
E. Data and data summary related to performance indicators other than those included in the annual performance report1. NWEA2. ACUITY
Prior to the 2011-2012 school year, Jackson Creek Middle School, and the other MCCSC Middle Schools, took the NWEA test two times per year to assess student learning and growth in Reading, Math, and Language Arts. As mentioned earlier, this year, the MCCSC joined approximately 90% of other schools across the state in switching to McGraw-Hill’s Acuity test that is given three times a year in Math and Language Arts. There is also an Algebra version for Acuity given to students in that class. The first Acuity Predictive is given in September and is primarily material based on standards from the previous school year. The second time the test is given, which occurs in November, the test is made up of a split between material from the current year and material from the past year. Lastly, when the test is given for the third time in February, the material is almost entirely made up of current school year standards.
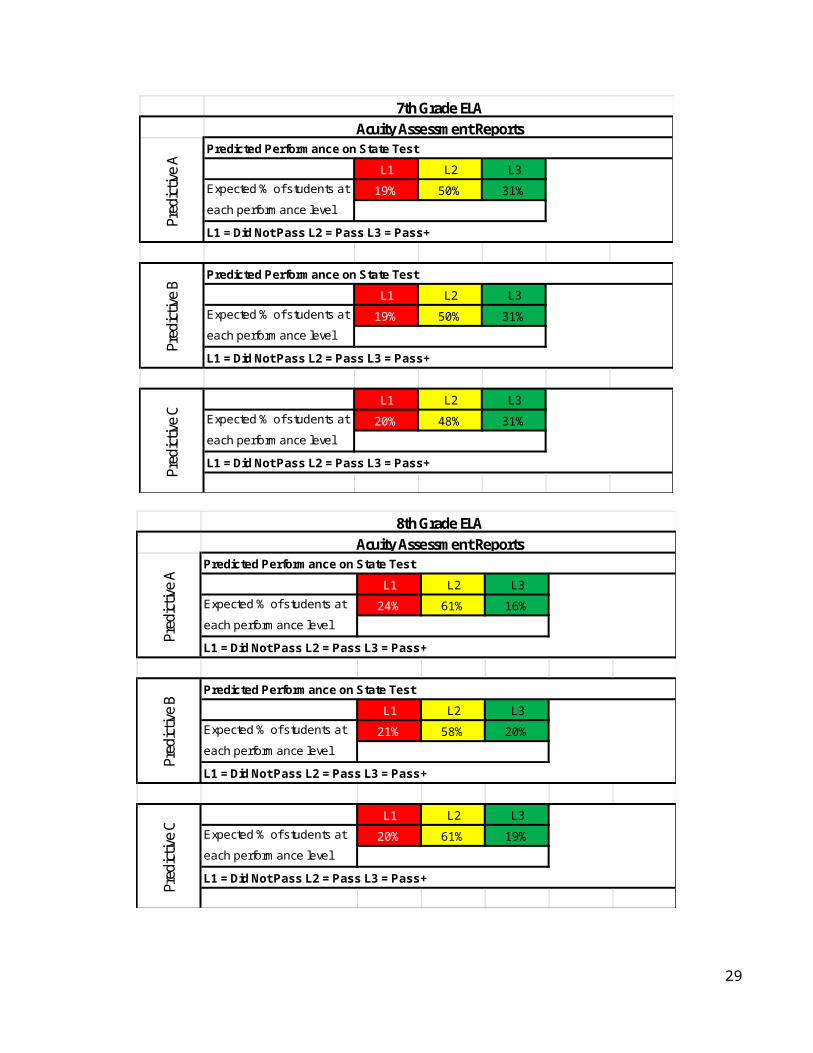
The data below shows student achievement and growth from Predictive A to B to C. Keeping in mind that the material is standards based and changes from the past year, to a split of past and present, to the present year, we can assume that students will achieve at levels that are consistent with their performance over the past year of testing. It should also be considered that growth is now a vital part of the testing performance evaluation and that students that have historically struggled with passing the test can still show growth that will assist the school in a more accurate assessment of their present levels of learning. It is also expected that subject area teachers and interventionist work with this data for the purpose of targeting areas where students can work to become proficient with skills they have struggled with in the past.
21
L1 L2 L3Expected % of students at 21% 41% 37%each performance level
L1 L2 L3Expected % of students at 25% 39% 36%each performance level
L1 L2 L3Expected % of students at 22% 41% 37%each performance level
7th Grade Math
Pred
ictive
APr
edicti
ve B
L1 = Did Not Pass L2 = Pass L3 = Pass+
Pred
ictive
C
Acuity Assessment Reports
L1 = Did Not Pass L2 = Pass L3 = Pass+
Predicted Performance on State Test
L1 = Did Not Pass L2 = Pass L3 = Pass+
Predicted Performance on State Test
L1 L2 L3Expected % of students at 22% 49% 29%each performance level
L1 L2 L3Expected % of students at 23% 53% 24%each performance level
L1 L2 L3Expected % of students at 29% 50% 21%each performance level
L1 = Did Not Pass L2 = Pass L3 = Pass+
Acuity Assessment Reports
L1 = Did Not Pass L2 = Pass L3 = Pass+
Predicted Performance on State Test
Pred
ictive
A
L1 = Did Not Pass L2 = Pass L3 = Pass+
Predicted Performance on State Test
Pred
ictive
B
8th Grade Math
Pred
ictive
C
22
L1 L2 L3Expected % of students at 19% 50% 31%each performance level
L1 L2 L3Expected % of students at 19% 50% 31%each performance level
L1 L2 L3Expected % of students at 20% 48% 31%each performance level
7th Grade ELAAcuity Assessment Reports
Pred
ictive
APr
edicti
ve B
Pred
ictive
C
L1 = Did Not Pass L2 = Pass L3 = Pass+
Predicted Performance on State Test
L1 = Did Not Pass L2 = Pass L3 = Pass+
Predicted Performance on State Test
L1 = Did Not Pass L2 = Pass L3 = Pass+
L1 L2 L3Expected % of students at 24% 61% 16%each performance level
L1 L2 L3Expected % of students at 21% 58% 20%each performance level
L1 L2 L3Expected % of students at 20% 61% 19%each performance level
L1 = Did Not Pass L2 = Pass L3 = Pass+
8th Grade ELAAcuity Assessment Reports
L1 = Did Not Pass L2 = Pass L3 = Pass+
Pred
ictive
C
Predicted Performance on State Test
L1 = Did Not Pass L2 = Pass L3 = Pass+
Predicted Performance on State Test
Pred
ictive
APr
edicti
ve B
23
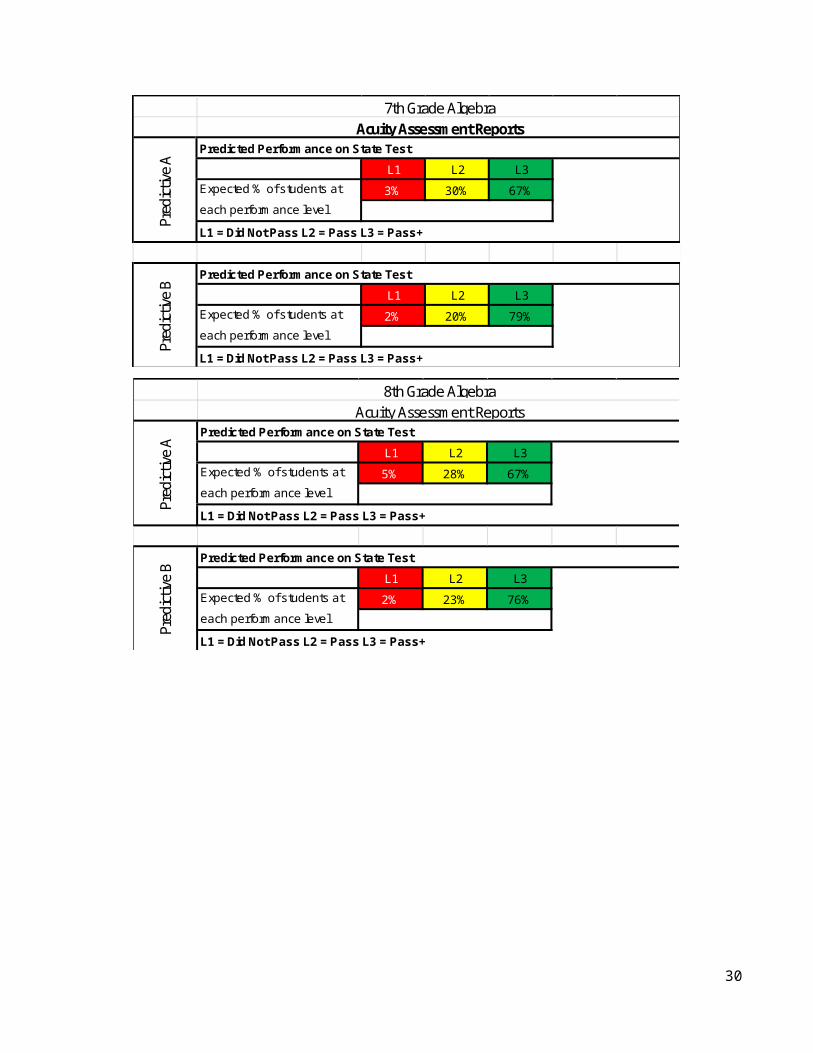
L1 L2 L3Expected % of students at 3% 30% 67%each performance level
L1 L2 L3Expected % of students at 2% 20% 79%each performance level
L1 = Did Not Pass L2 = Pass L3 = Pass+
Predicted Performance on State Test
7th Grade AlgebraAcuity Assessment Reports
Pred
ictive
APr
edicti
ve B
L1 = Did Not Pass L2 = Pass L3 = Pass+
Predicted Performance on State Test
24
L1 L2 L3Expected % of students at 5% 28% 67%each performance level
L1 L2 L3Expected % of students at 2% 23% 76%each performance level
L1 = Did Not Pass L2 = Pass L3 = Pass+
Predicted Performance on State Test
Pred
ictive
A
8th Grade AlgebraAcuity Assessment Reports
L1 = Did Not Pass L2 = Pass L3 = Pass+
Predicted Performance on State Test
Pred
ictive
B
F. Other information about educational programming and the learning environment including appropriate local assessments.
1. When determined appropriate through Special Education Annual Case Reviews, approximately 3-4% of our student population takes the modified IMAST or ISTAR test in place of the ISTEP+. These students take the Acuity Predictive tests.
25

VI. Conclusions and Identified Goals with Action Plans
Goal # 1: Reduce the number of F’s in Math and Language Arts on student semester report cardsBenchmark Goals:
Smart Goal for 2012-2013: Percent of F’s is 1.4% or lowerSmart Goal for 2013-2014: Percent of F’s is 1.2% or lowerSmart Goal for 2014-2015: Percent of F’s is 1.0% or lower
Support Data
1. Failure rates2. Semester report card data3. Scale score
Standardized Assessments1. Acuity
Local Assessments
1. Common department assessments2. Teacher assignments3. ALEKS
School-wide structures that support the attainment of the learning Goal # 1:
Strategies to meet Goal # 1
Person(s) Accountable
Timeline-3 Year Evidence of Attainment
Professional Development/Required
ResourcesTier IStrategies
Begin End
Guaranteed and viable curriculum in Math and Language Artsclass
Classroom teachers and Interventionists
August 2012
May2015 Student semester
report card data for Math and Language Arts
Teachers will participate in PLC Meetings and Team/Department meetings to work on power standards, unpacking standards, curriculum mapping, and developing a pacing guideTeachers will continue work being done to develop Scale Scoring to be able to most accurately assess student mastery in Power Standard areas.
Tier IIStrategies
Person(s) Accountable
Timeline-3 Year Evidence of Attainment
Professional Development/Required Resources
Begin End
Directed assignment to Office Hour remediation time
Classroom teachers, interventionists, and Advisory teachers
August 2012
May 2015 Student growth
data on Acuity or in classroom performance in Math and Language Arts
Teachers will review and revise protocol for Office Hours offerings and activities within PLC Teams and with administrators
26
Tier IIIStrategies
Person(s) Accountable
Timeline-3 Year Evidence of Attainment
Professional Development/Required ResourcesBegin End
Assignment to Math class or Language Arts group led my Interventionists
Interventionists and Remediation Aides
August2012
May 2015
Student growth data on Acuity or in classroom performance in Math and Language Arts
Interventionists will continue to participate with Department PLC’s and will continue work to develop appropriate curriculum and remediation materials
Research/Best Practice for Intervention:Buffum, Austin G., Mike Mattos, and Chris Weber. Pyramid Response to Intervention: RTI, Professional Learning Communities, and How to Respond When Kids Don't Learn. Bloomington, IN: Solution Tree, 2009. Print.DuFour, Richard. Learning by Doing: A Handbook for Professional Learning Communities at Work. Bloomington, IN: Solution Tree, 2006. Print.
27

Goal # 2: Students will demonstrate an increase in combined typical and high growth in Math and Language Arts.
Benchmark Goals:Smart Goal for 2012-2013: Math/Language Arts Growth on ISTEP+ will increase by 3% from the previous yearSmart Goal for 2013-2014: Math/Language Arts Growth on ISTEP+ will increase by 3% from the previous yearSmart Goal for 2014-2015: Math/Language Arts Growth on ISTEP+ will increase by 3% from the previous year
Support Data
1. Failure rates2. Student grades3. Scale Scores
Standardized Assessments
1. ISTEP
Local Assessments
1. Acuity2. ALEKS
School-wide structures that support the attainment of the learning Goal # 2:
Strategies to meet Goal # 2
Person(s) Accountable
Timeline-3 Year Evidence of Attainment
Professional Development/Required
ResourcesTier IStrategies
Begin End
Guaranteed and viable curriculum in Math and Language Artsclass
Classroom teachers and Interventionists
August 2012
May 2015
Student growth data on Acuity or in classroom performance in Math and Language Arts
Teachers will participate in PLC Meetings and Team/Department meetings to work on power standards, unpacking standards, curriculum mapping, and developing a pacing guide.Teachers will continue work being done to develop Scale Scoring to be able to most accurately assess student mastery in Power Standard areas.
Tier IIStrategies
Person(s) Accountable
Timeline-3 Year Evidence of Attainment
Professional Development/Required
ResourcesBegin End
Low-growth students will be identified using prior ISTEP+ data and Acuity Predictive data for remediation
Administrators, Counselors, classroom teachers and Interventionists
August 2012
May 2015
Students show documented growth from Acuity Predictive A to B and/or B to C
All staff members should be familiar with using the Acuity program and in how to read the data results
28
Tier IIIStrategies
Person(s) Accountable
Timeline-3 Year Evidence of Attainment
Professional Development/Required Resources
Begin End
Targeted remediation in small groups or individually will be done for students that show no growth or regression
Classroom teachers, Interventionists, and remediation aides
August2012
May2015
Students show growth and achievement in remediation activities and students show documented growth from Acuity Predictive A to B and/or B to C
All staff members should be familiar with using the Acuity program and in how to read the data results
Research/Best Practice for Intervention:Buffum, Austin G., Mike Mattos, and Chris Weber. Pyramid Response to Intervention: RTI, Professional Learning Communities, and How to Respond When Kids Don't Learn. Bloomington, IN: Solution Tree, 200, Print.DuFour, Richard. Learning by Doing: A Handbook for Professional Learning Communities at Work. Bloomington, IN: Solution Tree, 2006. Print.
29
Goal # 3: Student attendance at school will improve.Benchmark Goals:
Smart Goal for 2012-2013: Final attendance report will show a .3% increase from the previous year.Smart Goal for 2013-2014: Final attendance report will show a .3% increase from the previous year.Smart Goal for 2014-2015: Final attendance report will show a .3% increase from the previous year.
Support Data1. Attendance data2. PBS/Behavior data
Standardized Assessments Local Assessments
School-wide structures that support the attainment of the learning Goal # 3:Strategies to meet
Goal # 2Person(s)
AccountableTimeline-3 Year Evidence of
AttainmentProfessional
Development/Required ResourcesTier I
StrategiesBegin End
Promote and publicize the value of attendance and advertise start times and expectations for attendance
Entire school staff
August 2012
May 2015
Attendance data
Tier IIStrategies
Person(s) Accountable
Timeline-3 Year Evidence of Attainment
Professional Development/Required
ResourcesBegin End
Reward students with good attendance with various acknowledgements
Administration, counselors, attendance secretary, classroom teachers
August2012
May 2015
Perfect attendance lists
Attendance data
Tier IIIStrategies
Person(s) Accountable
Timeline-3 Year Evidence of Attainment
Professional Development/Required Resources
Begin End
Initiate consequences for students with poor attendance
Administration, counselors, attendance secretary, social worker, probation department
August2012
May 2015
Attendance data
Introductions and interaction with the Monroe County Probation Department
Research/Best Practice for Intervention:
VII. Other InformationA. Status and rules to be waived.
30