Embed Size (px)
Citation preview

Appendix 1
Hampshire School Place Planning Framework 2013 – 2018
Contents
Context Page 2
Summary of Key Pressures Page 3
Diversity of Provision Page 4
Glossary of Terms Page 5
School Place Planning by District:
Basingstoke & Deane Page 6
East Hampshire District Page 10
Eastleigh Borough Page 13
Fareham Borough Page 17
Gosport Borough Page 20
Hart Borough Page 23
Havant Borough Page 25
New Forest District Page 28
Rushmoor Borough Page 32
Test Valley Borough Page 34
Winchester City Page 38
Page 1 of 40

Appendix 1 Context
The size and diversity of Hampshire, covering 11 District and Borough Councils together with 2 National Parks, each its own planning authority, incorporating a mix of urban and rural areas, creates significant challenges in meeting the demand for primary and secondary school places.
Continued significant levels of new housing development both within existing local plan allocations and proposals emerging from District and Borough Council Local Plans presents further challenges for detailed long term planning to ensure a sufficiency of provision.
In addition, major MOD installations and movement of military personnel create turbulence in the school sector presenting significant challenges for school place planning in certain locations within the county. However, the County Council is having regular meetings with the MOD to determine the areas within the county where the movement of Army personnel will bring the greatest pressure to allow appropriate provision to be made for the pupils as they move into the area.
There is an on-going significant pressure on school places in many parts of Hampshire particularly at Year R (aged 4) admissions. This is linked to:
continued increases in the number of births. The number of births has continued to rise in recent years. Forecasts show a continued rise in births to 2014 (see table below).
on-going housing developments. in migration, as Hampshire takes its share of population growth in the South East region.
Live births in Hampshire – actual and forecast
2006 2007 2008 2009 2010 2011 2012 2013 2014 2015 2016 2017 20181421
01449
21468
91466
11498
61525
21554
51557
71562
91557
21549
11537
61523
5NHS(Health Service) SAPF (small area population forecasts)
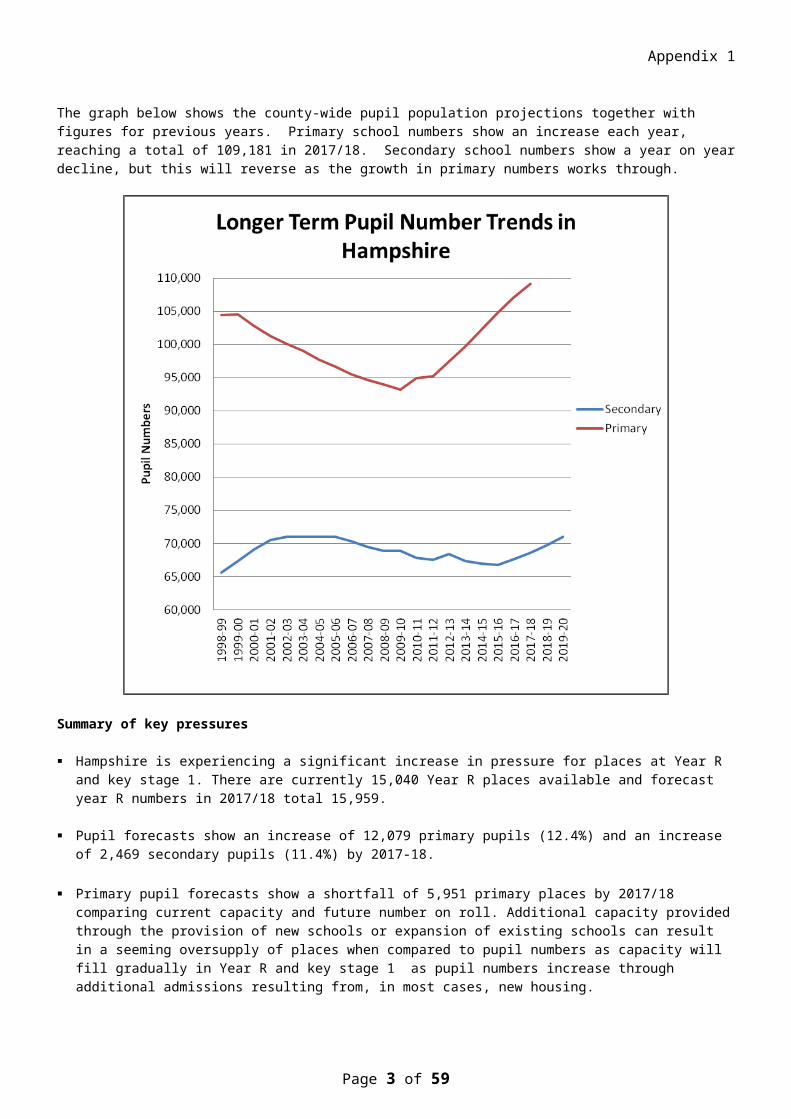
The graph below shows the county-wide pupil population projections together with figures for previous years. Primary school numbers show an increase each year, reaching a total of 109,181 in 2017/18. Secondary school numbers show a year on year decline, but this will reverse as the growth in primary numbers works through.
Page 2 of 40
2006 2007 2008 2009 2010 2011 2012 2013 2014 2015 2016 2017 201810000
11000
12000
13000
14000
15000
16000
Hampshire Birth Trends
Appendix 1
Summary of key pressures
Hampshire is experiencing a significant increase in pressure for places at Year R and key stage 1. There are currently 15,040 Year R places available and forecast year R numbers in 2017/18 total 15,959.
Pupil forecasts show an increase of 12,079 primary pupils (12.4%) and an increase of 2,469 secondary pupils (11.4%) by 2017-18.
Primary pupil forecasts show a shortfall of 5,951 primary places by 2017/18 comparing current capacity and future number on roll. Additional capacity provided through the provision of new schools or expansion of existing schools can result in a seeming oversupply of places when compared to pupil numbers as capacity will fill gradually in Year R and key stage 1 as pupil numbers increase through additional admissions resulting from, in most cases, new housing.
The decline in secondary age pupils which Hampshire has experienced over the past 10 years will bottom out in 2016. Thereafter the increased number of children in the primary sector will begin to feed through which, together with major housing development in some areas, will require the expansion of some existing schools and the provision of new schools in the future.
Special Educational Needs (SEN) provision – Approximately 2.8% of the pupil population have a statement, 52% of which attend a special school or resourced provision within mainstream schools. The increase in primary and subsequently secondary pupil numbers will require additional places to meet the needs of pupils with SEN. The increase in primary pupil numbers indicates an additional 200 primary SEN places.
Page 3 of 40

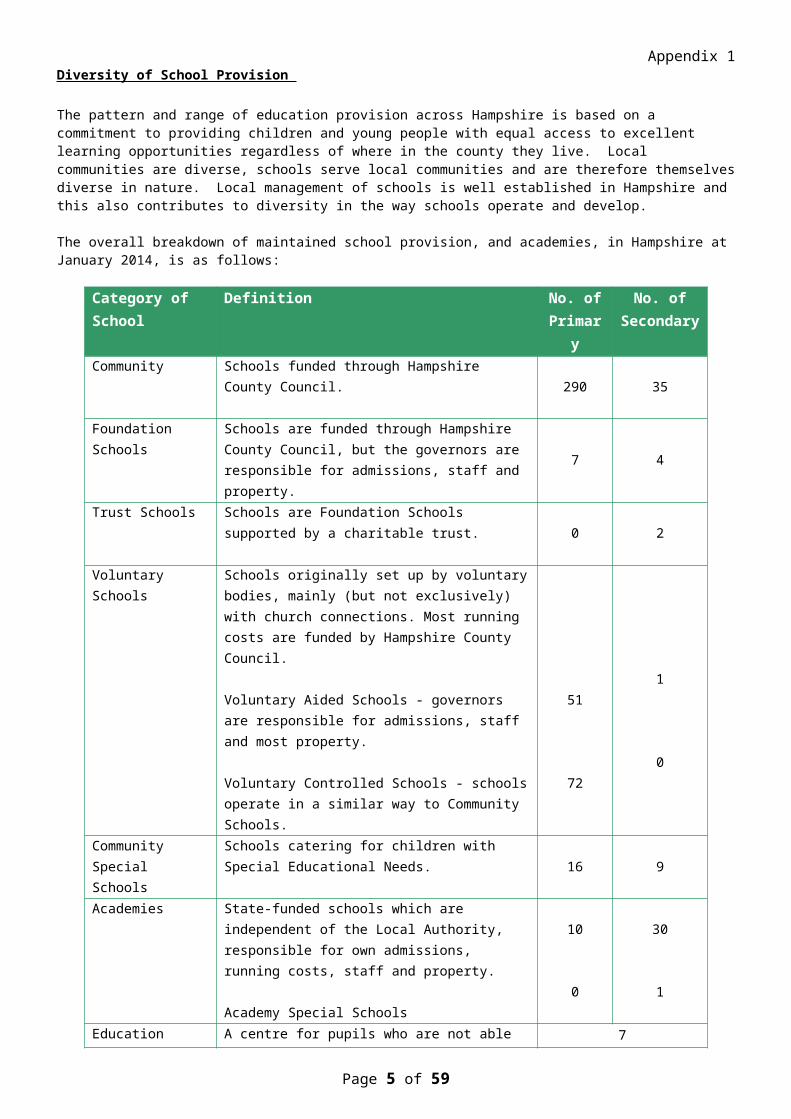
Appendix 1 Diversity of School Provision The pattern and range of education provision across Hampshire is based on a commitment to providing children and young people with equal access to excellent learning opportunities regardless of where in the county they live. Local communities are diverse, schools serve local communities and are therefore themselves diverse in nature. Local management of schools is well established in Hampshire and this also contributes to diversity in the way schools operate and develop.
The overall breakdown of maintained school provision, and academies, in Hampshire at January 2014, is as follows:
Category of School
Definition No. of Primary
No. of Secondary
Community Schools funded through Hampshire County Council.290 35
Foundation Schools Schools are funded through Hampshire County Council, but the governors are responsible for admissions, staff and property. 7 4
Trust Schools Schools are Foundation Schools supported by a charitable trust. 0 2
Voluntary Schools Schools originally set up by voluntary bodies, mainly (but not exclusively) with church connections. Most running costs are funded by Hampshire County Council.
Voluntary Aided Schools - governors are responsible for admissions, staff and most property.
Voluntary Controlled Schools - schools operate in a similar way to Community Schools.
51
72
1
0
Community Special Schools
Schools catering for children with Special Educational Needs. 16 9
Academies State-funded schools which are independent of the Local Authority, responsible for own admissions, running costs, staff and property.
Academy Special Schools
10
0
30
1
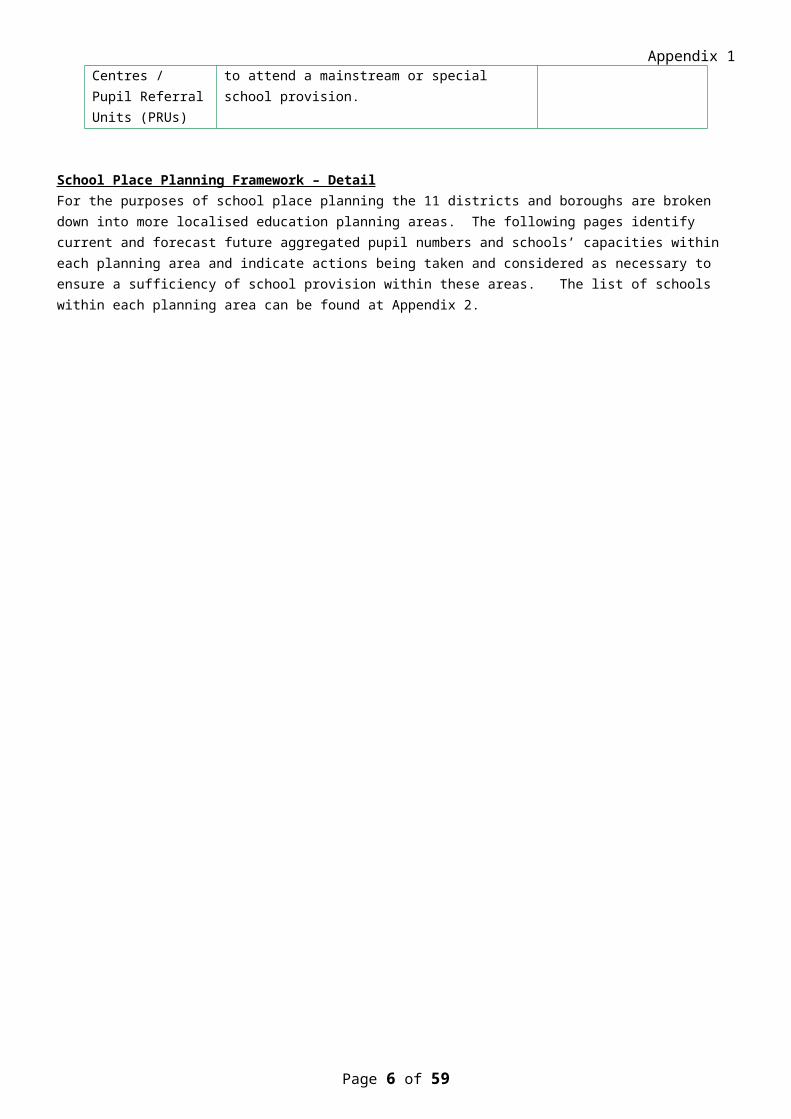
Education Centres / Pupil Referral Units (PRUs)
A centre for pupils who are not able to attend a mainstream or special school provision. 7
School Place Planning Framework – DetailFor the purposes of school place planning the 11 districts and boroughs are broken down into more localised education planning areas. The following pages identify current and forecast future aggregated pupil numbers and schools’ capacities within each planning area and indicate actions being taken and considered as necessary to ensure a sufficiency of school provision within these areas. The list of schools within each planning area can be found at Appendix 2.
Page 4 of 40
Appendix 1 Glossary of Terms
Forecast:
The reception year intake is estimated using Small Area Population Forecasts (SAPF) of 4-year-olds produced by HCC Research & Intelligence Group. Other year groups are based on the number of pupils on roll from the January School Census. The expected pupil yield from new housing is also produced by HCC Research & Intelligence Group.
Our forecasting model works out a participation rate for each primary/infant school, which is the number of Year R pupils as a percentage of the estimated number of 4-year-olds in the catchment area. A weighted average for the past three years is calculated and projected forward to forecast the next 5 years. A similar process is used for junior/secondary schools using the number of Year 3/7 pupils as a percentage of the Year 2/6 pupils in their feeder school(s) respectively. The remaining year groups are rolled forward with an adjustment for historic year-on-year changes and for additional pupils due to any housing developments within the school's catchment area during this period. The number of pupils in school sixth forms is assumed to be constant over the next 7 years.
In rural areas, schools’ SAPF numbers are relatively small which often results in out catchment children attending these schools. This impacts on the participation rate which, due to the nature of the forecasting model, continues to add these children proportionally when the SAPF rises, thereby inflating numbers beyond reality. Such areas are detailed in the planning area information below.
School Capacity:
The capacity of a school (NCA) is the number of pupil places it can accommodate. By comparison with the number on roll, it can indicate the number of places that are surplus or additional places that are needed in a school.
For primary schools, the net capacity is calculated on the basis of the number and size of spaces designated as ‘classbases’. In some cases the size of a classroom will not be of sufficient size to provide 30 work places in the NCA calculation. Some schools will have a capacity that will be less than the overall size of the school when the size of school is calculated using the published admission number multiplied by the number of year groups. For secondary schools, it is based on the number, size and type of teaching spaces and the age range of the school.
Number on Roll:
The number of pupils registered at a school is called the Number on Roll (NOR). Numbers will vary as pupils leave schools and other pupils join the school. Therefore, the number of pupils is counted at fixed times each year through a census near the start of each term.
Year R / Year 7 Intake:
The number of pupils who join a school in a particular admission year – year R for start of primary education and year 7 for start of secondary education.
Published Admission Number (PAN):
'PAN' is the Published Admission Number. Each school has a Published Admission Number. This is the number of places available each year.
Page 5 of 40
Appendix 1
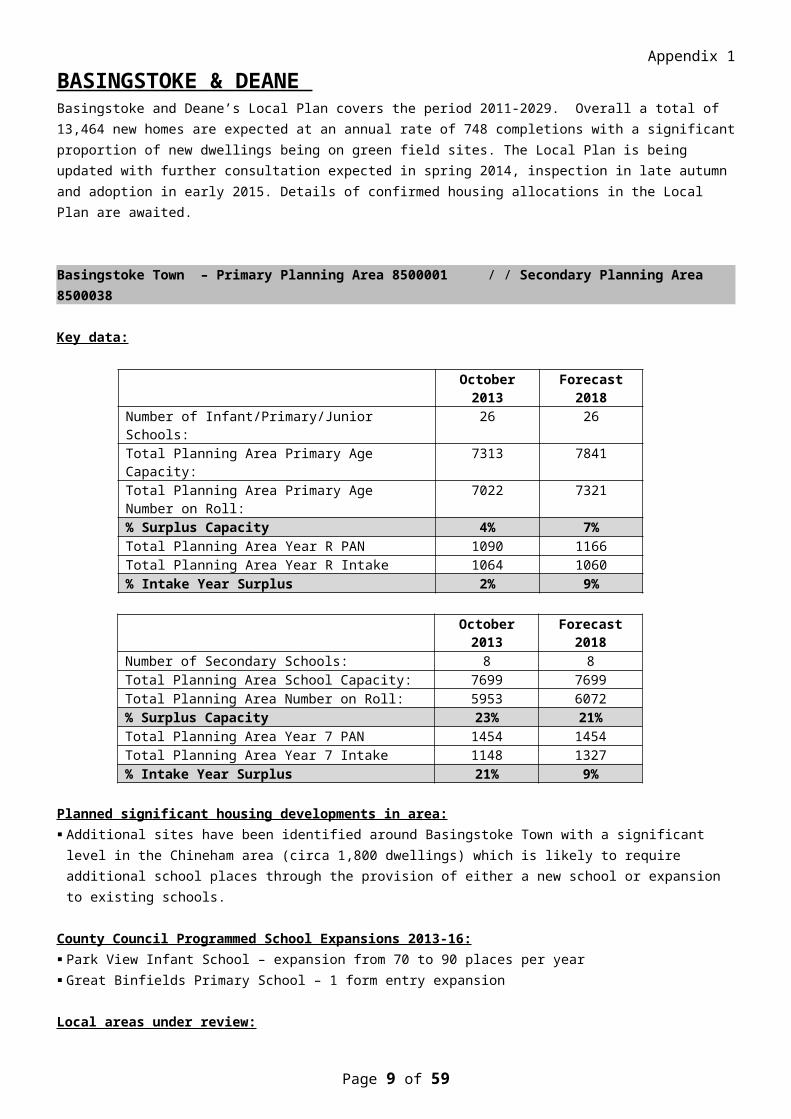
BASINGSTOKE & DEANE Basingstoke and Deane’s Local Plan covers the period 2011-2029. Overall a total of 13,464 new homes are expected at an annual rate of 748 completions with a significant proportion of new dwellings being on green field sites. The Local Plan is being updated with further consultation expected in spring 2014, inspection in late autumn and adoption in early 2015. Details of confirmed housing allocations in the Local Plan are awaited.
Basingstoke Town – Primary Planning Area 8500001 / / Secondary Planning Area 8500038
Key data:
October 2013 Forecast 2018Number of Infant/Primary/Junior Schools: 26 26Total Planning Area Primary Age Capacity: 7313 7841Total Planning Area Primary Age Number on Roll: 7022 7321% Surplus Capacity 4% 7%Total Planning Area Year R PAN 1090 1166Total Planning Area Year R Intake 1064 1060% Intake Year Surplus 2% 9%
October 2013 Forecast 2018Number of Secondary Schools: 8 8Total Planning Area School Capacity: 7699 7699Total Planning Area Number on Roll: 5953 6072% Surplus Capacity 23% 21%Total Planning Area Year 7 PAN 1454 1454Total Planning Area Year 7 Intake 1148 1327% Intake Year Surplus 21% 9%
Planned significant housing developments in area: Additional sites have been identified around Basingstoke Town with a significant level in the Chineham area (circa
1,800 dwellings) which is likely to require additional school places through the provision of either a new school or expansion to existing schools.
County Council Programmed School Expansions 2013-16: Park View Infant School – expansion from 70 to 90 places per year Great Binfields Primary School – 1 form entry expansion
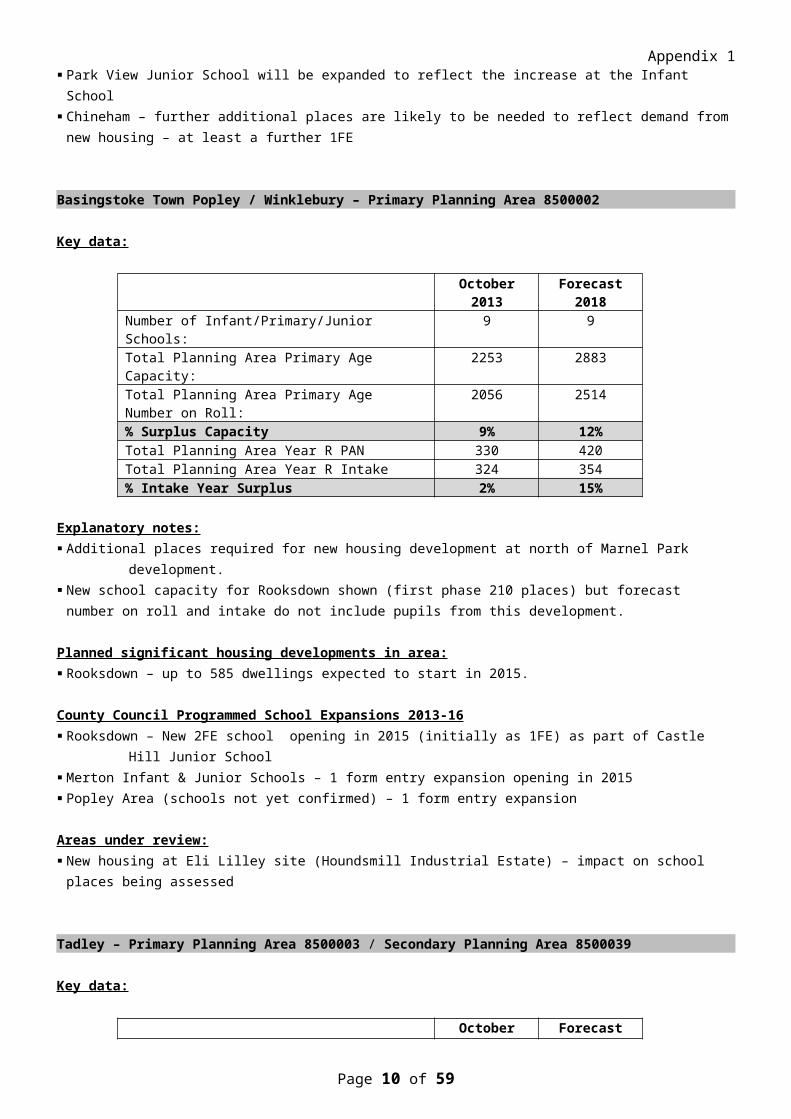
Local areas under review: Park View Junior School will be expanded to reflect the increase at the Infant School Chineham – further additional places are likely to be needed to reflect demand from new housing – at least a
further 1FE
Basingstoke Town Popley / Winklebury – Primary Planning Area 8500002
Key data:
October 2013 Forecast 2018Number of Infant/Primary/Junior Schools: 9 9Total Planning Area Primary Age Capacity: 2253 2883Total Planning Area Primary Age Number on Roll: 2056 2514% Surplus Capacity 9% 12%Total Planning Area Year R PAN 330 420Total Planning Area Year R Intake 324 354% Intake Year Surplus 2% 15%
Page 6 of 40

Appendix 1 Explanatory notes: Additional places required for new housing development at north of Marnel Park development. New school capacity for Rooksdown shown (first phase 210 places) but forecast number on roll and intake do not
include pupils from this development.
Planned significant housing developments in area: Rooksdown – up to 585 dwellings expected to start in 2015.
County Council Programmed School Expansions 2013-16 Rooksdown – New 2FE school opening in 2015 (initially as 1FE) as part of Castle Hill Junior School Merton Infant & Junior Schools – 1 form entry expansion opening in 2015 Popley Area (schools not yet confirmed) – 1 form entry expansion
Areas under review: New housing at Eli Lilley site (Houndsmill Industrial Estate) – impact on school places being assessed
Tadley – Primary Planning Area 8500003 / Secondary Planning Area 8500039
Key data:
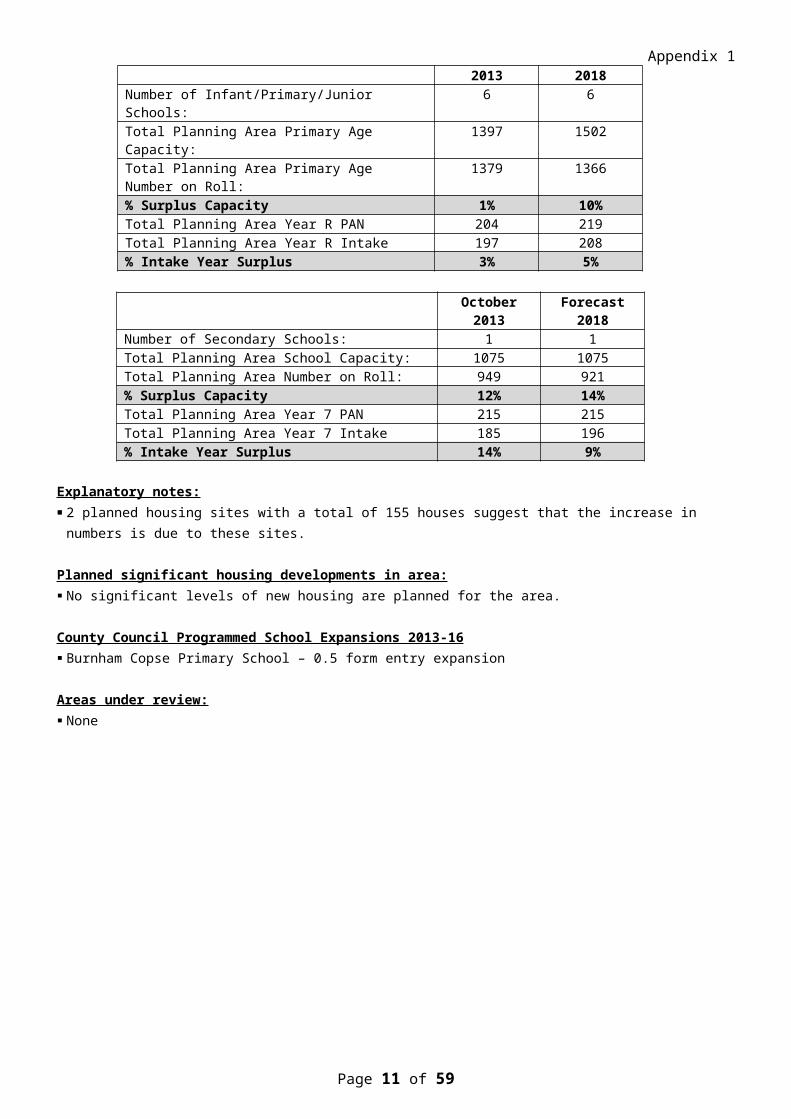
October 2013 Forecast 2018Number of Infant/Primary/Junior Schools: 6 6Total Planning Area Primary Age Capacity: 1397 1502Total Planning Area Primary Age Number on Roll: 1379 1366% Surplus Capacity 1% 10%Total Planning Area Year R PAN 204 219Total Planning Area Year R Intake 197 208% Intake Year Surplus 3% 5%
October 2013 Forecast 2018Number of Secondary Schools: 1 1Total Planning Area School Capacity: 1075 1075Total Planning Area Number on Roll: 949 921% Surplus Capacity 12% 14%Total Planning Area Year 7 PAN 215 215Total Planning Area Year 7 Intake 185 196% Intake Year Surplus 14% 9%
Explanatory notes: 2 planned housing sites with a total of 155 houses suggest that the increase in numbers is due to these sites.
Planned significant housing developments in area: No significant levels of new housing are planned for the area.
County Council Programmed School Expansions 2013-16 Burnham Copse Primary School – 0.5 form entry expansion
Areas under review: None
Page 7 of 40

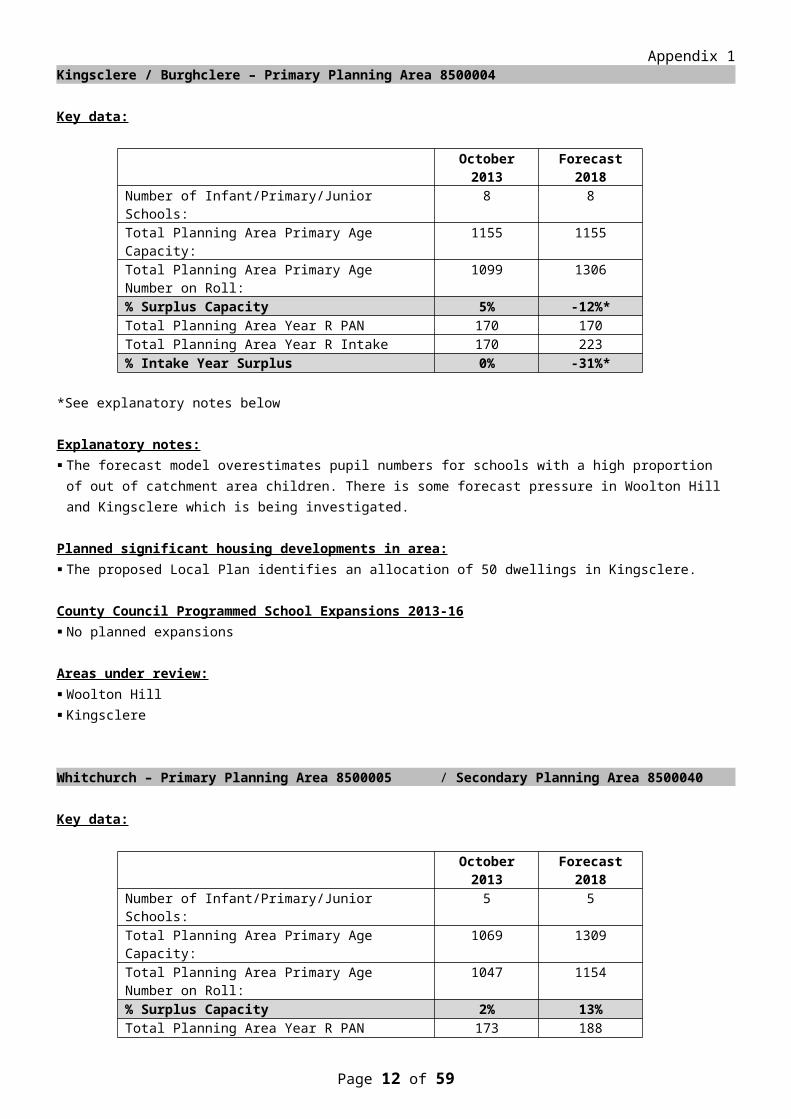
Appendix 1 Kingsclere / Burghclere – Primary Planning Area 8500004
Key data:
October 2013 Forecast 2018Number of Infant/Primary/Junior Schools: 8 8Total Planning Area Primary Age Capacity: 1155 1155Total Planning Area Primary Age Number on Roll: 1099 1306% Surplus Capacity 5% -12%*Total Planning Area Year R PAN 170 170Total Planning Area Year R Intake 170 223% Intake Year Surplus 0% -31%*
*See explanatory notes below
Explanatory notes: The forecast model overestimates pupil numbers for schools with a high proportion of out of catchment area
children. There is some forecast pressure in Woolton Hill and Kingsclere which is being investigated.
Planned significant housing developments in area: The proposed Local Plan identifies an allocation of 50 dwellings in Kingsclere.
County Council Programmed School Expansions 2013-16 No planned expansions
Areas under review: Woolton Hill Kingsclere
Whitchurch – Primary Planning Area 8500005 / Secondary Planning Area 8500040
Key data:
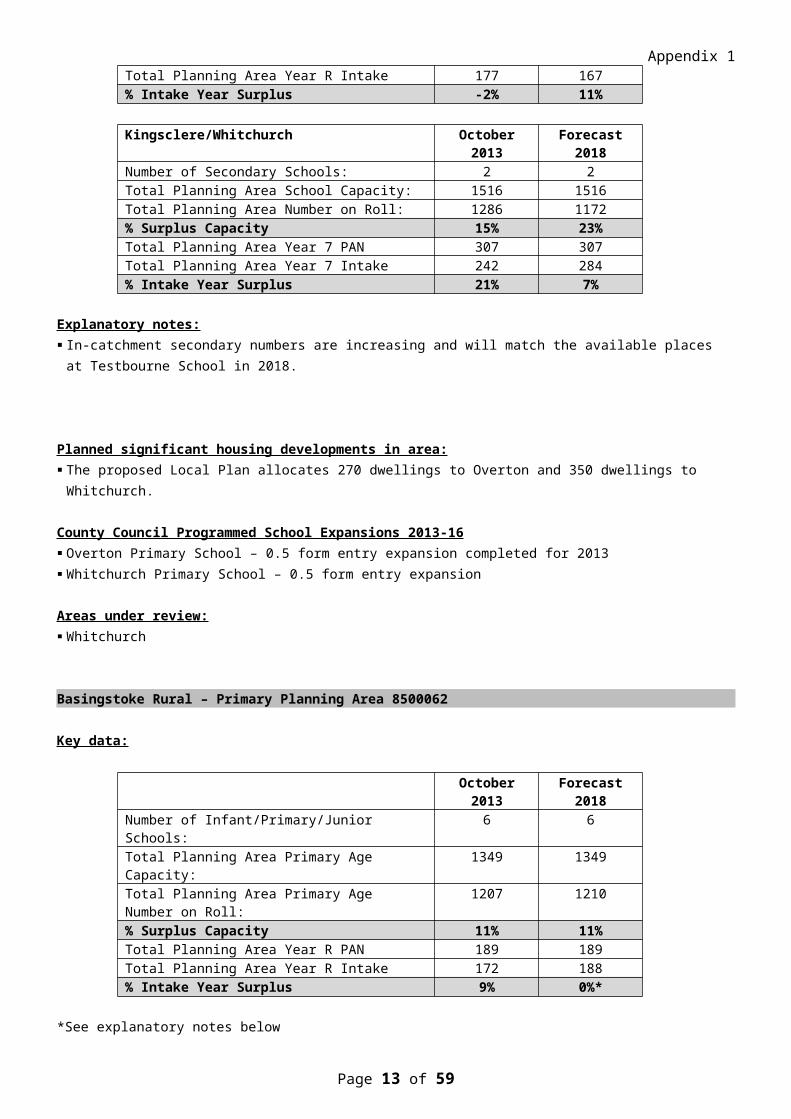
October 2013 Forecast 2018Number of Infant/Primary/Junior Schools: 5 5Total Planning Area Primary Age Capacity: 1069 1309Total Planning Area Primary Age Number on Roll: 1047 1154% Surplus Capacity 2% 13%Total Planning Area Year R PAN 173 188Total Planning Area Year R Intake 177 167% Intake Year Surplus -2% 11%
Kingsclere/Whitchurch October 2013 Forecast 2018Number of Secondary Schools: 2 2Total Planning Area School Capacity: 1516 1516Total Planning Area Number on Roll: 1286 1172% Surplus Capacity 15% 23%Total Planning Area Year 7 PAN 307 307Total Planning Area Year 7 Intake 242 284% Intake Year Surplus 21% 7%
Explanatory notes: In-catchment secondary numbers are increasing and will match the available places at Testbourne School in
2018.
Page 8 of 40
Appendix 1 Planned significant housing developments in area: The proposed Local Plan allocates 270 dwellings to Overton and 350 dwellings to Whitchurch.
County Council Programmed School Expansions 2013-16 Overton Primary School – 0.5 form entry expansion completed for 2013 Whitchurch Primary School – 0.5 form entry expansion
Areas under review: Whitchurch
Basingstoke Rural – Primary Planning Area 8500062
Key data:
October 2013 Forecast 2018Number of Infant/Primary/Junior Schools: 6 6Total Planning Area Primary Age Capacity: 1349 1349Total Planning Area Primary Age Number on Roll: 1207 1210% Surplus Capacity 11% 11%Total Planning Area Year R PAN 189 189Total Planning Area Year R Intake 172 188% Intake Year Surplus 9% 0%*
*See explanatory notes below
Explanatory notes: Pressure for places is expected in Bramley and Oakley if new housing plans come to fruition. Discussions will be
held with relevant schools regarding the need for additional places.
Planned significant housing developments in area: The proposed Local Plan allocates 200 dwellings to Bramley and 150 to Oakley.
County Council Programmed School Expansions 2013-16 No planned expansions.
Local areas under review: Oakley
Page 9 of 40
Appendix 1
EAST HAMPSHIREWith regard to major developments in East Hampshire, the Whitehill/Bordon development for 4000 new homes is still under discussion which would have significant impact requiring potentially 2 new primary schools and a new or upgraded secondary school. Overall a total of 2,794 homes are scheduled to be built, including those within the Whitehill/Bordon proposal. The Local Plan is being updated with further consultation expected. Details of confirmed housing allocations in the Local Plan are awaited.
Bordon / Liss / Liphook – Primary Planning Area 8500006
Key data:
October 2013 Forecast 2018Number of Infant/Primary/Junior Schools: 13 13Total Planning Area Primary Age Capacity: 3109 3109Total Planning Area Primary Age Number on Roll: 2642 2677% Surplus Capacity 15% 16%Total Planning Area Year R PAN 450 450Total Planning Area Year R Intake 390 403% Intake Year Surplus 13% 10%
Explanatory notes: The number of Year R pupils living in the catchment areas of the schools in this area is above the number of
places available. This, together with the planned housing in the area, will put significant pressure on school places for the future.
Planned significant housing developments in area: Whitehill/Bordon, 4,000 dwellings. Liphook, 3 developments totalling 500 new dwellings.
County Council Programmed School Expansions 2013-16: Liphook Area (no schools defined) – 1 form entry expansion to be confirmed
Local areas under review: Bordon – new school(s) may be required if Whitehill/Bordon development progresses
Alton – Primary Planning Area 8500007 / Secondary Planning Area 8500042
Key data:
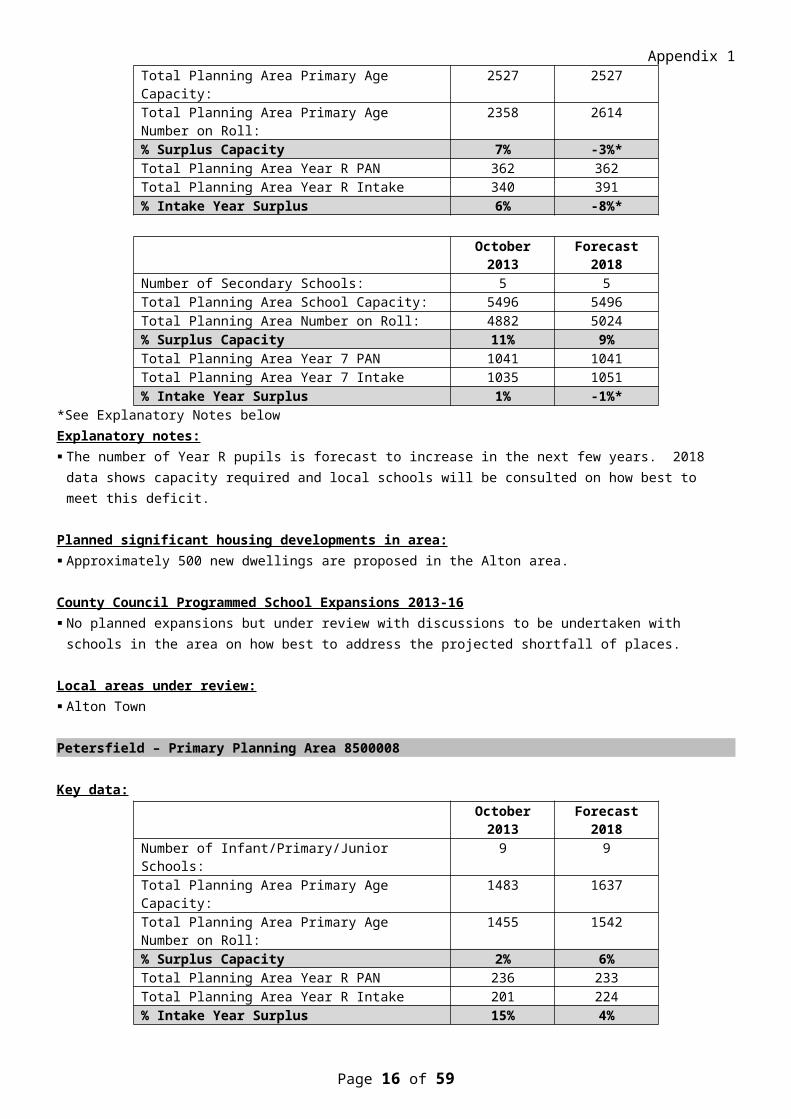
October 2013 Forecast 2018Number of Infant/Primary/Junior Schools: 14 14Total Planning Area Primary Age Capacity: 2527 2527Total Planning Area Primary Age Number on Roll: 2358 2614% Surplus Capacity 7% -3%*Total Planning Area Year R PAN 362 362Total Planning Area Year R Intake 340 391% Intake Year Surplus 6% -8%*
October 2013 Forecast 2018Number of Secondary Schools: 5 5Total Planning Area School Capacity: 5496 5496Total Planning Area Number on Roll: 4882 5024% Surplus Capacity 11% 9%Total Planning Area Year 7 PAN 1041 1041Total Planning Area Year 7 Intake 1035 1051% Intake Year Surplus 1% -1%*
*See Explanatory Notes below
Page 10 of 40
Appendix 1 Explanatory notes: The number of Year R pupils is forecast to increase in the next few years. 2018 data shows capacity required
and local schools will be consulted on how best to meet this deficit.
Planned significant housing developments in area: Approximately 500 new dwellings are proposed in the Alton area.
County Council Programmed School Expansions 2013-16 No planned expansions but under review with discussions to be undertaken with schools in the area on how best
to address the projected shortfall of places.
Local areas under review: Alton Town
Petersfield – Primary Planning Area 8500008
Key data:October 2013 Forecast 2018
Number of Infant/Primary/Junior Schools: 9 9Total Planning Area Primary Age Capacity: 1483 1637Total Planning Area Primary Age Number on Roll: 1455 1542% Surplus Capacity 2% 6%Total Planning Area Year R PAN 236 233Total Planning Area Year R Intake 201 224% Intake Year Surplus 15% 4%
Explanatory notes: The number of Year R pupils is forecast to increase. This, together with proposed housing in the area, will place
pressure on school places for the future but it is anticipated that the schools in the area will be able to cope with the additional pupils.
Froxfield Infant converted to Primary School and this has changed the number of places available in the area as shown in the table above.
Planned significant housing developments in area: Planning permission for the Causeway Farm development is currently being sought. It is anticipated that the
number of pupils from this development will be accommodated within the existing school capacities with any pupils from out of the area being displaced back into their catchment school.
County Council Programmed School Expansions 2013-16 Herne Junior School – 115 additional places Froxfield Primary – 39 additional places
Local areas under review: None
Horndean / Clanfield – Primary Planning Area 8500009 / Secondary Planning Area 8500043
Key data:October 2013 Forecast 2018
Number of Infant/Primary/Junior Schools: 6 6Total Planning Area Primary Age Capacity: 1581 1612Total Planning Area Primary Age Number on Roll: 1517 1842% Surplus Capacity 4% -12%*Total Planning Area Year R PAN 210 220Total Planning Area Year R Intake 211 270% Intake Year Surplus 0% -23%*
Page 11 of 40
Appendix 1 October 2013 Forecast 2018
Number of Secondary Schools: 1 1Total Planning Area School Capacity: 1500 1500Total Planning Area Number on Roll: 1102 1196% Surplus Capacity 27% 20%Total Planning Area Year 7 PAN 300 300Total Planning Area Year 7 Intake 192 239% Intake Year Surplus 36% 20%
*See explanatory notes below
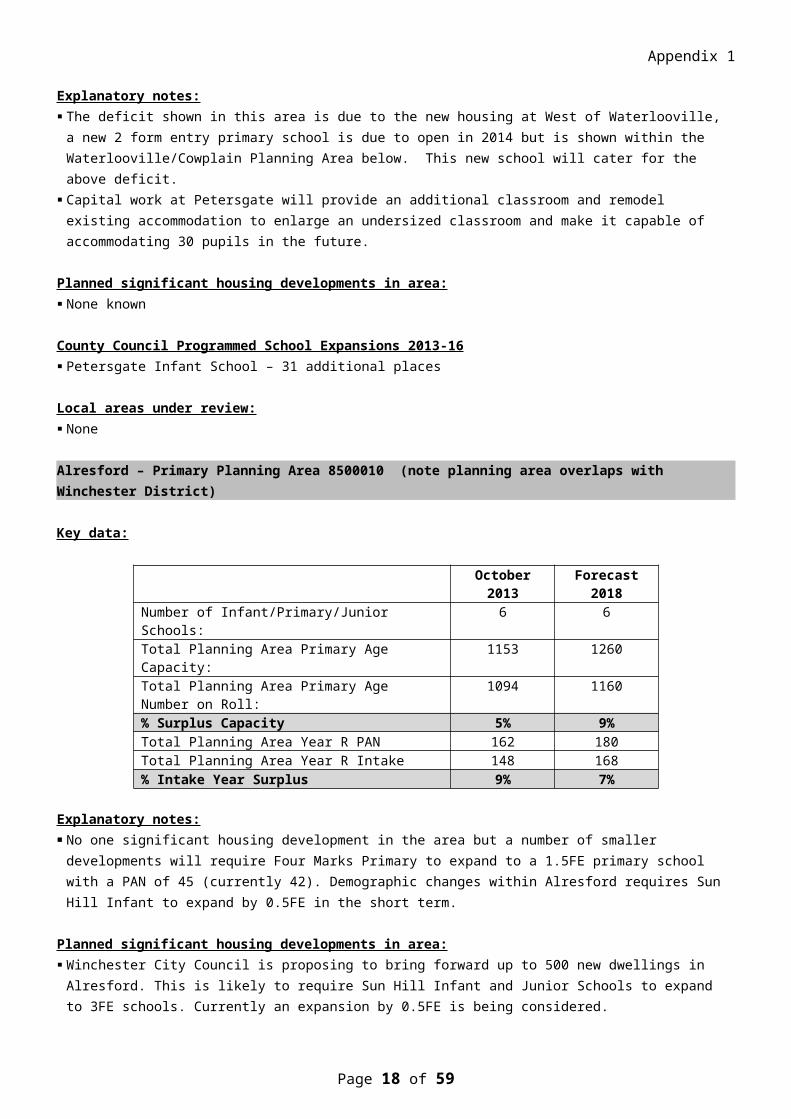
Explanatory notes: The deficit shown in this area is due to the new housing at West of Waterlooville, a new 2 form entry primary
school is due to open in 2014 but is shown within the Waterlooville/Cowplain Planning Area below. This new school will cater for the above deficit.
Capital work at Petersgate will provide an additional classroom and remodel existing accommodation to enlarge an undersized classroom and make it capable of accommodating 30 pupils in the future.
Planned significant housing developments in area: None known
County Council Programmed School Expansions 2013-16 Petersgate Infant School – 31 additional places
Local areas under review: None
Alresford – Primary Planning Area 8500010 (note planning area overlaps with Winchester District)
Key data:
October 2013 Forecast 2018Number of Infant/Primary/Junior Schools: 6 6Total Planning Area Primary Age Capacity: 1153 1260Total Planning Area Primary Age Number on Roll: 1094 1160% Surplus Capacity 5% 9%Total Planning Area Year R PAN 162 180Total Planning Area Year R Intake 148 168% Intake Year Surplus 9% 7%
Explanatory notes: No one significant housing development in the area but a number of smaller developments will require Four
Marks Primary to expand to a 1.5FE primary school with a PAN of 45 (currently 42). Demographic changes within Alresford requires Sun Hill Infant to expand by 0.5FE in the short term.
Planned significant housing developments in area: Winchester City Council is proposing to bring forward up to 500 new dwellings in Alresford. This is likely to require
Sun Hill Infant and Junior Schools to expand to 3FE schools. Currently an expansion by 0.5FE is being considered.
County Council Programmed School Expansions 2013-16 Four Marks Primary – 21 additional places Sun Hill Infant – 0.5 form entry expansion Sun Hill Junior – 41 additional places
Local areas under review: None
Page 12 of 40
Appendix 1
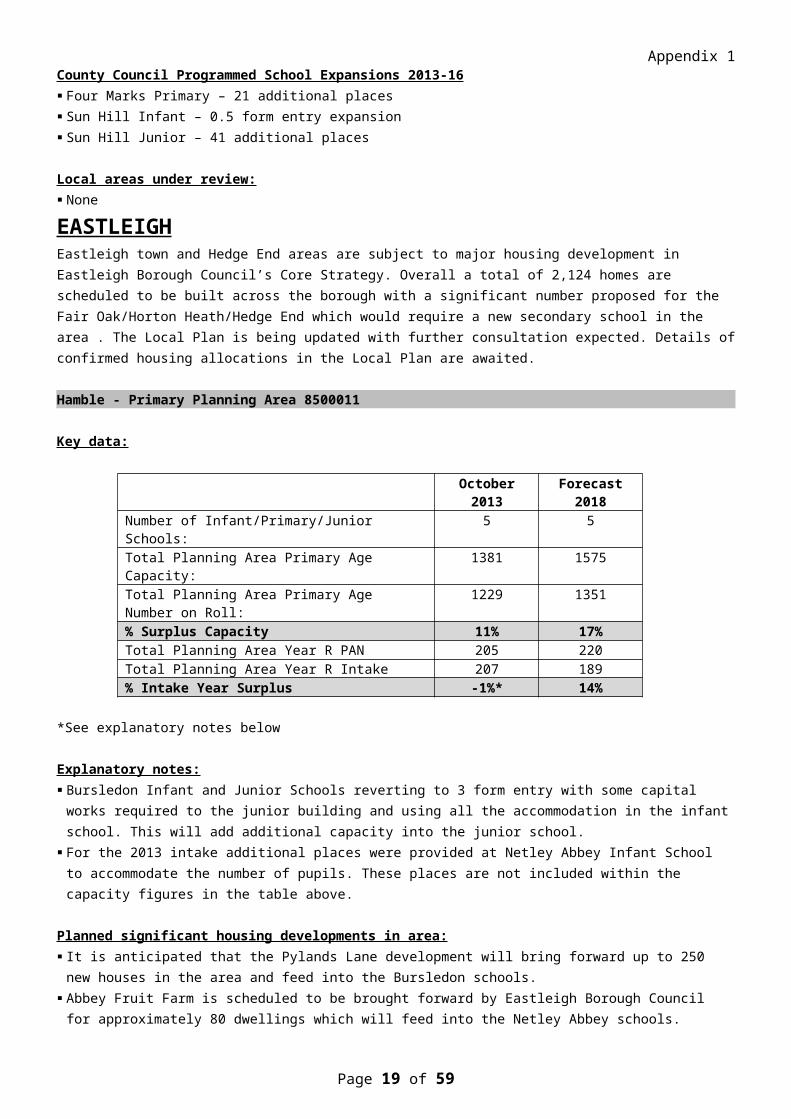
EASTLEIGHEastleigh town and Hedge End areas are subject to major housing development in Eastleigh Borough Council’s Core Strategy. Overall a total of 2,124 homes are scheduled to be built across the borough with a significant number proposed for the Fair Oak/Horton Heath/Hedge End which would require a new secondary school in the area . The Local Plan is being updated with further consultation expected. Details of confirmed housing allocations in the Local Plan are awaited.
Hamble - Primary Planning Area 8500011
Key data:
October 2013 Forecast 2018Number of Infant/Primary/Junior Schools: 5 5Total Planning Area Primary Age Capacity: 1381 1575Total Planning Area Primary Age Number on Roll: 1229 1351% Surplus Capacity 11% 17%Total Planning Area Year R PAN 205 220Total Planning Area Year R Intake 207 189% Intake Year Surplus -1%* 14%
*See explanatory notes below
Explanatory notes: Bursledon Infant and Junior Schools reverting to 3 form entry with some capital works required to the junior
building and using all the accommodation in the infant school. This will add additional capacity into the junior school.
For the 2013 intake additional places were provided at Netley Abbey Infant School to accommodate the number of pupils. These places are not included within the capacity figures in the table above.
Planned significant housing developments in area: It is anticipated that the Pylands Lane development will bring forward up to 250 new houses in the area and feed
into the Bursledon schools. Abbey Fruit Farm is scheduled to be brought forward by Eastleigh Borough Council for approximately 80
dwellings which will feed into the Netley Abbey schools. There is a proposal to build an additional 225 dwellings in the Hamble station area. Should this be brought
forward an expansion of Hamble Primary School will need to be considered.
County Council Programmed School Expansions 2013-16: Netley Infant & Junior Schools - 0.5 form entry expansion Bursledon Infant School – 30 additional places Bursledon Junior School – 59 additional places
Local areas under review: None
Hedge End / West End - Planning Area 8500012 / Secondary Planning Area Southern Parishes 8500044
Key data:
October 2013 Forecast 2018Number of Infant/Primary/Junior Schools: 8 9Total Planning Area Primary Age Capacity: 2823 3558Total Planning Area Primary Age Number on Roll: 2838 2981% Surplus Capacity -1%* 19%Total Planning Area Year R PAN 405 510Total Planning Area Year R Intake 436 429% Intake Year Surplus -8%* 16%
Page 13 of 40

Appendix 1
Southern Parishes October 2013 Forecast 2018Number of Secondary Schools: 3 3Total Planning Area School Capacity: 4375 4375Total Planning Area Number on Roll: 4075 4379% Surplus Capacity 7% 0%Total Planning Area Year 7 PAN 845 845Total Planning Area Year 7 Intake 789 902% Intake Year Surplus 7% -3%*
*See explanatory notes below
Explanatory notes: For the 2013 intake additional temporary places were provided to accommodate the number of pupils. These
temporary places are not included within the capacity figures in the table above. For the secondary sector the provision of new places at Wildern, Wyvern or both is under consideration as is the
provision of a new secondary school in the area.
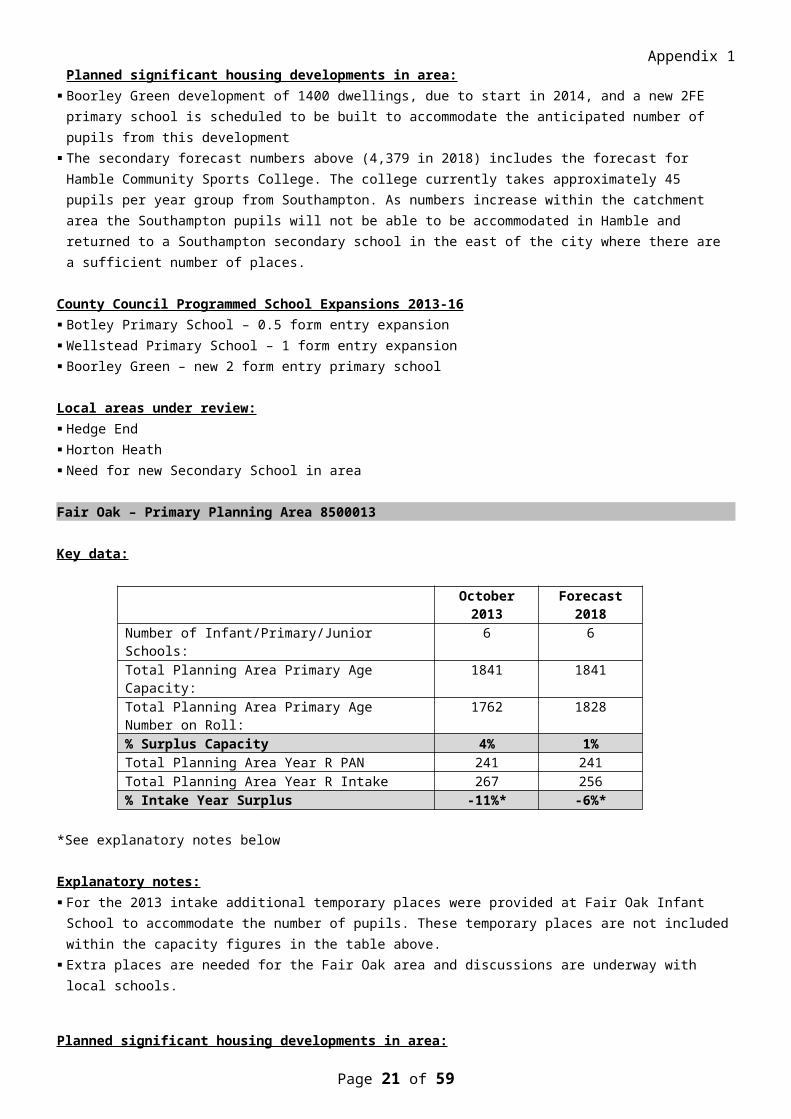
Planned significant housing developments in area: Boorley Green development of 1400 dwellings, due to start in 2014, and a new 2FE primary school is scheduled
to be built to accommodate the anticipated number of pupils from this development The secondary forecast numbers above (4,379 in 2018) includes the forecast for Hamble Community Sports
College. The college currently takes approximately 45 pupils per year group from Southampton. As numbers increase within the catchment area the Southampton pupils will not be able to be accommodated in Hamble and returned to a Southampton secondary school in the east of the city where there are a sufficient number of places.
County Council Programmed School Expansions 2013-16 Botley Primary School – 0.5 form entry expansion Wellstead Primary School – 1 form entry expansion Boorley Green – new 2 form entry primary school
Local areas under review: Hedge End Horton Heath Need for new Secondary School in area
Fair Oak – Primary Planning Area 8500013
Key data:
October 2013 Forecast 2018Number of Infant/Primary/Junior Schools: 6 6Total Planning Area Primary Age Capacity: 1841 1841Total Planning Area Primary Age Number on Roll: 1762 1828% Surplus Capacity 4% 1%Total Planning Area Year R PAN 241 241Total Planning Area Year R Intake 267 256% Intake Year Surplus -11%* -6%*
*See explanatory notes below
Explanatory notes: For the 2013 intake additional temporary places were provided at Fair Oak Infant School to accommodate the
number of pupils. These temporary places are not included within the capacity figures in the table above. Extra places are needed for the Fair Oak area and discussions are underway with local schools.
Planned significant housing developments in area:
Page 14 of 40

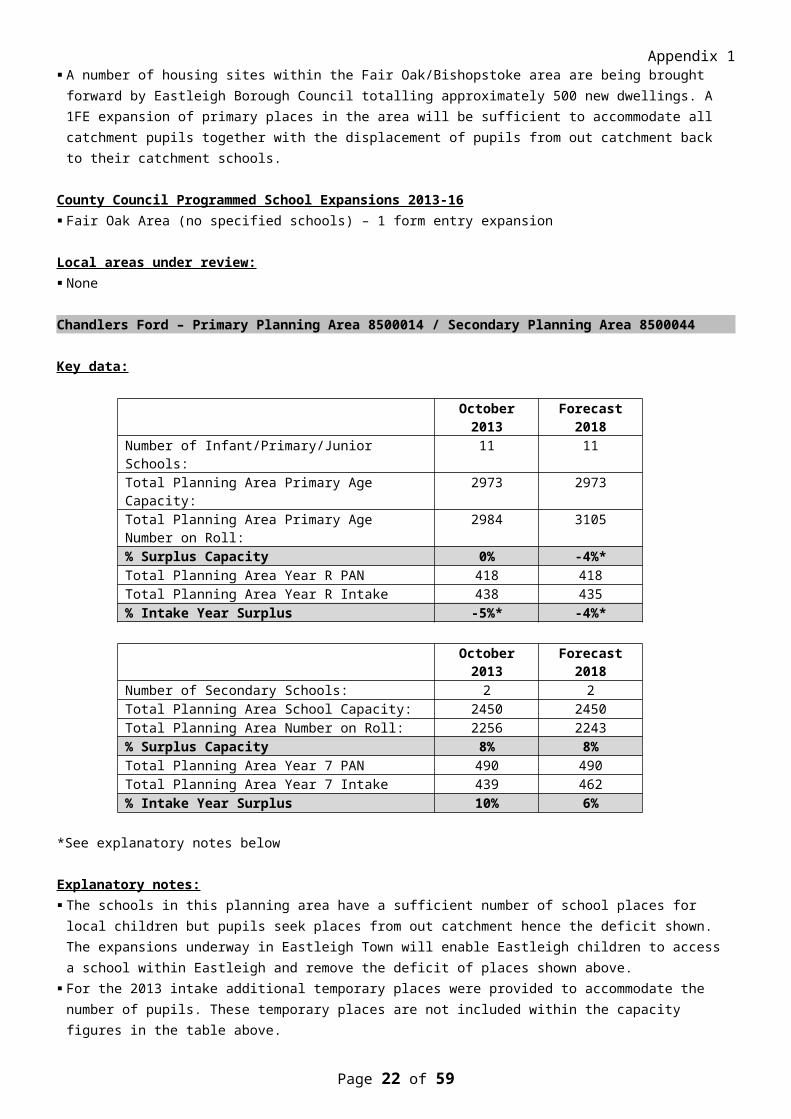
Appendix 1 A number of housing sites within the Fair Oak/Bishopstoke area are being brought forward by Eastleigh Borough
Council totalling approximately 500 new dwellings. A 1FE expansion of primary places in the area will be sufficient to accommodate all catchment pupils together with the displacement of pupils from out catchment back to their catchment schools.
County Council Programmed School Expansions 2013-16 Fair Oak Area (no specified schools) – 1 form entry expansion
Local areas under review: None
Chandlers Ford – Primary Planning Area 8500014 / Secondary Planning Area 8500044
Key data:
October 2013 Forecast 2018Number of Infant/Primary/Junior Schools: 11 11Total Planning Area Primary Age Capacity: 2973 2973Total Planning Area Primary Age Number on Roll: 2984 3105% Surplus Capacity 0% -4%*Total Planning Area Year R PAN 418 418Total Planning Area Year R Intake 438 435% Intake Year Surplus -5%* -4%*
October 2013 Forecast 2018Number of Secondary Schools: 2 2Total Planning Area School Capacity: 2450 2450Total Planning Area Number on Roll: 2256 2243% Surplus Capacity 8% 8%Total Planning Area Year 7 PAN 490 490Total Planning Area Year 7 Intake 439 462% Intake Year Surplus 10% 6%
*See explanatory notes below
Explanatory notes: The schools in this planning area have a sufficient number of school places for local children but pupils seek
places from out catchment hence the deficit shown. The expansions underway in Eastleigh Town will enable Eastleigh children to access a school within Eastleigh and remove the deficit of places shown above.
For the 2013 intake additional temporary places were provided to accommodate the number of pupils. These temporary places are not included within the capacity figures in the table above.
For future years the additional places planned for the Eastleigh schools will provide sufficient places within Eastleigh and the Chandlers Ford schools will not be required to take such large Eastleigh numbers.
Planned significant housing developments in area: None known.
County Council Programmed School Expansions 2013-16 No planned expansions.
Local areas under review: None
Eastleigh – Primary Planning Area 8500015 / Secondary Planning Area 8500046
Page 15 of 40
Appendix 1
Key data:
October 2013 Forecast 2018Number of Infant/Primary/Junior Schools: 6 6Total Planning Area Primary Age Capacity: 1944 2460Total Planning Area Primary Age Number on Roll: 1973 2354% Surplus Capacity -1%* 4%Total Planning Area Year R PAN 294 354Total Planning Area Year R Intake 326 369% Intake Year Surplus -11%* -4%*
October 2013 Forecast 2018Number of Secondary Schools: 2 2Total Planning Area School Capacity: 1430 1430Total Planning Area Number on Roll: 952 1050% Surplus Capacity 33% 27%Total Planning Area Year 7 PAN 286 286Total Planning Area Year 7 Intake 188 231% Intake Year Surplus 34% 19%
*See explanatory notes below
Explanatory notes: For the 2013 intake additional temporary places were provided to accommodate the number of pupils. These
temporary places are not included within the capacity figures in the table above. For the intake in future years additional places within Eastleigh will remove the deficit shown in the table above. The number of Year R pupils living in the catchment areas of the schools in this area exceeds the number of
places available. This, together with the planned housing in the area, will put significant pressure on school places for the future. However the expansions to Nightingale, The Crescent and Norwood Primary Schools will help minimise the anticipated shortfall in places. In the longer term further expansion of schools within Eastleigh Town may need to be considered, possibly as a 1FE expansion of the Shakespeare pair of schools.
In order to accommodate all YR children in 2013 Cherbourg Primary took an additional six pupils and The Crescent agreed to take up to an additional 30 pupils a year before their permanent accommodation was available.
Planned significant housing developments in area: No large developments at present but land to the south of Chestnut Avenue is under consideration. If this comes
forward this will provide an additional 1,100 dwellings. A site for a 2FE primary school is to be reserved within the development and developer contributions sought in the future.
County Council Programmed School Expansions 2013-16 Crescent Primary School – 221 additional places Nightingale Primary School – 60 additional places Norwood Primary School – 235 additional places
Local areas under review: Eastleigh Town
Page 16 of 40

Appendix 1
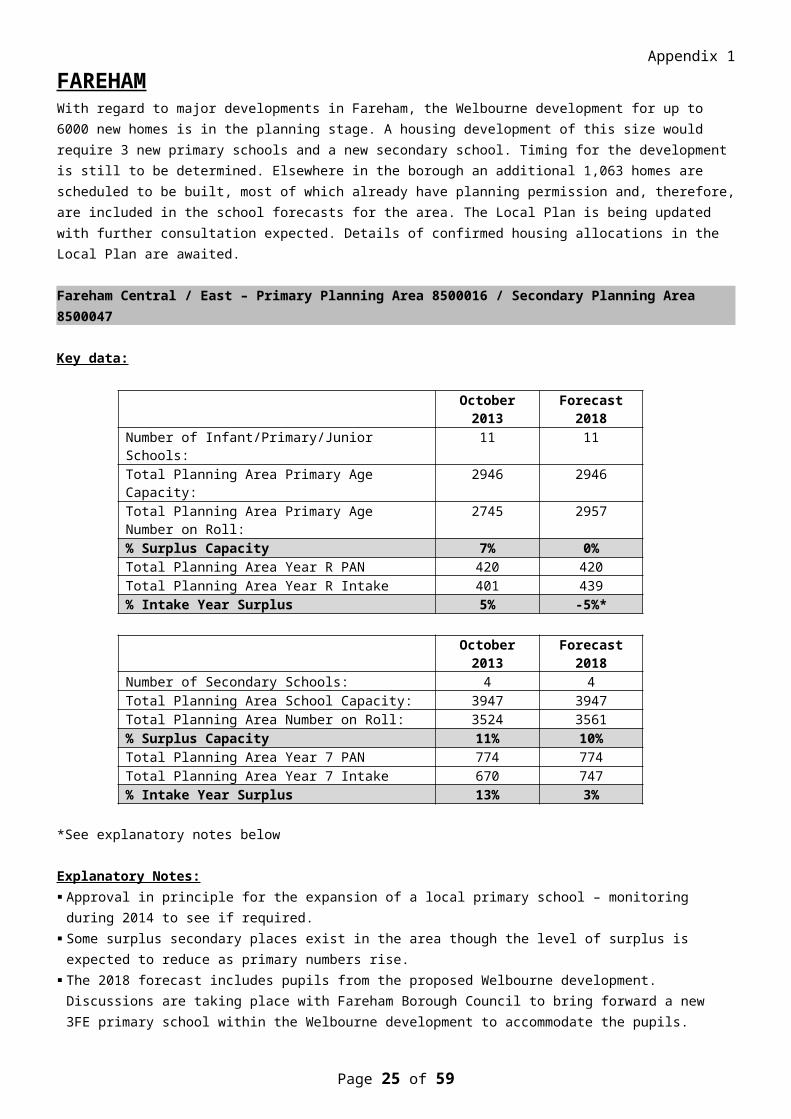
FAREHAMWith regard to major developments in Fareham, the Welbourne development for up to 6000 new homes is in the planning stage. A housing development of this size would require 3 new primary schools and a new secondary school. Timing for the development is still to be determined. Elsewhere in the borough an additional 1,063 homes are scheduled to be built, most of which already have planning permission and, therefore, are included in the school forecasts for the area. The Local Plan is being updated with further consultation expected. Details of confirmed housing allocations in the Local Plan are awaited.
Fareham Central / East – Primary Planning Area 8500016 / Secondary Planning Area 8500047
Key data:
October 2013 Forecast 2018Number of Infant/Primary/Junior Schools: 11 11Total Planning Area Primary Age Capacity: 2946 2946Total Planning Area Primary Age Number on Roll: 2745 2957% Surplus Capacity 7% 0%Total Planning Area Year R PAN 420 420Total Planning Area Year R Intake 401 439% Intake Year Surplus 5% -5%*
October 2013 Forecast 2018Number of Secondary Schools: 4 4Total Planning Area School Capacity: 3947 3947Total Planning Area Number on Roll: 3524 3561% Surplus Capacity 11% 10%Total Planning Area Year 7 PAN 774 774Total Planning Area Year 7 Intake 670 747% Intake Year Surplus 13% 3%
*See explanatory notes below
Explanatory Notes: Approval in principle for the expansion of a local primary school – monitoring during 2014 to see if required. Some surplus secondary places exist in the area though the level of surplus is expected to reduce as primary
numbers rise. The 2018 forecast includes pupils from the proposed Welbourne development. Discussions are taking place with
Fareham Borough Council to bring forward a new 3FE primary school within the Welbourne development to accommodate the pupils.
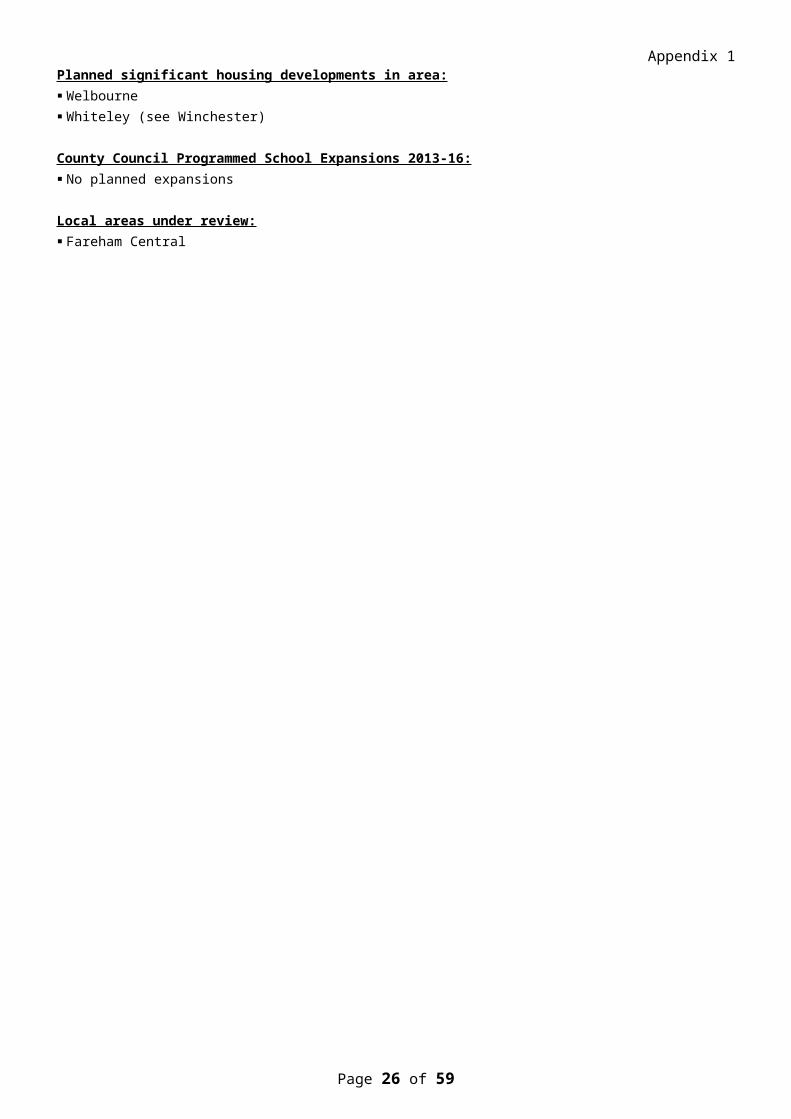
Planned significant housing developments in area: Welbourne Whiteley (see Winchester)
County Council Programmed School Expansions 2013-16: No planned expansions
Local areas under review: Fareham Central
Page 17 of 40
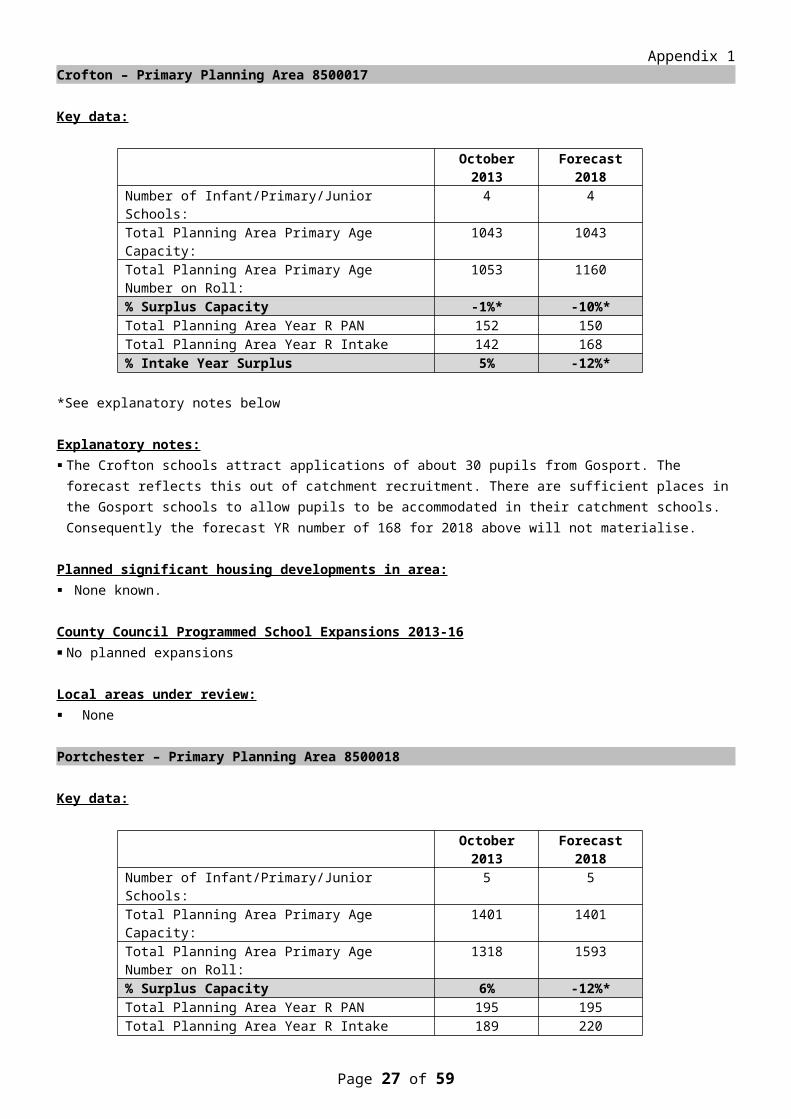
Appendix 1 Crofton – Primary Planning Area 8500017
Key data:
October 2013 Forecast 2018Number of Infant/Primary/Junior Schools: 4 4Total Planning Area Primary Age Capacity: 1043 1043Total Planning Area Primary Age Number on Roll: 1053 1160% Surplus Capacity -1%* -10%*Total Planning Area Year R PAN 152 150Total Planning Area Year R Intake 142 168% Intake Year Surplus 5% -12%*
*See explanatory notes below
Explanatory notes: The Crofton schools attract applications of about 30 pupils from Gosport. The forecast reflects this out of
catchment recruitment. There are sufficient places in the Gosport schools to allow pupils to be accommodated in their catchment schools. Consequently the forecast YR number of 168 for 2018 above will not materialise.
Planned significant housing developments in area: None known.
County Council Programmed School Expansions 2013-16 No planned expansions
Local areas under review: None
Portchester – Primary Planning Area 8500018
Key data:
October 2013 Forecast 2018Number of Infant/Primary/Junior Schools: 5 5Total Planning Area Primary Age Capacity: 1401 1401Total Planning Area Primary Age Number on Roll: 1318 1593% Surplus Capacity 6% -12%*Total Planning Area Year R PAN 195 195Total Planning Area Year R Intake 189 220% Intake Year Surplus 3% -13%*
*See explanatory notes below
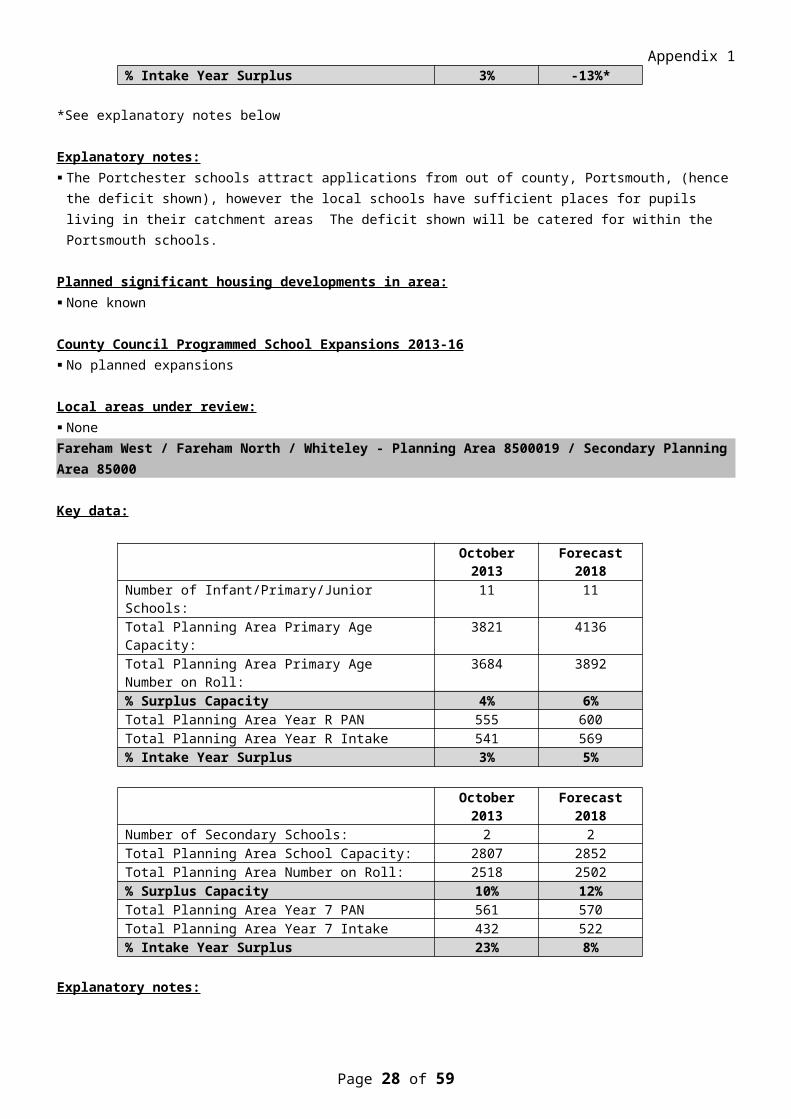
Explanatory notes: The Portchester schools attract applications from out of county, Portsmouth, (hence the deficit shown), however
the local schools have sufficient places for pupils living in their catchment areas The deficit shown will be catered for within the Portsmouth schools.
Planned significant housing developments in area: None known
County Council Programmed School Expansions 2013-16 No planned expansions
Local areas under review: None
Page 18 of 40
Appendix 1 Fareham West / Fareham North / Whiteley - Planning Area 8500019 / Secondary Planning Area 85000
Key data:
October 2013 Forecast 2018Number of Infant/Primary/Junior Schools: 11 11Total Planning Area Primary Age Capacity: 3821 4136Total Planning Area Primary Age Number on Roll: 3684 3892% Surplus Capacity 4% 6%Total Planning Area Year R PAN 555 600Total Planning Area Year R Intake 541 569% Intake Year Surplus 3% 5%
October 2013 Forecast 2018Number of Secondary Schools: 2 2Total Planning Area School Capacity: 2807 2852Total Planning Area Number on Roll: 2518 2502% Surplus Capacity 10% 12%Total Planning Area Year 7 PAN 561 570Total Planning Area Year 7 Intake 432 522% Intake Year Surplus 23% 8%
Explanatory notes: Cornerstone is a new 1FE primary school with the forecast primary capacity above including this provision.
Longer term, as the north Whiteley development is built, the school will be relocated and expanded.
Planned significant housing developments in area: None known.
County Council Programmed School Expansions 2013-16 St John the Baptist Primary – 0.5 form entry expansion Cornerstone Primary School – new 1 form entry primary school (opened September 2013) Brookfield Secondary School – 45 additional places
Local areas under review: Whiteley
Page 19 of 40

Appendix 1
GOSPORTIt is anticipated that 1,332 homes will be built within Gosport by 2018 with a number of developments already under way. The Local Plan is being updated with further consultation expected. Details of confirmed housing allocations in the Local Plan are awaited.
Gosport South-East – Primary Planning Area 8500020
Key data:
October 2013 Forecast 2018Number of Infant/Primary/Junior Schools: 8 8Total Planning Area Primary Age Capacity: 2087 2267Total Planning Area Primary Age Number on Roll: 2165 2276% Surplus Capacity -4%* 0%Total Planning Area Year R PAN 295 325Total Planning Area Year R Intake 324 311% Intake Year Surplus -10%* 4%
*See explanatory notes below
Explanatory Notes: The number of Year R pupils living in this area of Gosport has risen substantially for the 2013 admission round
and are forecast to remain high. The additional number of YR pupils for 2013 were accommodated at Leesland Infant and Junior Schools which
are returning to 3FE schools (from 2FE).
Planned significant housing developments in area: The former Royal Haslar Hospital site is proposed for redevelopment with an additional 308 dwellings to be built.
Of this number 75 will be one-bedroomed properties. Should planning be approved it is anticipated that an expansion of a school or schools in the area will be required.
County Council Programmed School Expansions 2013-16: Leesland Infant & Junior Schools – 1 form entry expansion Single temporary classroom at Alverstoke Infant will be removed in 2015 (-30 places)
Local areas under review: Royal Haslar Hospital has been proposed for redevelopment. This will require additional accommodation in the
South-East of Gosport.
Gosport South-West – Primary Planning Area 8500021
Key data:
October 2013 Forecast 2018Number of Infant/Primary/Junior Schools: 4 4Total Planning Area Primary Age Capacity: 1050 1050Total Planning Area Primary Age Number on Roll: 1043 906% Surplus Capacity 0% 16%Total Planning Area Year R PAN 150 150Total Planning Area Year R Intake 148 112% Intake Year Surplus 1% 25%
Explanatory notes: The number of Year R pupils living in the catchment areas of the schools in this area is forecast to drop which will
allow all Year R pupils to be accommodated.
Page 20 of 40
Appendix 1 Planned significant housing developments in area: None known
County Council Programmed School Expansions 2013-16 No planned expansions
Local areas under review: None
Gosport North – Primary Planning Area 8500022
Key data:
October 2013 Forecast 2018Number of Infant/Primary/Junior Schools: 3 3Total Planning Area Primary Age Capacity: 825 825Total Planning Area Primary Age Number on Roll: 706 793% Surplus Capacity 14% 4%Total Planning Area Year R PAN 120 120Total Planning Area Year R Intake 97 103% Intake Year Surplus 19% 14%
Explanatory notes: Sufficient places in this part of Gosport for the number of pupils living in the planning area.
Planned significant housing developments in area: None known
County Council Programmed School Expansions 2013-16 No planned expansions
Local areas under review: None
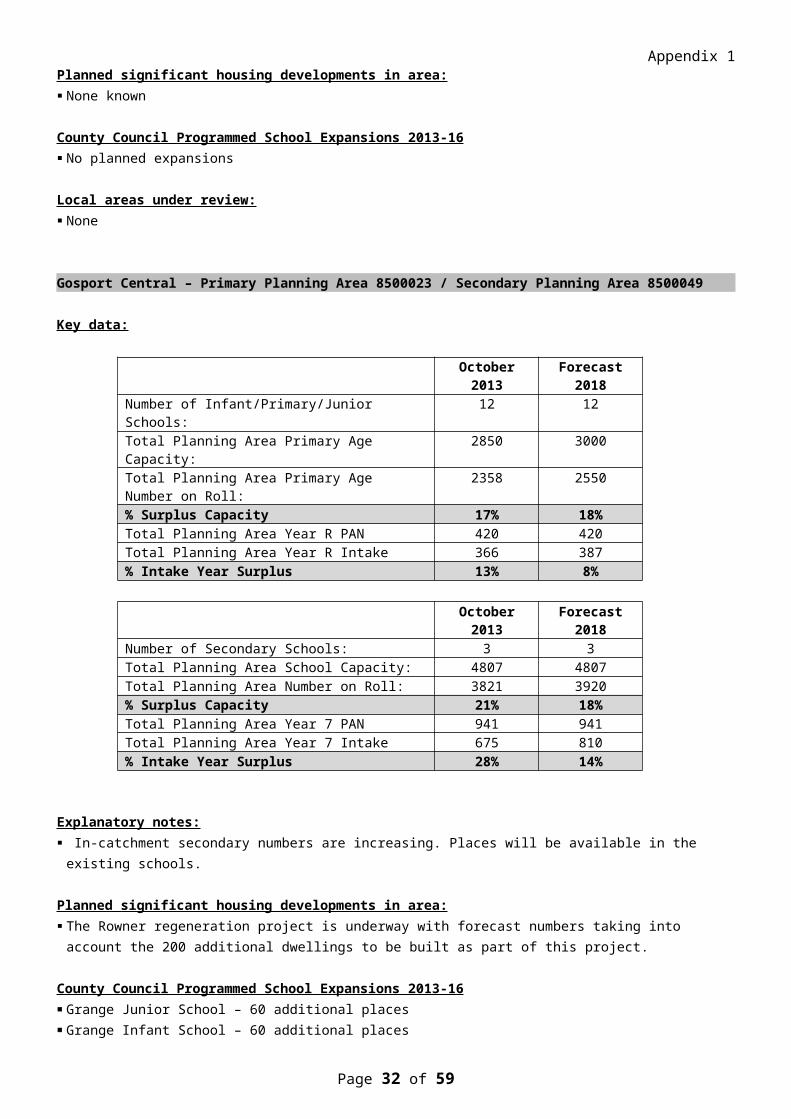
Gosport Central – Primary Planning Area 8500023 / Secondary Planning Area 8500049
Key data:
October 2013 Forecast 2018Number of Infant/Primary/Junior Schools: 12 12Total Planning Area Primary Age Capacity: 2850 3000Total Planning Area Primary Age Number on Roll: 2358 2550% Surplus Capacity 17% 18%Total Planning Area Year R PAN 420 420Total Planning Area Year R Intake 366 387% Intake Year Surplus 13% 8%
October 2013 Forecast 2018Number of Secondary Schools: 3 3Total Planning Area School Capacity: 4807 4807Total Planning Area Number on Roll: 3821 3920% Surplus Capacity 21% 18%Total Planning Area Year 7 PAN 941 941Total Planning Area Year 7 Intake 675 810% Intake Year Surplus 28% 14%
Page 21 of 40
Appendix 1 Explanatory notes: In-catchment secondary numbers are increasing. Places will be available in the existing schools.
Planned significant housing developments in area: The Rowner regeneration project is underway with forecast numbers taking into account the 200 additional
dwellings to be built as part of this project.
County Council Programmed School Expansions 2013-16 Grange Junior School – 60 additional places Grange Infant School – 60 additional places Siskin Junior School – 30 additional places
Local areas under review: None
Page 22 of 40

Appendix 1
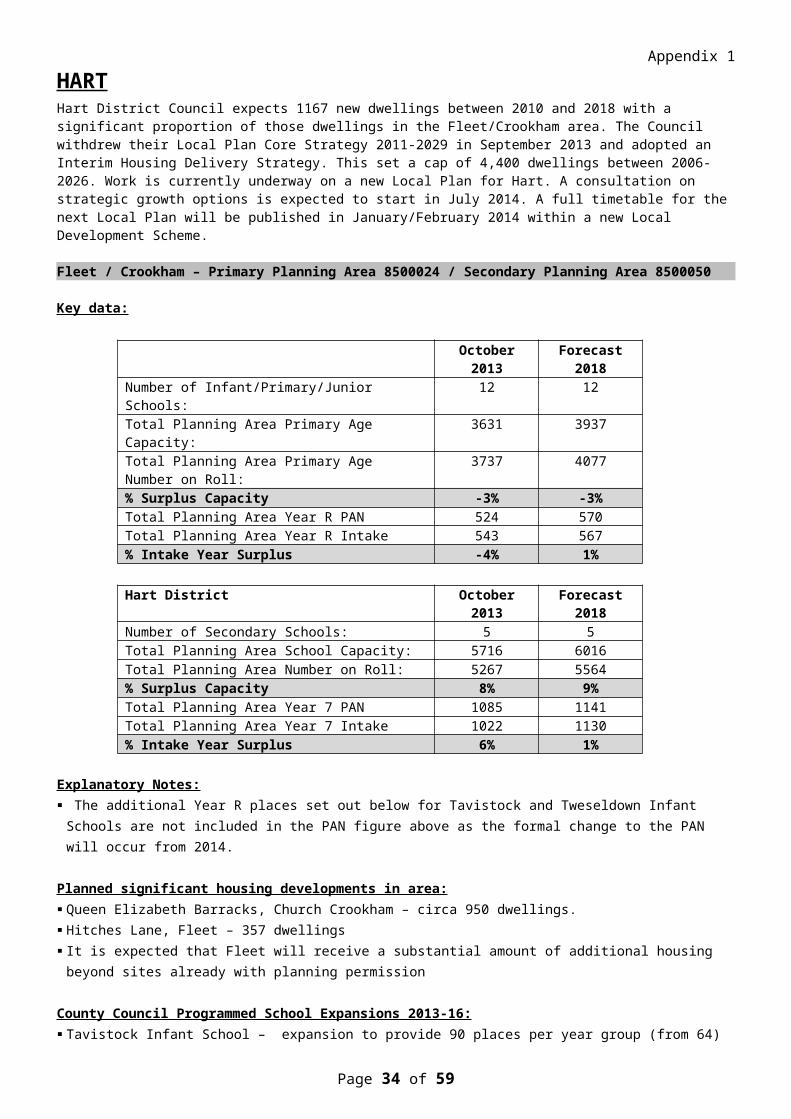
HARTHart District Council expects 1167 new dwellings between 2010 and 2018 with a significant proportion of those dwellings in the Fleet/Crookham area. The Council withdrew their Local Plan Core Strategy 2011-2029 in September 2013 and adopted an Interim Housing Delivery Strategy. This set a cap of 4,400 dwellings between 2006-2026. Work is currently underway on a new Local Plan for Hart. A consultation on strategic growth options is expected to start in July 2014. A full timetable for the next Local Plan will be published in January/February 2014 within a new Local Development Scheme.
Fleet / Crookham – Primary Planning Area 8500024 / Secondary Planning Area 8500050
Key data:
October 2013 Forecast 2018Number of Infant/Primary/Junior Schools: 12 12Total Planning Area Primary Age Capacity: 3631 3937Total Planning Area Primary Age Number on Roll: 3737 4077% Surplus Capacity -3% -3%Total Planning Area Year R PAN 524 570Total Planning Area Year R Intake 543 567% Intake Year Surplus -4% 1%
Hart District October 2013 Forecast 2018Number of Secondary Schools: 5 5Total Planning Area School Capacity: 5716 6016Total Planning Area Number on Roll: 5267 5564% Surplus Capacity 8% 9%Total Planning Area Year 7 PAN 1085 1141Total Planning Area Year 7 Intake 1022 1130% Intake Year Surplus 6% 1%
Explanatory Notes: The additional Year R places set out below for Tavistock and Tweseldown Infant Schools are not included in the
PAN figure above as the formal change to the PAN will occur from 2014.
Planned significant housing developments in area: Queen Elizabeth Barracks, Church Crookham – circa 950 dwellings. Hitches Lane, Fleet – 357 dwellings It is expected that Fleet will receive a substantial amount of additional housing beyond sites already with planning
permission
County Council Programmed School Expansions 2013-16: Tavistock Infant School – expansion to provide 90 places per year group (from 64) Tweseldown Infant School – expansion to provide 90 places per year group (from 70) Church Crookham Junior School – 1 form entry expansion All Saints CE Junior School – 1 form entry expansion (equates to 35 places per year group) Calthorpe Park Secondary School – 300 additional places in two phases
Areas under review: Additional primary school places are likely to be required beyond those detailed above and work is underway to
identify how these could be provided.
Page 23 of 40

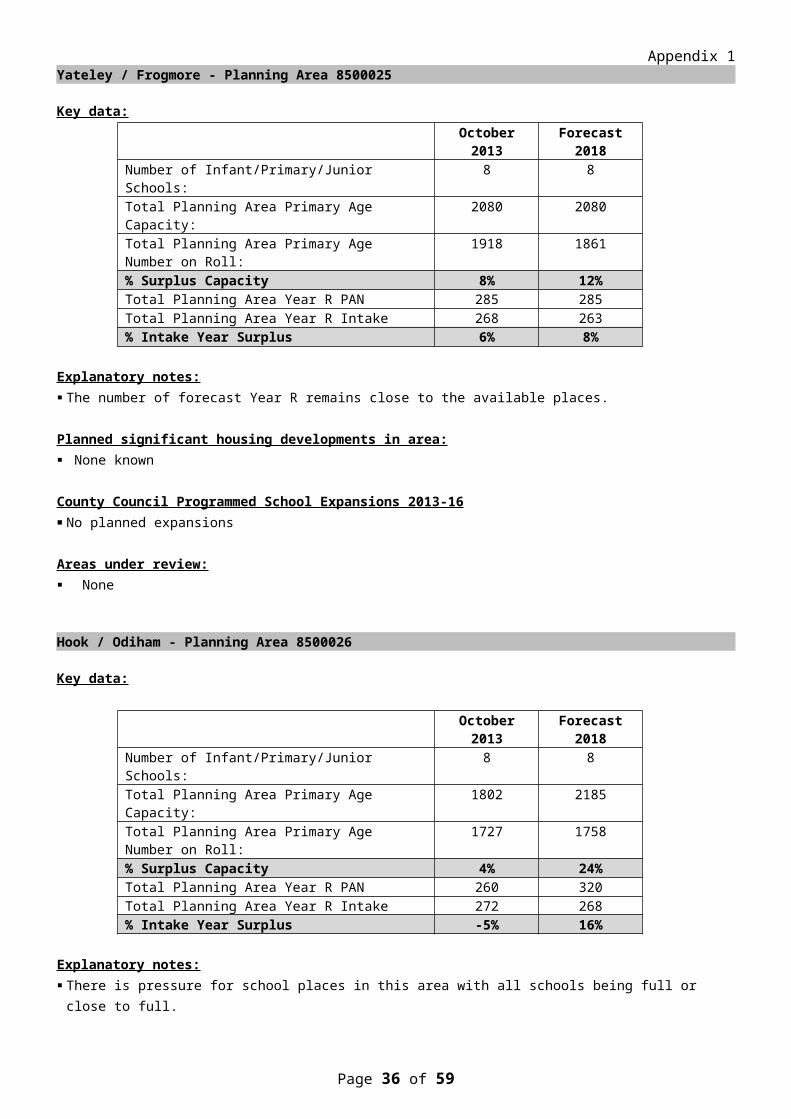
Appendix 1 Yateley / Frogmore - Planning Area 8500025
Key data:October 2013 Forecast 2018
Number of Infant/Primary/Junior Schools: 8 8Total Planning Area Primary Age Capacity: 2080 2080Total Planning Area Primary Age Number on Roll: 1918 1861% Surplus Capacity 8% 12%Total Planning Area Year R PAN 285 285Total Planning Area Year R Intake 268 263% Intake Year Surplus 6% 8%
Explanatory notes: The number of forecast Year R remains close to the available places.
Planned significant housing developments in area: None known
County Council Programmed School Expansions 2013-16 No planned expansions
Areas under review: None
Hook / Odiham - Planning Area 8500026
Key data:
October 2013 Forecast 2018Number of Infant/Primary/Junior Schools: 8 8Total Planning Area Primary Age Capacity: 1802 2185Total Planning Area Primary Age Number on Roll: 1727 1758% Surplus Capacity 4% 24%Total Planning Area Year R PAN 260 320Total Planning Area Year R Intake 272 268% Intake Year Surplus -5% 16%
Explanatory notes: There is pressure for school places in this area with all schools being full or close to full.
Planned significant housing developments in area: Although Hart’s Core Strategy has been withdrawn it is still expected that that there will be an allocation of circa
700 dwellings in Hook and a further significant allocation of new housing.
County Council Programmed School Expansions 2013-16 Hook Infant School – 1 form entry expansion Hook Junior School – 0.5 form entry expansion Oakwood Infant School – 1 form entry expansion Greenfields Junior School – 1 form entry expansion
Local areas under review: None
Page 24 of 40
Appendix 1
HAVANTIt is anticipated that 2,794 homes will be built within Havant by 2018 with a number of developments already under way. The Local Plan is being updated with further consultation expected. Details of confirmed housing allocations in the Local Plan are awaited.
Waterlooville / Cowplain – Primary Planning Area 8500027 / Secondary Planning Area 8500051
Key data:
October 2013 Forecast 2018Number of Infant/Primary/Junior Schools: 17 18Total Planning Area Primary Age Capacity: 4788 5278Total Planning Area Primary Age Number on Roll: 4229 4956% Surplus Capacity 12% 6%Total Planning Area Year R PAN 705 765Total Planning Area Year R Intake 631 763% Intake Year Surplus 10% 0%
October 2013 Forecast 2018Number of Secondary Schools: 4 4Total Planning Area School Capacity: 4250 4250Total Planning Area Number on Roll: 3572 3644% Surplus Capacity 16% 14%Total Planning Area Year 7 PAN 763 763Total Planning Area Year 7 Intake 676 759% Intake Year Surplus 11% 1%
Explanatory notes: Future numbers are tight but the second primary school within the West of Waterlooville development is
scheduled for completion for September 2018 and the capacity of this proposed new school (420 places) is not included in the primary forecast capacity above.
Similarly the secondary numbers are tight but the capacity shown is based on a lower PAN for Crookhorn College than is derived from the net capacity assessment for the school. As numbers increase the school will be able to accept more pupils by increasing it’s PAN.
Planned significant housing developments in area: West of Waterlooville – the first 2FE primary school is under construction with the second 2FE school being
brought forward as required (currently a named scheme in the 2016/17 Children’s Services capital programme).
County Council Programmed School Expansions 2013-16: West of Waterlooville (Berewood) – new 2 form entry primary school Padnell Infant – increasing PAN and adding 54 additional places Hambledon Primary – additional 16 places
Local areas under review: None
Page 25 of 40
Appendix 1 Havant – Primary Planning Area 8500028 / Secondary Planning Area 8500052
Key data:
October 2013 Forecast 2018Number of Infant/Primary/Junior Schools: 15 15Total Planning Area Primary Age Capacity: 4090 4405Total Planning Area Primary Age Number on Roll: 3853 4440% Surplus Capacity 6% -1%Total Planning Area Year R PAN 589 634Total Planning Area Year R Intake 603 648% Intake Year Surplus -2%* -2%*
October 2013 Forecast 2018Number of Secondary Schools: 3 3Total Planning Area School Capacity: 2500 2500Total Planning Area Number on Roll: 1922 1995% Surplus Capacity 23% 20%Total Planning Area Year 7 PAN 500 500Total Planning Area Year 7 Intake 365 427% Intake Year Surplus 27% 15%
*See explanatory notes below
Explanatory notes: For the 2013 intake additional places were offered at Riders Infant School. For the 2018 intake Emsworth Primary will be able to offer an additional 15 places per year group and
discussions are under way with St James CE Primary to expand to a 1.5FE primary school. Havant Town Centre schools are under increasing pressure owing to a rise in the birth rate. Longer term there is
likely to be a need for additional primary places in the area.
Planned significant housing developments in area: None confirmed.
County Council Programmed School Expansions 2013-16 Emsworth Primary School – 0.5 form entry expansion Riders Infant & Junior Schools – 1 form entry expansion
Local areas under review: Emsworth and Leigh Park
Hayling Island – Primary Planning Area 8500063 / Secondary Planning Area 8500068
Key data:
October 2013 Forecast 2018Number of Infant/Primary/Junior Schools: 4 4Total Planning Area Primary Age Capacity: 971 1031Total Planning Area Primary Age Number on Roll: 807 848% Surplus Capacity 17% 22%Total Planning Area Year R PAN 150 150Total Planning Area Year R Intake 100 119% Intake Year Surplus 33% 20%
Page 26 of 40
Appendix 1 October 2013 Forecast 2018
Number of Secondary Schools: 1 1Total Planning Area School Capacity: 750 750Total Planning Area Number on Roll: 554 582% Surplus Capacity 26% 22%Total Planning Area Year 7 PAN 150 150Total Planning Area Year 7 Intake 99 109% Intake Year Surplus 34% 27%
Explanatory notes: Planned housing on Hayling Island can be accommodated within the existing Hayling Island schools.
Planned significant housing developments in area: None known
County Council Programmed School Expansions 2013-16 Mengham Junior – 60 additional places
Local areas under review: None
Page 27 of 40
Appendix 1
NEW FORESTNew Forest District Council adopted their Core Strategy in 2009 covering the period 2006-2026 which highlighted a minimum of 3,920 new dwellings plus 810 to address local affordable housing needs. There are no significant large sites identified but housing will be spread across the area.
Ringwood – Primary Planning Area 8500029 / Secondary Planning Area 8500058
Key data:
October 2013 Forecast 2018Number of Infant/Primary/Junior Schools: 7 7Total Planning Area Primary Age Capacity: 1675 1735Total Planning Area Primary Age Number on Roll: 1758 1895% Surplus Capacity -5% -8%Total Planning Area Year R PAN 235 255Total Planning Area Year R Intake 242 271% Intake Year Surplus -3%* -6%*
Forest October 2013 Forecast 2018Number of Secondary Schools: 4 4Total Planning Area School Capacity: 5321 5321Total Planning Area Number on Roll: 4118 4125% Surplus Capacity 23% 22%Total Planning Area Year 7 PAN 838 838Total Planning Area Year 7 Intake 783 832% Intake Year Surplus 7% 1%
*See explanatory notes below
Explanatory Notes: Poulner Infant provided extra Year R places in 2013 which are not accounted in the Year R PAN figure above Rising pre-school numbers and an allocation of 300 dwellings in the area will create a pressure on school places. The forecast model overestimates pupil numbers for schools with a high proportion of out of catchment area
children as is the case at Bransgore CE (C) Primary and Sopley Primary Schools.
Planned significant housing developments in area: Crow Lane, Ringwood 175 dwellings expected to start in 2015
County Council Programmed School Expansions 2013-16: No planned expansions
Local areas under review: Ringwood – Poulner Infant School to offer 90 (PAN 70) places from 2014 Overall area in relation to secondary provision
Lymington – Primary Planning Area 8500030
Key data:
October 2013 Forecast 2018Number of Infant/Primary/Junior Schools: 11 11Total Planning Area Primary Age Capacity: 1958 1993Total Planning Area Primary Age Number on Roll: 1897 1967% Surplus Capacity 3% 1%Total Planning Area Year R PAN 278 283Total Planning Area Year R Intake 263 272% Intake Year Surplus 5% 4%
Page 28 of 40

Appendix 1
Explanatory notes: The rural nature of this area creates its own school place planning pressures due to the distances involved
between schools.
Planned significant housing developments in area: None
County Council Programmed School Expansions 2013-16 Brockenhurst CE Primary School – 35 additional places
Local areas under review: Lymington
Totton – Primary Planning Area 8500031 / Secondary Planning Area 8500054
Key data:
October 2013 Forecast 2018Number of Infant/Primary/Junior Schools: 13 13Total Planning Area Primary Age Capacity: 3020 3246Total Planning Area Primary Age Number on Roll: 2872 2930% Surplus Capacity 5% 11%Total Planning Area Year R PAN 420 455Total Planning Area Year R Intake 440 412% Intake Year Surplus -5%* 9%
Totton / Waterside October 2013 Forecast 2018Number of Secondary Schools: 5 5Total Planning Area School Capacity: 5580 5580Total Planning Area Number on Roll: 3969 3964% Surplus Capacity 29% 29%Total Planning Area Year 7 PAN 1061 1061Total Planning Area Year 7 Intake 759 820% Intake Year Surplus 28% 23%
*See explanatory notes below
Explanatory notes: Foxhills Infant offered an additional 30 Year R places and Eling Infant an additional 5 Year R places in September
2013 which are not included in the Year R PAN figure above.
Planned significant housing developments in area: None known
County Council Programmed School Expansions 2013-16 Eling Infant School – 15 additional places
Local areas under review: 30 additional Year R places have been provided at Foxhills Infant from 2013 with Foxhills Junior School
increasing capacity in due course to reflect demand from the Infant School.
Page 29 of 40

Appendix 1
Dibden / South Waterside – Primary Planning Area 8500032
Key data:
October 2013 Forecast 2018Number of Infant/Primary/Junior Schools: 12 12Total Planning Area Primary Age Capacity: 3306 3306Total Planning Area Primary Age Number on Roll: 3046 3102% Surplus Capacity 8% 7%Total Planning Area Year R PAN 547 547Total Planning Area Year R Intake 484 463% Intake Year Surplus 12% 14%
Planned significant housing developments in area: None known
County Council Programmed School Expansions 2013-16: No planned expansions
Local areas under review: None
Fordingbridge – Primary Planning Area 8500064
Key data:
October 2013 Forecast 2018Number of Infant/Primary/Junior Schools: 6 6Total Planning Area Primary Age Capacity: 952 952Total Planning Area Primary Age Number on Roll: 810 976% Surplus Capacity 15% -2%*Total Planning Area Year R PAN 136 136Total Planning Area Year R Intake 114 162% Intake Year Surplus 16% -19%*
*See explanatory notes below
Explanatory notes: The forecast model overestimates pupil numbers for schools with a high proportion of out of catchment area
children as is the case at Hale and Breamore Primary Schools.
Planned significant housing developments in area: None known
County Council Programmed School Expansions 2013-16 No planned expansions
Local areas under review: None
Page 30 of 40

Appendix 1 New Milton – Primary Planning Area 8500065
Key data:
October 2013 Forecast 2018Number of Infant/Primary/Junior Schools: 6 6Total Planning Area Primary Age Capacity: 1536 1626Total Planning Area Primary Age Number on Roll: 1490 1611% Surplus Capacity 3% 1%Total Planning Area Year R PAN 212 242Total Planning Area Year R Intake 214 218% Intake Year Surplus -1% 10%
Explanatory notes: Pupil numbers are forecast to rise within the planning area. Ashley Infant School is offering up to 90 places from
2013 and future years. These additional 30 places are not reflected in the PAN figures above but the additional capacity (90 places) is included in the 2018 capacity figure. The impact for Junior School places is being assessed.
Planned significant housing developments in area: None known
County Council Programmed School Expansions 2013-16 No planned expansions.
Local areas under review: New Milton.
Page 31 of 40
Appendix 1
RUSHMOORRushmoor Borough Council adopted their Core Strategy in 2011 which identified 6,350 dwellings between 2010-2027. This includes the re-development of military land known as Aldershot Urban Extension to provide up to 3,850 dwellings with first completions expected in 2015.
Aldershot – Primary Planning Area 8500033
Key data:
October 2013 Forecast 2018Number of Infant/Primary/Junior Schools: 10 11Total Planning Area Primary Age Capacity: 2952 3700Total Planning Area Primary Age Number on Roll: 2798 3346% Surplus Capacity 5% 11%Total Planning Area Year R PAN 472 552Total Planning Area Year R Intake 464 552% Intake Year Surplus 2% 0%
Explanatory Notes: The number of children in this area significantly exceeds the available places however a large number of pupils
attend adjacent Surrey schools.
Planned significant housing developments in area: Aldershot Urban Extension (AUE), 3850 dwellings starting in 2014
County Council Programmed School Expansions 2013-16: Wellington Primary School – consolidation on to one site to create a 2FE (420 place) primary school Newport Junior School – 90 additional places AUE (Western) – new 2 form entry primary school
Local areas under review: St Josephs Catholic Primary School – 0.5 form entry expansion being considered
Farnborough / Cove – Primary Planning Area 8500034 / Secondary Planning Area 8500055
Key data:
October 2013 Forecast 2018Number of Infant/Primary/Junior Schools: 21 21Total Planning Area Primary Age Capacity: 4852 5212Total Planning Area Primary Age Number on Roll: 4733 4675% Surplus Capacity 2% 11%Total Planning Area Year R PAN 726 765Total Planning Area Year R Intake 720 677% Intake Year Surplus 1% 12%
Aldershot / Farnborough October 2013 Forecast 2018Number of Secondary Schools: 4 4Total Planning Area School Capacity: 3776 3776Total Planning Area Number on Roll: 3242 3492% Surplus Capacity 14% 8%Total Planning Area Year 7 PAN 762 762Total Planning Area Year 7 Intake 578 740% Intake Year Surplus 24% 3%
Page 32 of 40

Appendix 1 Explanatory notes: The demand for Year R places has increased resulting in additional places being required. Pressure also exists
for additional junior age provision as numbers have risen. Significant numbers of secondary pupils from this area attend schools in Surrey.
Planned significant housing developments in area: None
County Council Programmed School Expansions 2013-16 South Farnborough Infant – 27 additional places South Farnborough Junior – 1 form entry expansion Tower Hill Primary – 1 form entry expansion
Local areas under review: None
Page 33 of 40
Appendix 1
TEST VALLEYTest Valley Borough Council will be consulting on their revised Local Plan in late January. The Plan identifies 10,584 dwellings between 2011-2029 with a significant proportion on sites already having planning permission.
Andover Town – Primary Planning Area 8500035 / Secondary Planning Area 8500056
Key data:
October 2013 Forecast 2018Number of Infant/Primary/Junior Schools: 16 17Total Planning Area Primary Age Capacity: 3728 4172Total Planning Area Primary Age Number on Roll: 3430 4284% Surplus Capacity 8% -3%Total Planning Area Year R PAN 525 600Total Planning Area Year R Intake 517 641% Intake Year Surplus 2% -7%*
October 2013 Forecast 2018Number of Secondary Schools: 3 3Total Planning Area School Capacity: 2794 2794Total Planning Area Number on Roll: 2174 2405% Surplus Capacity 22% 14%Total Planning Area Year 7 PAN 587 587Total Planning Area Year 7 Intake 419 521% Intake Year Surplus 29% 11%
*See explanatory notes below
Explanatory Notes: Andover is experiencing significant increases in new housing (circa 4,000 dwellings) resulting in new primary
schools being provided – Endeavour and Pilgrims Cross CE (Aided) primary Schools - and planned extensions to existing schools.
A significant number of pupils attend surrounding rural schools which reduces the demand for places at schools in the Town. The forecast model overestimates pupil numbers for schools with a high proportion of out of catchment area children.
Endeavour Primary is now operating as a 2FE school.
Planned significant housing developments in area: Picket Piece – 400 dwellings (in addition to 530 already approved) East Anton – 2,500 dwellings Picket Twenty – 250 dwellings (in addition to 1,200 already approved)
County Council Programmed School Expansions 2013-16: Vigo Infant & Junior Schools – 1 form entry expansion Pilgrims Cross CE (A) Primary School – 0.5 form entry expansion
Local areas under review: Picket Twenty – timing for further expansion of Pilgrims Cross CE (A) Primary School East Anton – timing for new southern primary school – up to 3FE
Page 34 of 40

Appendix 1 Romsey Rural – Primary Planning Area 8500036
Key data:
October 2013 Forecast 2018Number of Infant/Primary/Junior Schools: 6 6Total Planning Area Primary Age Capacity: 1017 1122Total Planning Area Primary Age Number on Roll: 948 1202% Surplus Capacity 7% -7%Total Planning Area Year R PAN 149 164Total Planning Area Year R Intake 151 199% Intake Year Surplus -1%* -21%*
*See explanatory notes below
Explanatory notes: The demand for primary places will increase as development takes place, mainly in Nursling. Up to 50% of pupils on roll at Nursling and Rownhams St Johns Primary Schools come from out of catchment /
Southampton but Hampshire children also attend schools over the County border. The forecast model overestimates pupil numbers for schools with a high proportion of out of catchment area
children.
Planned significant housing developments in area: Redbridge Lane, Nursling – 350 dwellings expected to commence 2014 Parkers Farm, Rownhams – up to 350 dwellings expected to commence in 2015
County Council Programmed School Expansions 2013-16 Nursling Primary School – 105 additional places
Local areas under review: Rownhams
Romsey Town & North Baddesley – Primary Planning Area 8500060 / Secondary Planning Area 8500057
Key data:
October 2013 Forecast 2018Number of Infant/Primary/Junior Schools: 7 7Total Planning Area Primary Age Capacity: 1656 1866Total Planning Area Primary Age Number on Roll: 1700 1911% Surplus Capacity -3% -2%Total Planning Area Year R PAN 240 270Total Planning Area Year R Intake 260 247% Intake Year Surplus -8%* 9%
Romsey / Stockbridge October 2013 Forecast 2018Number of Secondary Schools: 3 3Total Planning Area School Capacity: 3320 3320Total Planning Area Number on Roll: 3134 3313% Surplus Capacity 6% 0%Total Planning Area Year 7 PAN 664 664Total Planning Area Year 7 Intake 595 631% Intake Year Surplus 10% 5%
*See explanatory notes below
Page 35 of 40
Appendix 1 Explanatory notes: Cupernham Infant School offered 30 additional Year R places in 2013 which are not included in the PAN figure
above. A significant proportion of pupils at the secondary schools in Romsey are from Southampton
Planned significant housing developments in area: Abbotswood – 800 dwellings currently on site Hoe Lane, North Baddesley – 300 dwellings timing to be confirmed
County Council Programmed School Expansions 2013-16 Cupernham Infant & Junior – 1 form entry expansion
Local areas under review: Romsey Town, North Baddesley
Stockbridge – Primary Planning Area 8500061
Key data:
October 2013 Forecast 2018Number of Infant/Primary/Junior Schools: 7 7Total Planning Area Primary Age Capacity: 929 929Total Planning Area Primary Age Number on Roll: 752 655% Surplus Capacity 19% 42%Total Planning Area Year R PAN 130 130Total Planning Area Year R Intake 122 96% Intake Year Surplus 6% 26%
Explanatory Notes: The number of Year R pupils living in the catchment area of the schools that make up the Stockbridge planning
area are less than the number of Year R places available across the schools and are forecast to decline.
Planned significant housing developments in area: None known
County Council Programmed School Expansions 2013-16: No planned expansions
Local areas under review: None
Andover Rural - Primary Planning Area 8500066
Key data:
October 2013 Forecast 2018Number of Infant/Primary/Junior Schools: 9 9Total Planning Area Primary Age Capacity: 1272 1272Total Planning Area Primary Age Number on Roll: 1182 1324% Surplus Capacity 7% -4%Total Planning Area Year R PAN 181 181Total Planning Area Year R Intake 182 250% Intake Year Surplus -1%* -38%*
*See explanatory notes below
Page 36 of 40

Appendix 1 Explanatory notes: The forecast model overestimates pupil numbers in schools with a high proportion of out of catchment area
children. A review of pupil distribution between Andover Town and rural areas will be undertaken to inform future school
place planning across both areas.
Planned significant housing developments in area: None known
County Council Programmed School Expansions 2013-16 No planned expansions
Local areas under review: Shipton Bellinger
Page 37 of 40

Appendix 1
WINCHESTERWith regard to major developments in Winchester, the Barton Farm development for 2000 new homes is under discussion. The impact of this development will be dealt with by the building of a new primary school within Barton Farm and an expansion of Henry Beaufort School. Timing for the development is yet to be confirmed but it is anticipated that the new homes will begin to be built late 2014 or early 2015. The primary school for the development is to be available for pupils for the September 2016 intake. Winchester are also proposing to bring forward up to 3,500 new houses in North Whiteley. This will require 2 new primary schools and a strategic need for a new secondary school. Across Winchester City Council there are 3,850 new houses planned of which 1,705 will be within the town. Details of confirmed housing allocations in the Local Plan are awaited.
Winchester Town – Primary Planning Area 8500037 / Secondary Planning Area 8500058
Key data:
October 2013 Forecast 2018Number of Infant/Primary/Junior Schools: 10 12Total Planning Area Primary Age Capacity: 2924 4185Total Planning Area Primary Age Number on Roll: 2944 3213% Surplus Capacity -1%* 24%Total Planning Area Year R PAN 421 595Total Planning Area Year R Intake 420 431% Intake Year Surplus 0% 24%
October 2013 Forecast 2018Number of Secondary Schools: 4 4Total Planning Area School Capacity: 4816 4966Total Planning Area Number on Roll: 4831 5418% Surplus Capacity 0% -9%Total Planning Area Year 7 PAN 871 1011Total Planning Area Year 7 Intake 974 1174% Intake Year Surplus 1% -16%*
*See explanatory notes below
Explanatory notes: For the 2013 YR intake additional places were made available at St Peters RCA Primary School Winchester City is experiencing a considerable growth in pupil numbers seeking a school place. Consequently,
following public consultation, Hampshire County Council is expanding a number of city schools to cope with this pupil growth. The forecast number for 2018 for the primary sector excludes most of the Barton Farm development although the capacity for the Barton Farm development (3FE primary) is shown in the forecast YR PAN.
Winchester Secondary Schools attract significant numbers of pupils from out-of catchment. The secondary schools, with a 1FE expansion at Henry Beaufort, will be able to cater for local children.
Planned significant housing developments in area: Barton Farm, 2000 dwellings starting in 2014
County Council Programmed School Expansions 2013-16: Harestock Primary School – 10 additional places Winnall Primary School – 48 additional places Western CE Primary School – 60 additional temporary places St Peters Catholic Primary School – 0.5 form entry expansion All Saints CE Primary School – 48 additional places Westgate Primary School – new 2 form entry primary school Barton Farm – new 3 form entry primary school
Local areas under review: None
Page 38 of 40

Appendix 1 Bishops Waltham – Primary Planning Area 8500038 / Secondary Planning Area 8500059
Key data:
October 2013 Forecast 2018Number of Infant/Primary/Junior Schools: 9 9Total Planning Area Primary Age Capacity: 1820 1820Total Planning Area Primary Age Number on Roll: 1704 1713% Surplus Capacity 6% 6%Total Planning Area Year R PAN 279 279Total Planning Area Year R Intake 236 257% Intake Year Surplus 15% 8%
October 2013 Forecast 2018Number of Secondary Schools: 1 1Total Planning Area School Capacity: 1350 1350Total Planning Area Number on Roll: 1210 1226% Surplus Capacity 10% 9%Total Planning Area Year 7 PAN 270 270Total Planning Area Year 7 Intake 238 232% Intake Year Surplus 12% 14%
Explanatory notes: The number of Year R pupils living in the catchment area of the schools that make up this part of the Winchester
District are less than the number of Year R places available across the schools.
Planned significant housing developments in area: None known
County Council Programmed School Expansions 2013-16 No planned expansions
Local areas under review: Bishops Waltham Wickham Shedfield Swanmore
Winchester Rural – Primary Planning Area 8500067
Key data:
October 2013 Forecast 2018Number of Infant/Primary/Junior Schools: 10 10Total Planning Area Primary Age Capacity: 1852 1947Total Planning Area Primary Age Number on Roll: 1769 1966% Surplus Capacity 4% -1%*Total Planning Area Year R PAN 274 279Total Planning Area Year R Intake 281 301% Intake Year Surplus -3%* -8%*
*See explanatory notes below
Explanatory notes: For the 2013 YR intake additional temporary places were provided at Twyford Primary School.
Page 39 of 40

Appendix 1 Winchester Rural area is experiencing a growth in pupil numbers seeking a school place. Each planning
application for additional housing in this part of the county will be checked against the capacity of the schools and funding will be sought from developers to expand a school if the demand can be shown.
Forecast numbers across Winchester Rural show a shortfall of places in 2018. Discussions are underway to identify which of the rural schools may be expanded. In some cases it may be difficult to expand a school forecast to be under pressure owing to the size of the site it occupies. Where this is the case the possibility of acquiring additional land is under discussion.
Planned significant housing developments in area: None known.
County Council Programmed School Expansions 2013-16 Kings Worthy Primary School – 50 additional places Colden Common Primary School – 45 additional places Twyford St Marys Primary School – 30 additional temporary places
Local areas under review: Colden Common Kings Worthy
Page 40 of 40