Embed Size (px)
Citation preview
Title: The relationship between primary care funding, secondary care utilisation and patient
outcomes.
Authors: L’Esperance V, academic clinical fellow1; Sutton M, professor of health economics2;
Schofield P, research fellow1; Round T, doctoral research fellow1; Malik U, academic clinical fellow1;
White P, clinical senior lecturer in primary care1; Ashworth M, reader in primary care1.
1. Department of Primary Care and Public Health Sciences, Division of Health and Social Care Research, King’s College London, Guy’s Campus, London SE1 1UL, UK
2. Division of Population Health, Health Services Research & Primary Care, University of Manchester, Manchester, M13 9PL, UK
Correspondence to: V L’Esperance: [email protected]
1
Abstract:
Background In international studies, greater investment in primary healthcare is associated with
improved population health outcomes.
Aim To determine whether investment in general practice is associated with secondary care
utilisation, patient satisfaction and clinical outcomes.
Design and setting Retrospective cross-sectional study of general practices in England, 2014/15.
Methods Practice level data were stratified into three groups according to GP contract type: national
General Medical Services (GMS) contracts, with or without the capitation supplement (termed,
‘Mean Practice Income Guarantee’), or local Personal Medical Services (PMS) contracts. Regression
models were used to explore associations between practice funding (capitation payments and
capitation supplements) and secondary care usage, patient satisfaction (General Practice Patient
Survey scores) and clinical outcomes (QOF scores). We conducted financial modelling to predict
secondary care cost savings associated with notional changes in primary care funding.
Results Mean capitation payments per patient: £69.82 in GMS practices in receipt of capitation
supplements (n=2784); £78.79 in GMS practices without capitation supplements (n=1672); £84.43 in
PMS practices (n=3022). Mean capitation supplement: £5.72 per patient. Financial modelling
demonstrated little or no relationship between capitation payments and secondary care costs. In
contrast, notional investment in capitation supplements was associated with modelled savings in
secondary care costs. The relationship between funding and patient satisfaction was inconsistent;
QOF performance was not associated with funding in any practice type.
Conclusions Capitation payments appear to be broadly aligned to patient need in terms of secondary
care usage. Supplements to the current capitation formula are associated with reduced secondary
care costs.
2
Key words primary care funding, general practice, secondary care utilisation
(Word count: 249; allowed word count, 250)
How this fit in
In international studies, greater investment in primary healthcare is associated with improved
population health outcomes and reduced secondary care usage. This is the first national study to
explore the relationship between core funding allocated to GP practices and objective measures of
practice outcomes including secondary care utilisation, patient satisfaction and clinical target
achievement. We found evidence that increased funding to practices in the form of capitation
supplements was associated with lower levels of secondary care utilisation. Financial modelling has
been used to illustrate the potential savings in secondary care costs that might be associated with
additional investment in capitation funding. Findings related to core funding and patient satisfaction
were mixed; there was no relationship with clinical target achievement.
3

Introduction
Primary care is often described as the cornerstone of a strong healthcare system. Starfield(1)
demonstrated across a wide range of international settings that greater investment in primary
healthcare is associated with improved population health outcomes, reduced secondary care usage
and reduced overall health costs.(1-4) In spite of this evidence, funding for primary care in England
has reduced by 6% in real terms, 2005/6 to 2013/14;(5) over the same period overall workload has
increased by 16%.(6) In contrast, real term secondary care funding has increased by 2% per annum.
(7)
International studies of funding in primary care and outcomes have been hampered by lack of
nationally comparable practice level funding data. In England, general practice funding consists of
several components (Figure 1), the largest of which are capitation based payments, weighted
according to factors affecting general practitioner (GP) workload such as the proportion of elderly
patients or reported prevalence of long term limiting illness.(8, 9). In early 2015, the UK Department
of Health released the first national summary of general practice funding data, with the promise of
further details in future years, including summaries of GP earnings.(10) To date, no country outside
the UK has released similar funding data. We aimed to use these data to explore the association
between funding and outcomes. Firstly, we wanted to investigate whether the association seen in
international studies between investment in primary care and lower secondary care costs applied at
a national level in England.(1) Our secondary aim was to determine the association between primary
care investment, patient satisfaction and achievement of Quality and Outcomes Framework (QOF)
targets.(11, 12) Finally, we aimed to use financial modelling in order to quantify the relationship
between notional increases in primary care funding and modelled changes in secondary care costs.
(13)
Methods
4
Study design
A retrospective cross-sectional study was conducted using practice-level data for the 2014/15
financial year. In order to adjust for confounding, we obtained practice and demographic
characteristics.
Practice data
Descriptive data for all general practices in England were obtained from the General and Personal
Medical Services database.(14) Variables which we considered to be associated with practice
achievement and funding were obtained (Table 1). We included Index of Multiple Deprivation (IMD-
2015) deprivation data, calculated using patient data attributed to Lower Layer Super Output Areas
(LLSOAs); similarly, we included ethnicity data derived from the 2011 national census and allocated
to LLSOAs. (15, 16)
Secondary care outcomes
We obtained data for the year 2014/15 for emergency hospital admissions, hospital admissions for
Ambulatory Care Sensitive Conditions (ACSCs), Accident and Emergency (A&E) attendances and Out-
Patient attendances from Hospital Episode Statistics, a national database of NHS secondary care
activity.(17)
General Practice Patient Survey (GPPS)
The GPPS is an annual survey of patient satisfaction sent to a nationally representative sample of
patients registered at all general practices in England, with findings reported at practice level. GPPS
unweighted data were obtained for the 2014 calendar year; weighted data were not used because
our analysis adjusted for demographic variables.(18)
5
During 2014, 2.6 million questionnaires were distributed, with an overall response rate of 32.5%
(858,381 completed responses). This study focussed on responses to the question asking about
‘overall satisfaction’ with the general practice (Question 28). Responses were scored according to
the percentage of patients reporting the most positive of available responses (a ‘very good’
experience).
QOF data
We obtained data from the national QOF dataset covering the financial year, 2014/15. For our
analysis, we used the total QOF score for each practice. This score is based on achievement of a
series of both process and outcome targets relating to long term condition management and public
health targets.(19)
General practice funding data
We calculated the 2014/15 capitation payment for each practice as ££ per registered patient. We
defined three different types of practice in England according to the method of allocating capitation
payments: practices with a national contract (termed ‘General Medical Services’, or ‘GMS’, practices)
which receive capitation payments weighted according to a needs-based formula (20); GMS
practices with a national contract which in addition to their weighted capitation payment receive a
capitation supplement based on higher historical budget allocations (termed ‘Mean Practice Income
Guarantee’ or ‘MPIG’ payments) (21); practices with a locally negotiated contract (termed ‘Personal
Medical Services’ or ‘PMS’ practices). A fourth type of practice contract, termed ‘Alternative
Personal Medical Services’ or ‘APMS’, was excluded from our analysis because we considered that
these short term contracts may have distorted the relationship between funding and outcomes. We
analysed capitation payments and capitation supplements separately, in order to determine the
relative effects of each type of capitation funding.
6
Participants
We linked practice (n=7767) with GPPS data (n=7607 practices) and excluded atypical practices with
<750 registered patients (n=19), or those with <500 patients (n=22 practices) or > 5000 (n=129
practices) per full-time equivalent GP following a previously used method.(22)
Statistical analysis
Univariable analysis was used to identify differences between the three types of general practices
included in our study. Linear regression models were used to explore the association between
practice funding, adjusted for confounders, and the following outcome variables: secondary care
usage, patient satisfaction and QOF achievement (Table 2). Non-normality of outcomes was
addressed by re-checking regression models following logit transformation to normalise the
distribution. For the QOF analysis, where scores clearly depart from a normal distribution, we
repeated the analysis using a logit transformed score following the method used previously. (23) This
made no appreciable difference to the results therefore the un-transformed coefficients are
presented here. Model assumptions were tested graphically using Q-Q and P-P plots to test for
normality of the residuals.
Mean funding per patient was entered into the regression models as a predictor variable. Other
predictor variables included in the models are shown in Table 2. Funding outliers were removed by
excluding the highest and lowest funded 2% of practices; further sensitivity analysis was conducted
by excluding 1% outliers. Multicollinearity was tested using the Variance Inflation Factor (VIF) and
variables with a value for VIF>10 were excluded. We accounted for local area effects by adjusting for
clustering at Clinical Commissioning Group (CCG) level. STATA software version 14 (StataCorp,
College Station, Texas) was used for all statistical analysis.
7
For the financial modelling, we estimated the effects of a notional 10% increase in capitation
funding, or a 100% increase in capitation supplement funding, on the secondary care outcome
measures. The higher percentage increase in capitation supplement was chosen for our model since
their value per patient is much smaller than for capitation funding. We obtained secondary care
costs using the Department of Health reference unit costs for the 2014-2015 financial year. (24)
Regression coefficients were used to estimate the change in secondary care utilisation rates
assuming a notional percentage increases in capitation or capitation supplement funding; these
changes were converted into estimates of primary care costs and projected secondary care savings.
A worked example is given at the end of Table 3. Data on ACSC hospital admissions were excluded
from the modelling assumptions to avoid double counting because ACSC admission costs may have
contributed to emergency hospital admission costs.
Results
Following exclusions, the final sample consisted of 7478 practices (96.1% of all practices in England).
Of these, 4456 (59.6%) practices held GMS contracts (2784 (37.2%) practices received capitation
supplements; 1672 (22.4%) did not receive capitation supplements); 3022 (40.4%) of practices held
PMS contracts; Table 1 describes the main characteristics of general practices included in the study,
their registered populations, and demographic features.
The mean funding per patient in GMS practices in receipt of the capitation supplement was £69.82
with an additional £5.72 for the capitation supplement (total, £75.54); £78.79 in GMS practices with
no capitation supplement; £84.43 in PMS practices. The models linking funding and outcomes for
different practice funding types are illustrated in Table 2.
Secondary care utilisation was not associated or only weakly associated with capitation funding in
the three types of practices included in our study (Table 2). In contrast, capitation supplements were
8
significantly associated with secondary care utilisation: higher levels of capitation supplement were
associated with reduced A&E attendances (P=0.04), reduced emergency admissions (P<0.001) and
reduced ACSC admissions (P=0.01).
Patient satisfaction was not consistently associated with funding; QOF performance was not
associated with funding in any of the models (Table 2).
The financial models are summarised in Table 3. The models only apply to secondary care usage and
exclude all non-significant values on regression modelling (see Table 2). The only model with
substantial savings was based on a notional 100% increase in capitation supplements. This resulted
in an additional cost of £5720 in capitation supplements per 1000 registered patients which was
offset by modelled secondary care savings of £6280, representing a saving of 110% of the notional
investment in capitation supplements. Much smaller notional savings in out-patient attendance
were observed in the only other model which fulfilled the modelling criteria (see Table 2).
Practices in receipt of capitation supplements differed from practices not receiving supplements.
They had lower weighted capitation payments (Table 2) which was the result of lower Carr-Hill
weightings.(20) In particular, these practices had fewer registered patients aged ≥75 years (7.69%,
compared to 8.41% in GMS practices without MPIG; t=-7.35; P<0.001), fewer with limiting long term
illness (index values of 95.8 and 110.4, respectively; t=-22.74; P<0.001) and lower levels of
deprivation (IMD-2015 values of 22.52 and 30.38, respectively; t=-14.87; P<0.001).
Sensitivity analyses
We repeated the analysis excluding the 1% outliers and obtained almost identical results in terms of
the strength and significance of the relationship between funding and each included outcome. We
also repeated our analysis on the 2013/14 dataset, the first year for which funding data was
9
released. Although much data were missing in this sample, we found similar strength and
significance of relationship between funding and outcomes.(25)
Discussion:
Summary
Of the three models of general practice included in our study, only practices in receipt of capitation
supplements (MPIG payments) demonstrated a clear association between higher levels of funding
and reduced secondary care utilisation; in these practices, it was additional capitation supplements
rather than additional capitation payments which were associated with reduced secondary care use.
When applied to practices in receipt of capitation supplements, modelled secondary care savings
exceeded the notional cost of additional investment in capitation payments. Practices in receipt of
capitation supplements differed from other practices. They had lower weighted capitation
payments, indicative of lower ‘needs-based’ funding, a function of a younger healthier population
situated in more prosperous areas and the likely explanation for lower baseline secondary care
utilisation values. These practices had been protected from financial loss through receipt of
capitation supplements following the introduction of the 2004 GP Contract.(26)
In PMS practices, we found no evidence that additional investment was associated with any of the
outcomes included in our study. PMS practices have additional locally based clinical targets as part
of their contract which we were unable to study, reduction of secondary care usage was not one of
the stated goals of PMS practices (27) and additional funding may have been redirected to local
target achievement; alternatively, better funded PMS practices may have reached a funding level
where additional funding failed to release further secondary care savings. Differences in baseline
secondary care utilisation did not appear to provide an explanation because unadjusted utilisation
rates were higher in PMS practices whereas the largest modelled reductions in utilisation were
found in practices with lower baseline utilisation. The lack of association between funding and
10
reported patient satisfaction is unexpected; the alignment between PMS practice funding and the
need to address local priorities could have been expected to translate into higher satisfaction.
Financial modelling has demonstrated a divergence, in terms of secondary care usage, between
modelled increases in capitation payments (in GMS and PMS practices) and capitation supplements
(in GMS practices). We hypothesise that capitation funding is broadly allocated according to patient
need.(20) Increased capitation funding would therefore be directed toward the additional demands
of patients with greater need for primary care services, thus negating any possible reduction in
secondary care utilisation. In contrast, the MPIG acts as a supplement to the capitation payment
based on historical funding rather than an assessment of healthcare needs and is available as
additional primary care investment. For practices in receipt of capitation supplements, modelled
savings indicate that these supplements are cost effective in terms of secondary care savings.
Modelled savings are likely to have been underestimated since ACSC admissions had to be excluded
from the model and may have made a further contribution to savings. We hypothesise that
capitation supplements are invested in primary care activity and staff, increasing the capacity of
primary care and correspondingly reducing demand on secondary care.(28)
Associations were either absent or weak between practice funding and outpatient attendance.
Although additional funding might allow the practice more time for elective work, other studies have
reported that investment in additional specialist training did not reduce outpatient referrals.(29)
Similarly, no association was found between additional capitation based funding and QOF
performance, probably because QOF as an incentive scheme is separately funded (Figure 1).
Although difficult to cost, and not part of our financial modelling, we found some evidence linking
additional funding in GMS practices with higher patient reported satisfaction.
11
Strengths and limitations
Our study is the first to explore the relationship between practice level funding and secondary care
usage. We have been able to estimate values for modelled savings and the implication that
supplements to capitation payments are invested in supporting the management of patients in
primary care who might otherwise have required emergency care or hospitalisation. A variety of
sensitivity analyses included in our methodology have confirmed the robustness of our regression
modelling.
As with all observational studies, significant associations, even if large, may not be causal. We
included a wide range of potential confounders in our models although residual confounding cannot
be excluded. There may be other reasons why practices in receipt of MPIG payments demonstrated
higher potential secondary care savings in our models. Prior to 2004, these practices had higher
income levels than GMS practices not in receipt of this supplement, and at that time practices with
higher income were more likely to have been innovative practices investing more in staff, extra
services and equipment, particularly in more deprived areas, thereby producing better outcomes.
(30, 31) Findings in these practices, although they represent a majority of GMS practices, may not
generalise to other practices. Finally, our findings relate to capitation based payments and
supplements which only account for 55% of practice funding; further study is needed on the
relationship between other funding sources and measurable primary care outcomes.
Comparison with existing literature
Recent work in Scotland has shown a mismatch between primary care funding and clinical need,
providing further evidence of the inverse care law.(32) Similarly, GP payments in England have been
found to correlate negatively with some healthcare need predictors such as deprivation, non-white
ethnicity and multi-morbidity.(33) However, neither study included secondary care outcomes or
12
financial modelling in their analyses. An observational study examining the relationship between
funding, contract status and QOF score in general practices care found that GMS practices were the
most efficient, achieving higher QOF scores with less funding.(34) However, the authors did not
report on the role of MPIG payments in their findings and the study sample was limited to 164
practices. In contrast, our national dataset did not show a relationship between GP funding and QOF.
Given the long term trend for transferring care out of hospitals into the community and the lack of
real increases in general practice capitation funding, more studies are needed on the consequences
of these shifts in the locus of care.
Implications for research and/or practice
There is increasing acceptance from UK policy makers that primary care requires a larger share of
healthcare funding.(35, 36) However, more detailed models are required to guide investment
decisions based on economic efficiency. This study provides new evidence that primary care
investment could translate into reductions in secondary care costs although longitudinal evaluation
would offer stronger evidence of a causal relationships. Our findings suggest that capitation
payments are broadly aligned to patient need, at least in terms of secondary care usage. However,
supplements to the current capitation formula may produce a reduction in secondary care costs. If
our findings are borne out by further studies, proposed reductions in capitation supplements may be
counterproductive.
Word count: 2710
13
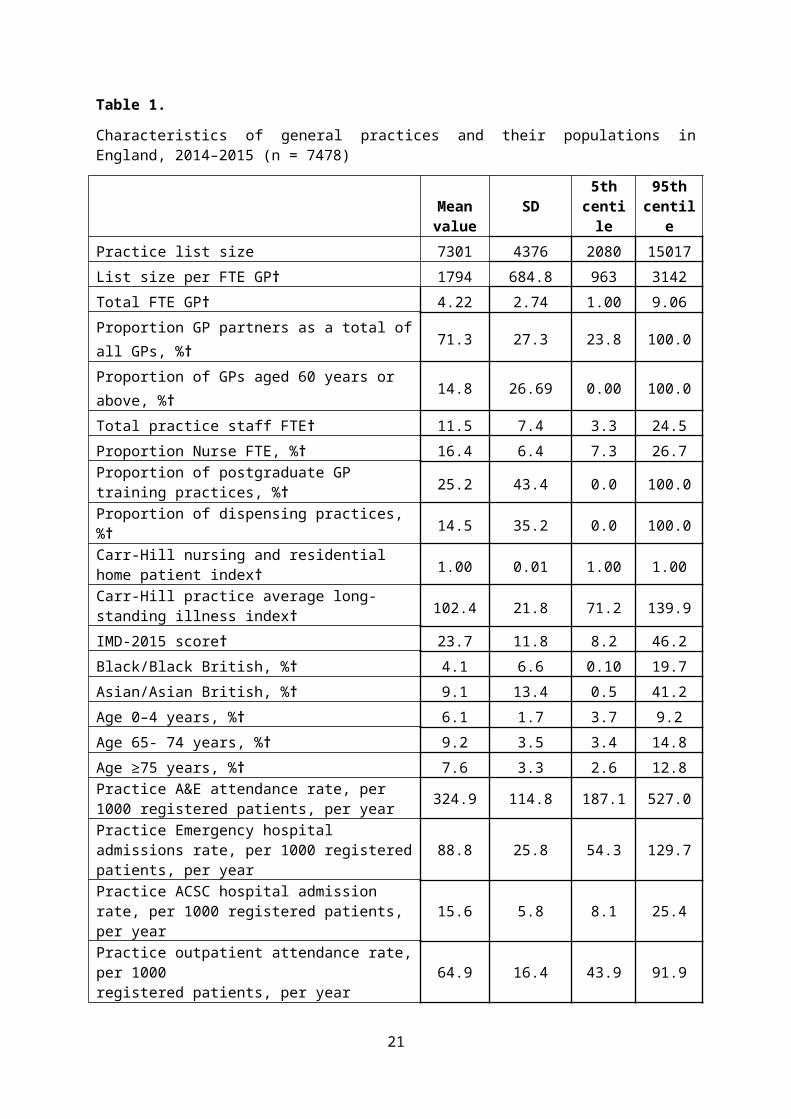
Table 1.
Characteristics of general practices and their populations in England, 2014–2015 (n = 7478)
Mean value
SD5th
centile95th
centile
Practice list size 7301 4376 2080 15017
List size per FTE GP† 1794 684.8 963 3142
Total FTE GP† 4.22 2.74 1.00 9.06
Proportion GP partners as a total of all GPs, %† 71.3 27.3 23.8 100.0
Proportion of GPs aged 60 years or above, %† 14.8 26.69 0.00 100.0
Total practice staff FTE† 11.5 7.4 3.3 24.5
Proportion Nurse FTE, %† 16.4 6.4 7.3 26.7Proportion of postgraduate GP training practices, %† 25.2 43.4 0.0 100.0Proportion of dispensing practices, %† 14.5 35.2 0.0 100.0Carr-Hill nursing and residential home patient index† 1.00 0.01 1.00 1.00Carr-Hill practice average long-standing illness index† 102.4 21.8 71.2 139.9
IMD-2015 score† 23.7 11.8 8.2 46.2
Black/Black British, %† 4.1 6.6 0.10 19.7
Asian/Asian British, %† 9.1 13.4 0.5 41.2
Age 0–4 years, %† 6.1 1.7 3.7 9.2
Age 65- 74 years, %† 9.2 3.5 3.4 14.8
Age ≥75 years, %† 7.6 3.3 2.6 12.8Practice A&E attendance rate, per 1000 registered patients, per year 324.9 114.8 187.1 527.0
Practice Emergency hospital admissions rate, per 1000 registered patients, per year 88.8 25.8 54.3 129.7
Practice ACSC hospital admission rate, per 1000 registered patients, per year 15.6 5.8 8.1 25.4
Practice outpatient attendance rate, per 1000registered patients, per year 64.9 16.4 43.9 91.9
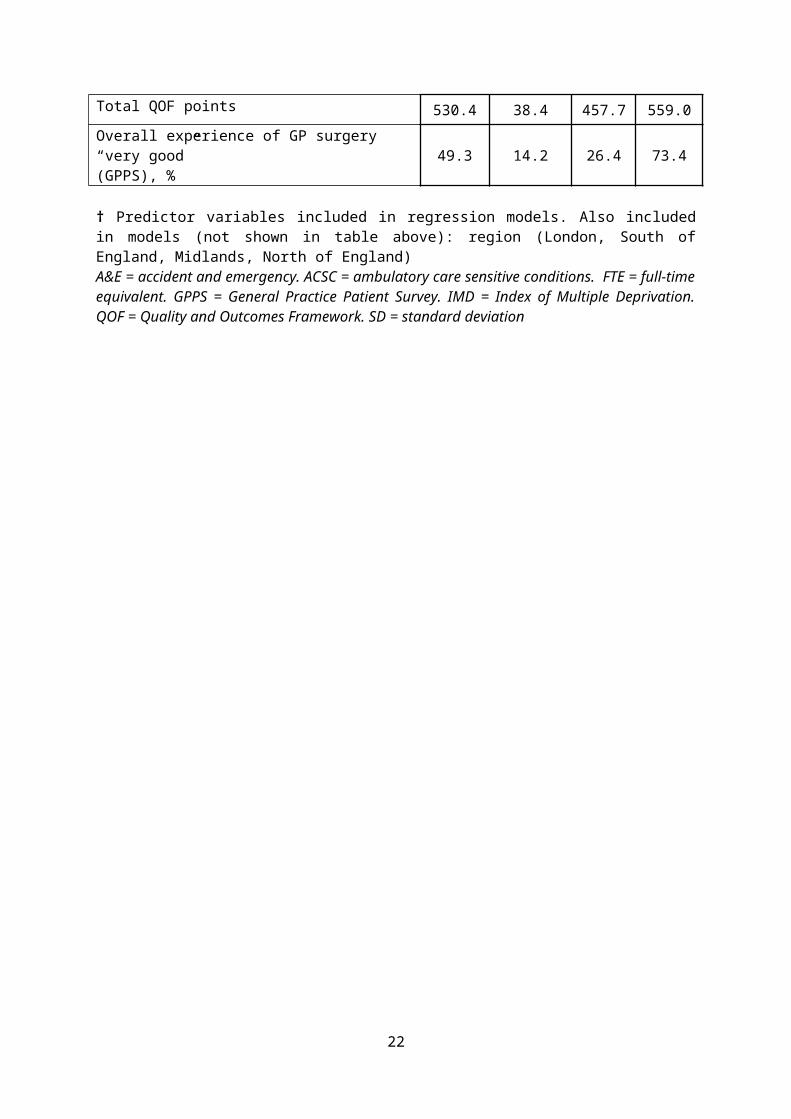
Total QOF points 530.4 38.4 457.7 559.0
Overall experience of GP surgery “very good”(GPPS), % 49.3 14.2 26.4 73.4
† Predictor variables included in regression models. Also included in models (not shown in table above): region (London, South of England, Midlands, North of England)A&E = accident and emergency. ACSC = ambulatory care sensitive conditions. FTE = full-time equivalent. GPPS = General Practice Patient Survey. IMD = Index of Multiple Deprivation. QOF = Quality and Outcomes Framework. SD = standard deviation
14
Table 2. The relation between practice funding types and secondary care utilisation, patient satisfaction and QOF scores: multivariable regression models.
Practice funding types and outcomesMean value
Mean cost per patient
(5th, 95th centile
Multivariable regression models: funding (££ per patient) as the predictor
variable of interestr2 B 95% CI P
GMS practices, no MPIG (n=1607)values for capitation funding
£78.79(66.17, 106.42)
A&E attendance per 1000 regd patients 354.2 0.36 -0.35 -1.08, 0.38 0.30Emerg admissions per 1000 regd patients 97.9 0.48 -0.04 -0.13, 0.05 0.34ACSC admissions per 1000 regd patients 17.5 0.46 -0.02 -0.04, 0.00 0.19OP attendances per 1000 regd patients 67.7 0.14 0.09 0.01, 0.17 0.03*
QOF total 527.8 0.09 -0.02 -0.17, 0.14 0.85Patient satisfaction (very good, %) 48.8 0.31 0.09 0.04, 0.14 <0.01**
GMS practices, with MPIG (n=2726)values for capitation funding
£69.82(60.72, 79.36)
A&E attendance per 1000 regd patients 298.7 0.42 -0.59 -2.00, 0.82 0.41Emerg admissions per 1000 regd patients 83.0 0.45 -0.02 -0.28, 0.24 0.87ACSC admissions per 1000 regd patients 14.2 0.44 0.63 -0.04, 0.05 0.79OP attendances per 1000 regd patients 63.7 0.06 0.19 -0.12, 0.50 0.22QOF total 531.6 0.09 0.33 -0.18, 0.84 0.20Patient satisfaction (very good, %) 50.6 0.28 0.00 0.00, 0.00 <0.001***
GMS practices, with MPIG (n=2726)values for capitation supplement
£5.72(0.67, 15.02)
A&E attendance per 1000 regd patients 298.7 0.43 -0.99 -1.94, -0.05 0.04*Emerg admissions per 1000 regd patients 83.0 0.48 -0.33 -0.49, -0.17 <0.001***
ACSC admissions per 1000 regd patients 14.2 0.46 -0.05 -0.09, -0.01 0.01**
OP attendances per 1000 regd patients 63.7 0.08 -0.23 -0.48, 0.03 0.08QOF total 531.6 0.08 -0.17 -0.56, 0.22 0.4Patient satisfaction (very good, %) 50.6 0.27 0.08 -0.07, 0.08 0.83
PMS practices (n=2834)values for capitation funding
£84.43(66.68, 107.09)
A&E attendance per 1000 regd patients 331.9 0.35 0.81 -0.07, 1.70 0.07Emerg admissions per 1000 regd patients 89.0 0.52 -0.51 -0.17, 0.06 0.38ACSC admissions per 1000 regd patients 15.8 0.52 0.07 -0.20, 0.07 0.32OP attendances per 1000 regd patients 64.1 0.15 -0.09 -0.23, 0.06 0.23QOF total 531.3 0.10 0.04 -0.09, 0.17 0.5Patient satisfaction (very good, %) 48.4 0.44 0.04 -0.09, 0.17 0.56
15
*P≤0.05; **P≤0.01; ***P≤0.001. All P values relate to the significance of the regression coefficients, B.
r2 values show the proportion of variation in the outcome that can be explained by the model predictors
All attendance and admission rates are mean values, per year.
Emerg admissions = Emergency hospital admissions. ACSC admissions = Ambulatory Care Sensitive Condition hospital admissions. OP attendances = Out-Patient attendances. QOF = Quality and Outcomes Framework. Patient satisfaction (very good, %) = Overall experience of GP surgery “very good”, %, as reported on the General Practice Patient Survey
16
Table 3. Financial modelling showing the relationship between modelled changes in practice funding and secondary care costs.
NB Modelling was only conducted if regression model coefficients were significant, P<0.05 (see Table 2)
*financial modelling based on 10% increase in capitation payments
**financial modelling based on 100% increase in capitation supplement
17
Practice funding type Outcome significantly associated with capitation funding
Cost of notional increase in capitation funding, per 1000 regd patients
Modelled savings in secondary care costs associated with notional increase in capitation funding
Modelled secondary care savings: savings as a % of notional investment in primary care †
GMS practices,no MPIG
Out-patient attendances per 1000 registered patients/year
£7879* £94* 1.2%
GMS practices,with MPIG;values for capitation funding only
n/a £6982* n/a n/a
GMS practices,with MPIG;values for capitation supplement (MPIG) only
A&E attendance per 1000 regd patients
£5720** £747** 110.0%
Emerg admissions per 1000 registered patients/year
£5531**
Total: £6278**
PMS practices n/a £8,443* n/a n/a
† Worked example:
For the practice sample, ‘GMS practices, no MPIG’:
The cost of a notional 10% change in secondary care utilisation is calculated as follows:
10% x £78.79 (mean capitation payment per registered patient) x 0.09 (B coefficient from regression model) x £132.00 (Out-Patient attendance per patient, reference cost)
= £93.60 (or £94, to nearest whole number)
The modelled saving is calculated as follows:
£93.60 (cost of modelled saving in secondary care utilisation) x100 ÷ £7879 (Cost of notional 10% increase in general practice capitation funding)
= 1.2%
18
Figure 1.
NHS Payments to General Practices in England for 2014/15
Capitation payment (includ-ing capitation supplement)
55%
QOF9%
Enhanced services10%
Prescribing payments10%
Other payments16%
19

Contributors: VL, MA contributed to the idea and design of the study. VL and MA analysed the data.
MS advised on financial modelling. PS advised on statistical analysis. VL and MA drafted the paper.
All authors contributed to and approved the final draft. MA is the guarantor.
Funding: This study received no specific funding.
Ethical approval: Not required
Competing interests: All authors completed the ICMJE uniform disclosure form
at www.icmje.org/coi_disclosure.pdfand declare: no support from any organisation for the
submitted work; no financial relationships with any organisations that might have an interest in the
submitted work in the previous three years; no other relationships or activities that could appear to
have influenced the submitted work.
20
References
1. Starfield B, Shi L, Macinko J. Contribution of primary care to health systems and health. Milbank Q. 2005;83(3):457-502.
2. Shi L, Macinko J, Starfield B, et al. The Relationship between Primary Care, Income Inequality, and Mortality in the United States, 1980–1995. J Am Board Fam Med. 2003;16:412–22.
3. Jarman B, Gault S, Alves B, et al. Explaining Differences in English Hospital Death Rates Using Routinely Collected Data. BMJ.1999;318:1515–20.
4. Gravelle H, Morris S, Sutton M. Are Family Physicians Good for You? Endogenous Doctor Supply and Individual Health. Health Serv. Res. 2008;43(4):1128-44.
5. Appleby J. Is general practice in trouble? BMJ. 2014;349.6. Hobbs FDR, Bankhead C, Mukhtar T, et al. Clinical workload in UK primary care: a
retrospective analysis of 100 million consultations in England, 2007–14. Lancet. 2016;387:2323–30.
7. Charlesworth A. NHS Finances – The challenge all political parties need to face. The Health Foundation; 2015.
8. Addicott R, Ham C. Commissioning and funding general practice: Making the case for family care networks. Kings Fund; 2014.
9. British Medical Association. Focus on the global sum allocation formula (Carr-Hill Formula): British Medical Association; 2015.
10. Health and Social Care Information Centre. NHS Payments to General Practice, England, 2013-14: Experimental Statistics – Report. Available from: http://www.hscic.gov.uk/catalogue/PUB16847/nhspaymentsgp-13-14-rep.docx
11. Houle S, McAlister F, Jackevicius C, et al. Does performance-based remuneration for individual health care practitioners affect patient care? A systematic review. Ann Intern Med. 2012; 157(12 ):889–99
12. Scott A, Sivey P, Ouakrim DA, et al. The effect of financial incentives on the quality of health care provided by primary care physicians. Cochrane Database Syst Rev.2011;9
13. Goetzel R, Ozminkowski R, Villagra V, Duffy J. Return on Investment in Disease Management: A Review. Health Care Financ Rev. 2005;26(4):1-19.
14. Health and Social Care Information Centre. General and Personal Medical Services, England 2005-2015, as at 30 September, Provisional Experimental statistics 2016. Available from: http://digital.nhs.uk/catalogue/PUB20503.
15. Department for Communities and Local Government. English indices of deprivation 2015. Department for Communities and Local Government;2015.
16. Office of National Statistics. 2011 Census: Office for National Statistics; 2011. Available from: https://www.ons.gov.uk/census/2011census.
17. Health and Social Care Information Centre. Hospital Episode Statistics; 2015. Available from: http://www.hscic.gov.uk/hes
18. NHS England. The GP Patient Survey. NHS England; 2015 19. Health and Social Care Information Centre. QOF 2014/15 results. 201520. NHS Employers. Carr-Hill resource allocation formula NHS Employers, 200421. Heins E, Parry R. The role of wage bargaining partners in public sector reform: The case of
primary care contracts. Eur J In. Rel. 2011;17(4)
21
22. Ashworth M, Schofield P, Durbaba S, Ahluwalia S. Patient experience and the role of postgraduate GP training: a cross-sectional analysis of national Patient Survey data in England. BJGP. 2014;64(620):168-77
23. Ashworth M, Armstrong D. The relationship between general practice characteristics and quality of care: a national survey of quality indicators used in the UK Quality and Outcomes Framework, 2004–5. BMC Fam Pract.2006;7:68
24. Department of Health. National schedule of reference costs: the main schedule. Department of Health; 2015 Available from: https://www.gov.uk/government/uploads/system/uploads/attachment_data/file/480791/2014-15_National_Schedules.xlsx
25. L'Esperance V, Parkin D, Durbaba S, Ashworth M. A cross-sectional study exploring the relationship between GP practice funding and practice achievement. Society of Academic Primary Care. Dublin;2016
26. The National Health Service (General Medical Services Contracts) Regulations. 200427. Department of Health. Sustaining Innovation through New PMS Arrangements. 200428. Gulliford MC. Availability of primary care doctors and population health in England: is there
an association? J Public Health Med. 2002;24(4):252-429. Rosen R, Jones R, Tomlin Z, Cavanagh M. Evaluation of General Practitioners with Special
Interests: Access, Cost Evaluation and Satisfaction with Services London: National Coordinating Centre for the Service Delivery and Organisation; 2006.
30. Leese B, Bosanquet N. Family doctors and change in practice strategy since 1986.BMJ. 1995.310(6981):705-8
31. Rhys G, Beerstecher HJ, Morgan CL.Primary care capitation payments in the UK. An observational study. BMC Health Serv Res. 2010;10:156
32. McLean G, Guthrie B, Mercer S, Watt G. General practice funding underpins the persistence of the inverse care law: cross-sectional study in Scotland. BJGP. 2015; 65(641):799-805.
33. Levene L, Baker R, Wilson A, et al. Population health needs as predictors of variations in NHS practice payments: a cross-sectional study of English general practices in 2013–2014 and 2014–2015. BJGP. 2016;67(654):e10-e9.Morgan CL, Beerstecher HJ. Primary care funding, contract status, and outcomes: an observational study. BJGP. 2006;56(532):825-9.
34. Morgan C, Beerstecher H. Primary care funding, contract status, and outcomes: an observational study. BJGP. 2006;56(532):825-9.
35. Roland M, Everington S. Tackling the crisis in general practice. BMJ. 2016;352.36. NHS England. General Practice Five year Forward View. Leeds: NHS England, 2016.
22