Embed Size (px)
Citation preview
ESSnet Big Data
S p e c i fi c G r a n t A g r e e m e n t N o 2 ( S G A - 2 )h tt p s : / / w e b g a t e . e c . e u r o p a . e u / f p fi s / m w i k i s / e s s n e t b i g d a t ah tt p : / / w w w . c r o s - p o r t a l . e u /
Framework Partnership Agreement Number 11104.2015.006-2015.720
Specific Grant Agreement Number 11104.2016.010-2016.756
Del iv erab le 4 .8
Cons o l i date d re port on pro ject re s u l ts inc lud ing a cos t -bene fi t ana ly s i s o f us i ng A I S-dat a f or offi cia l s tati s ticsVersion 2018-04-25
ESSnet co-ordinator:
Peter Struijs (CBS, Netherlands)[email protected] : +31 45 570 7441Mobile phone : +31 6 5248 7775
1
Prepared by: Anke Consten (CBS, Netherlands)Marco Puts (CBS, Netherlands)
Tessa de Wit (CBS, Netherlands)Eleni Bisioti (ELSTAT, Greece)
Christina Pierrakou (ELSTAT, Greece)Anna Bilska (GUS, Poland)Michal Bis (GUS, Poland)
Øyvind Langsrud (SSB, Norway)

IndexExecutive/management summary..........................................................................................................3
1. Introduction....................................................................................................................................7
2. Summary of contents and outcomes WP4......................................................................8
SGA-1..................................................................................................................................................8
SGA-2................................................................................................................................................14
3. Cost-benefit analysis of using AIS-data for official statistics..................................19
4. Sketch of a possible statistical process and needed infrastructure.....................29
5. Future work..................................................................................................................................33
6. References....................................................................................................................................35
Annex 1: SGA-1 of WP4 in more detail.................................................................................................36
Annex 2: SGA-2 original scope of WP4 in more detail..........................................................................39
Annex 3: SGA-2 adjusted scope of WP4 in more detail........................................................................42
Annex 4: exact questions posed in the expert questionnaire...............................................................45
2

Executive/management summaryIn this deliverable we present a summary of the work that was done in SGA-1 and SGA-2. We performed a cost-benefit analysis of using AIS data for official statistics, described a sketch of a possible statistical process and needed infrastructure. Finally we summarize ideas for future work.
Conclusions in this deliverable are based on several sources: the experience gained in this work package 4, a brainstorm session aimed at discussing scenario’s for production of European and national statistics, papers about AIS and the possible use of it, as well as opinions from maritime experts of several NSIs that responded to our expert questionnaire.
Summary of contents and outcomes in this work package
SGA-1: data access, handling and methodology
At the start of WP4 we decided to obtain European AIS data from Dirkzwager (DZ) and use the UNECE sandbox to process the data. All in NSI’s in this WP 4 had access to the sandbox. After the data was obtaining and decoded at Statistics Netherlands , it was transformed and uploaded to the sandbox and stored in the Hadoop Filesystem (HDFS).
We developed robust algorithms to handle the noise in the data.
We have also developed a method to build a reference frame of maritime ships. Using this reference frame of ships, we investigated the number of port visits for some ports, and compared this to data from maritime statistics. We concluded that the number of port visits is usually more accurate in the AIS data than in maritime statistics. We also developed an output-driven method to define a ship’s journey.
We investigated the quality of the DZ AIS data by comparing it to the national AIS data (unfiltered and untreated) of Denmark, Poland and Greece and to satellite data from Luxspace (LS). In almost all cases, national data contained (much) more data than DZ data: both in terms of coverage and number of messages per region. DZ misses data on complete areas in coastal Europe. Thus, for some ports, the visits and journeys cannot be analysed. If DZ data does cover a port, data is sufficient to determine the port visits. However, it is not always sufficient to determine ships’ journeys, especially in areas with a capricious geography. Our algorithm can deal with this, in terms of calculating the right number of journeys, but it will result in an underestimation of the calculated distances. The lower frequency of messages can also impact calculated traffic estimates and underestimate emissions. Some of DZ data is filtered depending on the data sources, but the exact nature of this filtering is not clear. Therefore, we are not satisfied with this filtering (or information on this filtering).
The satellite data from LS completely covers the Mediterranean Sea. However, satellite data structurally detects a lower number of ships per port compared to the high quality national data of Greece. Also, the number of data points per ship is lower. Both findings are probably due to the lower frequency/latency of receiving by satellites. However, satellite data is indispensable when it comes to following ships across oceans. Then the distance from the ship to the land receiver is too
3

large for the land receiver to still be able to pick up a signal from the ship. However, satellite data is less useful to perfectly model shipping routes in more complex areas.
During task 3 we performed four PoC’s. The outcomes are promising. The first PoC, on developing an algorithm to calculate the intra-port journey by using AIS data, succeeded. Intra-port travel distances can become a new statistical product. The second PoC, on using AIS data to define ports also succeeded: it is possible to build a data driven algorithm for defining ports. From the third PoC we conclude that next destination as reported by captains is not a usable variable compared to the observed next destination. We also conclude from this PoC that distance measures in time and space can be done. Other findings show that using a more concise model, like the one of Marine Traffic, could improve the calculation of ships’ travelled distances between ports. The current calculation used by Eurostat depends on a fixed distance matrix. However, this method does not take into account important factors known to influence the route of a ship, such as type of ship, weather and seasonal conditions. Finally, the last PoC showed that AIS data is also useful to gain insight into fluvio-maritime transport, since the extent of this transport mode is not always clear for every country. Focusing on fluvio-maritime journeys will also provide insight in the relationship between maritime and inland waterway transport Furthermore, it will contribute to knowledge on transit trade, traffic intensity, and emissions.
During task 3, we also investigated (by literaturestudies and stakeholder) how emissions from maritime ships can be determined using AIS data.When constructing emission statistics on maritime (and inland waterway) transport, Worldwide AIS data, a route generation algorithm, ship’s details, emission factors, an emission calculation algorithm and storage are indispensable. We investigated opportunities for efficiency gains. All in all, we think the analysis of AIS data for emission statistics eminently lends itself to process on a European level.
As developing such a method would take a big investment in terms of getting data, algorithms and storage, an intermediate step might already be possible. Stakeholders have expressed interest in two specific aspects that might be somewhat easier to obtain. Firstly, the Dutch department of National Accounts has expressed interest in getting the development of the distance travelled for Dutch-owned ships. Even European AIS data would be an enrichment of the current method. Secondly, the Dutch Pollutant Release and Transfer Register would be interested in getting information on average speeds over 100 meters for Dutch territory (mainly for inland waterway ships).
SGA-2: methodology and new statistical output
During task 5, we also generated some new ideas for statistical products. Some of them might turn out to be successful and some may not, but all are worth a try. From these new ideas the ideas of intra-port travel distances, a port-to-port distance matrix based on model estimating shipping routes and insights in effects of disruption or regulations are most promising to be implemented for the ESSnet as a whole, for example by using one standardised European AIS source and methodology.
One of the most promising ideas is using AIS data as a fast economic indicator, the holy grail in official statistics. Finding “fast” data sources that are closely related to economic development are crucial for creating these indicators. AIS could be one of the candidates as a proxy for international trade, signalling changes in maritime activity relating to international trade, and with that economic developments. Another aspect to be interesting for future research is the detection of anomalies in
4

the movements of ships. These anomalies could signal problems in the ports or (changed) regulations. Gaining insight into the effects of disruptions or (changed) regulations by means of AIS could also be useful.
All of these ideas of using AIS data for improving/new official statistics can be combined with powerful visualizations. These can provide more insight in the developments in transport and destinations of certain types of goods. It also facilitates comparisons on an international level and helps identifying patterns.
Cost-benefit analysis of using AIS for official statistics
Regarding sustainability, we foresee that AIS data, on both the transmitting side (ships) and receiving side (land-based stations and satellites), will be available for quite some time into the future, as it is part of the general security system for both maritime and inland shipping. Even if the mode of transmission might change (e.g. wifi instead of GPS). National data will probably remain freely available, as they are also used for other governmental ends. When using commercial data, which can provide a larger coverage, new arrangements would have to be made once in a while, asking for new negotiations that might pose some risk
Scenarios for producing national/European statistics based on AIS data
The analysis of AIS data for statistics eminently lends itself to process on a European level. Having every country determine the route of every ship (also entering other countries) would otherwise result in redundant processing. Therefore, to optimize efficiency on a European level, it would be advisable to perform calculations per (European-owned) ship and then aggregate this either to nationality of owner or to territory a ship traverses.
For future use, we advise to at least obtain European AIS data from EMSA. This has the big advantage that European statistics could be made and that all national statistics are comparable. The advantage of EMSA data compared to other European sources is that the EMSA data is free available and the coverage and frequency will be on the same level as the national AIS data. Also data access will be more sustainable compared to data from other commercial companies.
The only disadvantage of this scenario would be that there is no world coverage, so travel between countries cannot be followed. If there is sufficient funding, we would advise to use worldwide data, because then all ship journeys can be followed and a clearer picture of worldwide patterns can be analyzed.
We think Eurostat has an important role in decoding, cleaning and storing the European data in one central database and enables each NSI to query this database for their own national statistics. Another alternative could be that one of the NSI’s will take this role and provide a central European AIS data database. A promising alternative would be asking an external organization (like EMSA) to build an AIS reference architecture for ship transport from AIS data, based on a standardized journey approach with time stamps and location information. This architecture would represent microdata, from which we should be able to generate all statistics we are currently producing (+ we would like to produce in future).
Sketch of a possible statistical process and needed infrastructure
5
For collecting streaming data a failsafe infrastructure with backup functionality is needed. Batch data collection will stress the infrastructure less. However, making the collection periods longer the size of the data increases and so does the needed computational power for processing the data.
For AIS data we conclude that decoding the messages and encrypting the crucial fields can be done on a normal infrastructure. More complicated analysis, should be done on distributed environments like spark. Storage of the data should be done on high performance big data file systems.
During analysis, it is important to have a performant environment available, like Spark. The chosen environment must be able to integrate with analysis tools (like R and elastic search).
After analysis, dissemination is comparable with disseminating traditional statistics. The same tools and infrastructure can be used.
Using AIS in statistical processes asks for new skills, not always available in the Statistical offices yet, so training for employees or new employees are needed.
Future work on AIS
Although there is a lot of work done in this work package, further investigation on this promising data source is still needed. A new ESSnet Big Data has been planned already. One of the principal aims of this ESSnet (end 2018-2020) will be to develop functional production prototypes and promote and support their implementation in a limited number of participating National Statistical Offices. The final description for the work to be done in the new ESSnet has to be worked out in the next couple of months. The ideas further work based on AIS data could be part of this new ESSnet if Eurostat thinks they are really important for the ESSnet as a whole.
Overall conclusion
Although we are not satisfied yet with the quality of the current used European AIS source, the results from this work package show the potential wealth of AIS data to improve current statistics and to generate new statistical products.
Although some important elements of current maritime statistics such as type and quantity of goods loaded or unloaded at the port are not part of AIS, AIS still is useful to improve other aspects of maritime statistics and provide new products. There are also concerns on not having suitable hardware and software tools for the exploration and exploitation of the huge amount of AIS data and the lack of documentation and guidance for using AIS. Of course, there is a role here for Eurostat or an experienced NSI.
For using AIS in official statistics we certainly need more investigation and at least an European AIS source of good quality should be available. It is also important for the future, to have data from landbased stations as well as data from satellites. By having new data sources like EMSA available in the future the possibilities of AIS data seems to be even more promising.
6

1. IntroductionThe aim of WP 4 is to investigate whether real-time measurement data of ship positions, so-called Automatic Identification System (AIS) can be used 1) to improve the quality and internal comparability of existing statistics and 2) to produce new statistical products relevant to the ESS. AIS is a mandatory collision avoidance system on ships. Each ship transmits a signal providing details of the ship’s speed and location at frequent intervals. AIS data are picked up at numerous ground stations at ports and on the coast by various agencies globally. They are also picked up by satellites.
Five National Statistical Institutes participate in WP4: the national statistical institutes of the Netherlands (Work package leader), Denmark1, Greece, Norway and Poland. WP4 is subdivided into two phases. SGA-1 focused on creating a common database, linking AIS-data to maritime statistics and constructing sea traffic analyses (February 2016-July 2017, See Annex 1 for a more detailed description). The current SGA-2 focuses on the calculation of emissions and future perspectives for AIS data as source data for new statistical output (August 2017-May 2018, see Annex 2 for a more detailed description of the original scope). At the start of SGA-2 we had to change the scope of SGA-2, because good models for calculating emissions already existed and we could not get access to AIS data from EMSA. Annex 3 describes the scope of SGA-2 after these changes. The current SGA will result in three new deliverables, of which this deliverable is the last one:
Deliverable 4.6: ”Deriving emissions using AIS” (delivered March 31st 2018)
Deliverable 4.7: “Possibilities for new statistical output based on European AIS data” (delivered March 31st 2018)
Deliverable 4.8: Consolidated report on project results (current deliverable)
Besides these new deliverables, we also extended Deliverable 4.3 during SGA-2 with an extra chapter on the “Quality of satellite data from LuxSpace” (delivered January 31st 2018).
Methodological, quality and technical results of this work package, including intermediate findings, will also be used as inputs for WP 8 of SGA-2.
In this deliverable 4.8 we will shortly look back and summarize the most important results of work package 4. First the results of SGA-1, than followed by results of SGA-2. Chapter 3 identifies the pros and cons of using AIS data for the production of official statistics. Costs and benefits will be presented here in a qualitative form. Chapter 4 provides a sketch of a possible statistical process when using AIS data in NSI’s. Also the infrastructure needed is included in this chapter. Finally, chapter 5 describes the possibilities for future work on AIS data. The conclusions in this deliverable are based on several sources: papers about the AIS system and the possible use of it, the experience of working in this work package 4, a brainstorm session in which we discussed scenario’s for production of European and national statistics based on one single source of AIS data (see Milestone 4.10, chapter 7), as well as opinions from maritime experts of several NSIs that have responded to our expert questionnaire: “The use of AIS data for making statistics” (see Milestone 4.10, chapter 3).
1 Only in SGA-1, they withdraw from SGA-2
7

2. Summary of contents and outcomes WP4SGA-1 focused on creating a common database, linking AIS-data to maritime statistics and constructing sea traffic analyses. It consisted of three tasks: data access, data handling and methodology and techniques. The current SGA-2 focused on the calculation of emissions and future perspectives for AIS data as source data for new statistical output. Here, we will provide a more detailed summary of the work done in SGA-1 and SGA-2.
SGA-1
Task 1 – Data accessIn this task possibilities to obtain AIS data at a European level were explored. The aim here was to decide how European data could be used for European statistics, and to investigate the possibilities of acquiring data from EMSA (European Maritime Safety Authority). The advantage of using one AIS-dataset for the entire European territory is that it provides: a) a better comparison of international traffic between the countries, b) more synergy as all participating countries work on the same dataset c) reduced pricing. A disadvantage is that these data are stored by private companies and handling fees have to be paid compared to national or EMSA data.
There are three levels to choose to obtain AIS data
National level for each country collaborating in WP 4; European level: all waters within the perimeter of the European countries; World level: a data set covering the whole world.
National data is not very useful for European analysis, as it does not allow for analyses of ships’ journeys between countries (which is a large and significant part of all journeys) . The only advantages are the low pricing (most of the participating countries already have national data) and the size (the data is not that big). Later on, we also found this data to have better coverage. European data is much better suited for European as well as national statistics. European data contains information about the journeys vessels make within the whole of Europe and ports of loading and unloading within Europe. Hence, this data has extra potential for the national level as previous and next port can also be analysed. However, information on routes and ports outside of Europe would be missing (also constituting a significant part of maritime shipping). Thus, if one want to be able to locate all ports of loading and unloading and all routes, world wide data is necessary. However, this data is much more expensive (partly because for a large part coverage can only be obtained by satellites). Based on these criteria, it was decided to obtain European data. Several sources were identified to obtain the data from, i.e.: EMSA, Kystverket, Hellenic Coastguard, Dirkzwager (DZ), Marine Traffic (.com) and the Joint Research Centre (JRC).
The result of this investigation on possible sources for European AIS data is that we know for sure that we cannot obtain European data from Kystverket, Hellenic Coastguard and JRC, because of legal issues. Also, at the beginning of this WP we decided not to use the European AIS data by Marine traffic, because this is a very expensive alternative and did not fit within our budget2. During SGA-1, as well as in SGA-2, we were still investigating the possibility to get access to AIS data from EMSA together with Eurostat, because they would provide the EMSA data for free.
2 However, in July Statistics Netherlands and Marine Traffic signed a Memorandum of Understanding aimed at sharing data and knowledge between both organisations.
8

DZ could provide us 6 months of European AIS data on a short period of time and for a very good price. For that reason we decided to use this Dirkzwager data within our work package. This dataset contains 6 months of AIS data (8 October 2015 - 12 April 2016) and contains AIS data from land based stations only, no satellite data is included.
Task 2 – Data handlingAim of this task was to process and store the data in such a way that they can be used for consistent multiple outputs. Key elements to investigate here were: 1. which programming language and environment should be used for (pre) processing the data? 2. where will the data be processed? and 3. how can we create an environment which is easily accessible to all partners?
Figure 1 describes the results on deciding which programming language and environment we would use for pre-processing and analysing the European AIS data. For legal reasons we chose to keep the data in the Netherlands and decode the data in Python. After the data was decoded, all files were zipped to save space. The sets of files with positions (dynamic) and the files with voyage related data were uploaded to the UNECE Sandbox by a secure copy (scp). The dynamic data comprised 144 GB of compressed data (about 200 GB uncompressed) and the messages comprised about 5 GB of compressed data (about 7 GB uncompressed). It took approximately 7 hours to copy the data. After uploading, the data was copied to the Hadoop File System (HDFS) and available to use for all participating countries in this WP. For legal reasons we created an AIS group on the Sandbox, granting only the members of WP 4 access the Dirkzwager with their usernames.
From the HDFS, the data can be accessed using the tools that are available in the Hadoop stack, which are: Pig, Hive, RHadoop and Spark. We chose to use Spark, because Spark makes it possible to perform much more complex processing on data stored in the HDFS. Spark is compatible with the programming languages R and Java, but preferably with Python or Scala. Furthermore, within Spark one will be able to write SQL queries using SparkSQL.
Figure 2.1. Pre-processing, processing and storing AIS dataFor data analysis it was decided that resulting aggregates would be downloaded from the UNECE Sandbox using HUE. Researchers of the different NSI's are then able to analyse the data using their tools of choice, i.e. SPSS, SAS, R, or import the data into a local database.
9
Task 3 – Methodology and Techniques
AIS in general and Dirkzwager data We started by investigating the coverage of DZ’s AIS data. DZ has receivers all over the coastline and main ports of the Netherlands and a couple outside the Netherlands: Cherbourg, Gibraltar, Zeebrugge, Antwerp and Hamburg. AIS receivers on land can only pick up signals within the range of about 40 sea miles. Therefore, land receivers have a very limited coverage of signals transmitted from sea which results in loss of information of ships on open sea. We received all DZ’s data, also including non-European data from partners3, but no satellite data.
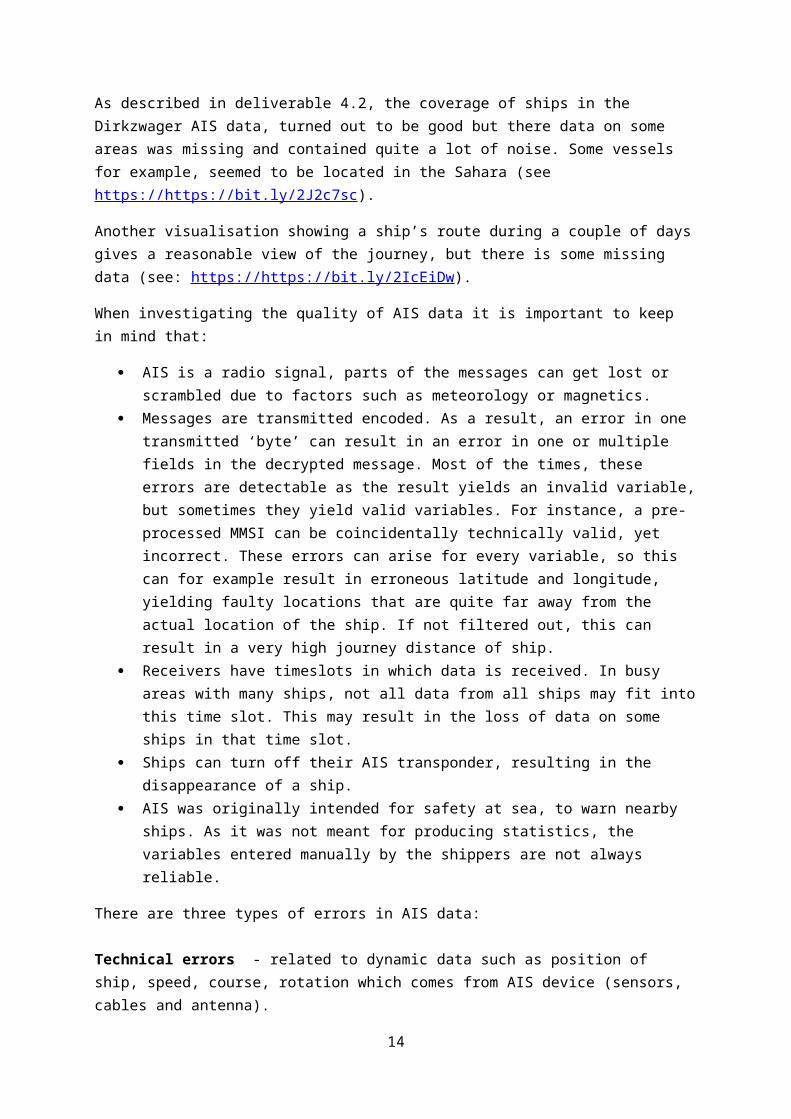
As described in deliverable 4.2, the coverage of ships in the Dirkzwager AIS data, turned out to be good but there data on some areas was missing and contained quite a lot of noise. Some vessels for example, seemed to be located in the Sahara (see https:// https://bit.ly/2J2c7sc ).
Another visualisation showing a ship’s route during a couple of days gives a reasonable view of the journey, but there is some missing data (see: https:// https://bit.ly/2IcEiDw ).
When investigating the quality of AIS data it is important to keep in mind that:
AIS is a radio signal, parts of the messages can get lost or scrambled due to factors such as meteorology or magnetics.
Messages are transmitted encoded. As a result, an error in one transmitted ‘byte’ can result in an error in one or multiple fields in the decrypted message. Most of the times, these errors are detectable as the result yields an invalid variable, but sometimes they yield valid variables. For instance, a pre-processed MMSI can be coincidentally technically valid, yet incorrect. These errors can arise for every variable, so this can for example result in erroneous latitude and longitude, yielding faulty locations that are quite far away from the actual location of the ship. If not filtered out, this can result in a very high journey distance of ship.
Receivers have timeslots in which data is received. In busy areas with many ships, not all data from all ships may fit into this time slot. This may result in the loss of data on some ships in that time slot.
Ships can turn off their AIS transponder, resulting in the disappearance of a ship. AIS was originally intended for safety at sea, to warn nearby ships. As it was not meant for
producing statistics, the variables entered manually by the shippers are not always reliable.
There are three types of errors in AIS data:
Technical errors - related to dynamic data such as position of ship, speed, course, rotation which comes from AIS device (sensors, cables and antenna).
Human errors – related to static (MMSI4, IMO number, ship’s name, call sign, type, length) or voyage data (draught, destination) which are manually entered in the AIS device. These values should be entered during installation of AIS instrument (static) or if voyage information changes. It is worth
3 Dirkzwager has six partners, amongst which AIShub (seem to filter the data more and covers all of Europe), Marinetraffic (covers mostly of Mediterranean: Greece and Italy), one English partner (covers English coast) and Portvision (covers USA).4 Maritime Mobile Service Identity
10

noting that voyage data must be manually updated after each port visit, which often is not done. This is a common cause of errors
Systematic errors - due to faulty or missing input by the ship crews.
Most of the issues we deal with by detecting and removing erroneous messages based on deviations from the expected format. As the amount of data is huge, there are many errors. However the amount of remaining data is still ample for further analyses.
Comparing DZ data to national data These results made us decide to further investigate different AIS data sources. This was done by subjecting the DZ data to a quality and metadata framework and then comparing DZ to other sources for national AIS data (from Denmark, Greece and Poland). We set up a preliminary quality framework for national statistical offices to conceptualise the quality of big data in deliverable 4.3. Almost all factors of the quality framework were judged as mostly positive. Only “spatial coverage” and “transparency and soundness of methods and processes for the metadata and the data” were scored as insufficient. Not all European coastal areas are covered, for example some important coastal areas and ports in Greece are not covered. Europe. Ports visits and journeys cannot be analyzed for all European ports and ship routes, especially in areas with a capricious geography. The number of messages in areas covered by DZ is usually also lower in the DZ data compared to the national data. DZ provides partly pre-processed data, but documentation on this is not available to us. Our algorithm (described in deliverable 4.2) can deal with this, in terms of calculating the right number of journeys, but it will result in an underestimation of the calculated distances. The lower frequency of messages can also impact calculated traffic estimates and underestimate emissions. However, national AIS data of Denmark, Poland and Greece are completely unfiltered and untreated. Privacy is also an issue that needs to be researched further.
AIS and existing maritime statisticsThe next step was to gain insight in the quality of AIS data by linking it to already available information: existing maritime statistics. From this, possibilities to improve the quality of current statistics could also be investigated. The advantage of fitting AIS onto existing maritime statistics is that the same reference population (= ship number) is expected in all ports. As port visits and journeys of ships can be derived from AIS, this could provide the ESS with information on the origins/destinations of the ship.
First results showed that AIS data can be used as a backbone for maritime statistics. To deal with erroneous messages and select the proper sample of ships, we have developed a method in which we build a reference frame of maritime ships. From this, we composed the number of port visits, which in some cases was more accurate than the maritime statistics. However, AIS data does not reliably provide information on the type and gross tonnage of the ships needed to generate port visit statistics. One method to accomplish this would be to combine AIS data with Lloyd’s register of ships. It might also be possible to use other methods, like deriving it from the type of terminal the ship is visiting. The type of terminal could also be determined from AIS .
This work resulted in robust algorithms to handle the noise in the data. We developed an output-driven method to define a journey. Processing could be further optimized by filtering out AIS data in
11

which the speed and heading of the ship have not changed since the last message. This optimization might be performed in the future, but was not in scope of the current project.
Proof of concepts for improved and new statisticsIn deliverable 4.3 we performed four Proof of Concepts (PoC’s) to investigate further possibilities of AIS data, with promising outcomes. The first PoC, on developing an algorithm to calculate the intra-port journey by using AIS data, succeeded. Intra-port travel distances can become a new statistical product. In the future, it would also be interesting to develop an algorithm that can detect intra-port movements, i.e. where a ship that moves from one terminal to the other within the same port can be automatically detected. Another possibility of AIS is the detection of anomalies in the movements of ships signalling problems in the ports. Both statistical offices and port authorities have expressed interest in these possibilities.
The second PoC, on using AIS data to define ports, has succeeded: it is possible to build a data driven algorithm for defining ports. In the near future, Statistics Netherlands and Marine Traffic plan to collaborate on the possibilities of building a reference frame of ports. The next step would be to zoom in on defining the types of terminals by means of AIS.
From the third PoC we concluded that next destination in AIS as reported by captains is not always reliable, as opposed to the observed next destination. We also concluded from this PoC that distance measures in time and space are improved by using actual AIS data. For example, routes might not always be based on the most efficient route in terms of minimal distance. However, more work is needed to handle areas where geography is complicated and coverage is not perfect. It is also interesting to see how the port to port distance matrix from Eurostat could be further improved by more AIS data. It could also result in using actual AIS journey data instead of the average distance matrix for a single ship’s journey in the future.
Finally, the last PoC showed that AIS data is useful to investigate the magnitude of fluvio-maritime transport. Finally, we performed a PoC to investigate the extent of fluvio-maritime transport in the Netherlands. We found that fluvio-maritime transport (with loading/unloading in the Netherlands) probably constitutes a minimal part of transport statistics in the Netherlands. However, we did not include maritime ships travelling on inland waterways closer to maritime ports. Also, we did not include inland waterway ships travelling outside inland waterways (i.e. the North Sea). These cases ask for further investigation. In addition, research on the extent of fluvio-maritime travel is also interesting for other countries, such as France, Germany, Belgium and the United Kingdom. Extending research to the relationship between maritime and IWW transport is also recommended. Expending this even more, it could provide more information on transit trade, traffic intensity and emissions.
Traffic analysesIn the final part of SGA-1 traffic analyses were performed. The number of ships during a certain time interval at a region between certain coordinates (like inland waterways or at certain points at sea) can be calculated from AIS-data. This information could be interesting for traffic analyses and economic analyses.
12

Results of the traffic analyses are shown in a visualization, see Figure 2.3.1. In the visualization, one can choose the date out of an available date list in the lower end, where a slider is available for selecting a saturation threshold for the visualization. Regions/cells, based on the Lambert Azimuthal equal area projection having a traffic intensity exceeding threshold are displayed as dark red and all less visited locations are light red. Manipulating the slider provides insight in more and less occupied regions in Europe. For the regions that are not displayed in red, there is no data available in the DZ dataset on that specific day or traffic intensity is very low. AIS data is useful to analyse sea traffic and to analyse variations in time (see deliverable 4.3 for a more detailed description).
Figure 2.2: Traffic analyses: the number of ships in each cell of a grid during one day
SGA-2The original plan for SGA-2 was to develop a model to calculate emissions, investigate other sources for AIS and future perspectives for AIS data as source data for new statistical output (August 2017-May 2018). See Annex 2 for a more detailed description. However, at the start of SGA-2 we adjusted the scope of SGA-2, because we could not get access to AIS data from the European Maritime Safety
13
Agency (EMSA) and good models for calculating emissions already existed. Annex 3 describes the scope of SGA-2 after these changes.
Task 3 - Methodology and Techniques
Estimate emissionsHere, we investigated how emissions from maritime ships can be determined using AIS data. Aim of this task was to investigate existing models for deriving emissions and describe how we could implement these models in our statistical processes. We also investigated possibilities for improving existing emission statistics by using AIS data.
One of the ways shipping impacts the environment is through atmospheric pollution. Exhaust gases result in both conventional pollutants and greenhouse gas emissions. To maintain Kyoto Protocol (1997), it is necessary to monitor chemical pollutants such as Carbon Dioxide(C02), Methane (CH4), Nitrous Oxide, Nitrogen Dioxide (NOX), Sulphur Dioxide (SO2,) and Particulate Matter (PM). AIS provides a method to determine the route of a ship. Combined with a model to estimate the emission of vessels (which depends on factors like travel distance, speed, draught, weather conditions and characteristics of the vessel itself), emissions of e.g. CO2 and NOX can be estimated per ship and per (national) territory.
To identify goals for this task, we first investigated the needs of stakeholders/ experts on this topic. Then, we described various papers and how existing methodology would be useful for our purposes. Finally, recommendations were provided on how stakeholders’ needs on a national and European level can be met.
Stakeholder’s needsThere are two approaches to determine and publish on emissions: the territorial principle or the residence principle. In the territorial approach, emissions are calculated for confined geographical areas, such as a country or a sea. In the residence approach emissions are calculated for ships that are owned by companies from a certain nationality for the whole world. The latter is the approach necessary for the National Account System.
We investigated the needs of stakeholders with regards to information on emissions from AIS. We looked at how data on emissions are reported internationally and then approached national agencies from the countries in this WP. The comments we received from stakeholders were mainly geared towards the National Accounts approach. For example, Statistics Netherlands expressed interest in receiving travelled distances by Dutch owned ships. We received hardly any requests on the territorial approach. This might be because it was harder for us to contact the institutions that work on this. We cannot conclude on the basis of the investigation we did whether there is no interest in the work on the territorial approach.
Literature reviewTo investigate work that has been done on AIS and emissions on a national level, and on a more global level, we discussed three papers. We started with papers focusing on two geographical areas of the members of this WP (Norway and the Netherlands), then going into a paper widening the geographical area of interest using the so-called Ship Traffic Emission Assessment 3 Model (STEAM3).
14
The models presented here all build on the same principle of using speeds compared to maximum speeds as a proxy for propulsion power used. The methods applied become more advanced in the STEAM3 model. The method described in the first and second paper are not sufficient for a European analysis because they only cover a smaller geographical area. For a larger scale analysis two aspects are needed. These are included in the STEAM3 model. The first aspect is an algorithm dealing with missing AIS data due to scarcity of AIS in some areas. Second, a method to obtain detailed vessel information is needed. To this end, an extended/automatic means of combining multiple sources has to be incorporated. Another benefit of the STEAM3 model is that it takes into account control areas, scrubbers and dual fuels.
We concluded that the STEAM3 model would best serve the purpose of analysing emissions of maritime shipping in large geographical areas or even worldwide shipping. However local models also do quite well for their own area and are much simpler. Start off with the local models might thus be a good first step to calculate emissions, before turning to the more complex global model (of course also depending on the needs).
Recommendations for calculating emissions using AISWhen constructing emission statistics on maritime (and inland waterway) transport, a number of data sets are indispensable: Worldwide AIS data, a route generation algorithm, ship’s details (based IHS Fairplay registry, web scraping and a similar vessel algorithm), emission factors, an emission calculation algorithm and storage. We have described some opportunities for efficiency gains and other opportunities like using “average” paths and speeds. The latter being presented in a visualisation. All in all, we think the analysis of AIS data for statistics eminently lends itself to process on a European level.
As developing such a method would take a big investment in terms of getting data, algorithms and storage, an intermediate step might already be possible. Stakeholders have expressed interest in two specific aspects that might be somewhat easier to obtain. Firstly, the Dutch department of National Accounts has expressed interest in getting the development of the distance travelled for Dutch-owned ships. Even European AIS data would be an enrichment of the current method. Secondly, the Dutch Pollutant Release and Transfer Register would be interested in getting information on average speeds over 100 meters for Dutch territory (mainly for inland waterway ships).
Task 4 - Access to and analysing AIS data from EMSAAIS-data are available for national territories, the entire European territory, and covering the whole world. In this work package we have used European AIS data from DZ. As this costs money, we were interested in obtaining free European AIS data. That is why we tried together with Eurostat to obtain AIS data at the European level from the European Maritime Safety Agency (EMSA). Unfortunately, we did not succeed in getting access to data from EMSA during this ESSnet yet.
We did obtain satellite AIS data from LuxSpace. Satellite data is needed when ships travel across the oceans, as ships here are positioned too far from land so that land receivers are not able to pick up the signal. Getting this data provided us with the first possibility to examine satellite AIS data. The data covered the Mediterranean Sea for the same period as the DZ data we already had and also covered the area of the Greek national data. This gave us the opportunity to assess the quality of satellite data by comparing it to the DZ data and the national AIS data from Greece.
15

As expected, satellite data is indispensable when it comes to following ships across the Mediterranean Sea. Also, in some port areas it did pick up signals from ships that were not picked up in the DZ data. However in some ports, satellite AIS contained signals from a lower number of ships than the Greek national data. In addition, the signal is not always detailed enough to perfectly model shipping routes in more complex areas. That is, for areas where the geography is more intricate, e.g. due to isles or different water depths, frequency of reporting by satellites can be too low. As satellite AIS has significantly higher latency and lower frequency of receiving, the number of messages for linear interpolation can result in a ship’s route crossing land. When AIS data is needed to cover both coastal and oceanic regions, a combination of land and satellite receivers is necessary to track all (routes of) maritime ships.
The results of this task were added to deliverable 4.3.
Task 5 - New statistical outputAim of this task was to explore possibilities of new statistical products from using AIS data. In the work package we had already administered a questionnaire to maritime experts at all European NSI’s (more on this in 3.3). Results from this expert questionnaire were also taken into account.
Intra port distancesPort authorities do not always have a complete insight in the activities within their port. For example, they do not always know whether ships visit one or multiple terminals during one visit, rendering a higher intra port journey distance. The expert questionnaire show that most of the NSI’s are interested in this. Journeys within the port, and with that intra-port distances can be derived from AIS, as shown in the (PoC) (see deliverable 4.3).
Fluvio-maritime statistics If transport is partly performed on inland waterways (IWW) and partly on sea, it is classified as fluvio-maritime transport. For Eurostat, this has created discussion about whether fluvio-maritime transport should be reported as maritime transport, IWW transport, or both. Countries have non-harmonised approaches to report fluvio-maritime data in the maritime and IWW statistics. Deliverable 4.3 describes the results of the PoC we performed on investigating the extent of fluvio-maritime transport in the Netherlands. AIS data could help getting insight in the relationship between maritime and IWW transport.
Port-to-port distance matrixDynamics between different factors can influence the route a ship travels. If one does not want to calculate the distance for every single journey, this requires a flexible way of calculating the distance a ship travels. AIS provides the opportunity to follow ships’ routes and thus calculate the distance travelled. In addition, it can also provide more insight into patterns and factors determining these travel patterns.
We compared the quality of Eurostat’s average port-to-port distance matrix to Marine Traffic’s model for estimating routes of ships and the calculated distance per single journey (obviously the most precise measurement). We only examined a very limited number of journeys, so we did not find a strong preferred averaging method. Yet, the method of calculating each journey separately requires an enormous amount of processing. We still think the fixed Eurostat’s distance matrix at the moment is too limited. Reasons for this are that it only uses a short period of historical AIS data, does
16

not take into account important determining factors (e.g. type of ship, weather conditions) and does not use worldwide AIS data. Using a historically richer model like Marine Traffic’s, and adding factors like type of ship and weather conditions, could further improve the calculation of travelled average distances of ships.
AIS as an economic indicator. The EU’s international trade market highly depends on seaports. To get up-to-date information on the development of international trade, and with that economic development, an analysis of activity in the seaports would be a valuable information. Part of this information could be based on AIS data, so AIS could be provide a fast indicator of economic development, where international comparisons can also be made quickly.
Insight in disruptions or regulationsMultiple parties, such as experts in the questionnaire and port authorities, have shown interest in gaining insight into the effects of disruptions or (changed) regulations by means of AIS. For example a shift in traffic patterns caused by port closure could be found by using AIS. Another example are speed regulations in for example emissions zones. A speed grid was developed.
Visualizations To gain insight in data, particularly big data, visualisations are indispensable. Although visualizations are not a statistic as such, it does ask for a new type of skill, requiring an investment for most statistical offices. As such, it is important to be aware of the opportunities opened up by this investment. We presented an example of a visualization published by Statistics Netherlands which showed sea routes taken by container giants (which have a cargo capacity of more than 10 thousand TEU) performing transshipment. See http://research.cbs.nl/AIS_transshipment.
PitfallsIn many cases our research included a path of trial and error. Communicating good practices is important but communicating and documenting pitfalls is also important. Some pitfalls we encountered:
As people like to use software they are used to, it can be difficult to get people to use the same software, even if this was agreed upon.
Using big data means containing different kinds of errors means thus research in the kind of errors (technical, human), and with that the process of validating (AIS) data is essential. For example, we thought just checking the validity of the ship’s identifying number (MMSI/IMO) was sufficient. However, due to the large amount of data and errors, some erroneous MMSI’s and IMO’s turned out to be valid identity numbers, e.g. in terms of length, yet they were incorrect. Therefore, we had to build an extra step in the process in which the number of occurrences of an MMSI-IMO couple was used as a filter.
Temporal filtering of a big data set makes it easier to handle the amount of data and remove errors. However, when using this filtering it is important to keep in mind that this filter does not suit all conditions in both geographical and temporal terms. For example, when visualising a journey of a ship, a 10 minute median filter may be too rough: zooming in shows ships going over land. Also, in using a 10 minute filter one loses temporal information needed for short journeys for example for ferries making short trips.
Even if there already is a collaboration between Eurostat and another institute, it can still be difficult to get access to (European AIS) data
17
ReportsMore detailed results of the tasks mentioned here are described in the following reports:
1 creating a database with AIS-data for official statistics: possibilities and pitfalls 2 deriving harbour visits and linking data from maritime statistics with AIS-data 3 sea traffic analyses using AIS-data 4 Determining emissions using AIS 5 Possible new statistics using AIS
18

3. Cost-benefit analysis of using AIS-data for official statistics
Introduction To identify the pros and cons of using AIS data for the production of official statistics we performed a cost-benefit analysis. Usually, the objective is to evaluate the benefits of AIS data from an economic point of view. However, most costs and benefits of using AIS data for the production of official statistics cannot be quantified, therefore costs and benefits will be presented here in a qualitative form.
In this chapter we evaluate AIS data on the following aspects:
Sustainability of the data source General benefits and costs of using AIS for current statistics Current statistics to improve AIS for new statistics Scenario’s for producing national/European statistics based on a single or multiple source of
AIS data
Regarding sustainability, we describe the future use of AIS: as quite large investments have to be done in using AIS, AIS should be available for some time into the future. Then we will turn to how AIS can be applied to current statistics in order to improve them. To further investigate this, we used a questionnaire to involve maritime experts with the ideas we had already formed. This was also done for new statistics that could be possible by using AIS. Finally, we will describe possibilities and their pros and cons of sharing data on either national or European level.
Sustainability of the data source Based on GPS-technology, using AIS the location and status information of ships is broadcasted over a radio channel, making it possible to detect other ships and exchange information with nearby ships. AIS technology has been developed under the auspices of the International Maritime Organization (IMO), by its technical committees. The AIS system is mandatory for ships of 300 gross tonnage and upwards engaged on international voyages and cargo ships of 500 gross tonnage and upwards not engaged on international voyages and passenger ships irrespective of size (SOLAS chapter V, regulation 195 2.4). The costs of an AIS system are relatively low, but the costs will be quite high if the owner of the vessel decides to invest in top of the line equipment and use the AIS incorporated in an ECDIS system on the bridge [4].
AIS signals can be picked up by other ships and by receiving stations. These stations can be land-based or satellite-based. Both land and satellite based data is necessary to follow ships. When the distance from ships to the land receiver becomes too large, land receivers are not able to pick up a signal from the ships. Then, satellite data becomes indispensable. However, satellite data is less useful to perfectly model shipping routes in more complex areas. That is, for areas where the geography is more complicated, e.g. due to isles or different water depths, frequency of reporting by satellites might be too low. Therefore, a combination of both land- and satellite based data is necessary to follow the full route of a ship. 5
19

Land-based AIS systems are included in a computerized system up and running in all EU member states. Different commercial parties also own and sell AIS data. Spatial and temporal coverage of AIS data from these different data providers does differ (see Deliverable 4.3)
On both the transmitting side (ships) and receiving side (land-based stations and satellites) we foresee that AIS data will be available for quite some time into the future, as it is part of the general security system for both maritime and inland shipping. At some point however, the mode of transmission might change. Instead of GPS, wifi could be a candidate to transmit information between ships, although we have not heard any plans on this. This wifi signal could still be picked up by land-based stations. For satellites this is not sure However, the information content would probably not change, so in case the mode of transmission would change, we expect algorithms developed to analyze AIS data to keep their value.
Different data providers could pose some problems. National data will probably remain available, as they are also used for other governmental ends, and will be free to use. When using commercial data, which provide a larger coverage, this might be somewhat different. As these data would have to be paid for, new arrangements would have to be made once in a while, asking for new negotiations. These might not always be successful.
Finally, privacy also plays a role in the sustainability of AIS data. This issue specifically plays a role in monitoring movements of inland waterway vessels. For these vessels, the ship is usually also the home address of an individual, making it possible to actually identify and follow individual’s movements. This is not permitted under most national laws.
A summary of the above mentioned results is presented in the Table 1.
Description Benefits Concerns / ChallengesSustainability of the AIS data source
+ The AIS system is mandatory for a great number of vessels.
+ AIS data have the same structure at international level.
+The AIS systems are included in a computerized system up and running in all EU member states.
+ There is an AIS network of base stations along coast lines at national level and by commercial parties.
+ Satellite data is usually also available
+ Obtaining data from a national institute might provide more security on sustainability
- The costs of the AIS system for vessels may vary a lot depending on the equipment. However, it is mandatory for a great number of vessels.
- Spatial and temporal coverage depends on data-provider and it could be insufficient
- GPS transmission might change to wifi signal. This might ask for new receiving technology. However, this is not a concrete expectation and content will still be usable.
- Obtaining data from a commercial party might provide less security on sustainability
- Privacy could be an issue specifically for inland waterway vessels
Table 1 Sustainability of the AIS data source
20

Expert questionnaire on the use of AIS dataAs maritime experts might be future users of AIS, we also wanted to involve them and find out how they perceive the use of AIS data for the production of official statistics. Therefore, using a questionnaire, we proposed our ideas to maritime statistics experts from different NSI’s and also asked if they had other ideas about the use of AIS. The questionnaire was filled out by 18 NSI’s.
To assess their views on both costs and benefits in a structured manner, the questionnaire was divided into three categories. The first category contained questions about the general benefits, concerns and challenges on the use of European AIS data. In the second category, NSIs were asked if they recognized specific problems in the production of current maritime statistics, as well as whether they believed whether these could be (partly) solved by using AIS data. The third category included questions about new products of maritime official statistics using AIS data. For all categories, experts were also asked to provide other ideas. See Annex 4 for the exact questions posed in the questionnaire. The next three paragraphs, are mainly based on the initial ideas and response from the expert questionnaire [5].
General benefits and costs of using AIS for current statisticsMost of respondents think that European AIS data is beneficial for making statistics (e.g., vessel movements between European countries, and how this links in with broader maritime aspects such as oil prices, registration flag of a vessel etc). Importantly, the use of AIS data opens up opportunities to enhance timeliness and accessibility of maritime statistics and to determine the impact of maritime legislation at national and European level.
More than half of the respondents expressed their interest in using European AIS data, especially if this contributes to the improvement of current maritime statistics. Respondents believe that European AIS data could aid the identification of origin/destination for passenger and freight statistics and could be used for validation and mirror checks, although care needs to be taken where people/cargo remains on the ship while passing through another port (not an issue for 2 port back-and-forth routes). Furthermore, many of them believe that European AIS data could reduce the response burden of the ports authorities and agencies and could simplify the quality inspections.
However, NSI’s have expressed concerns about the quality of manually entered fields of AIS data, such as destination and MMSI. Furthermore, AIS data contains insufficient information for some important elements of current maritime statistics such as type and quantity of goods loaded or unloaded at the port. NSI’s are concerned about potential loss of information of AIS data received by AIS developers due to the filtering to reduce the volume of the data.
Technical challenges and handling capacities of AIS data have also been mentioned by NSI’s. There is a need for suitable hardware and software tools for the exploration and exploitation of the huge amount of AIS data. Also mentioned was the limited range of documentation and guidance available. It has been proposed to develop a comprehensive best practice guide describing processing techniques for the use of AIS data in maritime statistics, ideally accompanied by a software tool ready for use. Summary of the results of the questionnaire are presented in the Table 2.
Description of scenario
Benefits Concerns / Challenges
Use of AIS data for the production of
+ improve current statistics (e.g., vessel movement statistics between
- technical challenges and building of capacities to handle AIS data by NSIs
21

current statistics European countries, such as port visits, and route trajectories)
+ enhance timeliness and accessibility of maritime statistics
+ determine the impact of maritime legislation at national and European level
+ identification of origin/destination for passenger and freight statistics
+ contribute to the validation and mirror checks (differences between imports and exports between MS)
+ reduce the response burden of ports authorities and agencies
+ simplify the quality inspections
- limited range of documentation and guidance available
- quality of manually entered fields of AIS data
- loss of information of AIS data received by AIS developers due to the filtering for reducing their volume
- insufficient information for type and quantity of goods loaded or unloaded at the port
Table 2 General benefits and concerns/challenges of using AIS
Current statistics to improveAs part of the questionnaire, NSI’s were asked whether they recognized specific problems in the production of current maritime statistics, as well as whether they saw possibilities to use AIS to (partly) solve these problems. Problems in current statistics also recognized by maritime experts from NSIs are presented in Table 3.
Nr. Current Problem Benefits from the use of European AIS data
Concerns / Challenges
1 Information on the previous and next ports of ships is incomplete
+ Knowing the route a ship travels, provides information on previous and next port of visit
+ New tables with to and from traffic matrices can be generated
-Data on goods unloaded in the next port would still be missing (draught and type of terminal visited could provide some information on this)- As territorial waters are involved, at least European data is needed, European processing preferable
2 Not all ports are well-specified, they are sometimes misclassified by port authorities
+ Ports and even terminals can be identified from AIS, optionally a port/terminal-definition algorithm could be developed
3 Distance travelled per ship is now based on an inaccurate average distance matrix for ports
+ Based on European AIS data it is possible to calculate ships’ travelled distance, allowing for calculation of transportation volume (in TKM) per ship, or improve quality of the average distance matrix between ports
-As territorial waters are involved, at least European data is needed, European processing preferable
4 Fluvio-maritime transport (transport by
+ Fluvio-maritime transport can be investigated by following inland
- As territorial waters are involved, at least European data is
22

ships travel across both sea and inland waters) is incomplete or inconsistently monitored
vessels outside inland waterways and following maritime vessels on inland waterways
needed, European processing preferable
5 Current statistics on fuel consumption and emissions are not accurate enough
+ Fuel consumption could be based on the route, speed and characteristics of a ship
+ By combining the above with emission factors, emissions of e.g. CO2 and NOx can be estimated per ship and per national territory
- As territorial waters are involved, at least European data is needed, European processing preferable
6 Some smaller ports experience response burden from surveys
+ For some statistical offices it is possible to reduce the response burden for smaller ports, by asking fewer questions to the ports and by prefilling AIS-based data on relevant questionnaires
7 Customers need faster information on maritime statistics
+ If AIS data are going to be a used as a basis for official statistics it is possible to improve the timeliness of publications of some maritime statistics
Table 3: Improving problems in current statistics by AIS
Figure 3.1 shows percentages of NSI’s recognizing specific problems in current maritime statistics.
Customers need faster information on maritime statistics
Some smaller ports experience response burden from surveys
Current statistics on fuel consumption and emissions are not accurate enough
Fluvio-maritime transport is incomplete or inconsistently monitored
Distance travelled per ship is now based on an inaccurate average distance matrix for ports
Not all ports are well-specified, they are sometimes misclassified by port authorities
Information on the previous and next ports of ships is incomplete
0% 20% 40% 60% 80% 100%
Yes No No Response/Don't Know
Figure 3.1: NSI’s responses to statements on specific problems in the production of current maritime statistics
23

From the proof of concepts (PoC’s) described in Deliverable 4.3 we conclude that automatic port detection from AIS is possible by building a data driven algorithm for defining ports. We also concluded that next destination as reported by captains in AIS is not usable. Instead, the observed next destination from AIS has to be used. Finally, a PoC on investigating fluvio-maritime transport was performed. For the Netherlands, we did not detect maritime ships on inland waters.
Responses on the expert questionnaire show that most of the NSI’s are open to using AIS data as a source for improving current statistics, although experts also expressed some concerns. Furthermore, they also saw the potential of AIS to generate new statistics, which will be described in the next part.
AIS for new statisticsIn the course of this work package we also identified possibilities for new statistical products based on AIS. These ideas were also proposed to the maritime experts and again also the experts were asked for other ideas, see Table 4.
Nr. New statistics Benefits from the use of European AIS data
Concerns / Challenges
1 Intra-port travel distances
+ Calculating intra-port travel distances is a new statistical product that could be generated by using AIS data.
2 Fluvio-maritime transport: more information on the relationship between maritime and inland waterway transport
+ Direct links can be seen between both modes, as ships could be (at least partially) linked by terminals visited around the same time
3 Port-to-port distance matrix based on model estimating shipping routes
+ More precise distances can be calculated taking multiple factors into account
- If only European data are used, worldwide distances would still be missing
4 AIS as new economic indicator
+ AIS can be almost real-time, enabling fast monitoring developments in transport and destinations of certain types of goods fast (mirroring e.g. international trade)
5 Insight in effects of disruptions or regulations
+ Port closures or imposition of emissions zones can cause shifts in traffic patterns (e.g. in traffic, or speed)
- As territorial waters are involved, at least European data is needed, European processing preferable
Table 4: Possible new statistical output based on European AIS data
Figure 3.2 shows percentages of NSI’s responses in possible new statistical output based on European AIS data. Note there is no data available for the 3rd and 5th new statistics of Table 4 due to lack of suitable questions in the questionnaire
24

AIS as new economic indicator
Fluvio-maritime transport: more information on the relationship between maritime and inland
Intra port travel distances
0% 20% 40% 60% 80% 100%
Yes No No Response/Don't Know
Figure 3.2 NSI’s responses in possible new statistical output based on European AIS data
In Deliverable 4.7, we focused on most of these possibilities for making new statistics by using AIS, such as intra port travel, fluvio-maritime transport etc.
From the possibilities mentioned in table 4, the ideas of intra-port travel distances, a port-to-port distance matrix based on model estimating shipping routes and insights in effects of disruption or regulations are most promising to be implemented for the ESSnet as a whole, for example by using one standardised European AIS source and methodology. The ideas on fluvio-maritime transport and AIS as a new indicator could also be implemented on a national level.
Scenarios for producing national/European statistics based on a single or multiple sources of AIS data The analysis of AIS data for statistics eminently lends itself to process on a European level. Besides the vast amount of data that would have to be done by each statistical office, and specialists needed to this work, it also renders redundant work. That is, many ships enter multiple European ports and waters. Having every country determine the route of every ship (also entering other countries) would result in redundant processing. The same would be the case for determining emissions: besides the territorial approach, National Accounts are actually interested in worldwide emissions per ship. Therefore, to optimize efficiency on a European level, it would be advisable to perform calculations per (European-owned) ship and then aggregate this either to nationality of owner or to territory a ship traverses.
Besides mode of processing, a decision also has to be made on which data is necessary and how this data should be obtained. Gaining access to European or even worldwide data is necessary for certain products. Besides obtaining these sorts of AIS data, data on ships’ characteristics (i.e., Lloyds’ registry) also need to be obtained. Acquiring these data sets on a European level is more cost efficient than every country having to buy these data sets separately.
25

Of course, different procedures can used to process all data or only part(s) of the data. For example during this work package we have worked together on AIS data that was available to all work package members on the Sandbox of the UN in Ireland. Table 5 presents scenarios for producing national/European statistics based on a single or multiple sources of AIS data. Results are the outcome of the brainstorm session described in Milestone 4.10 (“Scenario’s for production of European and national statistics based on one single source of AIS data”).
Nr. Description of scenario Advantages Disadvantages1 All NSI’s store their own
national AIS data and make statistics using the same process
+ National datasets are free and available quickly+ National datasets have a better quality and are more precise+ All national statistics are made by using the same process+ National data will probably remain available
- Every NSI needs their own IT infrastructure for Big Data – Every NSI needs data scientists- Harder to secure identical processes and methodologies-Some work will be redundant- No European and world coverage: travel between countries cannot be followed
2 All NSI’s store their own national AIS data and make national statistics following the same process. Grid computing is used to enable production of new statistics crossing European borders.
+ National datasets are free and fast available+ National datasets have a better quality and are more precise+ All national statistics are made by using the same process+ (new) European statistics can be made+ National data will probably remain available
- Every NSI needs their own IT infrastructure for Big Data- Every NSI needs data scientists- Harder to secure identical processes and methodologies- Grid computing algorithm is needed- No world coverage: travel between countries cannot be followed
3 Collect, decode, clean and analyze all national AIS data and store them in one central database. Each NSI can query this database for their own national statistics
+ National datasets are free and available quickly+ National datasets have a better quality and are more precise+ All national statistics are made by using the same process+ NSI’s do not need their own IT infrastructure for Big Data+ Not every NSI needs a data scientist+ (new) European statistics can be made+ National data will probably remain available
- All national AIS data has to be combined and overlapping data removed. This is not easy- Database has to be built, comparable to an already available one from EMSA- National coast guards have to deliver to different databases: various arrangements have to be made and regulated- No world coverage: travel between countries cannot be followed
4 Get access to a European AIS dataset and decode, clean and store the data in one
+ Not all the national datasets have to be combined+ Buying it once is more cost efficient
- European mostly datasets aren’t free available (EMSA excluded) - European datasets
26

central database. Each NSI can query this database for their own national statistics
+ All national statistics are made by using the same process+ NSI’s do not need their own IT infrastructure for Big Data+ Not every NSI needs a data scientist+ (new) European statistics can be produced
(compared to national data sets) have lower coverage and frequency (EMSA excluded)- access to European datasets is less sustainable due to commercial activities (EMSA excluded)- No world coverage: travel between countries cannot be followed
5 Get access to a AIS dataset with worldwide coverage and decode, clean and store the data in one central database. Each NSI can query this database for their own national statistics
+ Not all the national datasets have to be combined+ Buying it once is more cost efficient+ All national statistics are made by using the same process+ NSI’s do not need their own IT infrastructure for Big Data+ Not every NSI needs a data scientist+ (new)Worldwide statistics can be produced
- Worldwide datasets are probably hard to find- Worldwide datasets aren’t free available- access to worldwide datasets is less sustainable, due to commercial activities- Worldwide datasets (compared to national data sets) probable have lower coverage and frequency (this was not investigated)
Table 5 Scenarios for producing national/ European statistics based on a single one or multiple sources of AIS data
Our advice would be to aim for at least scenario 4 and try to get access to a European dataset and decode, clean and store the data in one central database so each NSI can query this database for their own national statistics. This scenario has the big advantage that also European statistics could be made and that all national statistics are uniform because they are produced by using the same process. National institutes would not have to invest in processing capacity and data scientists. If we manage to get access to data from EMSA, this European data will be freely available and the coverage and frequency will be on the same level as the national AIS data. Also, data access will be more sustainable compared to data access from other commercial companies. The only disadvantage of this scenario would be that there is no world coverage and travel to countries outside of Europe cannot be followed. Ideally, we would advise to invest in obtaining world wide data.
We think Eurostat should play an important role in coordinating and managing the process of transition to AIS data for the production of official statistics in a careful and consistent way. Another, similar, option would be to have one of the NSI’s to manage all data in one central database available to all countries. Or we could ask an external organization (like EMSA) to build an AIS reference architecture for ship transport from AIS data, based on a standardized journey approach with time stamps and location information. This architecture would represent microdata, from which we should be able to generate all statistics we are currently producing (+ we would like to produce in future).
27
Conclusion on cost benefit analysis of using AISRegarding sustainability we foresee that AIS data, particularly national data will remain available for some time in the future. As AIS is part of the general security system for both maritime and inland shipping, both the transmitting side (ships) and receiving side (land-based stations and satellites) are necessary factors. Even if the mode of transmission would change (e.g. wifi instead of GPS), data probably remains usable for analysis of maritime transport. National data probably proves even more reliable and is free to use, as national data is used for governmental ends such as traffic enforcement. When using commercial data, which do provide larger coverage, new arrangements would have to be made once in a while, asking for new negotiations. These might not always be successful.
From the expert questionnaire as well as from the PoC’s we described in deliverable 4.3, we conclude that the use of European AIS data can be beneficial for producing statistics. AIS can (partly) solve quality problems in current statistics and the use of AIS data opens up opportunities to enhance timeliness and accessibility of maritime statistics. What is more, AIS provides possibilities for new statistical products. Furthermore, respondents also saw the potential of AIS to generate new statistics based on AIS.
Experts’ main concerns on using AIS data for official statistics are on the quality of manually entered fields of AIS data and data missing in AIS. Some of these fields can derived from other information in AIS, however the lack of information on the amount and nature of goods transported would always have to be dealt with in a model-based fashion. Therefore, AIS could never replace some of the current methodology.Concerns were also expressed on potential loss of information due to the filtering in order to reduce the data volume. We think this could be dealt with by generating flexible filtering processes that depend on the aim of the measure of interest. There are also concerns on not having suitable hardware and software tools for the exploration and exploitation of the huge amount of AIS data and the lack of documentation and guidance for using AIS. Of course, there is a role here for Eurostat or an experienced NSI.
The analysis of AIS data for statistics eminently lends itself to process on a European level. Having every country determine the route of every ship (also entering other countries) would result in redundant processing. Similarly, when determining emissions one of the two main approaches, National Accounts are actually interested in worldwide emissions per ship. Therefore, to optimize efficiency on a European level, it would be advisable to perform calculations per (European-owned) ship and then partition this to either nationality of owner or to the territory a ship traverses.
For future use, we advise to at least obtain European AIS data from EMSA. The big advantage being that European statistics could be produced and all national statistics are comparable. The advantage of EMSA data compared to other European sources is that the EMSA data is freely available and the coverage and frequency will be on the same level as the national AIS data. Also data access will be more sustainable compared to data from other commercial companies. The only disadvantage of this scenario would be that there is no world coverage, so travel between countries cannot be followed. If there is sufficient funding, we would advise to use worldwide data, because then all ship journeys can be followed and a clearer picture of worldwide patterns can be analyzed.
28

We think Eurostat has an important role in decoding, cleaning and storing the European data in one central database and enables each NSI to query this database for their own national statistics. Another alternative could be that one of the NSI’s will take this role and provide a central European AIS data database.
4. Sketch of a possible statistical process and needed infrastructure
IntroductionThis chapter focuses on the simplified statistical process model in the context of the use of AIS datafor the production of statistical data.
The Big Data processing and analysis process is different from the traditional approach to data, due to the volume, velocity and variety (3V) characteristics of the data being processed. What is more, it differs depending on the data source used, information needs and data format (structured, unstructured).
For this chapter the following models and issues were considered:
- Generic Statistical Business Process Model (GSBPM, 2013) [6]- Big Data Life-Cycle Management [7]- Infrastructure and skills needs in the context of AIS data as Big Data source [8]-
In accordance to WP8 [9], we subdivided the statistical process into four steps as defined by the Generic Statistical Business Process Model.
Collect Process Analyze Disseminate
In the next paragraphs, we show how statistical offices already use AIS data and demonstrate how one could deal with AIS data in each of the four phases in the context of producing statistical data.
Three cases from three statistical officesIn this paragraph, three cases will be described. The first case is the Norwegian case, who use AIS data for emission estimates. The second is the Dutch case, who uses AIS data for creating a frame of ships visiting the different ports in the Netherlands. The third case is the Polish case, who uses AIS data for creating a frame of ships to increase the quality of statistical surveys by linking AIS data to maritime survey. All cases use a service for (pre-) processing the data.
The Norwegian Case
Statistics Norway collaborates with Kystverket – The Norwegian Coastal Administration (www.kystverket.no), who produces AIS based statistics that are made available at www.havbase.no and www.havbase.no/havbase_arktis (in Norwegian). There is potential for improving emission statistics on greenhouse gases [10] and on emissions of acidifying gases and ozone precursors [11] at
29

Statistics Norway by using AIS data from Kystverket. For this, Kystverket will prepare aggregated data using the classification needed by Statistics Norway. This is an example of good distribution of work between institutions.
The Dutch Case
In the Netherlands, AIS data is used for creating a frame of vessels visiting the Netherlands. Using this frame, Statistics Netherlands is able to detect missing data. The data is bought from Dirkzwager, who distillates the visits of vessels from the AIS stream and sends it once every month to Statistics Netherlands. There, the data is linked to the Dutch customs data to create official maritime statistics.
The Polish Case
In Poland, AIS data is used for creating a reference frame of ships visiting the Polish ports. Statistics Poland uses AIS data to improve the quality of statistical surveys by linking AIS data to maritime survey data. Thanks to this approach, we check the completeness of the maritime survey and the parameters of the ships inserted by the respondents of the survey.
Collect AIS dataIn this phase, all the necessary information (data and metadata) is collected, using different collection modes, and then loaded into the appropriate environment for further processing.
There are many possible sources for obtaining AIS data (eg public maritime offices, private companies, commercial tracking services) and levels of data (eg national, European, worldwide).
As for the technical aspect of collecting AIS-data, there are two possible approaches:
transfer of archived historical data
live streaming data
Regardless of the choice of the AIS data provider, as well as the method of data collection, stability and sustainability of the source is important from the statistical process.
After collecting the data, it is necessary to decode the data. The received AIS message are in NMEA format (raw data), which is a text encoded binary format.
AIS consist of several types of records: dynamic data (information on ship movements, where the message id is 1, 2, 3 or 21) and static and voyage data (information on ship characteristics and current voyage, where the message id is 5).
The timestamps are technically not part of most of the data sources collected, but are transmitted as separate messages in the AIS stream.
After the process of decoding, the AIS data can be uploaded to a Big data cluster/ database, e.g. Hadoop Distributed File System (HDFS). From here the data is available for the further steps of the statistical process.
30

Figure 4.1: process of collecting AIS data
During this phase, we could choose to filter out only fields necessary for further analysis. This brings back the size of the total data set, making it easier to process the data during the next phases. However, within the rest of the process we should still be able to identify individual ships. Another point of concern is the identification of individual ships in AIS data. Especially when the ship is owned by an individual, the data is personal data. This means that the data should be protected on a technological level.
Processing AIS dataThe aim of this phase is to validate, integrate and transform data to prepare the data for analysis.
In AIS-data, we can specify two types of errors Human errors and Technical errors. Human errors are related to static information (MMSI, IMO number, ship’s name , call sign, type, length) or voyage data (draught, destination). Since an AIS device is an autonomous device on board of the ship, these data are not obligatory to be added automatically. They are entered by change of values (voyage) or by installation of the AIS device (static). It is worth noting that voyage data must be manually updated after each port visit.
Technical errors are related to dynamic data (such as position of ship, speed, course, rotation) which comes from the AIS device (sensors, cables and antenna).
These errors are the result of transmission errors. These transmission errors can be between the GPS network and the device and between the device and the AIS receivers. These transmission errors can result in erroneous positions and identification of the vessels. Detailed information on the errors in AIS data can be found in deliverable 4.2.
As part of the sub-process data integration, we can link validated AIS data with data from maritime statistics, using the MMSI number. Thanks to this, it will be possible to explore data in the analyze phase and obtain new statistics or additional knowledge.
Analysing AIS dataIn this phase, statistical outputs are produced, examined in detail and made ready for dissemination. This stage is iterative in nature. Various types of visualizations and statistical analysis are made to ensure correct interpretation of results and adapted reports. For these analysis, applications like R can play a formidable role. Please note that, especially in exploratory studies, it can be that analysis can result in changes in data processing or even data collection.
31

Disseminating AIS dataThe main purpose of this is to enable the presentation of AIS-data in the form of reports containing charts, tables and cartograms to users. Visualizations created during this phase are different and have a different purpose as visualizations during the analyzing phase. These visualizations are more about storytelling, giving insights and show trends in the data.
InfrastructureFor each of the aforementioned processing steps, requirements can be formulated concerning the infrastructure. In this section, we will go through the processing steps and sketch the needed infrastructure.
Collect
As already mentioned, there is a difference between streaming data collection and batched data collection. Collecting the streaming data means that we have to have a failsafe infrastructure with backup functionality. When servers are down, no data is collected and there should be a backup server that takes over the collection. In case of batched data collection, the data is collected, for instance, every day. This kind of data collection does stress the infrastructure less. Please note, however, that making the collection periods longer the size of the data and the computational power for processing increases. We suggest to keep the batch size smaller than or equal to one day.
Furthermore, since the data is sensitive, it is imported into a save environment directly.
Process
Until now we processed that AIS data in a SPARK environment. The data was stored in HDFS. The experience of Statistics Netherlands with road sensor data is that breaking down the data into small batch sizes makes it possible to do part of the processing on a normal infrastructure. For AIS data we can conclude that decoding the messages and encrypting the crucial fields can be done on a normal infrastructure. More complicated analysis, like determining routes and extracting visits, should be done on distributed environments like Spark. Storage of the data should be done on high performance big data file systems and databases are really needed to store the data.
Analyse
During analysis, it is important to have a performant environment available. Many data, perhaps data for more than a year, needs to be aggregated and analysed. Spark is a good tool to use for this. It should be noted that integration with analysis tools (like R and elastic search) is a necessity for using in the analysis phase.
Dissemination
Dissemination is comparable with disseminating traditional statistics. The same tools and infrastructure can be used.
SkillsUsing AIS in statistical processes asks for some new skills. These comprise:
Knowledge about big data infrastructures
32

Programming in Scala Developing on Spark High performance computing skills Using tools like R and Elasticsearch Able to reflect on processing and analysis steps Data science and statistics skills Visualisation skills
It should be noted that this list is not exhaustive, but should give a good idea on the needed skills.
5. Future workA new ESSnet Big Data has been planned to run from the end 2018 until 2020. One of the principal aims of this ESSnet will be to develop functional production prototypes and promote and support their implementation in a limited number of participating NSI’s.
The aim of this pilot is to link improved AIS data to data from port authorities and customs. In addition, the implementation should improve data on the next destination of ships (traffic matrices) and calculate the distance travelled by ships. By improving the quality of the average distance matrix for all ports, the calculation of transportation volume in tonkilometers also can be improved. And focusing on a more specific category, for the Dutch department of National Accounts we want to see whether distance travelled for Dutch-owned ships can be obtained.
Although there is a lot of work done in this work package, some topics need further research. Table 6 lists these topics for future research.
Number Problem Method1. AIS data does not provide reliable
information on the type and capacity of the ships
Combine information with IHS and online information
2. Processing of AIS data requires much processing power
Filter out positional data in which speed and heading of the ship have not changed since the last data point.
3. Statistical offices and port authorities lack information on intra-port traffic
Develop an algorithm detecting intra-port movements
4. Statistical offices and port authorities would like information on disruptions or (changed) regulations in ports and fairways
Develop an algorithm signalling anomalies in the movements of ships (e.g. different traffic intensities or travelling speeds)
5. Ports and terminals have to be defined manually, this is not feasible for countries with many ports
Build an algorithm that can construct a reference frame of ports. The next step would be to construct a reference frame of terminals. Combining this with type of visiting ship could assist with ship visits where type of ships or goods is missing (see problem 4)
6. Distance measures using linear interpolation are inaccurate for areas in which geography is complicated.
Combine AIS data with geographic information
7. Eurostat’s port to port Matrix is not optimal. Investigate more journeys and factors to improve the port to port distance matrix. Optimizing algorithms could also result in using actual AIS journey data instead of the average distance matrix.
33

8. Not all types of fluvio-maritime transport were examined and research should be extended to other countries where fluvio-maritime transport plays a role (e.g., France, Germany, Belgium and the United Kingdom)
Analyse maritime ships travelling on inland waterways closer to maritime ports and inland waterway ships travelling outside inland waterways (i.e. the North Sea). Also perform analysis for other countries.
9. More insight is needed into the relationship between maritime and IWW transport, providing more information on transit trade, traffic intensity
Extend research on fluvio-maritime transport to the relationship between maritime and IWW transport
11. National offices are really interested in fast indicators of economic development
Investigate if AIS could be used as a fast indicator of international trade, where international comparisons can be made quickly.
13. Privacy implications, especially for inland waterway vessels, are still not clear
Investigate privacy issues concerning AIS
14. To monitor ship’s journeys around the world, worldwide AIS data is needed
Investigate possibilities for gaining worldwide AIS dataset and investigate the quality of this source
Table 6: topics for future research
The final description for the work to be done in the new ESSnet has to be worked out in the next couple of months. It should be defined which ideas would have to be investigated or developed further into actual implementation. The ideas for future work on AIS data could be part of this new ESSnet if Eurostat values the ideas for all NSI’s.
34

6. References1. Working Group on Maritime Transport Statistics 23-24 May 2016
https://circabc.europa.eu/webdav/CircaBC/ESTAT/MOTST/Library/Maritime%20Transport%20Statistics/Meeting%20of%2023-24%20May%202016/Final%20minutes.pdf
2. Modal share of freight transport to and from EU ports, (IP/B/TRAN/IC/2014-065), PE 540.350, 2015 (EN) http://www.europarl.europa.eu/RegData/etudes/STUD/2015/540350/IPOL_STU(2015)540350_EN.pdf
3. EC Communication Ports: an engine for growth - COM(2013) 295 final.4. Westerberg, Andreas, "A cost benefit analysis of the AIS [Automatic Identification System]
system in Sweden" (2006).World Maritime University Dissertations. 145. http://commons.wmu.se/all_dissertations/145
5. Results of the questionnaire: “The use of AIS data for making statistics” https://webgate.ec.europa.eu/fpfis/mwikis/essnetbigdata/images/3/3c/WP4_Results_questionnaire_on_the_use_of_AIS_data_in_NSIs_2017_11_13.pdf
6. GSPBM (2013) Generic Statistical Business Processing Model version 5.0. https://statswiki.unece.org/display/GSBPM/GSBPM+v5.0
7. Revisiting the Data Lifecycle with Big Data Curation: www.ijdc.net/article/download/10.2.176/415/
8. Statistics Netherlands (2015) A first for Statistics Netherlands: launching statistics based on Big Data: https://www.cbs.nl/NR/rdonlyres/4E3C7500-03EB-4C54-8A0A-
9. WP8 Deliverable 8.3 Report describing the IT-infrastructure used and the accompanying processes developed and skills needed to study or produce Big Data based official statisticshttps://webgate.ec.europa.eu/fpfis/mwikis/essnetbigdata/images/1/10/WP8_Deliverable_8.3_IT_Report_2018_03_05_final.pdf
10. www.ssb.no/en/natur-og-miljo/statistikker/klimagassn
11. www.ssb.no/en/natur-og-miljo/statistikker/agassn
35

Annex 1: SGA-1 of WP4 in more detail
Work package number 4Start date:
End date:
1.2.2016
31.7.2017
Title AIS Data
Partner/co-beneficiary NL
120
DK
60
EL
40
NO
67
PL
40
Aim of this work package is to investigate whether real-time measurement data of ship positions (measured by the so-called AIS-system) can be used 1) to improve the quality and internal comparability of existing statistics and 2) for new statistical products relevant for the ESS. Improvement of quality and internal comparability can be obtained e.g. by developing a reference frame of ships and their travels in European waters and then linking this reference frame, by ship number, to register-based data about marine transport from port authorities. These linked data can then be used for emission calculations. New products can be developed for e.g. traffic analyses. The added value of running a pilot with AIS-data at European level is that the source data are generic word wide and data can be obtained at European level. Challenges ahead with this dataset are: obtaining the data at European level, processing and collecting the data in such way that they can be used for multiple purposes, and visualising the results. A part of this work package is also to look into AIS analyses done by others and to investigate the possibility of obtaining already processed data as input for creating comparable official statistics. Especially it is important to make contact with other public authorities. This work package may require data acquisition in collaboration with Eurostat.Methodological, quality and technical results of the work package, including intermediate findings, will be used as inputs for the envisaged WP 8 of SGA-2, in case SGA-2 will be realised. When carrying out the tasks listed below, care will be taken that these results will be stored for later use, by using the facilities described at WP 9.
Task 1 – Data access.
AIS-data are available for national territories and the entire European territory. For example, AIS-data in the Netherlands are provided by Rijkswaterstaat (a government agency which is part of the Ministry of Infrastructure and the Environment). It is expected that similar agencies in other countries have the AIS-data for their national territories. At the European level, a dataset of AIS data is available at the European Maritime Safety Agency (EMSA). The advantage of using one AIS-dataset for the entire European territory is a) a better comparison of international traffic between the
36

countries and b) more synergy as all participating countries work on the same dataset. A disadvantage is that these data are stored by private companies and handling fees have to be paid. Aim of this task is to decide how European data could be used for this project, to investigate the possibilities of acquiring data from EMSA (to be coordinated with Eurostat) and, if European data are too costly or too hard to obtain, how national datasets can be obtained.
This task will involve:
Exploration of the possibilities to collect the data at a European (or worldwide) level.
Participants: NL, DK, EL, NO, PL
Task 2 – Data handling
Aim of this task is to process and store the data in such a way that they can be used for consistent multiple outputs, like linking AIS-data with data from port authorities traffic analyses Inference of journeys from AIS data.Key elements of this task are:
which programming language and environment should be used for transformation
where will the data be processed (in each NSI, by NSIs at European level, by data holders)
how can we create an environment which is easily accessible for all partners
Participants: NL, NO, PL, and possibly DK (if national sources are used)
Task 3 – Methodology and Techniques
Develop traffic statistics: Linking with data from port authorities.AIS-data may be linked to data from port authorities. Added value of linking AIS-data to data from port authorities is that the same reference population (= ship number) is used in all harbours. As the journeys and harbour visits of ships can be derived from AIS this linking provides the ESS information about the origin/destination of the cargo, too.
Aims of this task are: to build a reference frame of ships in European water (based on AIS-data) to find out how data from port authorities can be linked to AIS-data to check whether information improves the quality of current
37

statistical outputs and provides more information about the origin/destination of the cargo.Participants: NL, NO, PL
Traffic analysesThe number of ships during a certain time interval at certain coordinates (like inland waterways or at certain points at sea) can be calculated by AIS-data. This possibility will be explored because this information could be interesting for traffic analyses and economic analyses.
Aims of this task are: calculate the number of ships at certain coordinates visualise the results to analyse variations in timeParticipants: NL, NO, PL, EL
Estimate emissions (envisaged under SGA-2)This task involves following individual vessels through time. Consequently we can infer the journeys from the data. Combined with a model to estimate the emission of vessels (which depends on travel distance, speed, draught, weather conditions and characteristics of the vessel itself), emissions of e.g. CO2 and NOx can be estimated per ship and per national territory.
An advantage of doing these analyses on a European scale– instead of the national level – is that more precise estimates for emissions at national territories can be made.
Aim of this task is 1) to infer journeys from AIS-data, 2) visualise the results, 3) combine these journeys with a model to calculate emissions and 4) estimate the impact of carrying out these calculations at the European level on the quality of emissions calculations.
Task 4 – Future perspectives (envisaged under SGA-2)
Aim of this task is to summarise the project results and perform a qualitative cost-benefit analysis of using AIS-data for official statistics. These analyses should include aspects like sustainability of the data source, possibilities of improving international comparability, possibilities of data sharing (at micro- or aggregated level), quality improvement of current statistics and a sketch of a possible statistical process and needed infrastructure.
Deliverables (SGA-1 only):
4.1 Report on creating a database with AIS-data for official statistics: possibilities and pitfalls
Month 6
4.2 Report about deriving port visits and linking data from port authorities with AIS-data
Month 12
4.3 Report about sea traffic analyses using AIS-data Month 18
38
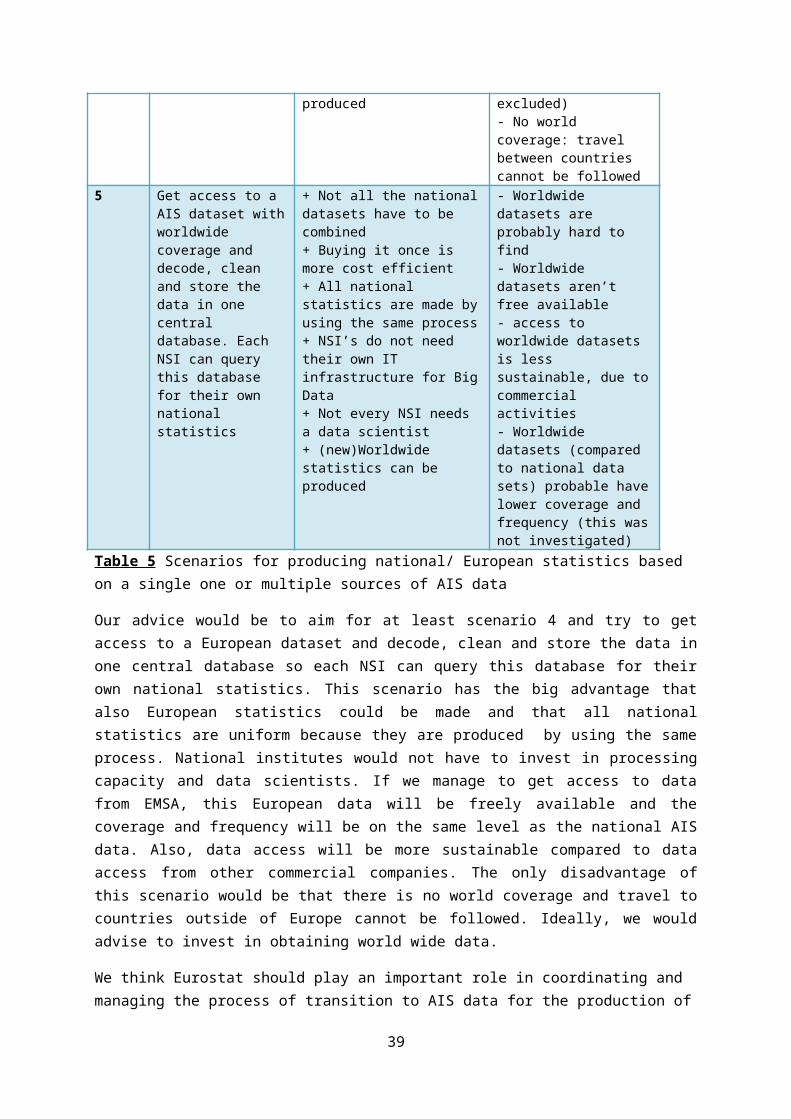
Milestones (SGA-1 only):
4.4 Progress and technical report of first internal WP-meeting Month 44.5 Progress and technical report of second internal WP-meeting Month 9
39

Annex 2: SGA-2 original scope of WP4 in more detail
Work package number 4Start date:
End date:
1.8.2017
31.5.2018
Title AIS Data
Partner/co-beneficiary
(person days)
NL
88
DK
53
EL
66
NO
21
PL
35
Description of the work packageAim of this work package is to investigate whether real-time measurement data of ship positions (measured by the so-called AIS-system) can be used 1) to improve the quality and internal comparability of existing statistics and 2) for new statistical products relevant for the ESS. Improvement of quality and internal comparability can be obtained e.g. by developing a reference frame of ships and their travels in European waters and then linking this reference frame, by ship number, to register-based data about marine transport from port authorities. These linked data can then be used for emission calculations. New products can be developed for e.g. traffic analyses. The added value of running a pilot with AIS-data at European level is that the source data are generic worldwide and data can be obtained at European level.
Challenges ahead with this dataset are: obtaining the data at European level, processing and collecting the data in such way that they can be used for multiple purposes, and visualising the results. A part of this work package is also to look into AIS analyses done by others and to investigate the possibility of obtaining already processed data as input for creating comparable official statistics. Especially it is important to make contact with other public authorities. This work package may require data acquisition in collaboration with Eurostat.
Methodological, quality and technical results of the work package, including intermediate findings, will be used as inputs for WP 8 of SGA-2. When carrying out the tasks listed below, care will be taken that these results will be stored for later use, by using the facilities described at WP 9.
SGA-2 of WP 4 will deliver the products below:
Task 3 – Methodology and Techniques
Estimate emissionsThis task involves following individual vessels through time. Consequently we can infer the journeys from the data. Combined with a model to estimate the emission of vessels (which depends on travel distance, speed, draught, weather conditions and characteristics of the vessel itself), emissions of e.g. CO2 and NOx can be estimated per ship and per national territory.
40

Estimation of emissions based on only AIS data is impossible. At least, we need to know what the emission should be given, a.o., draught, speed and weather conditions. There are several sources that can be used to get information about the emission of vessels. For example Lloyds Register of Shipping.
Also, all ships have to register their emissions, so there is data available at the freight ship companies. A dataset for the same period as the AIS dataset could be used to model the emissions based on the variables mentioned above. We assume getting these needed data for free for this pilot.
Furthermore, satellite data is available for emissions (see, for instance http://www.globemission.eu), which shows very clearly the maritime routes. This satellite data could be used as a more direct source for measuring emissions and maybe for testing our model. Another possibility to test the model is to compare the estimated emissions by the model with the real fuel purchase or information coming from vessel’s oil record book.
An advantage of doing these analyses on a European scale– instead of the national level – is that more precise estimates for emissions at national territories can be made.
Aim of this task is to develop and test a methodology for estimating vessel emissions based on AIS data by:1) inferring journeys from AIS-data2) visualising the results3) investigating methodology for calculating emissions4) combining these journeys with a model to calculate emissions5) Testing the model and6) estimating the impact of carrying out these calculations at the European level on the quality of emissions calculations.
Participants: Norway, Netherlands , Denmark, Greece, Poland
Task 4 – Access to and analysing AIS data from EMSA
AIS-data are available for national territories and the entire European territory. In this work package we use European AIS data from Dirkzwager. But for the future we would like to get free European AIS data. That is why we try to get AIS data at the European level from the European Maritime Safety Agency (EMSA).
In SGA-2 we focus on getting the European AIS data from EMSA and compare these two sources (AIS data from EMSA and Dirkzwager) on their coverage and quality. We will assess the quality of both sources by applying the quality framework. We also describe the strengths and weaknesses of both sources compared with existing maritime data.
This work package may require data acquisition in collaboration with Eurostat, because we would like Eurostat to apply for the data at EMSA’s. Eurostat already received AIS data from EMSA for other projects and Eurostat can apply EMSA data for all the partner countries once. This will be better than applying for
41
each country separated. If we do not get access to the EMSA data we cannot process this task and we cannot deliver deliverable 4.7, but it has not any consequences for the other deliverables in this WP. Not getting AIS data from EMSA means that we cannot get AIS data on the European level for free.
Participants: Netherlands , Denmark, Greece, Poland
Task 5 – New statistical output
Aim of this task is to explore possibilities of new statistical products (for example interport statistics) by using AIS data. This task also includes analysing and elaborating scenarios for production of European and national statistics based on one single European data source of AIS data.
Participants: Norway, Netherlands, Denmark, Greece, Poland
Task 6 – Future perspectives
Aim of this task is to produce a consolidated report summarising the contents and the outcomes of WP 4. This report also includes a cost-benefit analysis of using AIS-data for official statistics. The report should also include aspects like sustainability of the data source, possibilities of improving international comparability, possibilities of data sharing (at micro- or aggregated level), possibilities of meeting the needs of both European and national statistics by one European AIS database, quality improvement of current statistics and a sketch of a possible statistical process and needed infrastructure, including technical skills required to generate statistical outputs from the source data.
Participants: Norway, Netherlands, Denmark, Greece, PolandDeliverables (SGA-2 only):4.6 Report on estimating emissions. This report will describe the investigated
methodology for calculating emissions and the reason why we choose for a certain methodology. The report also describes the created model itself (inclusive other needed data sources) and the results of testing the model. Finally this report also describes the impact of carrying out these calculations at the European level on the quality of emissions calculations.
Month 13
4.7 Report about the results of comparing the quality and coverage of the European AIS data from Dirkzwager and EMSA (by applying the quality framework). Also the strengths and weaknesses of both sources will be compared with existing maritime data.
Month 15
4.8 Report about possible new statistical output based on European AIS data. The report also describes analysed and elaborated scenarios for production of European and national statistics based on one single European data source of AIS data.
Month 16
4.9 Consolidated report on project results including a cost-benefit analysis of using AIS-data for official statistics.
Month 17
42

Milestones (SGA-2 only):4.10 Progress and technical report of first internal WP-meeting Month 94.11 Progress and technical report of the second internal WP-meeting Month 14
Annex 3: SGA-2 adjusted scope of WP4 in more detail
Work package number 4Start date:
End date:
1.8.2017
31.5.2018
Title AIS Data
Partner/co-beneficiary
(person days)
NL
88
DK
53
EL
66
NO
21
PL
35
Description of the work packageAim of this work package is to investigate whether real-time measurement data of ship positions (measured by the so-called AIS-system) can be used 1) to improve the quality and internal comparability of existing statistics and 2) for new statistical products relevant for the ESS. Improvement of quality and internal comparability can be obtained e.g. by developing a reference frame of ships and their travels in European waters and then linking this reference frame, by ship number, to register-based data about marine transport from port authorities. These linked data can then be used for emission calculations. New products can be developed for e.g. traffic analyses. The added value of running a pilot with AIS-data at European level is that the source data are generic worldwide and data can be obtained at European level.
Challenges ahead with this dataset are: obtaining the data at European level, processing and collecting the data in such way that they can be used for multiple purposes, and visualising the results. A part of this work package is also to look into AIS analyses done by others and to investigate the possibility of obtaining already processed data as input for creating comparable official statistics. Especially it is important to make contact with other public authorities. This work package may require data acquisition in collaboration with Eurostat.
Methodological, quality and technical results of the work package, including intermediate findings, will be used as inputs for WP 8 of SGA-2. When carrying out the tasks listed below, care will be taken that these results will be stored for later use, by using the facilities described at WP 9.
SGA-2 of WP 4 will deliver the products below:
Task 3 – Methodology and Techniques
Estimate emissionsThis task involves following individual vessels through time. Consequently we can
43

infer the journeys from the data. Combined with a model to estimate the emission of vessels (which depends on travel distance, speed, draught, weather conditions and characteristics of the vessel itself), emissions of e.g. CO2 and NOx can be estimated per ship and per national territory.
Estimation of emissions based on only AIS data is impossible. At least, we need to know what the emission should be given, a.o., draught, speed and weather conditions. There are several sources that can be used to get information about the emission of vessels. For example Lloyds Register of Shipping.
Also, all ships have to register their emissions, so there is data available at the freight ship companies. A dataset for the same period as the AIS dataset could be used to model the emissions based on the variables mentioned above. We assume getting these needed data for free for this pilot.
Furthermore, satellite data is available for emissions (see, for instance http://www.globemission.eu), which shows very clearly the maritime routes. This satellite data could be used as a more direct source for measuring emissions and maybe for testing our model. Another possibility to test the model is to compare the estimated emissions by the model with the real fuel purchase or information coming from vessel’s oil record book.
An advantage of doing these analyses on a European scale– instead of the national level – is that more precise estimates for emissions at national territories can be made.
Aim of this task is to investigate existing models for deriving emissions and describe how we could implement these models in our statistical processes. We also will investigate possibilities for improving emission statistics by using AIS data.
Participants: Norway, Netherlands , , Greece, Poland
Task 4 – Access to and analysing AIS data from EMSA
AIS-data are available for national territories and the entire European territory. In this work package we use European AIS data from Dirkzwager. But for the future we would like to get free European AIS data. That is why we (together with Eurostat) try to get AIS data at the European level from the European Maritime Safety Agency (EMSA).
In SGA-2 we focused on getting the European AIS data from EMSA. Unfortunately, we did not succeed in getting access to data from EMSA During SGA-2. We did obtain satellite data from LuxSpace covering the Mediterranean Sea for the same period as the Dirkzwager data. So we could assess the quality of satellite data by comparing it to the DZ data and the national AIS data from Greece.
Participants: Netherlands, Greece, Poland
Task 5 – New statistical output
44
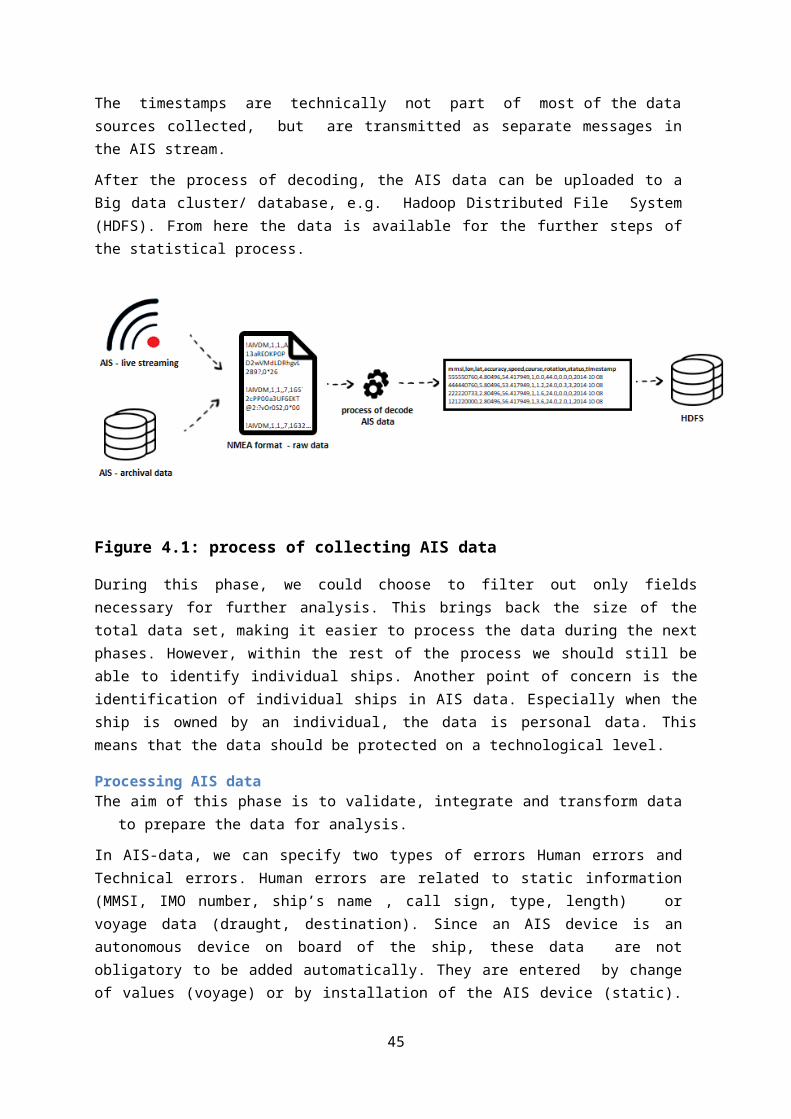
Aim of this task is to explore possibilities of new statistical products (for example interport statistics) by using AIS data. This task also includes analysing and elaborating scenarios for production of European and national statistics based on one single European data source of AIS data.
Participants: Norway, Netherlands, Greece, Poland
Task 6 – Future perspectives
Aim of this task is to produce a consolidated report summarising the contents and the outcomes of WP 4. This report also includes a cost-benefit analysis of using AIS-data for official statistics. The report should also include aspects like sustainability of the data source, possibilities of improving international comparability, possibilities of data sharing (at micro- or aggregated level), possibilities of meeting the needs of both European and national statistics by one European AIS database, quality improvement of current statistics and a sketch of a possible statistical process and needed infrastructure, including technical skills required to generate statistical outputs from the source data.
Participants: Norway, Netherlands, Greece, PolandDeliverables (SGA-2 only):4.6 Report on estimating emissions. This report will describe the results of
investigating existing models for calculating emissions. The report also will describe the results of investigating possibilities for improving emission statistics by using AIS.
Month 13
4.3 Supplementing Deliverable 4.3 on the quality of AIS data with a comparison of the quality and coverage of the European AIS data from Dirkzwager and the Satellite data from LuxSpace. The satellite data will also be compared to the National AIS data from Greece.
Month 15
4.7 Report about possible new statistical output based on European AIS data. The report also describes analysed and elaborated scenarios for production of European and national statistics based on one single European data source of AIS data.
Month 16
4.8 Consolidated report on project results including a cost-benefit analysis of using AIS-data for official statistics.
Month 17
Milestones (SGA-2 only):4.10 Progress and technical report of first internal WP-meeting Month 94.11 Progress and technical report of the second internal WP-meeting Month 14
45

Annex 4: exact questions posed in the expert questionnaire
The use of AIS data for making statisticsThis questionnaire has been designed and built by the work package on AIS data (WP4 ) of the on-going European research project ESSnet on Big Data. In WP4, we investigate whether real-time measurement data of ship positions (measured by the so-called AIS-system) can be used: 1) to improve quality and internal comparability of existing statistics 2) for new statistical products relevant for the ESS See our WIKI page: https://webgate.ec.europa.eu/fpfis/mwikis/essnetbigdata/ for a detailed description and the results of this work package (until now). The results of this questionnaire will be used as input for the remainder of WP4. So please fill it out before June 16 2017.If you need more time, please let us know.Thank you in advance for your contribution!0.1 Country/NSI
0.2 Contact person
0.3 Do you have access to AIS data in your NSI?
0.4 In your opinion, is the use of European AIS data for making statistics beneficial?
0.5 What do you think are the disadvantages of using AIS data for official statistics?
0.6 What do you think are the biggest challenges in using AIS data for official statistics?
0.7 Is your NSI interested in using European AIS data in maritime statistics? Please explain why.
0.8 Please explain how the use of European AIS data in maritime statistics could reduce response burden for your country?
0.9 Which role should Eurostat play in making maritime statistics by using European AIS data? For example: For which types of maritime statistics could using European AIS data be beneficial (maritime transport statistics, vessel port calls, maritime routes/port distances, maritime emissions, other)? Should Eurostat do the processing of the AIS data for any of these statistics?
0.10 Does your NSI use national AIS data for maritime statistics? If yes, please give a short description.
0.11 Comments (if you are aware), indicate whether other public administrations in your country have access to AIS data for official statistics purposes.1 Problems in current maritime1.1 In this section, we describe existing problems with current maritime statistics. WP4 will be investigating whether the problems could be (partly) solved by using AIS. Do you recognize these problems in your NSI? (more information about the definition of the problems in Appendix I)
Information on the previous and next ports of ships is incomplete
Not all ports are well-specified, they are sometimes misclassified by port authorities Distance travelled per ship is now based on an inaccurate average distance matrix for
ports.
46

Fluvio-maritime transport is incomplete More information on the relationship between maritime and inland waterway
transport is needed Intra-port travel distances are unknown Missing information on travel routes for goods to estimate unit prices for transit trade
statistics Current statistics on fuel consumption and emissions are not accurate enough Small ports experience response burden from surveys Customers need faster information on maritime statistics More insight is needed in (dynamics of) hub functions of different ports. This can be
accomplished by visualizations on hub functions of different ports1.2 Do you see other problems which could be solved in current statistics by using AIS data? New products of maritime official statisticsHere follow a few questions on new products using AIS data2.1 We are working on one new statistical product (Intra-port travel distances) by using AIS data. Is this a product your NSI is interested in?2.2 Are you interested in now-casting economic time series on the basis of AIS data?
2.3 Do you have other (experimental) ideas for new statistical products by using AIS data?
47