Embed Size (px)
Citation preview

© WorldpanelTM division of TNS 2006
Tomorrows CategoriesDaventry – October 2006
Edward GarnerCommunications Director Worldpanel – UK

© WorldpanelTM division of TNS 2006
Agenda
Health
Enjoyment
Convenience
Pester Power
The Multi-Cultural Table
The Ethical Consumer

© WorldpanelTM division of TNS 2006
HEALTHHEALTH
ENJOYMENTENJOYMENT
PRACTICALITYPRACTICALITY
The core drivers of consumption

© WorldpanelTM division of TNS 2006
®
ENJOYMENT
PRACTICALITY
HEALTH
Worldpanel Usage In Home – Ann to May 2006
1995 200610 year trend
11%
34%
55%
BSE, Foot & Mouth, Sudan 1,Child Obesity, Jamie Oliver, Bird Flu,Supersize me, Salt & sugar content,
Functional Foods, 5 a day, Fruit for schools
Organics/ premium, Taste the difference,Sharing, Café culture, Eating out,
Debit Credit, Treating
Ready Meals, Light meals,Snacking, Budget, Microwave,
Individual portions, Quick to cook
23%
42%
35%
E
PH

© WorldpanelTM division of TNS 2006
®
ENJOYMENT
PRACTICALITYHEALTH
+4.7%
-0.5%
-1.9%
Macro Consumption Drivers….change in last year
25.2b occasions
30.1b occasions
16.1b occasions
Worldpanel Usage In Home – Ann to May 2006

© WorldpanelTM division of TNS 2006
In home snacking has seen a +5%
growth over the last 10 years
Worldpanel Usage In Home
But, in the last 3 years has seen a 4%
decline
Health affecting not just what we eat but how we eat!

© WorldpanelTM division of TNS 2006
+ 18%
+ 37%
+ 35%
Last 3 years
- 8%
- 7%
-10%
Worldpanel Usage In Home – Ann to Nov 2005
Last 10 years
Core ‘snacking’ categories at the heart of the declining occasions

© WorldpanelTM division of TNS 2006
23
19
10
2
1
1
36
32
76
80Vegetables/salad
Fruit
Fish
Bread/Cereals/Pasta/Rice/Potatoes
Nuts/Beans/Lentils/Chick Peas
Milk/Dairy Products
Meat
Salt
Food or Drinks containing Sugar
Foods containing Fat
“Foods should be eating more of…”
Source: FSA Consumer Attitudes to Food Standards conducted by TNS (3121, respondents 2003)
(0)
(0)
(+1)
(+2)
(+1)
(0)
(-2)
(+3)
(+2)
(+2)
() = % change from 2002

© WorldpanelTM division of TNS 2006
Health now accounts for 1 in 5 meal occasions within the homeas a primary reason for consumption. Fish is most aligned to this.
% of Individual Occasions consumed for Health
20.1
10.4
31.7
40.2
13.3
5.8
5.8
7.5
16
14.3
Total Foods
POULTRY/MEAT/FISH
Total Fresh Fish
Fresh Salmon
Smoked Salmon
Beef
Lamb
Pork
Chicken
Total Turkey
TNS Worldpanel Usage – 52 W/E November 2005 (% change v 2004)
% change consumed for
Health alone (2005 v 2004)
© WorldpanelTM division of TNS 2006
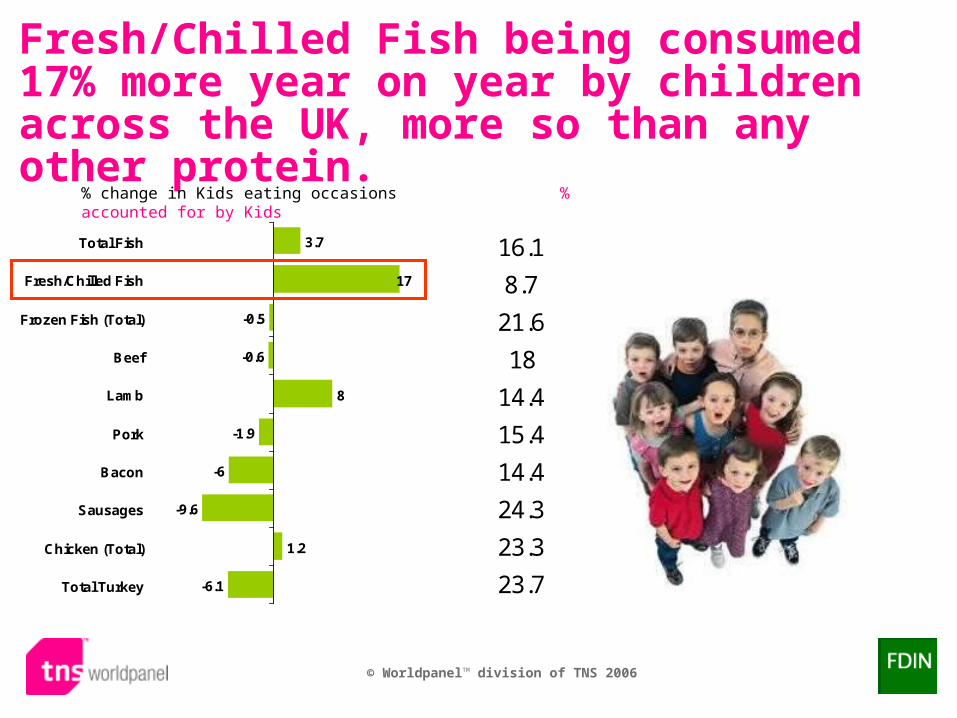
Fresh/Chilled Fish being consumed 17% more year on year by children across the UK, more so than any other protein.
16.1
8.7
21.6
18
14.4
15.4
14.4
24.3
23.3
23.7
3.7
17
-0.5
-0.6
8
-1.9
-6
-9.6
1.2
-6.1
Total Fish
Fresh/Chilled Fish
Frozen Fish (Total)
Beef
Lamb
Pork
Bacon
Sausages
Chicken (Total)
Total Turkey
% change in Kids eating occasions % accounted for by Kids

© WorldpanelTM division of TNS 2006
Fresh fish also more likely to increase consumersfruit & vegetable intake.
% of Fish occasions consumed with Fresh Fruit and Vegetables
76.3
52.6
Fresh/ChilledFish
Frozen Fish
+13.4%
-2.7%
TNS Worldpanel Usage – 52 W/E November 2005 (% change v 2004)
Note: Not a standard deliverable

Overall Market Sizes
Measures = £ Millions 52 w/e Aug
14 2005 52 w/e Aug
13 2006 % ChangeFruit 3,304 3,523 6.6Vegetables 3,738 3,801 1.7
Dessert Apples 629 627 0Banana 560 587 5Tomato 530 526 -1Berries+Currants 420 512 22Easy Peelers 264 274 4Grape-White 248 262 6Pears 163 173 6Orange 146 145 -1Grape-Red 126 137 9Melons 107 108 1Nectarines 88 100 14Plums 86 88 2Cherries 63 70 11Avocado 45 49 9Kiwi Fruit 45 48 7Peaches 45 45 0Grapefruit 47 44 -5Mango 39 44 11Lemon 37 38 2Pineapples 27 37 35Grape-Mixed Pack 26 36 41Cooking Apples 30 29 -2Apricot 17 18 9Dates 14 15 8

2.50.041.491.46Price per Vol
0.60.011.61.5Trip Vol
3.10.072.322.25Trip Spend
3.93.6596.993.3AWP (Vol per Buyer)
6.58.86144.60135.74AWP (Spend per Buyer)
3.32.0162.360.2Purchase Frequency
-0.1-0.0699.199.2Penetration %
4.09135623614952270139Volume (000s Units)
6.621941435234083303995Expenditure (£000s)
% Change
Actual Change
52 w/e 13 Aug 06
52 w/e 14 Aug 05
0 50000 100000 150000 200000 250000
Penetration % Purchase Frequency
Trip Vol Price per Vol
Key Performance Indicators for Total Fruit - Value up 6.6% worth £219.4m
Expenditure (£000s)
Volume (000s Units)
Penetration % *
Purchase FrequencyTrip Vol
AWP (Vol per Buyer)
Price per Vol
£3523.4m +6.6%
Increase of £219.4m
2361.5m vol +4%
Contribution = £134.8m
99.1% -0.1%
Contribution = £3712k
62.3 trips +3.3%
Contribution = £112.5m
1.6 vol +0.6%
Contribution = £18.5m
96.9 vol +3.9%
Contribution = £131.1m
£1.49 +2.5%
Contribution = £84.7m
* Pen Contribution includes Population
growth of 0.2%

© WorldpanelTM division of TNS 2006MATs to July
Fresh Proteins – 10 year trends
0
200,000
400,000
600,000
800,000
1,000,000
1,200,000
1,400,000
1,600,000
1995
1996
1997
1998
1999
2000
2001
2002
2003
2004
2005
2006
Sp
en
d (
£0
00
s)
Fresh Beef Fresh Lamb Fresh Pork
Fresh Poultry Fresh Sausages Fresh Fish
Chilled fish is the fastest growing fresh protein sector overtaking pork during 1997, now reaching similar levels to beef and poultry

© WorldpanelTM division of TNS 2006
Frozen Proteins – 10 year trendsFrozen Fish, the dominant sector, is the only sector to show growth over the last 10 years. Poultry has experienced the most significant decline.
MATs to July
0
100,000
200,000
300,000
400,000
500,000
600,000
700,000
800,000
1995
1996
1997
1998
1999
2000
2001
2002
2003
2004
2005
2006
Sp
en
d (
£0
00
s)
Frozen Beef Frozen Fish Frozen Lamb
Frozen Pork Frozen Poultry Frozen Sausages

© WorldpanelTM division of TNS 2006
5 A Day ConsumptionYounger adults have driven the growth in the last year although some way to go until they reach the level of older consumers
2.5
1.8
2.72.6
1.9
2.72.7
2.0
2.9
0
0.5
1
1.5
2
2.5
3
3.5
4
4.5
5
ALL CONSUMERS Children Adults
Ann SA 02 Ann SA 04 Ann SA 05

© WorldpanelTM division of TNS 2006
13647.514826.2 15359.9 16079.5
2003 2004 2005 2006
Health +9%
6803.1 6766.7 7298 7241.9
2003 2004 2005 2006
Indulgence +7%
TNS Worldpanel Usage – 52 W/E May 2006
Indulgence (Craving, Something Special/Treat, Social/Entertaining)
Its not all about healthGrowth in indulgence

Treaters are more likely than the average person to also
choose foods for health reasons.
Both drivers don’t have to be in the same product
Credit / Debit lifestyle.

© WorldpanelTM division of TNS 2006
-41
-25
-18
-5
-3
-2
-2
-1
-1
3
9
64
66
72
-116
-150 -100 -50 0 50 100
Total Crisps
Sweet Biscuits
Countlines
Non-Choc Confectionery
Chocolate Confectionery
Ice Cream /Lollies
Cakes/Tarts/Pastries
Yoghurts
Snack Biscuits
Total Nuts
Savoury Biscuits
Cereal Bars
All Sandwiches
Fruit
Dried Fruit
Out of home crisps occasionsWhere have the lost occasions gone?
Millions of occasionsGains / Loss Net Balance Chart – Usage Migration Analysis
Annual Year Nov 2004 to Year Nov 2005
© WorldpanelTM division of TNS 2006
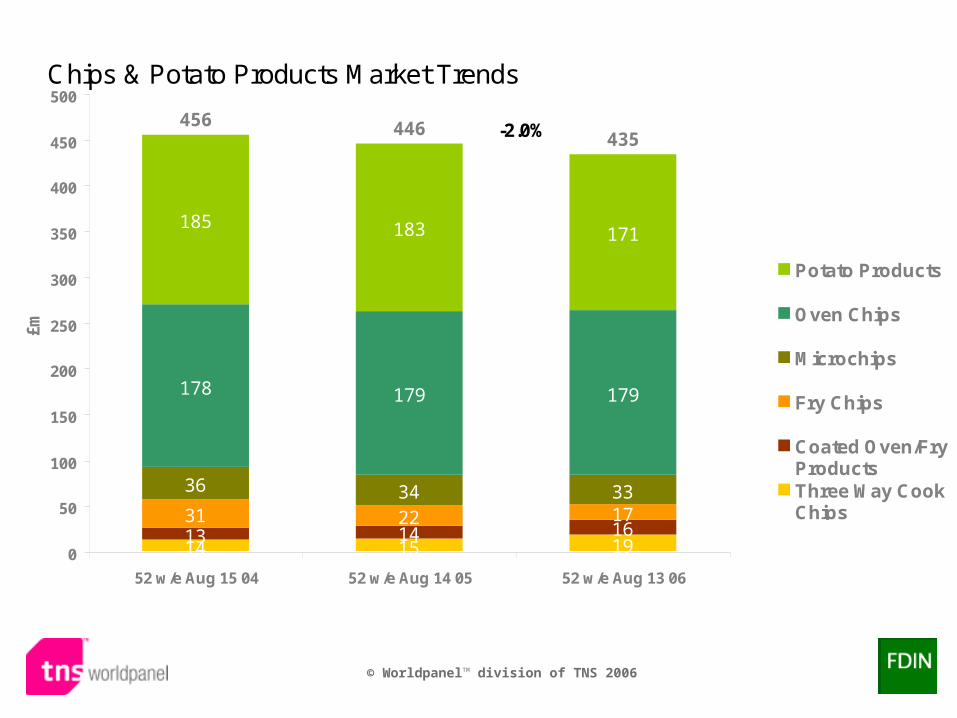
Chips & Potato Products Market Trends
14 15 1913 14 1631 22 17
36 34 33
178 179 179
185 183 171
456 446435
0
50
100
150
200
250
300
350
400
450
500
52 w/e Aug 15 04 52 w/e Aug 14 05 52 w/e Aug 13 06
£m
Potato Products
Oven Chips
Microchips
Fry Chips
Coated Oven/FryProductsThree Way CookChips
-2.0%
+0.6%
-2.5%
+0.2%
-6.4%-1.2%

© WorldpanelTM division of TNS 2006
-5.6-0.030.510.54Price per Vol
7.00.142.12.0Trip Vol
0.90.011.071.06Trip Spend
6.90.6610.39.7AWP (Vol per Buyer)
0.90.045.255.20AWP (Spend per Buyer)
-0.10.004.94.9Purchase Frequency
-23.2-4.0113.317.3Penetration %
-17.8-73043375941063Volume (000s Units)
-22.4-49491712622075Expenditure (£000s)
% Change
Actual Change
52 w/e 13 Aug 06
52 w/e 14 Aug 05
-8000 -6000 -4000 -2000 0 2000
Penetration % Purchase Frequency
Trip Vol Price per Vol
Key Performance Indicators for Fry Chips –Value down 22.4% worth £4949k
Expenditure (£000s)
Volume (000s Units)
Penetration % *
Purchase FrequencyTrip Vol
AWP (Vol per Buyer)
Price per Vol
£17.1m -22.4%
Decrease of -£4949k
33.8m vol -17.8%
Contribution = -£3685k
13.3% -23.2%
Contribution = -£5177k
4.9 trips -0.1%
Contribution = -£19k
2.1 vol +7%
Contribution = £1512k
10.3 vol +6.9%
Contribution = £1493k
£0.51 -5.6%
Contribution = -£1264k
* Pen Contribution includes Population
growth of 0.2%

© WorldpanelTM division of TNS 2006
Agenda
Health
Enjoyment
Convenience
Pester Power
The Multi-Cultural Table
The Ethical Consumer

© WorldpanelTM division of TNS 2006
Take Home Market Sizes - £m
8,2547,480
7,0296,164
3,8283,6343,558
2,6602,527
1,8811,767
1,6831,675
1,5641,3811,364
1,2731,235
1,061932
Alcohol Fruit+Veg+Salads
Dairy Products Chilled Convenience
Household & Cleaning Prds Ambient Bakery Products
Fresh Meat Take Home Soft Drinks
Frozen Prepared Foods Take Home Confectionery
Biscuits Fresh Poultry+Game
Canned Goods Packet Breakfast
Savoury Home Cooking Pet Care
Hot Beverages Take Home Savouries
Bathroom Toiletries Fresh Fish
52 w/e Aug 13 2006

© WorldpanelTM division of TNS 2006
Top 4 Grocers Share of Total Alcohol
50
55
60
65
70
75
2002 2003 2004 2005 2006

© WorldpanelTM division of TNS 2006
Share of Total Grocers - Alcohol
27.1
16.3
14.1
12.0
6.3
4.2
4.5
3.0
2.9
2.3
1.7
2.4
0.9
0.8
28.6
16.3
14.8
10.8
6.5
4.9
3.3
2.9
2.8
2.4
1.6
1.5
1.1
0.9
Tesco
Sainsbury
Asda
Morrisons Tot
Total Co-op
Somerfield
Tot Indepts
Waitrose
Aldi
Lidl
M & S
Kwik Save
Netto
Iceland
52 w/e Aug 13 200652 w/e Aug 14 2005

© WorldpanelTM division of TNS 2006
Top 4 Share of Beer+Lager
5
10
15
20
25
30
Sep
14
2003
Oct
12
2003
No
v 09
200
3
Dec
07
2003
Jan
04
2004
Feb
01
2004
Feb
29
2004
Mar
28
2004
Ap
r 25
200
4
May
23
2004
Jun
20
2004
Jul 1
8 20
04
Au
g 1
5 20
04
Sep
12
2004
Oct
10
2004
No
v 07
200
4
Dec
05
2004
Jan
02
2005
Jan
30
2005
Feb
27
2005
Mar
27
2005
Ap
r 24
200
5
May
22
2005
Jun
19
2005
Jul 1
7 20
05
Au
g 1
4 20
05
Sep
11
2005
Oct
09
2005
No
v 06
200
5
Dec
04
2005
Jan
01
2006
Jan
29
2006
Feb
26
2006
Mar
26
2006
Ap
r 23
200
6
May
21
2006
Jun
18
2006
Jul 1
6 20
06
Au
g 1
3 20
06
Weekly 3 Point Centred Moving Average
Sh
are
(E
xp
en
dit
ure
)
Sainsbury Tesco Asda Morrisons

© WorldpanelTM division of TNS 2006
Top 4 Share of Sparkling Wine
0
5
10
15
20
25
30
35
40
45
Sep
14
2003
Oct
12
2003
No
v 09
200
3
Dec
07
2003
Jan
04
2004
Feb
01
2004
Feb
29
2004
Mar
28
2004
Ap
r 25
200
4
May
23
2004
Jun
20
2004
Jul 1
8 20
04
Au
g 1
5 20
04
Sep
12
2004
Oct
10
2004
No
v 07
200
4
Dec
05
2004
Jan
02
2005
Jan
30
2005
Feb
27
2005
Mar
27
2005
Ap
r 24
200
5
May
22
2005
Jun
19
2005
Jul 1
7 20
05
Au
g 1
4 20
05
Sep
11
2005
Oct
09
2005
No
v 06
200
5
Dec
04
2005
Jan
01
2006
Jan
29
2006
Feb
26
2006
Mar
26
2006
Ap
r 23
200
6
May
21
2006
Jun
18
2006
Jul 1
6 20
06
Au
g 1
3 20
06
Weekly 3 Point Centred Moving Average
Sh
are
(E
xp
en
dit
ure
)
Sainsbury Tesco Asda Morrisons

© WorldpanelTM division of TNS 2006
Agenda
Health
Enjoyment
Convenience
Pester Power
The Multi-Cultural Table
The Ethical Consumer

© WorldpanelTM division of TNS 2006
Light meals
Snacking
Solus eating
De-skilling
Family meals
Formality
Preparation
Components
The diminishing importance of ‘serious’ food

© WorldpanelTM division of TNS 2006
All meals are becoming lighter
33
46
33
14
38
50
40
16
5351
29
47
5761
3942
Breakfast Lunch Teatime Evening Meal
1993 1997 2003 2005
Proportion of occasion defined by the consumer as a “light meal”

© WorldpanelTM division of TNS 2006
Convenience mega trend
1994
Eating alone 34.4%
Time to prepare main meal 30 mins
Snacks 16.3%
Light meals 23.3%
Homemade Foods 17.8%
2004
51.1%
19 mins
22.9%
36.1%
12.1%

© WorldpanelTM division of TNS 2006
TNS Family Food Panel 2004
Eat now (Unplanned) Eat later (Planned)
• Today
•Top-up/Impulse Shopping
• Focus on Practicality
• Pay for convenience
• Solutions
• Lunchtime fixture
• Handipacks/portable
•Shopping Missions
• Tomorrow
• Main Shop
• Focus on Enjoyment
• Value aware
• Home warehousing
• All occasions
• Large packs/multibuys
•Shopping Lists
Chilled Frozen

© WorldpanelTM division of TNS 2006
Chilled v. Frozen Trends - Value
100
150
200
250
300
350
400
450
500
550
1997 1998 1999 2000 2001 2002 2003 2004 2005 2006
£m
Frozen Prepared Foods

© WorldpanelTM division of TNS 2006
Chilled v. Frozen Trends - Value
100
150
200
250
300
350
400
450
500
550
1997 1998 1999 2000 2001 2002 2003 2004 2005 2006
£m
Chilled Convenience Frozen Prepared Foods

© WorldpanelTM division of TNS 2006
Healthier Option
Flora Margarine std 250g
£0.63
Flora Pro-Activ low fat spread 250g
£1.96 210% more
Convenient Option
Iceberg Lettuce£0.35
Bagged Iceberg lettuce 300g
£0.99 185% more
Prices taken from Tesco Price check.com 09/08/05
Price premiums for key drivers

© WorldpanelTM division of TNS 2006
19.8 20.5
32.936.3
46.041.5
0%
20%
40%
60%
80%
100%
2004 2005
In theLounge/LivingRoom
In the DiningRoom
In the Kitchen
Where are families having their Evening Meals?Returning ‘back to the table’
TNS Worldpanel Usage – 52 W/E to November 2005HH with Kids only
For one day this week, our family day, aah bisto!!

© WorldpanelTM division of TNS 2006
A decline of 1.1m adults y.o.y
Agreeing to“I have my main meal in
front of the TV”

© WorldpanelTM division of TNS 2006
Consumers looking for convenient foods whilst retaining control over family intake

© WorldpanelTM division of TNS 2006
Agenda
Health
Enjoyment
Convenience
Pester Power
The Multi-Cultural Table
The Ethical Consumer

© WorldpanelTM division of TNS 2006
-10%
-5%
-3%
-11%
-10%
-9%
-8%
-7%
-6%
-5%
-4%
-3%
-2%
-1%
0%
1%
Child Adult Male Adult Female
Children are rapidly reducing their consumption of ‘traditional’ snacks and
are moving to healthier foods that are more permissible to Mum.
% change in Snacks Consumption
% Growth in Foods consumed for Health reasons
+5% +4%+7%
% Change vs LY
Based on Total Snacks consumed (Biscuits + Bagged
Snacks + Confectionery + Cakes & Pastries)
TNS Worldpanel Usage In Home consumption

© WorldpanelTM division of TNS 2006
% of Occasions consumed for Health alone
Health is more important for younger children, primarily driven by parental
control
13.4
17.2
14.7
9.5
15.8
17.3
15.2
14.7
Total Children
Child 0-5
Child 6-10
Child 11-16
Total Children
Child 0-5
Child 6-10
Child 11-16 To
tal F
oo
d
T
ota
l Dri
nk
TNS Worldpanel Usage
Total Consumption, 52 W/E to November 2005

© WorldpanelTM division of TNS 2006
Parental control increasing?Parents are buying healthier foods for children and less so what children demand
10
20
30
40
50
60
70
80
Buy healthyrange of foods
Child shouldeat what given
Organic saferfor children
Buy whatchildren want
Eat wellbalanced meals
6 months to end of November 2003
6 months to end of November 20046 months to end of November 2005
% in Households with children agreeing to
the statement
Usage Household Attitudinal data 2005 vs. 2004 / 2003

© WorldpanelTM division of TNS 2006
Parental impact on Kids eating habits
Usage 52 w/e Nov 2005 - Based on the actual eating behaviours of children and the Influential impact of the food attitudes of their parents.
Healthy kidsFruit & Vegetables
Dieting /Sensible
Health Parents
5-a-Day Kids
Too youngTo worryParents
Sweet tooth andFast food Kids
Am I Bothered
Fast foodKids
BingerbalancerParents
Fast Food Feasters
Sweet tooth andsnacking kids
Health in Later years
Parents
Pester Power kids
Snacking Kids
Sceptic /Disinterested
Parents
Snacks R Us

© WorldpanelTM division of TNS 2006
Agenda
Health
Enjoyment
Convenience
Pester Power
The Multi-Cultural Table
The Ethical Consumer

© WorldpanelTM division of TNS 2006
The boundaries between
in and out of home are blurring…

© WorldpanelTM division of TNS 2006
®
Consumers involvement with Poultry (and other proteins) is changing…
From this….
To this….
To this….

© WorldpanelTM division of TNS 2006
Until the mid 90’s UK population growth was mainly due to natural increase. Between 2001 and 2004, 2/3rds of the increase in population was due to net migration
1 in 12 people in the UK are born overseas. In 2001 4.9 million (8.3% of the population) were born overseas – more than double the 2.1 million in 1951
Estimated number of people arriving to live in the UK increased to a record 582,000 in 2004
2004 also saw the highest recorded migration of British Citizens abroad to 208,000
In 2004 there were an estimated 59.8 million people living in the UK
The UK is an increasingly diverse society with ever changing tastes
Sources: ONS

© WorldpanelTM division of TNS 2006
Agenda
Health
Enjoyment
Convenience
Pester Power
The Multi-Cultural Table
The Ethical Consumer

© WorldpanelTM division of TNS 2006
I want to do right by the world and feel good about it

© WorldpanelTM division of TNS 2006
Real Household Disposable Income Per Head
0
50
100
150
200
250
1970
1971
1972
1973
1974
1975
1976
1977
1978
1979
1980
1981
1982
1983
1984
1985
1986
1987
1988
1989
1990
1991
1992
1993
1994
1995
1996
1997
1998
1999
2000
2001
2002
2003
2004
2005
Constant Prices - Indexed on 1970Source: ONS Series IHXZ

© WorldpanelTM division of TNS 2006
Food and Drink as a Proportion of UK Household Expenditure %
0
5
10
15
20
25
19
63
19
64
19
65
19
66
19
67
19
68
19
69
19
70
19
71
19
72
19
73
19
74
19
75
19
76
19
77
19
78
19
79
19
80
19
81
19
82
19
83
19
84
19
85
19
86
19
87
19
88
19
89
19
90
19
91
19
92
19
93
19
94
19
95
19
96
19
97
19
98
19
99
20
00
20
01
20
02
20
03
20
04
20
05
Source: ONS Series ABQI / ABZV

© WorldpanelTM division of TNS 2006
Hens Eggs - 'Free Range' Share Trends
28
30
32
34
36
38
40
42
44
46
48
50
52
19
98
19
99
20
00
20
01
20
02
20
03
20
04
20
05
20
06
Free Range
Share - £%

© WorldpanelTM division of TNS 2006
Free Range Eggs - Performance Analysis
39.4 40.6 41.7
46.149.0
147140 135 133 131
20
25
30
35
40
45
50
55
52 w/e Jul 21 2002
52 w/e Jul 20 2003
52 w/e Jul 18 2004
52 w/e Jul 17 2005
52 w/e Jul 16 2006
Sh
are
£%
100
150
200
250
Pri
ce p
er V
olu
me
Ind
ex
Share of Eggs Price per Volume Index

© WorldpanelTM division of TNS 2006
Lifestyle Indices – Free Range Hens Eggs
Share indexed on Total Market – 52 w/e Aug 13 2006
I am prepared to pay more for organic food 153I buy free range products whenever I can 143Country of origin is important to me when choosing groceries 126I try to support regional food producers 123I regard myself as a connoisseur of food and wine 122I try to buy environmentally friendly products 121I feel good about buying fair trade products 120I believe in a holistic approach to medical treatment 120I try to buy local produce whenever I can 120I am prepared to pay more for quality ingredients 119I think we should all try to buy more fair trade products 118I would actively avoid genetically modified foods 117I read the ingredients on the pack before buying 117The BBC is an institution that I can rely on 115I would choose locally grown produce if I had the option 113I don't mind paying for quality 113I think supermarkets are becoming too powerful 112I look out for the 'healthy' products 112I try to avoid products containing caffeine 111I try to buy a healthy range of foods these days 111

© WorldpanelTM division of TNS 2006
Fairtrade Coffee - Performance Analysis
5.76.0
6.5
113
125123
3
4
5
6
7
52 w/e Aug 15 2004 52 w/e Aug 14 2005 52 w/e Aug 13 2006
Sh
are
£%
100
120
140
160
Pri
ce p
er V
olu
me
Ind
ex
Share of Total Coffee Price per Volume Index

© WorldpanelTM division of TNS 2006
Lifestyle Indices – Fairtrade Coffee
Share indexed on Total Market – 52 w/e Aug 13 2006
I am prepared to pay more for organic food 253I feel good about buying fair trade products 195I believe in a holistic approach to medical treatment 183Country of origin is important to me when choosing groceries 177I try to buy environmentally friendly products 175I try to support regional food producers 172I think we should all try to buy more fair trade products 168I regard myself as a connoisseur of food and wine 163I buy free range products whenever I can 161I try to buy local produce whenever I can 158The BBC is an institution that I can rely on 153I read the ingredients on the pack before buying 150I would actively avoid genetically modified foods 144I am prepared to pay more for quality ingredients 142I regularly take active exercise 138I do not approve of gambling 135I think supermarkets are becoming too powerful 134I try to buy a healthy range of foods these days 133Inner wellbeing is important to me 132I would choose locally grown produce if I had the option 131My diet is very important to me 131

© WorldpanelTM division of TNS 2006
Fairtrade Bananas - Performance Analysis
2.5
3.6
4.4
6.8
7.9
117
146 144136155
0
1
2
3
4
5
6
7
8
9
52 w/e Jul 21 2002
52 w/e Jul 20 2003
52 w/e Jul 18 2004
52 w/e Jul 17 2005
52 w/e Jul 16 2006
Sh
are
£%
100
150
200
250
Pri
ce p
er V
olu
me
Ind
ex
Share of Bananas Price per Volume Index

© WorldpanelTM division of TNS 2006
Lifestyle Indices – Fairtrade Bananas
Share indexed on Total Market – 52 w/e Aug 13 2006
I am prepared to pay more for organic food 181I feel good about buying fair trade products 160I try to support regional food producers 151The BBC is an institution that I can rely on 147I try to buy environmentally friendly products 146I think we should all try to buy more fair trade products 142Country of origin is important to me when choosing groceries 141I buy free range products whenever I can 141I try to buy local produce whenever I can 132I believe in a holistic approach to medical treatment 129I would actively avoid genetically modified foods 127I read the ingredients on the pack before buying 125I regard myself as a connoisseur of food and wine 125I buy British whenever I can 120I think supermarkets are becoming too powerful 120I eat out regularly 120I'm prepared to pay more for products that make life easier 119I am prepared to pay more for quality ingredients 119I would choose locally grown produce if I had the option 116I do not approve of gambling 116I look out for the 'healthy' products 114

© WorldpanelTM division of TNS 2006
0
10
20
30
40
50
60
70
801998
1999
2000
2001
2002
2003
2004
2005
2006
£m’s
Total Organic Products
Annualised Value = £990m

© WorldpanelTM division of TNS 2006
Total Organics-£ Spend by Frequency Group
20
39
6
15
7
14
17
12
69
1
% Homes Buying % Spend
27+
13-26 Occasions
7-12 Occasions
2-6 Occasions
1 Occasion
20% of Organic buyers purchase once during the year & account for only 1% of spend12% of Organic buyers represent 69% of money spent on Organics
52 w/e Aug 13 2006

© WorldpanelTM division of TNS 2006
Lifestyle Indices – Total Organic Products
Share indexed on All Households – 52 w/e Aug 13 2006
I am prepared to pay more for organic food 331I believe in a holistic approach to medical treatment 207I buy free range products whenever I can 179Country of origin is important to me when choosing groceries 173I try to buy environmentally friendly products 172I read the ingredients on the pack before buying 169I try to support regional food producers 168I would actively avoid genetically modified foods 166I feel good about buying fair trade products 165I try to avoid products containing caffeine 164I regard myself as a connoisseur of food and wine 163I think we should all try to buy more fair trade products 156I am prepared to pay more for quality ingredients 154I try to buy local produce whenever I can 152A natural approach to medicine is the best method 144My diet is very important to me 140I look out for the 'healthy' products 137I try to buy a healthy range of foods these days 137I think supermarkets are becoming too powerful 136Inner wellbeing is important to me 136

© WorldpanelTM division of TNS 2006
Green & Blacks Chocolate - Performance Analysis
1.0
1.61.9
2.9
3.7
122130
171181
194
0
1
2
3
4
52 w/e Jul 212002
52 w/e Jul 202003
52 w/e Jul 182004
52 w/e Jul 172005
52 w/e Jul 162006
Sh
are
£%
100
150
200
250
300
Pri
ce
pe
r V
olu
me
Ind
ex
Share of Defined Chocolate Price per Volume Index

© WorldpanelTM division of TNS 2006
Lifestyle Indices – Green & Blacks Chocolate
Share indexed on All Buyers – 52 w/e Aug 13 2006
I am prepared to pay more for organic food 267I regard myself as a connoisseur of food and wine 216I believe in a holistic approach to medical treatment 184I buy free range products whenever I can 165I feel good about buying fair trade products 162Country of origin is important to me when choosing groceries 162I try to support regional food producers 161I try to avoid products containing caffeine 157I think we should all try to buy more fair trade products 154I try to buy environmentally friendly products 153I read the ingredients on the pack before buying 153I try to buy local produce whenever I can 152The BBC is an institution that I can rely on 150A natural approach to medicine is the best method 149I am prepared to pay more for quality ingredients 148I would actively avoid genetically modified foods 146I/my partner enjoy cooking to entertain friends and family 138I like to keep myself in shape 136I think supermarkets are becoming too powerful 135I try to lead a healthy lifestyle 134I try to buy a healthy range of foods these days 133

© WorldpanelTM division of TNS 2006
Ecover Washing-Up Liquid - Performance Analysis
2.42.7
3.6
128 131125
0
1
2
3
4
52 w/e Aug 15 2004 52 w/e Aug 14 2005 52 w/e Aug 13 2006
Sh
are
£%
100
150
200
Pri
ce p
er V
olu
me
Ind
ex
Share of Washing-Up Liquids Price per Volume Index

© WorldpanelTM division of TNS 2006
Lifestyle Indices – Ecover
Share indexed on All Buyers – 52 w/e Aug 13 2006
I am prepared to pay more for organic food 298I believe in a holistic approach to medical treatment 226I try to buy environmentally friendly products 211Country of origin is important to me when choosing groceries 199I try to support regional food producers 187I buy free range products whenever I can 181I feel good about buying fair trade products 176I try to buy local produce whenever I can 168I read the ingredients on the pack before buying 167The BBC is an institution that I can rely on 162I think we should all try to buy more fair trade products 159I would actively avoid genetically modified foods 153A natural approach to medicine is the best method 152I try to avoid products containing caffeine 151I make a shopping list before I go out and stick to it 141I do not approve of gambling 141I think supermarkets are becoming too powerful 140I look out for the 'healthy' products 139I am prepared to pay more for quality ingredients 136My diet is very important to me 135I regard myself as a connoisseur of food and wine 135

© WorldpanelTM division of TNS 2006
Waitrose Share Index
Free Range Hens Eggs 188
Fairtrade Coffee 218
Fairtrade Bananas 195
Total Organic Products 482
Green & Blacks Choc. 646
Ecover 365
Share within Waitrose Indexed on All Grocers52 w/e Aug 13 2006

© WorldpanelTM division of TNS 2006
Sainsbury Share Index
Free Range Hens Eggs 129
Fairtrade Coffee 150
Fairtrade Bananas 168
Total Organic Products 169
Green & Blacks Choc. 195
Ecover 140
Share within Sainsbury Indexed on All Grocers52 w/e Aug 13 2006

© WorldpanelTM division of TNS 2006
Lifestyle Indices – The Unimportance of Price
Share indexed on All Buyers – 52 w/e Jul 17 2005
Free Range Hens Eggs 76
Fairtrade Coffee 53
Fairtrade Bananas 73
Total Organic Products 50
Green & Blacks Choc. 46
Ecover 61
I Consider That Price Is The Most ImportantFactor When Buying A Product - Norm=100

© WorldpanelTM division of TNS 2006
Convenience
Reminders
Health
Enjoyment

© WorldpanelTM division of TNS 2006
PesterPower
Reminders
Health
Enjoyment
Convenience

© WorldpanelTM division of TNS 2006
Reminders
Multi-CulturalTable
Health
Enjoyment
ConveniencePesterPower

© WorldpanelTM division of TNS 2006
TheEthical
Consumer
Reminders
Health
Enjoyment
ConveniencePesterPower
Multi-CulturalTable


![High Court Judgment Template€¦ · Web viewThis was the approach taken by the Court of Appeal in Daventry DC v Daventry District Housing Ltd [2012] 1 WLR 1333 (“Daventry”) albeit](https://img.pdfslide.net/doc/110x75/5fe2796db0258947166afa02/high-court-judgment-template-web-view-this-was-the-approach-taken-by-the-court-of.jpg)