Embed Size (px)
Citation preview
1
CIFP Annual National Conference 20041 - Capital Markets Overview - Second Quarter 20042 – Investing for Income3 – Asian Exposure
Tuesday June 15, 2004Tuesday June 15, 2004
2
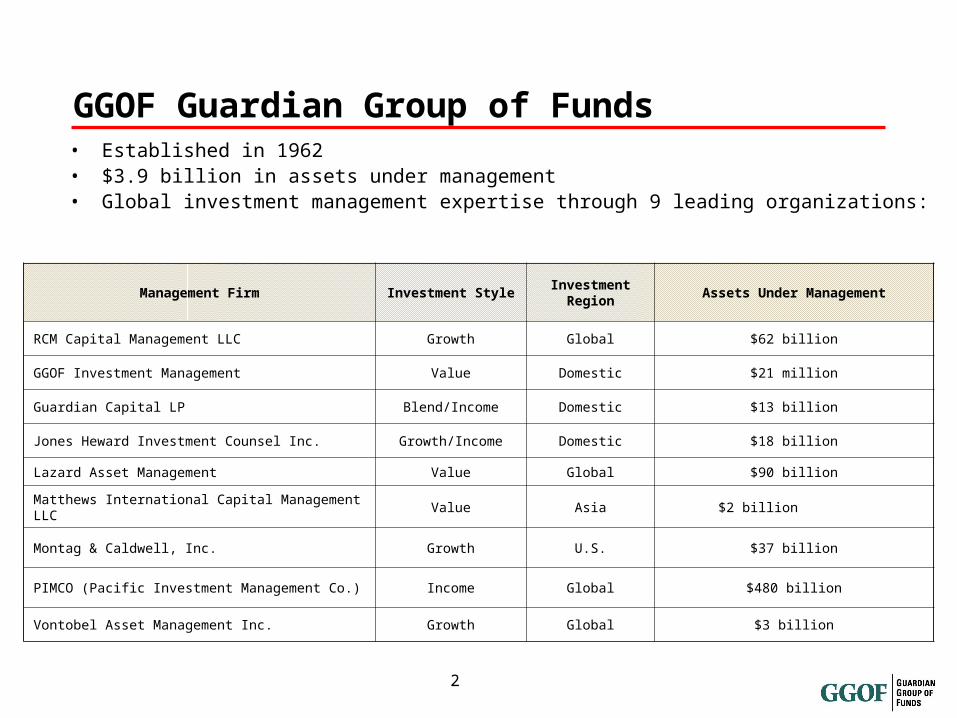
GGOF Guardian Group of Funds• Established in 1962• $3.9 billion in assets under management• Global investment management expertise through 9 leading organizations:
Management Firm Investment StyleInvestment
RegionAssets Under Management
RCM Capital Management LLC Growth Global $62 billion
GGOF Investment Management Value Domestic $21 million
Guardian Capital LP Blend/Income Domestic $13 billion
Jones Heward Investment Counsel Inc. Growth/Income Domestic $18 billion
Lazard Asset Management Value Global $90 billion
Matthews International Capital Management LLC Value Asia $2 billion
Montag & Caldwell, Inc. Growth U.S. $37 billion
PIMCO (Pacific Investment Management Co.) Income Global $480 billion
Vontobel Asset Management Inc. Growth Global $3 billion
3
A New Era of Single-Digit Returns
• Moderate growth and inflation looking forward
• Single-digit return expectations for most Canadian asset classes in the next few years
• Stock market leadership requires powerful earnings momentum
• Current income a much larger portion of total returns
4
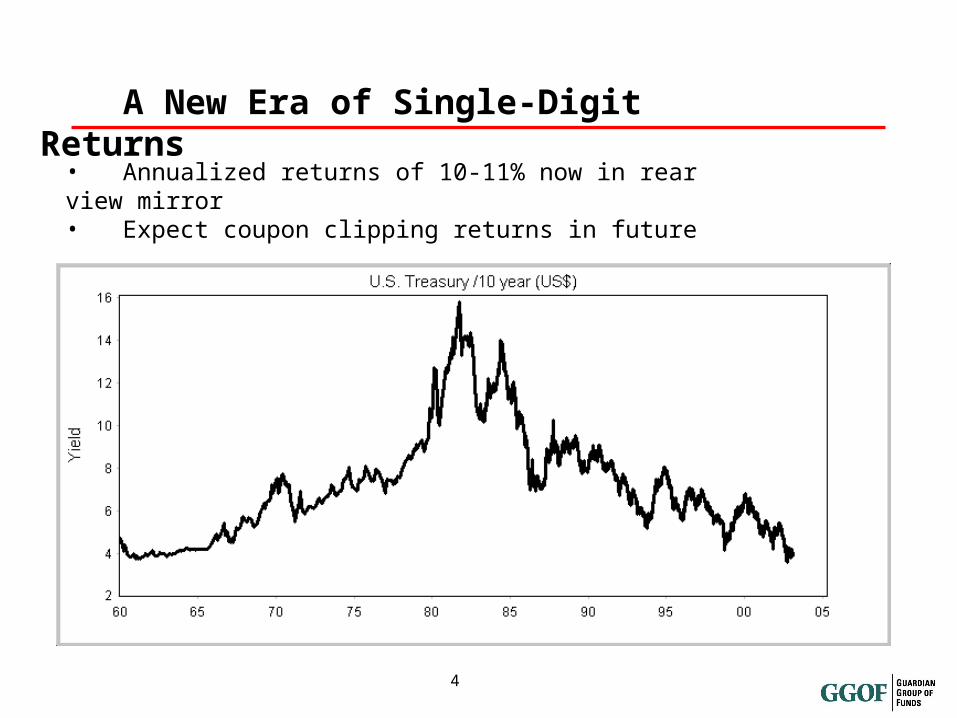
A New Era of Single-Digit Returns
• Annualized returns of 10-11% now in rear view mirror• Expect coupon clipping returns in future
5
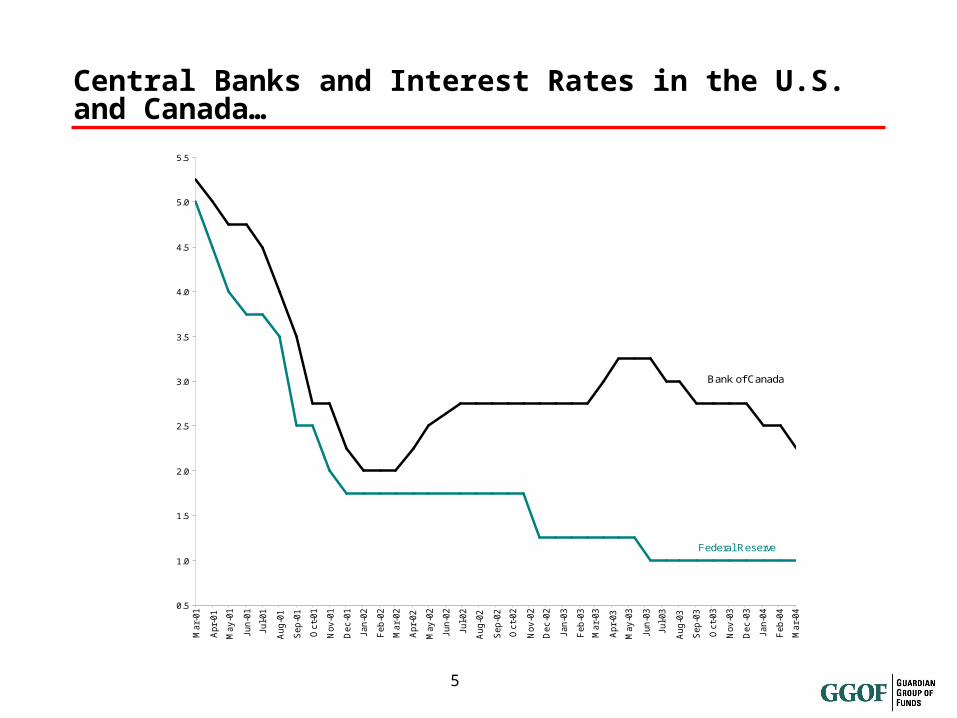
Central Banks and Interest Rates in the U.S. and Canada…
0.5
1.0
1.5
2.0
2.5
3.0
3.5
4.0
4.5
5.0
5.5
Mar-
01
Apr-
01
May-0
1
Jun-0
1
Jul-01
Aug-0
1
Sep-0
1
Oct-
01
Nov-0
1
Dec-0
1
Jan-0
2
Feb-0
2
Mar-
02
Apr-
02
May-0
2
Jun-0
2
Jul-02
Aug-0
2
Sep-0
2
Oct-
02
Nov-0
2
Dec-0
2
Jan-0
3
Feb-0
3
Mar-
03
Apr-
03
May-0
3
Jun-0
3
Jul-03
Aug-0
3
Sep-0
3
Oct-
03
Nov-0
3
Dec-0
3
Jan-0
4
Feb-0
4
Mar-
04
Federal Reserve
Bank of Canada
6
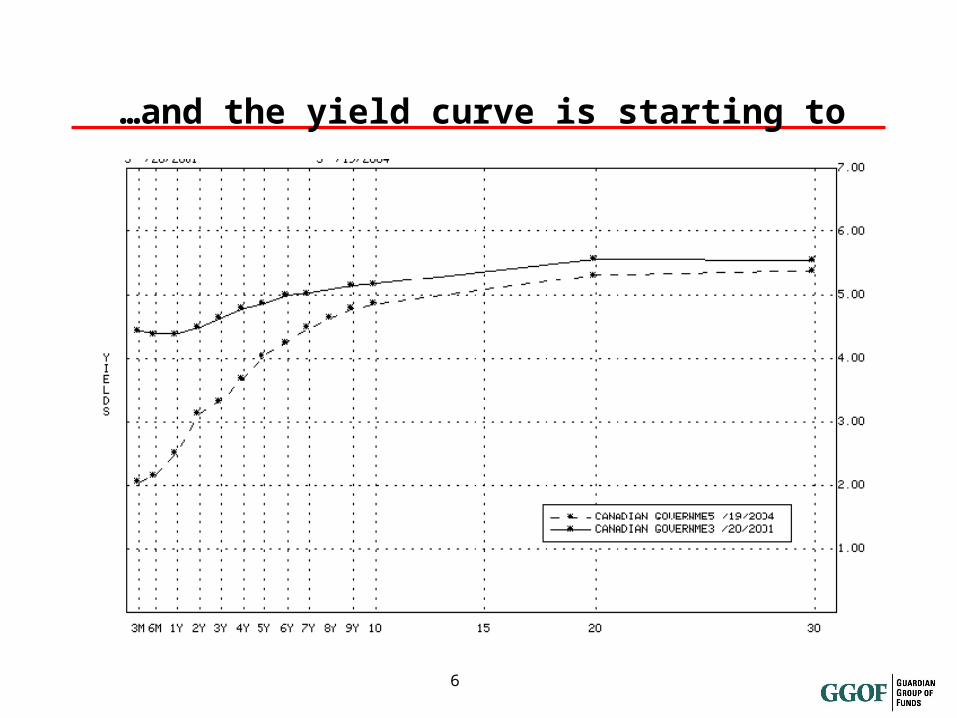
…and the yield curve is starting to steepen again.
7
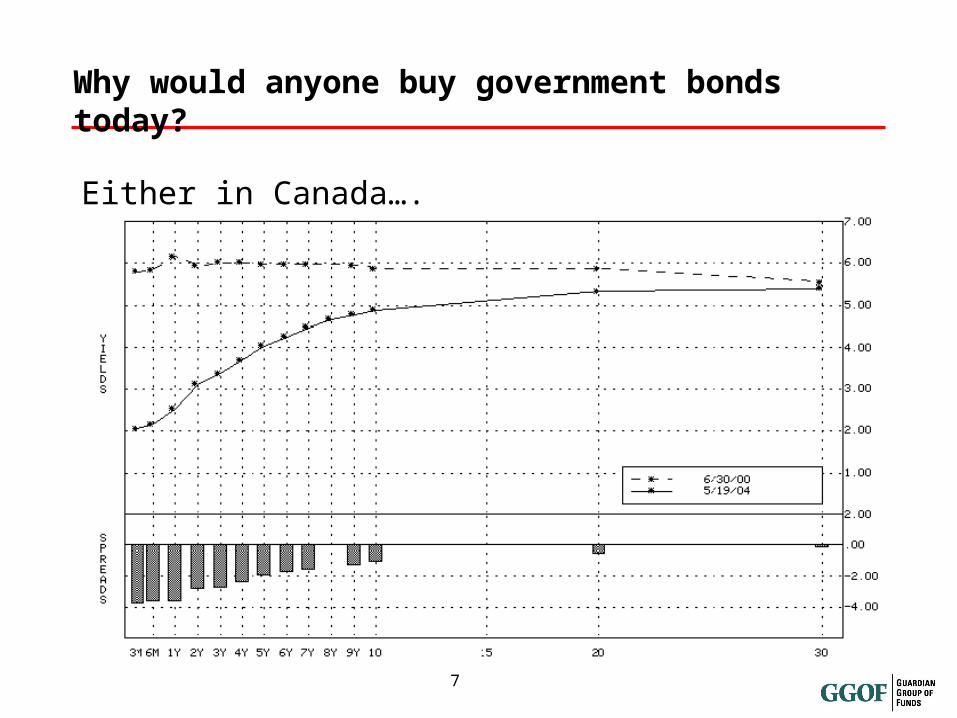
Why would anyone buy government bonds today?
Either in Canada….
8
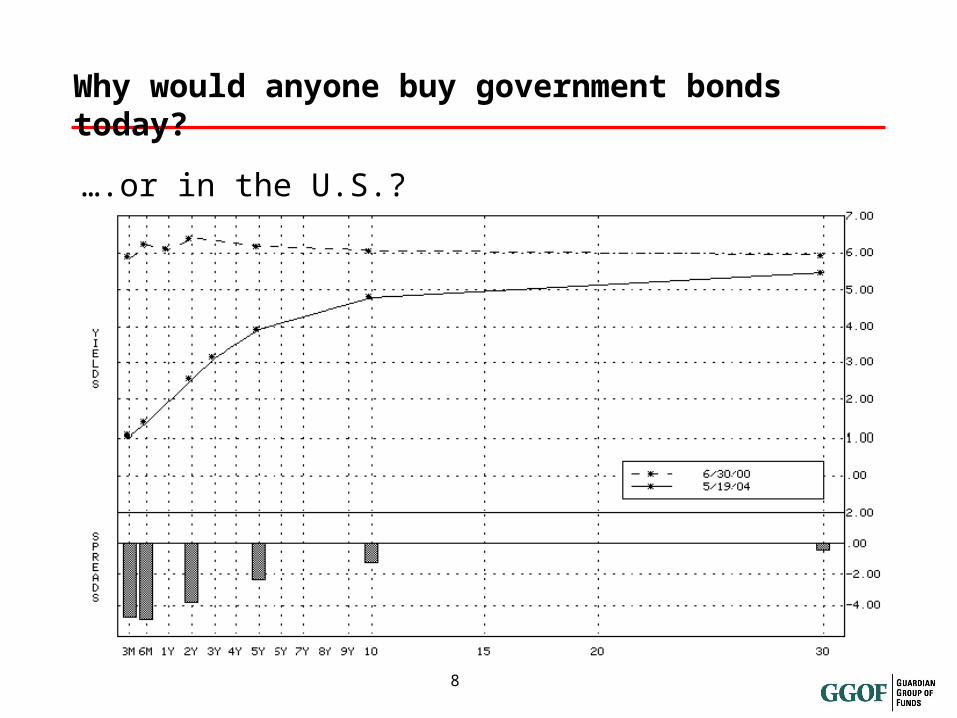
Why would anyone buy government bonds today?
….or in the U.S.?
9
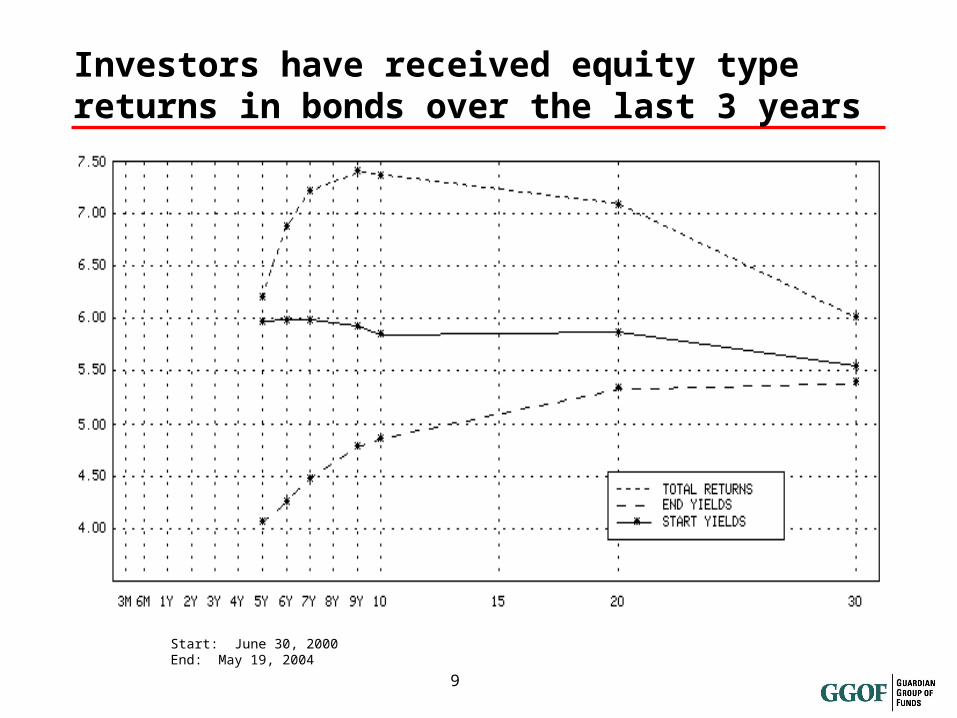
Investors have received equity type returns in bonds over the last 3 years
Start: June 30, 2000End: May 19, 2004
10
Reasons to Consider ‘Non-Traditional’ Income Alternatives
• Coupon returns for traditional income products
• Promising outlook for income products with equity-like characteristics
• Well-developed markets now for ‘non-traditional’ income products
• Value of low or non-correlated asset classes
11
Non-traditional Income Alternatives
• Preferred shares
• High yield bonds
• Income trusts
• Dividend-paying common shares
12
Preferred Shares
• Exchangeable, retractable and floating rate preferred shares provide:
• stable, tax-effective income
• low volatility
• $1.00 of dividend income and $1.25 - $1.30 of interest income both produce the same after-tax income
• Dividends provide yield support, which contributes to price stability
• High quality (P1/P2) preferred share market shrinking
• Be careful: Know what you are buying because issue features vary greatly
13
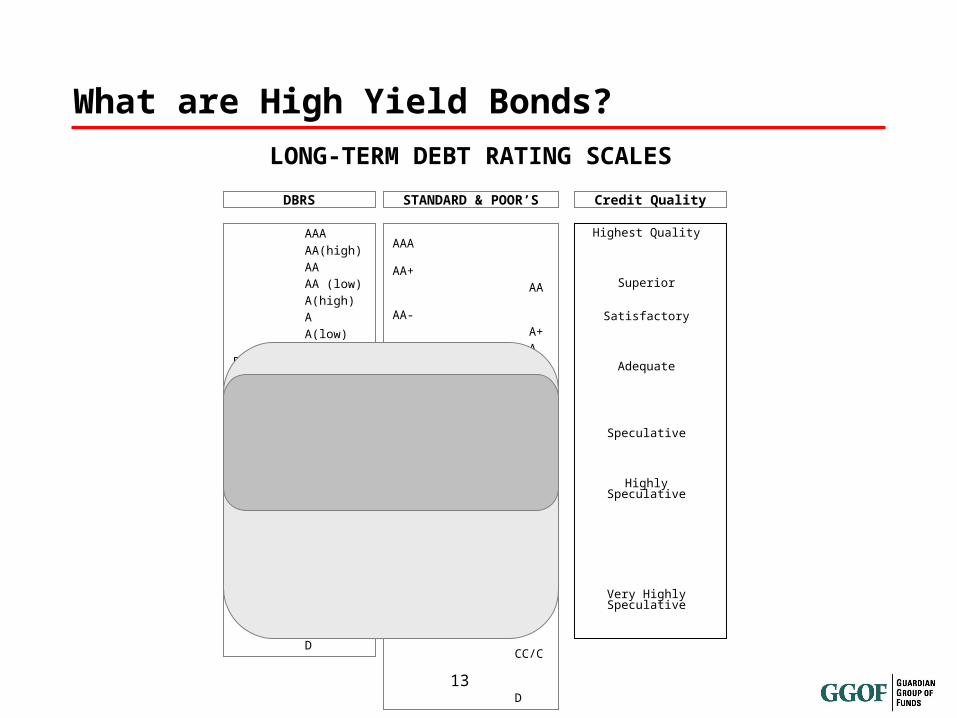
What are High Yield Bonds?
LONG-TERM DEBT RATING SCALES
STANDARD & POOR’SDBRS
Highest Quality
Superior
Satisfactory
Adequate
Speculative
Highly Speculative
Very Highly Speculative
Credit Quality
AAA AA+ AA AA- A+ A A- BBB+ BBB BBB-
BB+ BB BB- B+ B B-
CCC+ CCC CCC- CC/C D
AAA AA(high) AA AA (low) A(high) A A(low) BBB(high) BBB BBB(low)
BB(high) BB BB(low) B(high) B B(low) CCC
CC/C
D
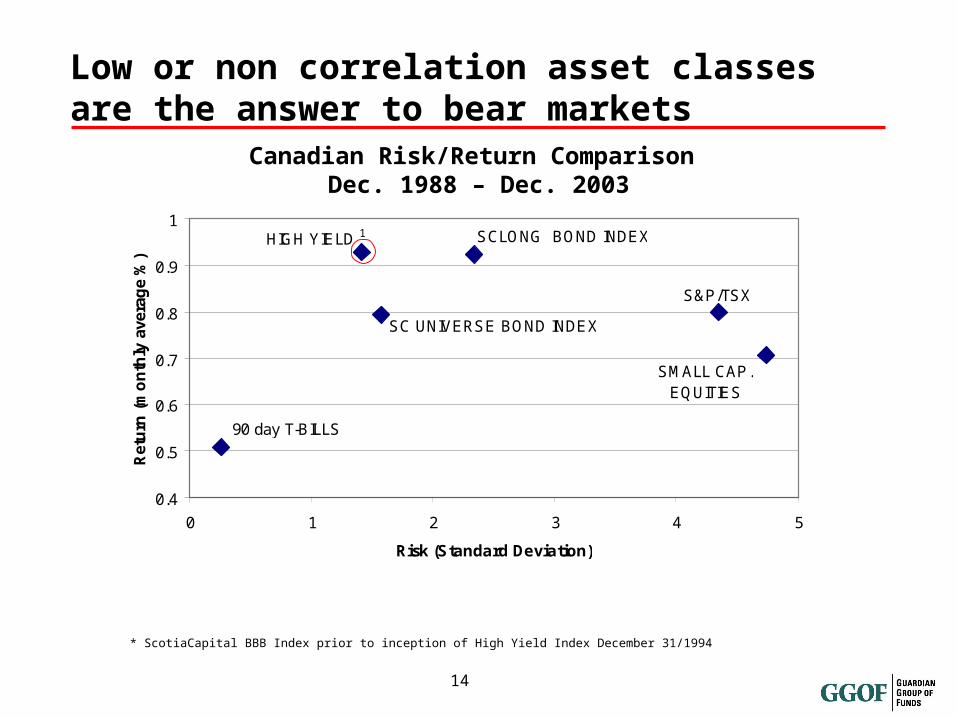
14
* ScotiaCapital BBB Index prior to inception of High Yield Index December 31/1994
Low or non correlation asset classes are the answer to bear markets
Canadian Risk/Return Comparison Dec. 1988 – Dec. 2003
0.4
0.5
0.6
0.7
0.8
0.9
1
0 1 2 3 4 5
Risk (Standard Deviation)
Ret
urn
(m
on
thly
ave
rag
e %
)
SC UNIVERSE BOND INDEX
90 day T-BILLS
HIGH YIELD 1
S&P/TSX
SMALL CAP.EQUITIES
SCLONG BOND INDEX
15
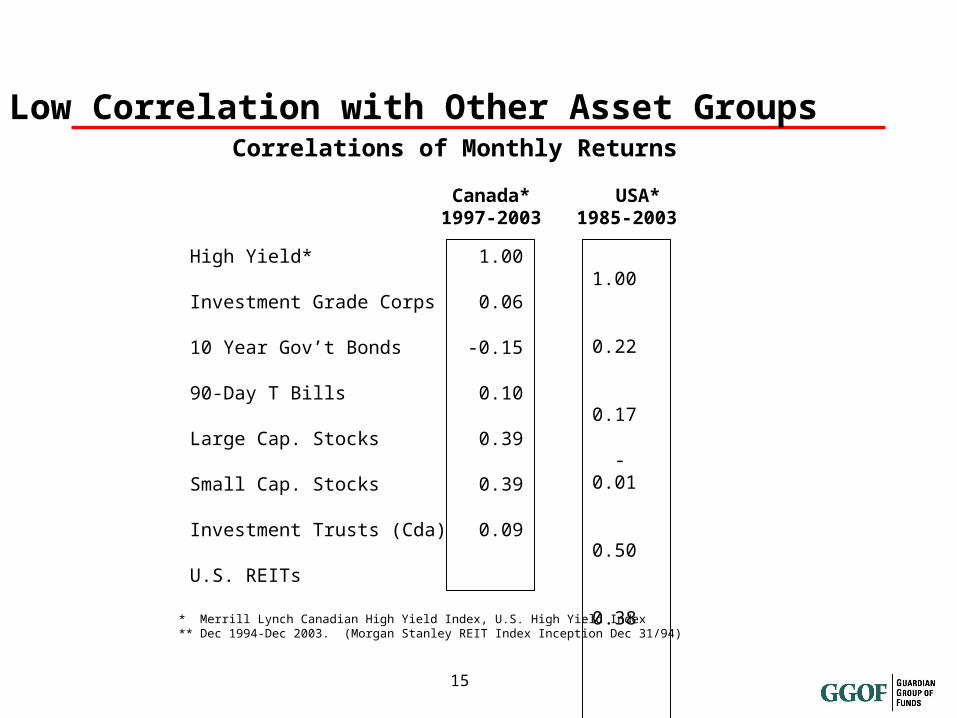
High Yield*
Investment Grade Corps
10 Year Gov’t Bonds
90-Day T Bills
Large Cap. Stocks
Small Cap. Stocks
Investment Trusts (Cda)
U.S. REITs
1.00
0.06
-0.15
0.10
0.39
0.39
0.09
Correlations of Monthly Returns
* Merrill Lynch Canadian High Yield Index, U.S. High Yield Index** Dec 1994-Dec 2003. (Morgan Stanley REIT Index Inception Dec 31/94)
1.00
0.22
0.17
-0.01
0.50
0.38
0.31**
Canada*1997-2003
USA*1985-2003
Low Correlation with Other Asset Groups
16
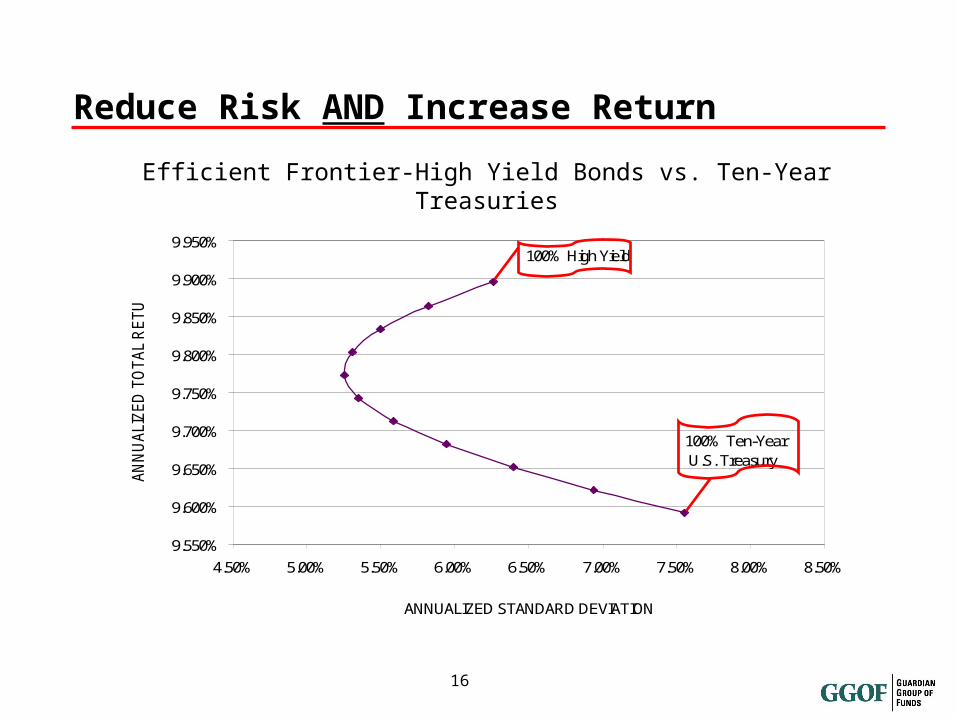
Reduce Risk AND Increase Return
Efficient Frontier-High Yield Bonds vs. Ten-Year Treasuriesmonthly, 1985 - Q1 2003
Source: Merrill Lynch & Co.
9.550%
9.600%
9.650%
9.700%
9.750%
9.800%
9.850%
9.900%
9.950%
4.50% 5.00% 5.50% 6.00% 6.50% 7.00% 7.50% 8.00% 8.50%
ANNUALIZED STANDARD DEVIATION
AN
NU
ALI
ZE
D T
OT
AL
RE
TU
RN
100% Ten-Year U.S. Treasury
100% High Yield
17
High Yield Bonds
• Dual nature helps performance in all market environments
• Interest-sensitive nature causes price appreciation when interest rates fall
• Stronger economies that produce rising rates also benefit high yield issuer companies
• Low correlation with other asset classes provides diversification benefits
• Total returns driven by income, not capital gains
• Keys are credit analysis and issuer knowledge
• Fund eliminates most of the single issuer risk
18
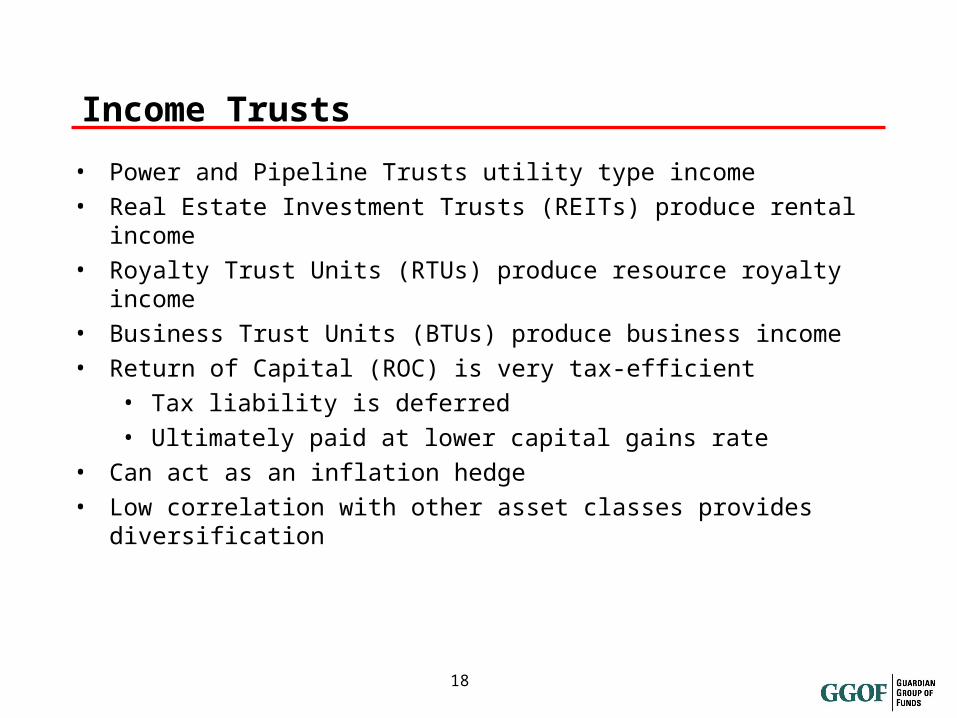
Income Trusts
• Power and Pipeline Trusts utility type income
• Real Estate Investment Trusts (REITs) produce rental income
• Royalty Trust Units (RTUs) produce resource royalty income
• Business Trust Units (BTUs) produce business income
• Return of Capital (ROC) is very tax-efficient
• Tax liability is deferred
• Ultimately paid at lower capital gains rate
• Can act as an inflation hedge
• Low correlation with other asset classes provides diversification
19
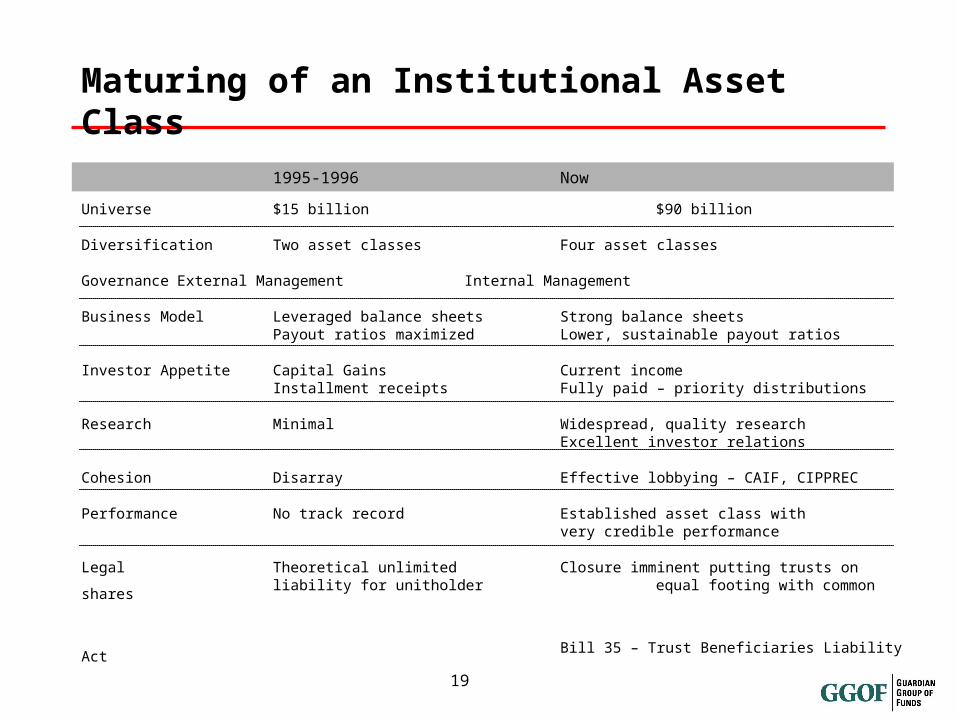
Maturing of an Institutional Asset Class
1995-1996 Now
Universe $15 billion $90 billion
Diversification Two asset classes Four asset classes
Governance External Management Internal Management
Business Model Leveraged balance sheets Strong balance sheetsPayout ratios maximized Lower, sustainable payout ratios
Investor Appetite Capital Gains Current incomeInstallment receipts Fully paid – priority distributions
Research Minimal Widespread, quality researchExcellent investor relations
Cohesion Disarray Effective lobbying – CAIF, CIPPREC
PerformanceNo track record Established asset class with very credible performance
Legal Theoretical unlimited Closure imminent putting trusts onliability for unitholder equal footing with common shares
Bill 35 – Trust Beneficiaries Liability Act
20
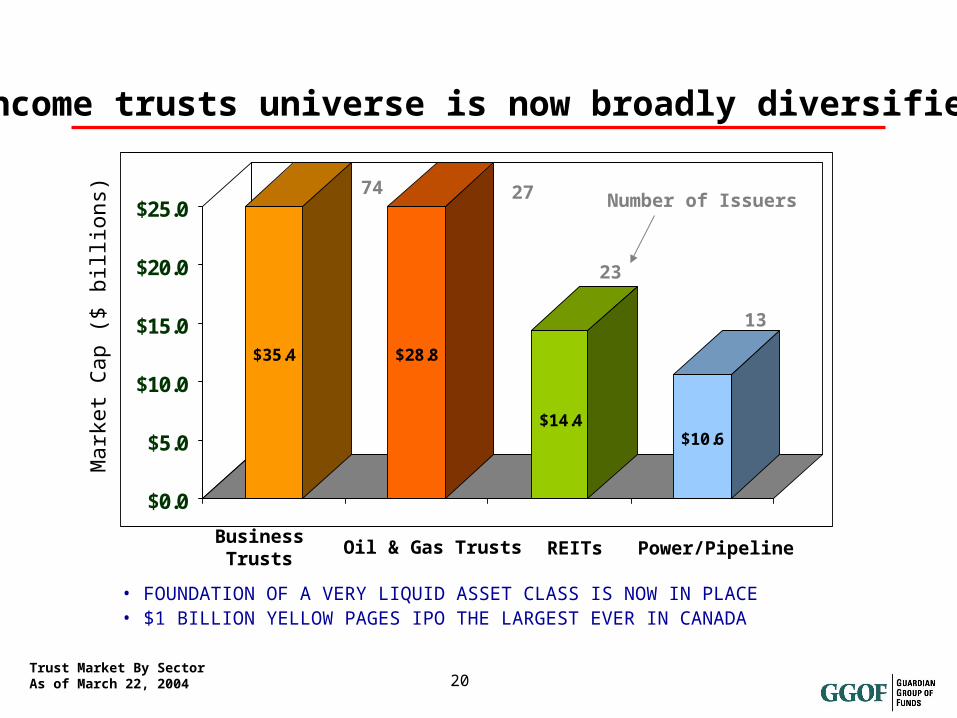
$35.4 $28.8
$14.4$10.6
$0.0
$5.0
$10.0
$15.0
$20.0
$25.0
Oil & Gas TrustsBusiness Trusts REITs Power/Pipeline
Mark
et
Cap
($
bill
ions)
74 27
23
13
Income trusts universe is now broadly diversified
Trust Market By SectorAs of March 22, 2004
• FOUNDATION OF A VERY LIQUID ASSET CLASS IS NOW IN PLACE• $1 BILLION YELLOW PAGES IPO THE LARGEST EVER IN CANADA
Number of Issuers
21
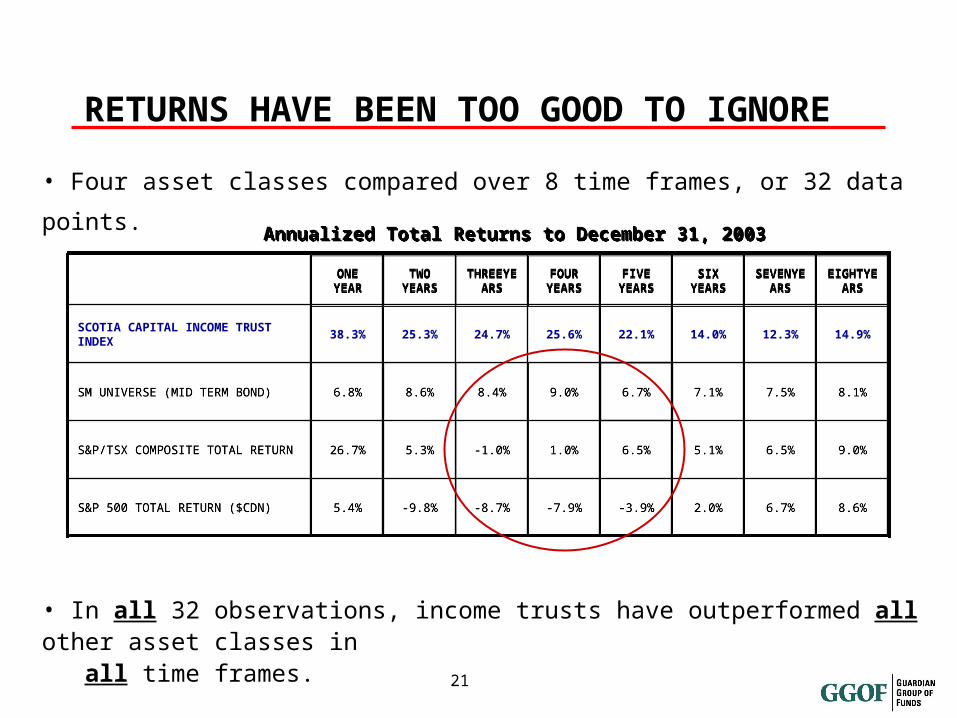
RETURNS HAVE BEEN TOO GOOD TO IGNORE
Annualized Total Returns to December 31, 2003Annualized Total Returns to December 31, 2003
• Four asset classes compared over 8 time frames, or 32 data points.
• In all 32 observations, income trusts have outperformed all other asset classes in all time frames.
5.4%5.4%
26.7%26.7%
6.8%6.8%
38.3%
ONE YEARONE
YEAR
8.6%8.6%6.7%6.7%2.0%2.0%-3.9%-3.9%-7.9%-7.9%-8.7%-8.7%-9.8%-9.8%S&P 500 TOTAL RETURN ($CDN)S&P 500 TOTAL RETURN ($CDN)
9.0%9.0%6.5%6.5%5.1%5.1%6.5%6.5%1.0%1.0%-1.0%-1.0%5.3%5.3%S&P/TSX COMPOSITE TOTAL RETURNS&P/TSX COMPOSITE TOTAL RETURN
8.1%8.1%7.5%7.5%7.1%7.1%6.7%6.7%9.0%9.0%8.4%8.4%8.6%8.6%SM UNIVERSE (MID TERM BOND)SM UNIVERSE (MID TERM BOND)
14.9%12.3%14.0%22.1%25.6%24.7%25.3%SCOTIA CAPITAL INCOME TRUST INDEX
EIGHTYEARS
EIGHTYEARS
SEVENYEARS
SEVENYEARS
SIX YEARS
SIX YEARS
FIVE YEARS
FIVE YEARS
FOUR YEARSFOUR
YEARSTHREEY
EARSTHREEY
EARSTWO
YEARSTWO
YEARS
22
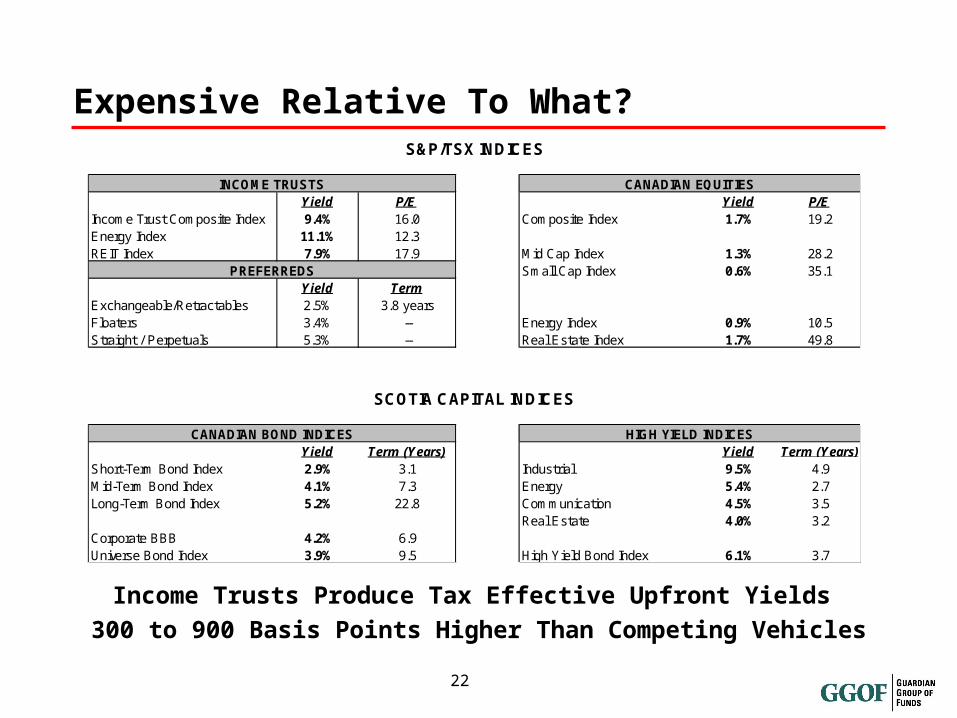
Expensive Relative To What?
Income Trusts Produce Tax Effective Upfront Yields 300 to 900 Basis Points Higher Than Competing Vehicles
Yield P/E Yield P/EIncome Trust Composite Index 9.4% 16.0 Composite Index 1.7% 19.2Energy Index 11.1% 12.3REIT Index 7.9% 17.9 Mid Cap Index 1.3% 28.2
Small Cap Index 0.6% 35.1Yield Term
Exchangeable/Retractables 2.5% 3.8 yearsFloaters 3.4% -- Energy Index 0.9% 10.5Straight / Perpetuals 5.3% -- Real Estate Index 1.7% 49.8
Yield Term (Years) Yield Term (Years)Short-Term Bond Index 2.9% 3.1 Industrial 9.5% 4.9Mid-Term Bond Index 4.1% 7.3 Energy 5.4% 2.7Long-Term Bond Index 5.2% 22.8 Communication 4.5% 3.5
Real Estate 4.0% 3.2Corporate BBB 4.2% 6.9Universe Bond Index 3.9% 9.5 High Yield Bond Index 6.1% 3.7
S&P/TSX INDICES
INCOME TRUSTS
CANADIAN BOND INDICES
CANADIAN EQUITIES
HIGH YIELD INDICES
PREFERREDS
SCOTIA CAPITAL INDICES
23
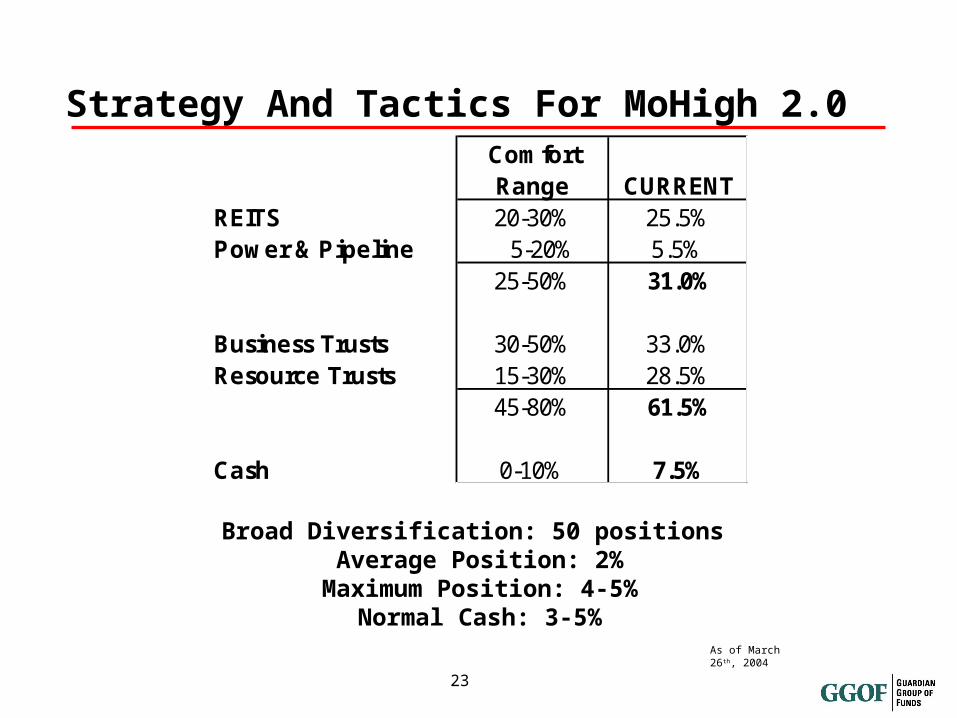
Strategy And Tactics For MoHigh 2.0
Broad Diversification: 50 positions Average Position: 2%
Maximum Position: 4-5%Normal Cash: 3-5%
ComfortRange CURRENT
REITS 20-30% 25.5%Power & Pipeline 5-20% 5.5%
25-50% 31.0%
Business Trusts 30-50% 33.0%Resource Trusts 15-30% 28.5%
45-80% 61.5%
Cash 0-10% 7.5%
As of March 26th, 2004
24
RETURN
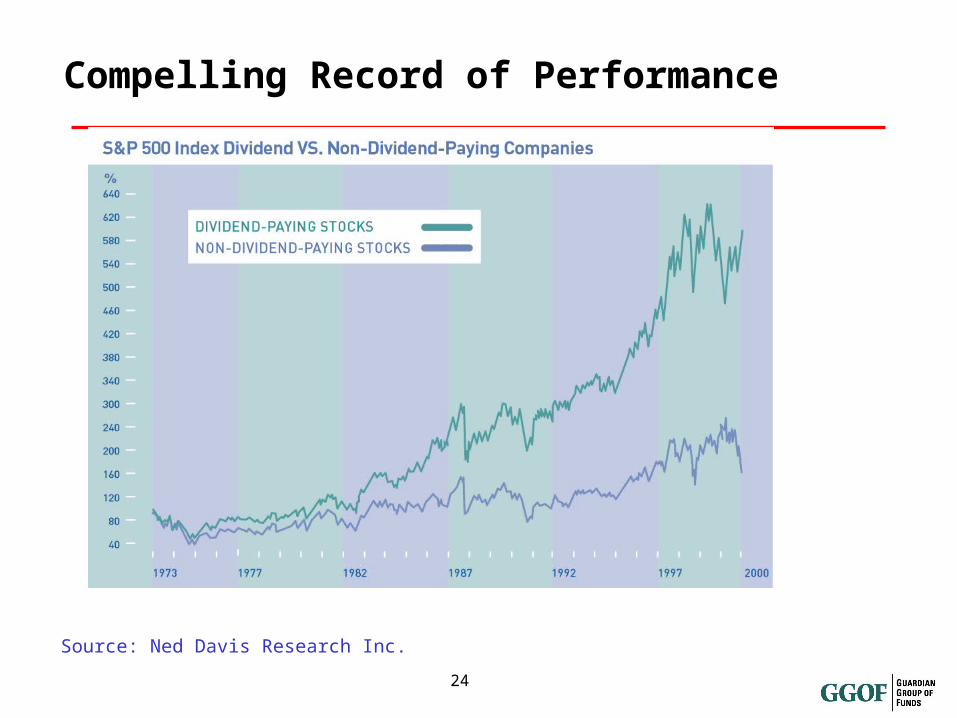
Compelling Record of Performance
Source: Ned Davis Research Inc.
25
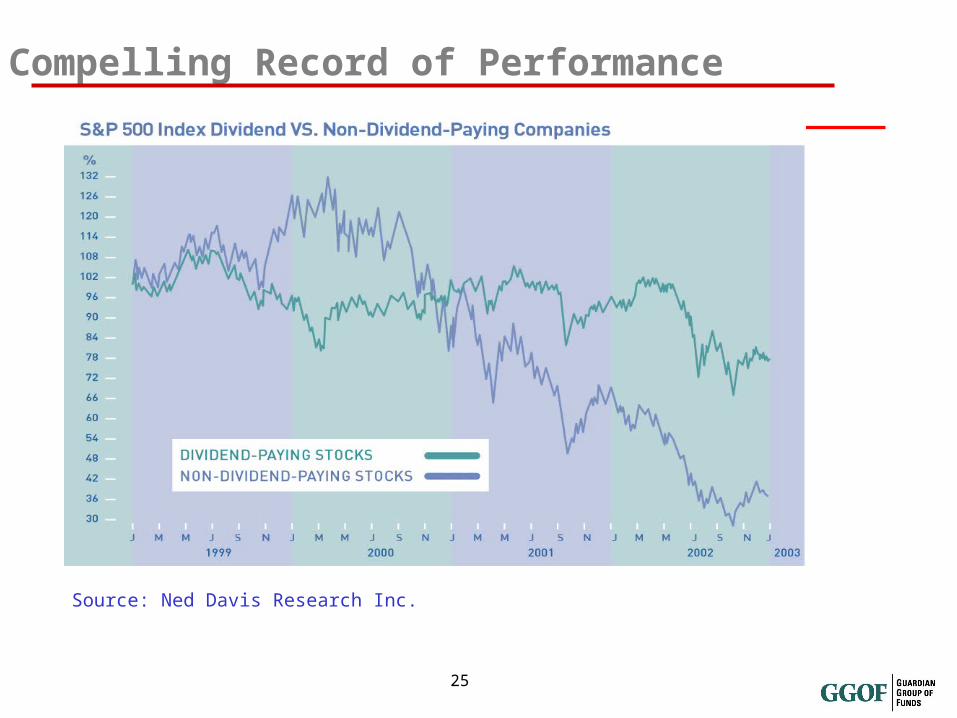
Source: Ned Davis Research Inc.
Compelling Record of Performance
26
50
100
150
200
250
300
350
400
450
Jan-98 May-98 Sep-98 Jan-99 May-99 Sep-99 Jan-00 May-00 Sep-00 Jan-01 May-01 Sep-01 Jan-02 May-02 Sep-02 Jan-03
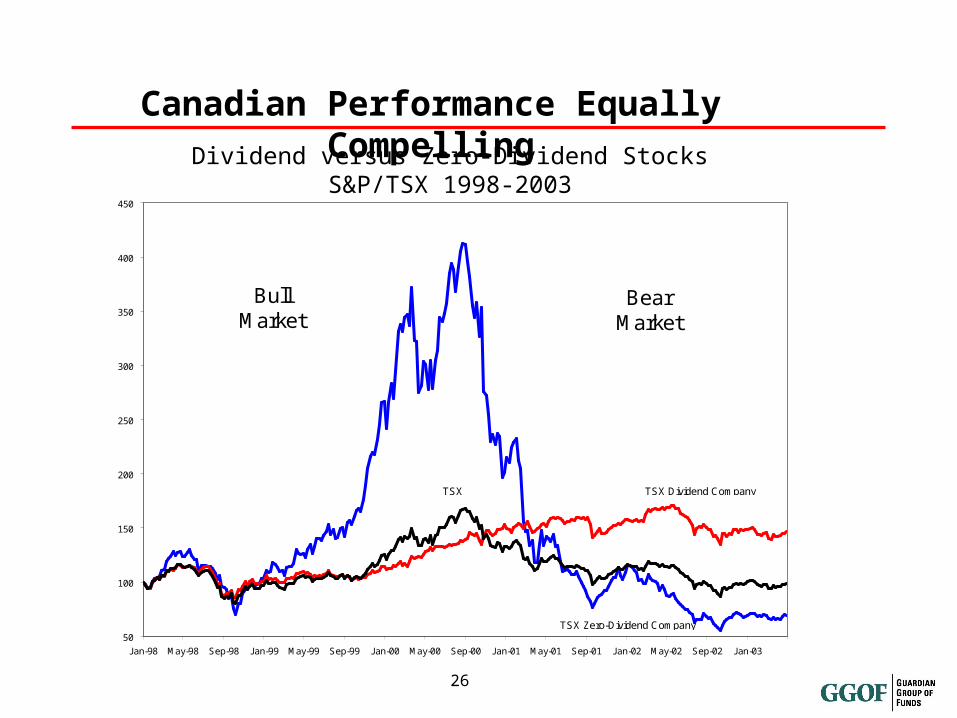
Bull Market
Bear Market
TSX Dividend Company
TSX Zero-Dividend Company
TSX
Canadian Performance Equally Compelling
Dividend versus Zero-Dividend StocksS&P/TSX 1998-2003
27
• In an era of modest equity returns, dividends are an important component of total return.
• $1.00 of dividend income and $1.25 - $1.30 of interest income both produce the same after-tax income
• Dividend yield provides greater stability than non dividend-paying shares
• Good companies with skilled management and dominant industry positions create capital and dividend growth
Dividend-paying Common Shares
28
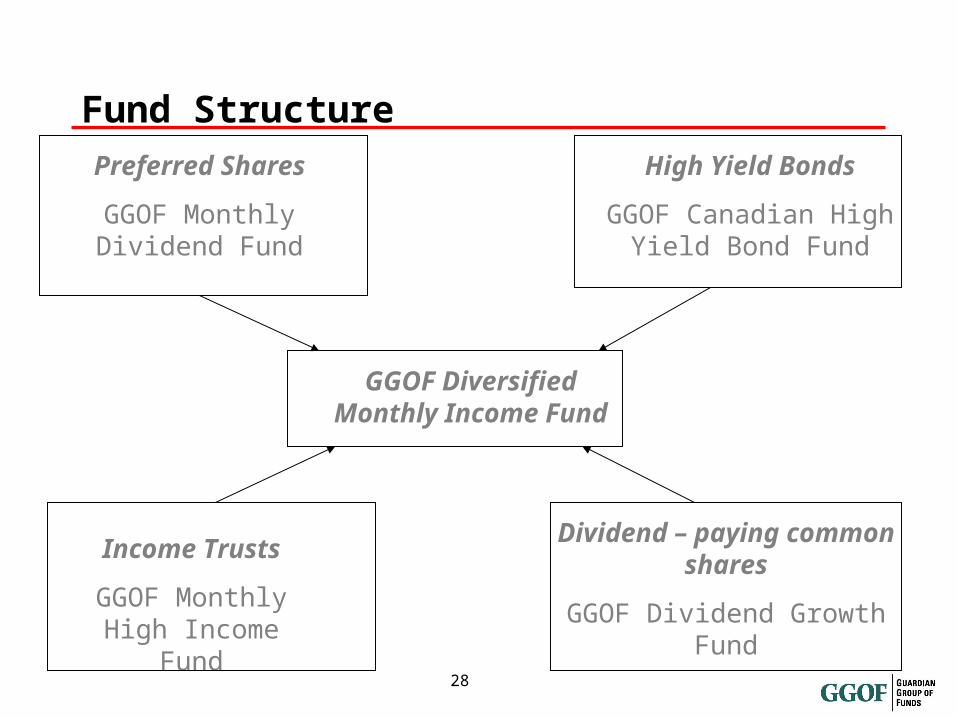
Fund Structure
Preferred Shares
GGOF Monthly Dividend Fund
High Yield Bonds
GGOF Canadian High Yield Bond Fund
GGOF Diversified Monthly Income Fund
Income Trusts
GGOF Monthly High Income Fund
Dividend – paying common shares
GGOF Dividend Growth Fund
29
Fund Benefits
• Provides tax-advantaged monthly income of 3.5 cents
• Comprised of four separate asset classes – 25% in each asset class
• Asset classes show little correlation with each other, ensuring superior diversification benefits
• Provides an easy, convenient way to invest in one product based on 4 successful GGOF funds
• Managers among the best in Canada
• John Priestman/Kevin Hall (Guardian Capital)
• Steve Kearns (Guardian Capital)
• Michael Stanley (Jones Heward)
30
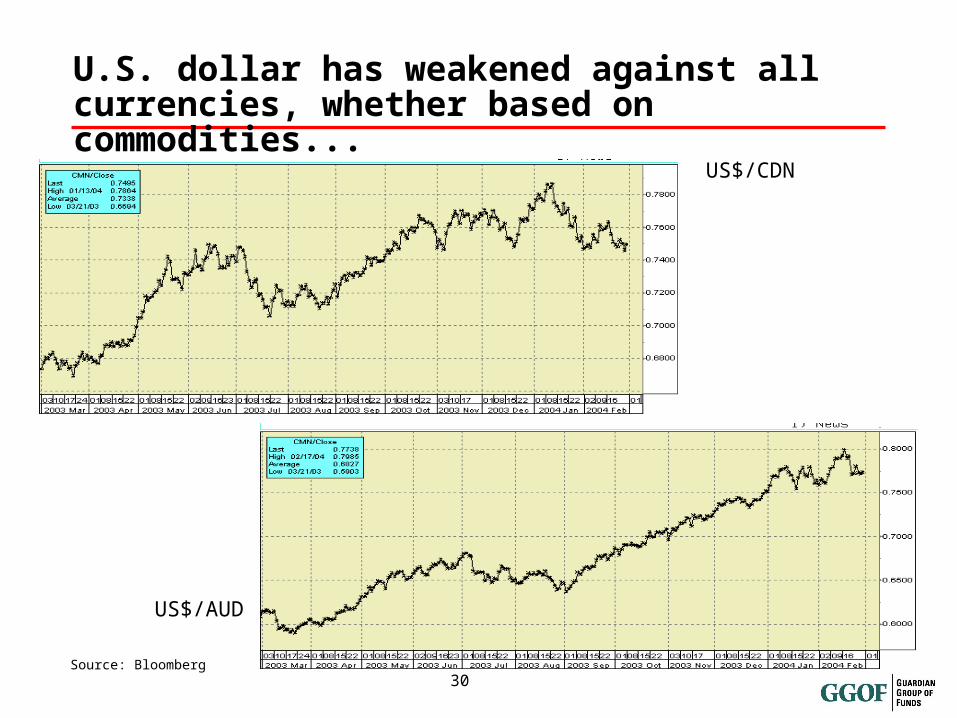
U.S. dollar has weakened against all currencies, whether based on commodities...
Source: Bloomberg
US$/AUD
US$/CDN
31
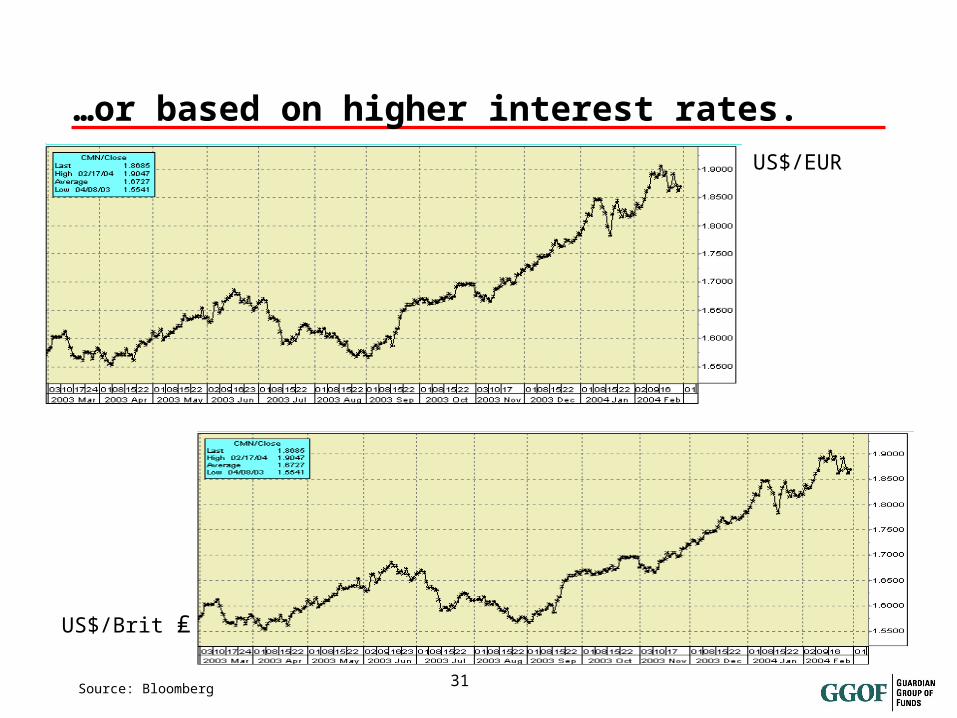
…or based on higher interest rates.
Source: Bloomberg
US$/EUR
US$/Brit ₤
32
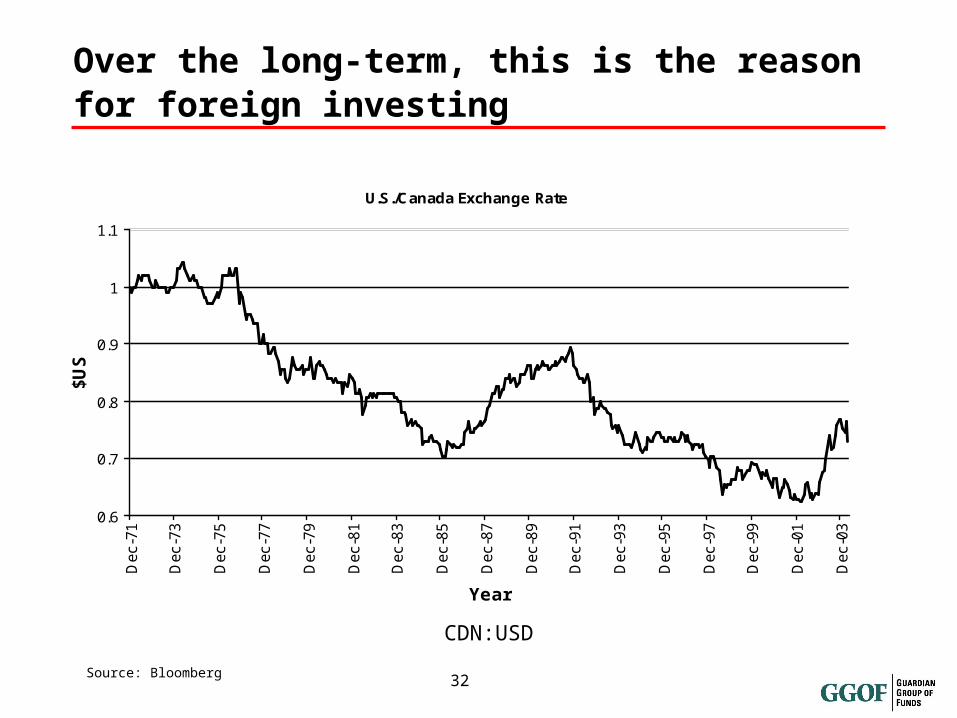
CDN:USD
Source: Bloomberg
Over the long-term, this is the reasonfor foreign investing
U.S./Canada Exchange Rate
0.6
0.7
0.8
0.9
1
1.1
Dec-7
1
Dec-7
3
Dec-7
5
Dec-7
7
Dec-7
9
Dec-8
1
Dec-8
3
Dec-8
5
Dec-8
7
Dec-8
9
Dec-9
1
Dec-9
3
Dec-9
5
Dec-9
7
Dec-9
9
Dec-0
1
Dec-0
3
Year
$US
33
ASIA
The Case for Asia
34
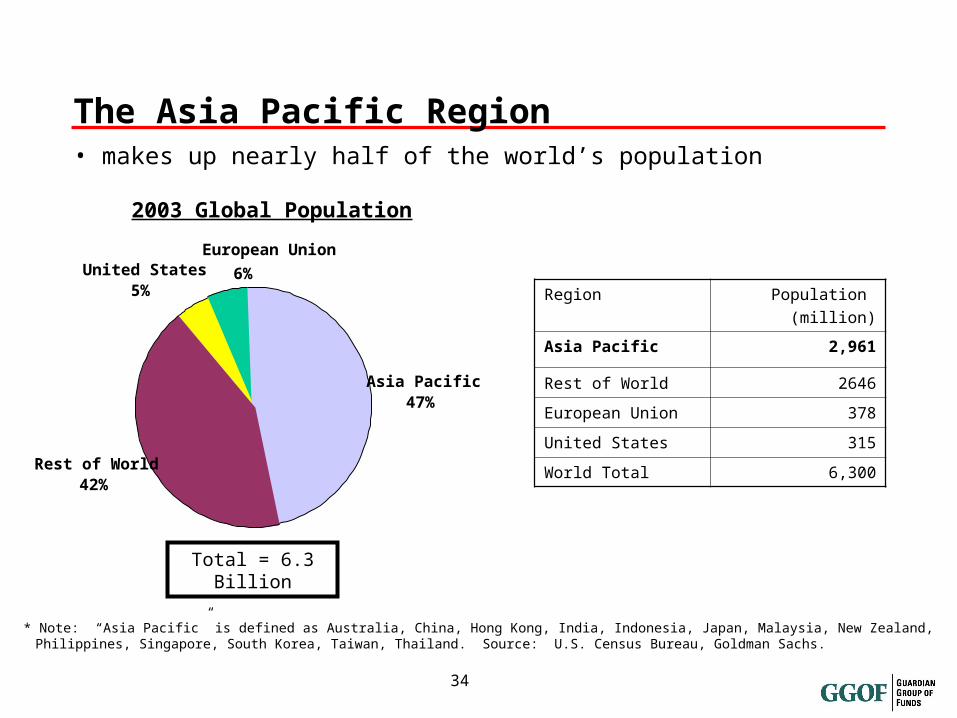
2003 Global Population
United States5%
Asia Pacific47%
Rest of World42%
European Union
6%
Total = 6.3 Billion
* Note: “Asia Pacific” is defined as Australia, China, Hong Kong, India, Indonesia, Japan, Malaysia, New Zealand, Philippines, Singapore, South Korea, Taiwan, Thailand. Source: U.S. Census Bureau, Goldman Sachs.
• makes up nearly half of the world’s population
Region Population
(million)
Asia Pacific 2,961
Rest of World 2646
European Union 378
United States 315
World Total 6,300
The Asia Pacific Region
35
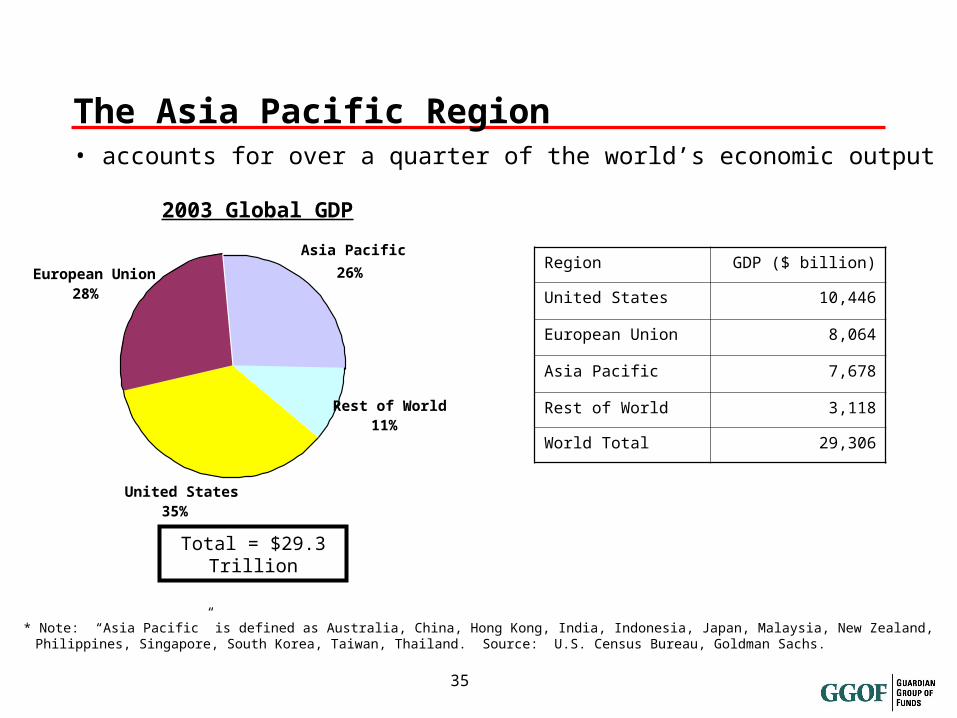
2003 Global GDP
United States35%
European Union28%
Asia Pacific
26%
Rest of World11%
Total = $29.3 Trillion
* Note: “Asia Pacific” is defined as Australia, China, Hong Kong, India, Indonesia, Japan, Malaysia, New Zealand, Philippines, Singapore, South Korea, Taiwan, Thailand. Source: U.S. Census Bureau, Goldman Sachs.
• accounts for over a quarter of the world’s economic output
Region GDP ($ billion)
United States 10,446
European Union 8,064
Asia Pacific 7,678
Rest of World 3,118
World Total 29,306
The Asia Pacific Region
36
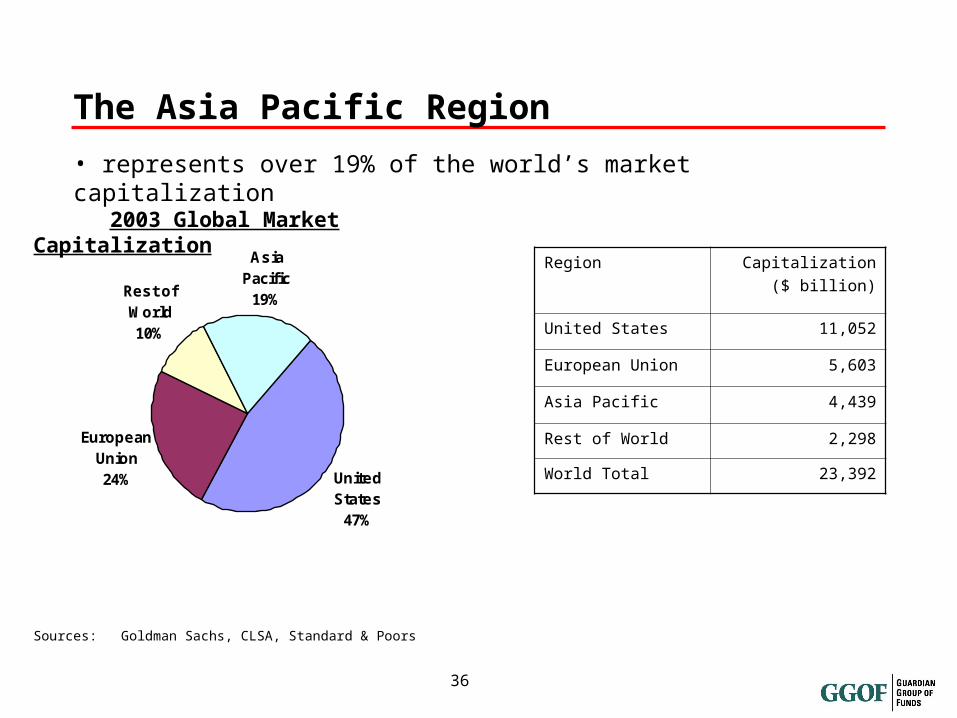
Sources: Goldman Sachs, CLSA, Standard & Poors
• represents over 19% of the world’s market capitalization
Region Capitalization
($ billion)
United States 11,052
European Union 5,603
Asia Pacific 4,439
Rest of World 2,298
World Total 23,392United States
47%
European Union24%
Rest of World10%
Asia Pacific
19%
2003 Global Market Capitalization
The Asia Pacific Region
37
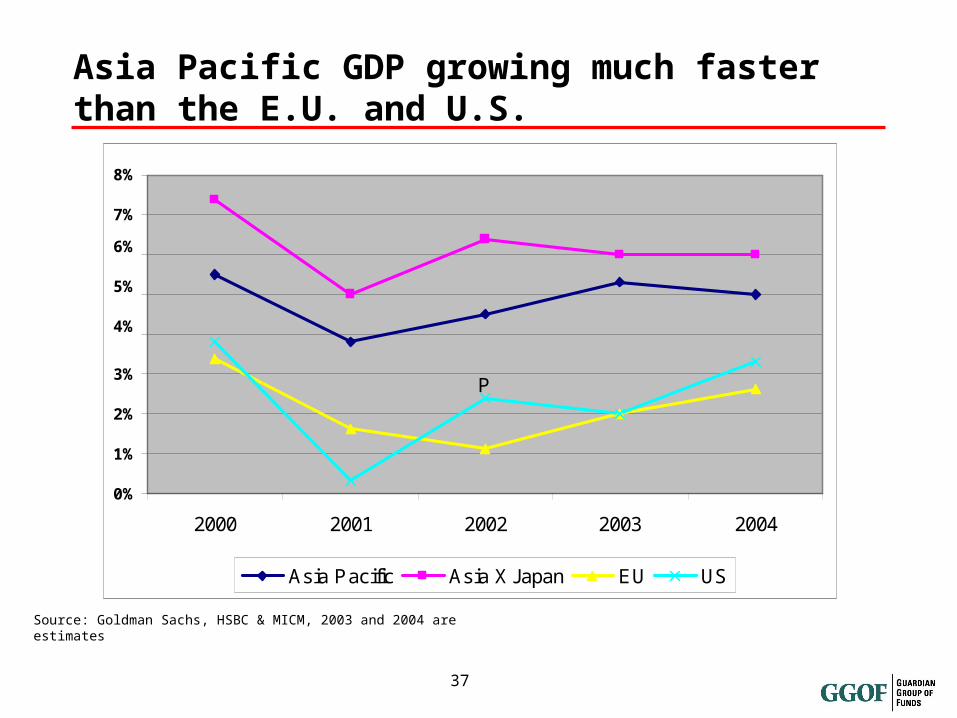
0
1
2
3
4
5
6
7
8
2000 2001 2002 2003 2004
Asia Pacific Asia X Japan EU US
P
Asia Pacific GDP growing much faster than the E.U. and U.S.
Source: Goldman Sachs, HSBC & MICM, 2003 and 2004 are estimates
8%
6%
5%
4%
3%
2%
1%
0%
7%
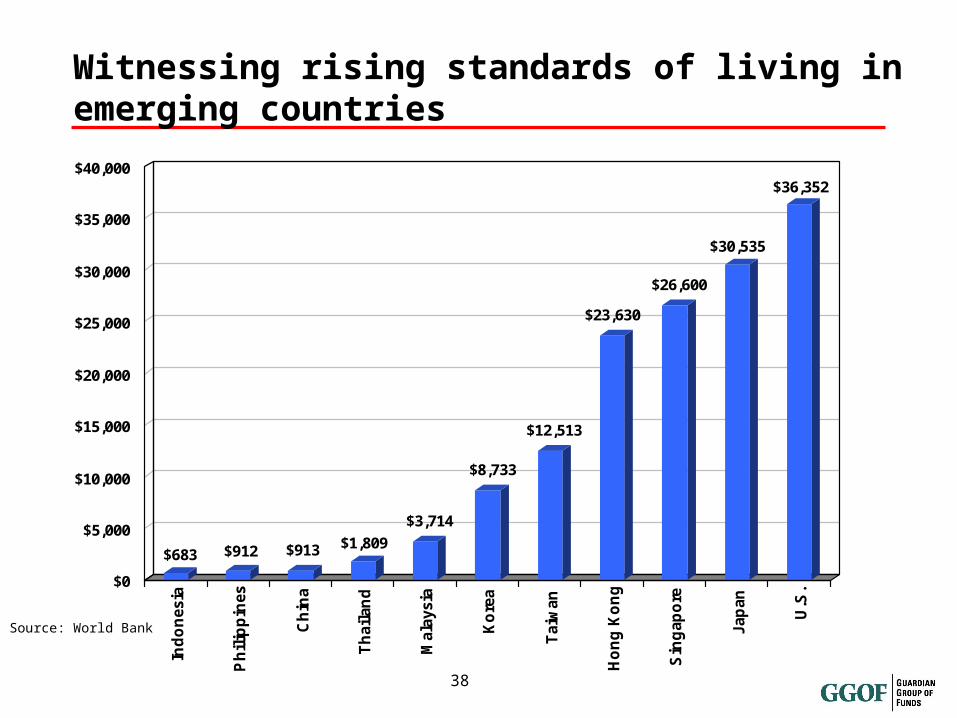
38
$683 $912 $913 $1,809
$3,714
$8,733
$12,513
$23,630
$26,600
$30,535
$36,352
$0
$5,000
$10,000
$15,000
$20,000
$25,000
$30,000
$35,000
$40,000In
do
nesia
Ph
ilip
pin
es
Ch
ina
Th
ail
an
d
Mala
ysia
Ko
rea
Taiw
an
Ho
ng
Ko
ng
Sin
gap
ore
Jap
an
U.S
.
Witnessing rising standards of living in emerging countries
Source: World Bank
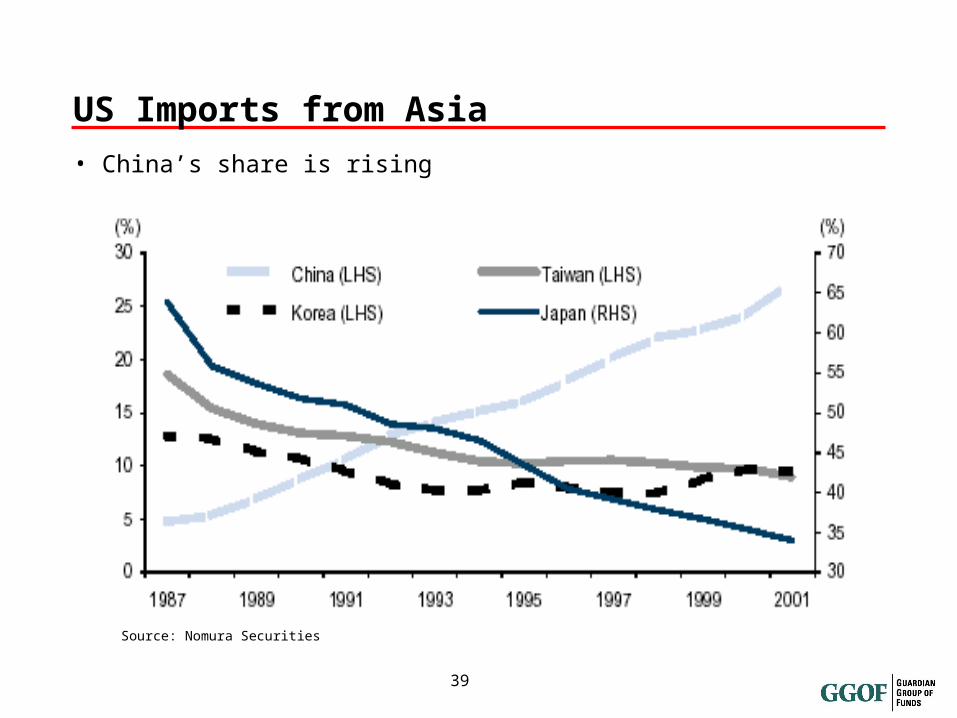
39
US Imports from Asia
Source: Nomura Securities
• China’s share is rising
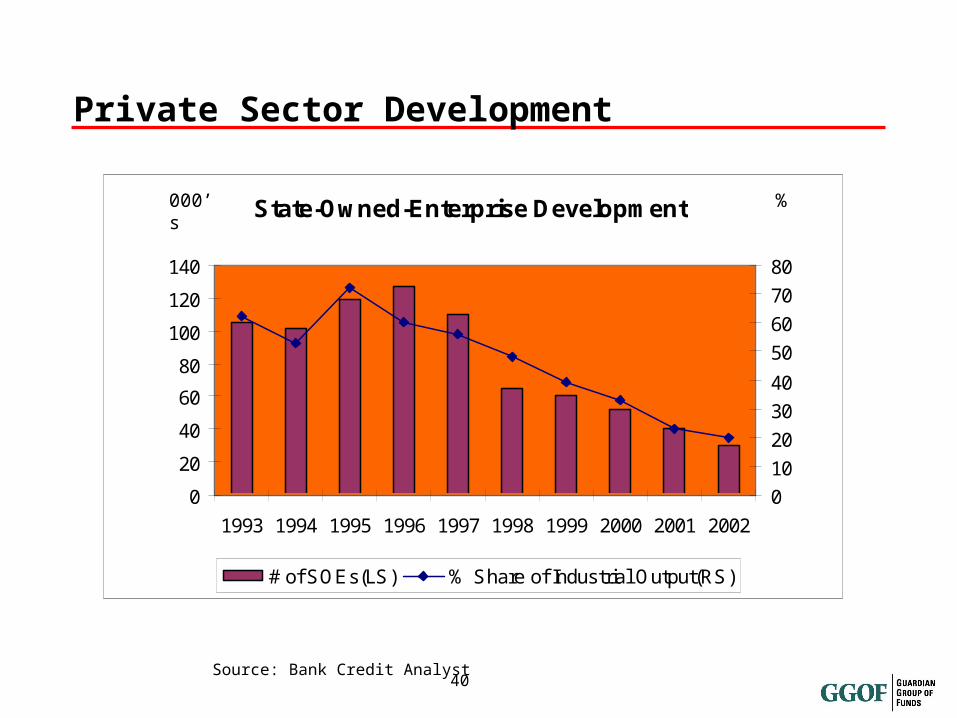
40
Private Sector Development
Source: Bank Credit Analyst
State-Owned-Enterprise Development
0
20
40
60
80
100
120
140
1993 1994 1995 1996 1997 1998 1999 2000 2001 2002
0
10
20
30
40
50
60
70
80
# of SOEs(LS) % Share of Industrial Output(RS)
000’s %
41
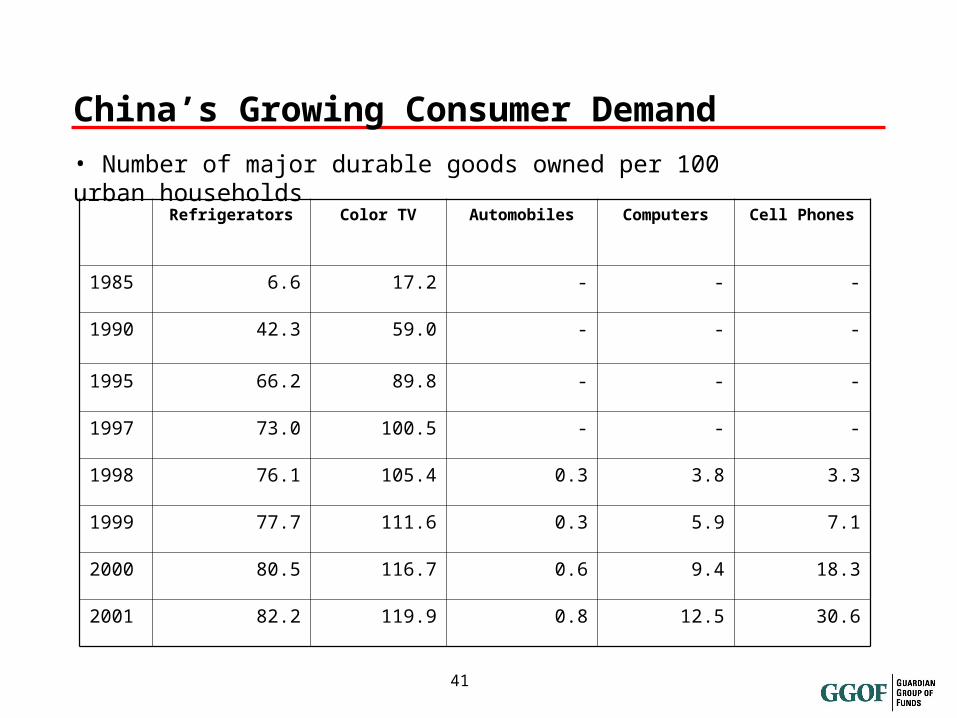
China’s Growing Consumer Demand
Refrigerators Color TV Automobiles Computers Cell Phones
1985 6.6 17.2 - - -
1990 42.3 59.0 - - -
1995 66.2 89.8 - - -
1997 73.0 100.5 - - -
1998 76.1 105.4 0.3 3.8 3.3
1999 77.7 111.6 0.3 5.9 7.1
2000 80.5 116.7 0.6 9.4 18.3
2001 82.2 119.9 0.8 12.5 30.6
• Number of major durable goods owned per 100 urban households
42
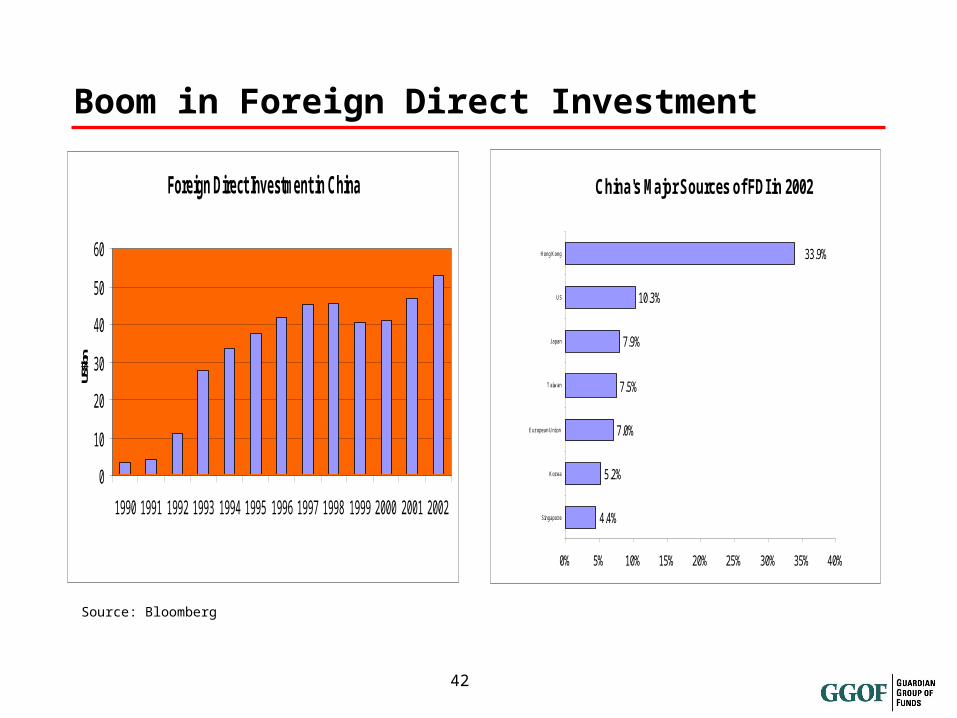
Boom in Foreign Direct Investment
Foreign Direct Investment in China
0
10
20
30
40
50
60
1990 1991 1992 1993 1994 1995 1996 1997 1998 1999 2000 2001 2002
US$ b
n
Source: Bloomberg
China's Major Sources of FDI in 2002
5.2%
7.0%
7.5%
7.9%
10.3%
4.4%
33.9%
0% 5% 10% 15% 20% 25% 30% 35% 40%
Singapor e
Kor ea
E ur opean Union
T aiwan
J apan
US
Hong Kong
43
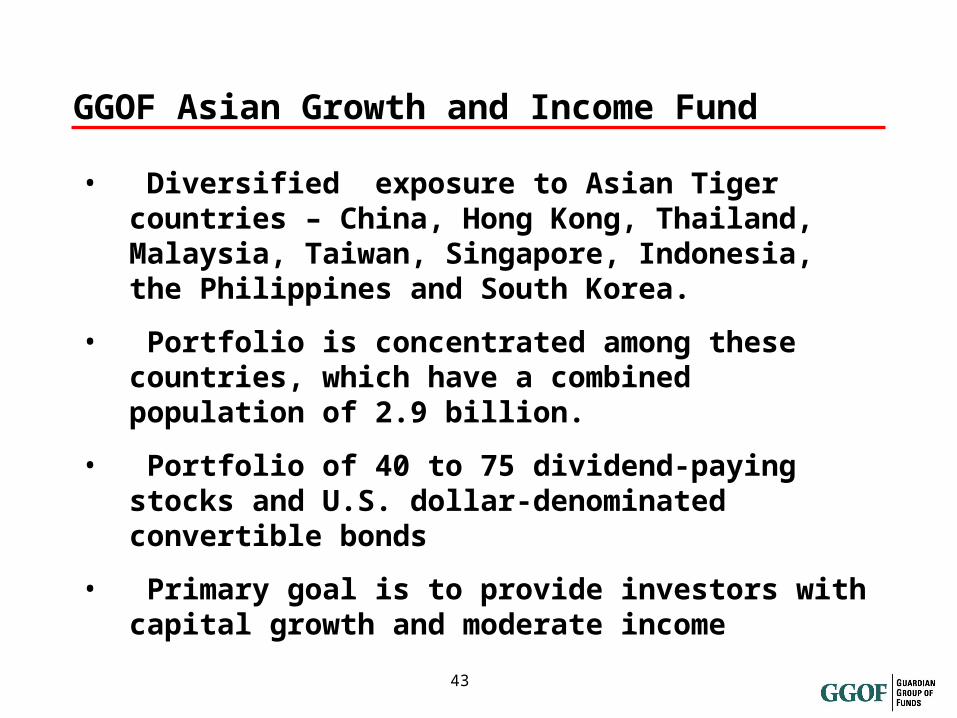
GGOF Asian Growth and Income Fund
• Diversified exposure to Asian Tiger countries – China, Hong Kong, Thailand, Malaysia, Taiwan, Singapore, Indonesia, the Philippines and South Korea.
• Portfolio is concentrated among these countries, which have a combined population of 2.9 billion.
• Portfolio of 40 to 75 dividend-paying stocks and U.S. dollar-denominated convertible bonds
• Primary goal is to provide investors with capital growth and moderate income
44
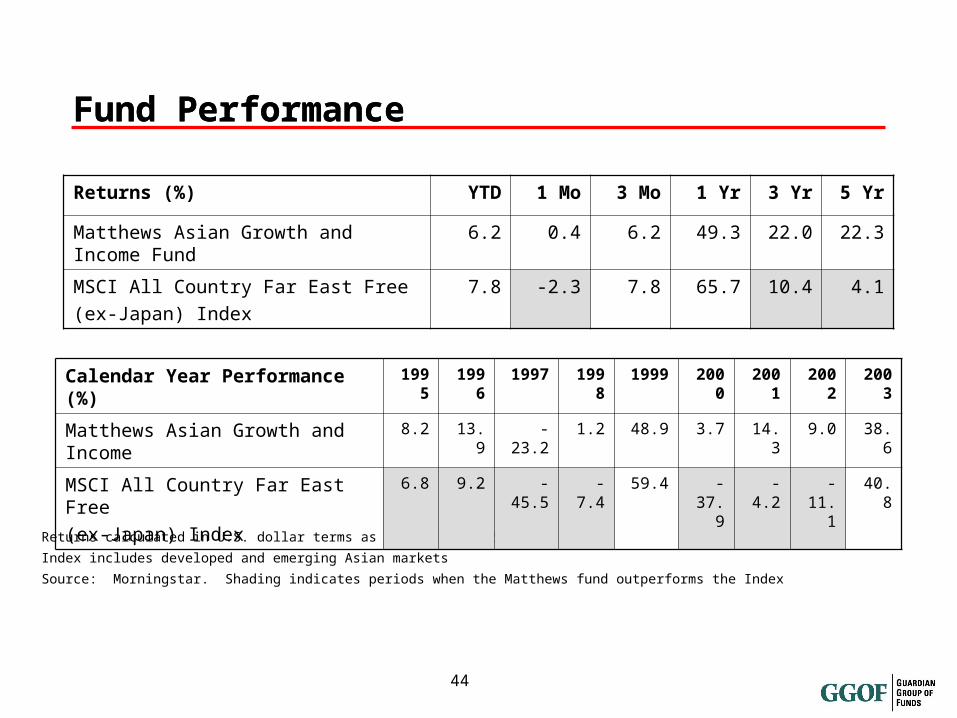
Fund PerformanceFund Performance
Returns calculated in U.S. dollar terms as of March 31, 2004
Index includes developed and emerging Asian markets
Source: Morningstar. Shading indicates periods when the Matthews fund outperforms the Index
Returns (%) YTD 1 Mo 3 Mo 1 Yr 3 Yr 5 Yr
Matthews Asian Growth and Income Fund 6.2 0.4 6.2 49.3 22.0 22.3
MSCI All Country Far East Free
(ex-Japan) Index
7.8 -2.3 7.8 65.7 10.4 4.1
Calendar Year Performance (%) 1995 1996 1997 1998 1999 2000 2001 2002 2003
Matthews Asian Growth and Income 8.2 13.9 -23.2 1.2 48.9 3.7 14.3 9.0 38.6
MSCI All Country Far East Free
(ex-Japan) Index
6.8 9.2 -45.5 -7.4 59.4 -37.9 -4.2 -11.1 40.8
45
Conclusion
• Single digit returns for most Canadian asset classes over the next 12 – 24 months
• Current income a much larger portion of total return.
• High yield bonds and more trusts good compliment to equities and government bonds (low correlation)
• The investment for Asia remains very positive.
46
Sales commissions, service fees, management fees and expenses all may be associated with mutual fund investments. Please read the prospectus before investing. The indicated rates of return include changes in unit value and assume reinvestment of all distributions, and do not take into account sales, redemption or optional charges or income taxes payable by any securityholders, which would have reduced returns. Mutual funds are not guaranteed, their values change frequently and past performance may not be repeated.
Disclaimer