Embed Size (px)
Citation preview
DIC .L CP 0(71
Mq David Taylor Research CenterBethesda, MD 20084-5000
DTRC-SME-89/67 September 1989
Ship Materials Engineering DepartmentResearch & Development Report
_ Through-Thickness Strain Response ofThick Composites in Compression
E byC. E.T. Camponeschi, Jr.
.i
0~E0 -7 r-y'
JAN 301990CI1.2
* 4''U
( D Approved tor public release; distribution unlimited.
I -_ ____ ___ ____ ____ ___ ____ ____ ___

CODE 011 DIRECTOR OF TECHNOLOGY, PLANS AND ASSESSMENT
12 SHIP SYSTEMS INTEGRATION DEPARTMENT
14 SHIP ELECTROMAGNETIC SIGNATURES DEPARTMENT
15 SHIP HYDROMECHANICS DEPARTMENT
16 AVIATION DEPARTMENT
17 SHIP STRUCTURES AND PROTECTION DEPARTMENT
18 COMPUTATION, MATHEMATICS & LOGISTICS DEPARTMENT
19 SHIP ACOUSTICS DEPARTMENT
27 PROPULSION AND AUXILIARY SYSTEMS DEPARTMENT
28 SHIP MATERIALS ENGINEERING DEPARTMENT
DTRC ISSUES THREE TYPES OF REPORTS:
1. DTRC reports, a formal series, contain information of permanent technical value.They carry a consecutive numerical identification regardless of their classification or theoriginating department.
2. Departmental reports, a semiformal series, contain information of a preliminary,temporary, or proprietary nature or of limited interest or significance. They carry adepartmental alphanumerical identification.
3. Technical memoranda, an informal series, contain technical documentation oflimited use and interest. They are primarily working papers intended for internal use. Theycarry an identifying number which indicates their type and the numerical code of theoriginating department. Any distribution outside DTRC must be approved by the head ofthe originating department on a case-by-case basis.
NOW-DTNSRDC 5602151 (Rev 2-88)

Urclas's ified'SECuFY CLASSIFICATION OF HIS PAZE
REPORT DOCUMENTATION PAGE
Ia. REPORT SECURITY CLASSIFICATION lb. RESTRICTIVE MARKINGS
Unclassified2a. SECURITY CLASSIFICATION AUTHORITY 3. DISTRIBUTION /AVAILABILITY OF REPORT
Approved for public release;2b. OECLASSIFICATION /DOWNGRADING SCHEDULE distribution unlimited.
4 PERFORMING ORGANIZATION REPORT NUMBER(S) S. MONITORING ORGANIZATION REPORT NUMBER(S)
DTRC-SME-89/67
6a NAME OF PERFORMING ORGANIZATION 6b OFFICE SYMBOL 7a. NAME OF MONITORING ORGANIZATIONDavid Taylor (if applicable)
Research Center . _Code 28026C ADDRESS (City State, and ZIPCode) 7b. ADDRESS (City, State, and ZIP Code)
Annapolis, MD 21402-5067
8a. NAME OF FUNDING /SPONSORING 8b. OFFICE SYMBOL 9. PROCUREMENT INSTRUMENT IDENTIFICATION NUMBERORGANIZATION David Taylor (If applicable).Research Center JCode 0113
Bc AODRESS(City. State. and ZIP Code) 10. SOURCE.OF FUNDING NUMBERSPROGRAM IPROJECT ITASK WORK UNITELEMENT NO. NO. NO. ACCESSION NO
Bethesda, MD 20084-5000 61152N 1720-476
11 TItLE (Include Security Classification)
(U) Thr'ough-Thickness Strain Response of Thick Composites in Compression
12 PFRSONAL AUTHOR(S)Eugene T. Camponeschi, Jr.
13a TYPE OF REPORT 13b. TIME COVERED 14. DATE OF REPORr mYar,~ month, Dayl) S. P, GE COUNTRDT&E FROM 8/87 TO 8/89 1989 Sept 5
16 SUPPLEMENTARY NOTATION
17 COSATI CODES 18. SUBJECT TERMS (Continue on reverse if necesary and identify by block number)
FIELD GROUP SUB-GROUP Composite Materials, Thick-Section, Compression,3-D Properties
ABSTRACT (Continue on reverse if necesary and identify by block number)
ith the continued success of composite materials in high performance structures,new applications for Navy primary structure are being identified. Many of theseapplications require designs with composite materials having section thicknessesgreater than those that have been used and studied to date. Along with thisinterest in thick composite structures comes the need for full three-dimensionalstress analysis. The limits and accuracy of existing three-dimensional databases will dictate the limit and accuracy of corresponding analyses.
This report summarizes an investigation of the through-thickness strain responseof thick composite materials subjected to compressive loading. One-half inchthick (96 ply) carbon and S2 glass reinforced composites were studied. Athick-section compression test method has been developed for the purposes ofthis investigation. Using this test method the longitudinal and through-thickness
20 DISTRIBUTION /AVAILABILITY OF ABSTRACT 21. ABSTRACT SECURITY CLASSIFICATION 0
O:UNCLASSIFIEOUNLIMITEO 0 SAME AS RPT. QOTIC USERS Unclassified22a NAME OF RESPONSIBLE INDIVIDUAL 22b TELEPHONE (Include AreaCoda) 22c. OFFICE SYMBOL
E.T. Camponeschi, Jr. (301) 267-2165 1 Code 2802DO FORM 1473.84 MAR 83 APR edition may be used until exhausted SECURITY CLASSIFICATION OF THIS PAGE
All other editions are obsolete

Unclassified$ECUnITY CLASSIFICATION OF THIS PAGE
strain to failure, longitudinal modulus, inplane and through-thicknessPoisson's ratio, and ultimate strength of these materials have beendetermined. The through-thickness data from the 96 ply [0] coupons showthe materials to be transversely isotropic. The through-thickness datafrom 96 ply (0/0/901 laminates show good correlation with a theoreticalsolution that provides the nine elastic constants for thick orthotropicplates.(A )
ACCeSIOI For
NTIS CRA& NJDTIC TA& 0U:iantio ,:.x d 0.
By
* yColes
i1 *A-ror
Unclassfi ed8 SECURITY CLASSIFICATION OF THIS PAGEI I

CONTENTS
ABBREVIATIONS.................................................... v
ABSTRACT......................................................... 1
ADMINISTRATIVE INFORMATION...................................... 1
INTRODUCTION..................................................... 1
EXPERIMENTAL PROCEDURE.......................................... 3
DESCRIPTION OF TEST METHOD................................. 3
MATERIAL SYSTEMS........................................... 5
SPECIMEN GEOMETRY.......................................... 7
THROUGH-THICKNESS POISSON'S RATIO DETERMINATION .......... 10
RESULTS AND DISCUSSION.......................................... 13
CONCLUSIONS...................................................... 28
REFERENCES....................................................... 30
ACKNOWLEDGMENTS................................................. 30
FIGURES
1. Schematic of DTRC thick-section compression fixture ........ 4
2. Photograph of DTRC thick-section compression fixture . 6
3. Specimen geometry, material directions and strain gage
locations............................................................... 9
4. Permissible length/thickness ratios........................ 11
5. Longitudinal stress-strain plot - [0196
carbon/epoxy................................................ 14
6. Longitudinal stress-strain plot - 09
S2 glass/epoxy.............................................. 15
7. Longitudinal stress-strain plot - (O/O/90]16s
iii

carbon/epoxy ............................................ 16
8. Longitudinal stress-strain plot - [0/0/90]16s
S2 glass/epoxy ........................................... .17
9. Through-thickness versus longitudinal
strain plot - [0]96 and [0/0/90]16s
carbon/epoxy ............................................. 18
10. Through-thickness versus longitudinal
strain plot - (0]96 and [0/0/90]16s
S2 glass/epoxy ........................................... 19
11. NUxz sensitivity - carbon/epoxy ........................ 26
12. NUxz sensitivity - S2 glass/epoxy ...................... 27
TABLES
1. Specimen designations ..................................... 12
2. AS4/3501-6 longitudinal modulus and Poisson's
ratio data ................................................ 20
3. S2 Glass/3501-6 longitudinal modulus and Poisson's
ratio data ................................................ 21
4. Laminate input data for three-dimensional
elastic constant calculations ............................ 24
5. Comparison of theoretical and experimental
NUxz results .............................................. 25
iv

ABBREVIATIONS
C.V. Coefficient of variation
DTRC David Taylor Research Center
Ei i-direction modulus of elasticity
FVF fiber volume fraction
G. ijij-plane shear modulus of elasticity
Msi one-million pounds per square inch
NU.. ij-plane Poisson's ratio
psi pounds per square inch
v

ABSTRACT
With the continued success of compositematerials in high performance structures, newapplications for Navy primary structure arebeing identified. Many of these applicationsrequire designs with composite materialshaving section thicknesses greater than thosethat have been used and studied to date.Along with this interest in thick compositestructures comes the need for full three-dimensional stress analysis. The limits andaccuracy of existing three-dimensional databases will dictate the limit and accuracy ofcorresponding analyses.
This report summarizes an investigationof the through-thickness strain response ofthick composite materials subjected tocompressive loading. One-half inch thick (96ply) carbon and S2 glass reinforced compositeswere studied. A thick-section compressiontest method has been developed for thepurposes of this investigation. Using thistest method the longitudinal and through-thickness strain to failure, longitudinalmodulus, inplane and through-thicknessPoisson's ratio, and ultimate strength ofthese materials have been determined. Thethrough-thickness data from the 96 ply [0]coupons show the materials to be transverselyisotropic. The through-thickness data from 96ply [0/0/90] laminates show good correlationwith a theoretical solution that provides thenine elastic constants for thick orthotropicplates.
ADMINISTRATIVE INFORMATION
This work was performed as a DTRC Independent Research
Program, sponsored by the Office of Naval Research and
administered by the Research Director, DTRC 0113, under Program
Element 61152N and Work Unit 1-1720-476.
1
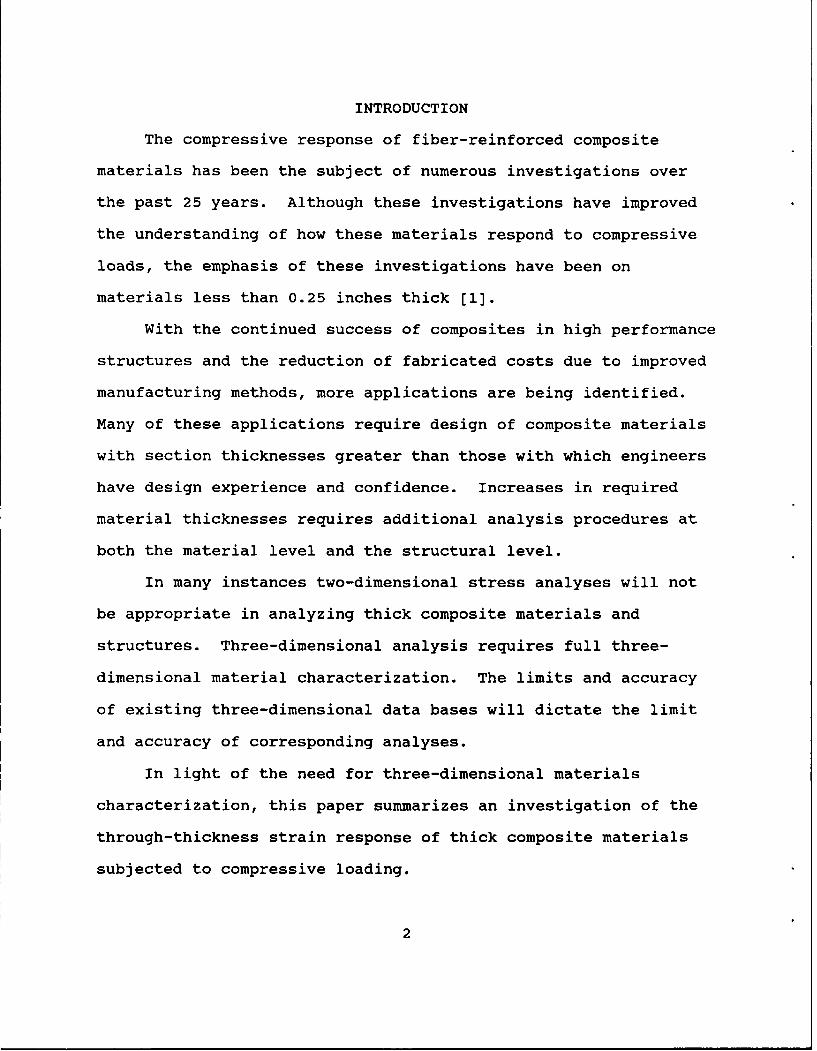
INTRODUCTION
The compressive response of fiber-reinforced composite
materials has been the subject of numerous investigations over
the past 25 years. Although these investigations have improved
the understanding of how these materials respond to compressive
loads, the emphasis of these investigations have been on
materials less than 0.25 inches thick [1].
With the continued success of composites in high performance
structures and the reduction of fabricated costs due to improved
manufacturing methods, more applications are being identified.
Many of these applications require design of composite materials
with section thicknesses greater than those with which engineers
have design experience and confidence. Increases in required
material thicknesses requires additional analysis procedures at
both the material level and the structural level.
In many instances two-dimensional stress analyses will not
be appropriate in analyzing thick composite materials and
structures. Three-dimensional analysis requires full three-
dimensional material characterization. The limits and accuracy
of existing three-dimensional data bases will dictate the limit
and accuracy of corresponding analyses.
In light of the need for three-dimensional materials
characterization, this paper summarizes an investigation of the
through-thickness strain response of thick composite materials
subjected to compressive loading.
2
EXPERIMENTAL PROCEDURE
DESCRIPTION OF TEST METHOD
In order to evaluate the through-thickness strain response
of composite coupons, a specimen thickness of 0.5 inches thick
was necessary. The development of a fixture to test these
specimens in compression was necessary and the following criteria
were applied: the fixture must allow thick-section testing
capability beginning at 0.25 inches, must allow further scale up
for thicker, wider, and longer specimens, must prevent load
eccentricities, must allow an unsupported gage length, and must
prevent splitting or brooming failures from occurring near the
load introduction points.
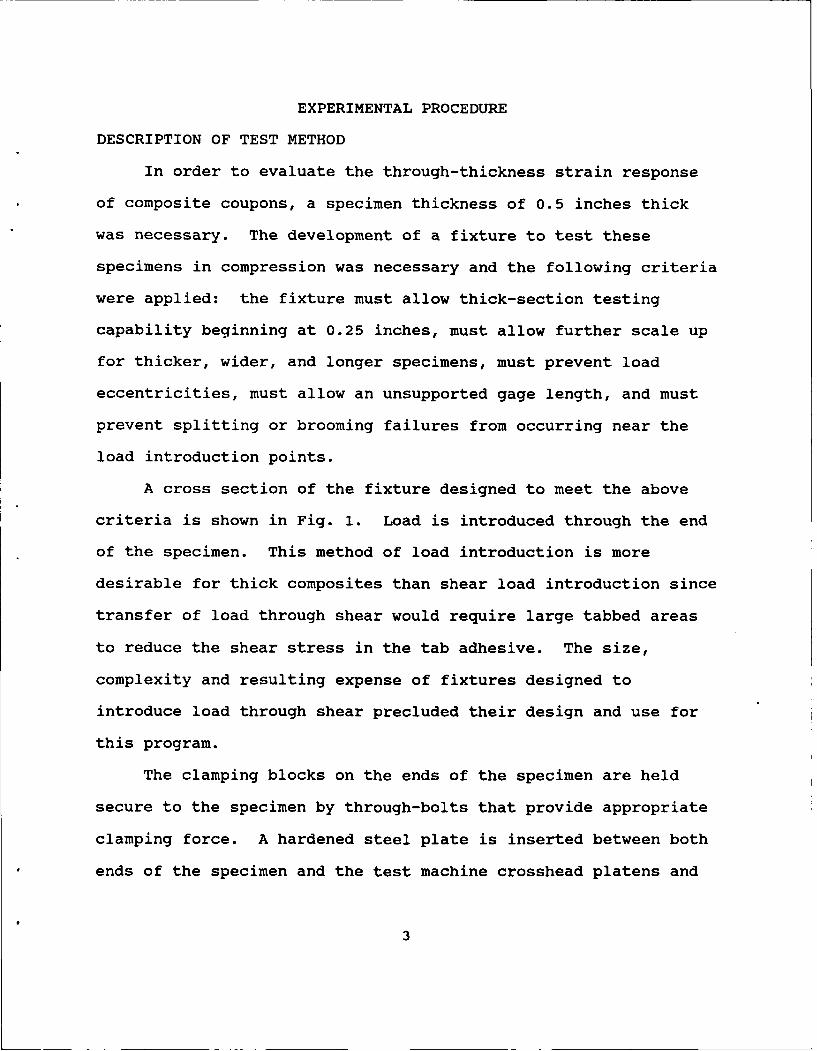
A cross section of the fixture designed to meet the above
criteria is shown in Fig. 1. Load is introduced through the end
of the specimen. This method of load introduction is more
desirable for thick composites than shear load introduction since
transfer of load through shear would require large tabbed areas
to reduce the shear stress in the tab adhesive. The size,
complexity and resulting expense of fixtures designed to
introduce load through shear precluded their design and use for
this program.
The clamping blocks on the ends of the specimen are held
secure to the specimen by through-bolts that provide appropriate
clamping force. A hardened steel plate is inserted between both
ends of the specimen and the test machine crosshead platens and
3
DTRC THICK-SECTIONCOMPRESSION TEST METHOD
I \Hardened
Steel Plate
Clamping
Tabs / Specimen
iii Spherical Seat
Fig. 1. Schematic of DTRC thick-section compression fixture.
4
act as load bearing surfaces. A self aligning spherical seat is
placed between one end of the specimen and the load machine to
assist in aligning the specimen axis and the loading axis.
To load the specimen into the fixture for testing, two
mating clamping blocks that comprise one-half of the the fixture
are placed on one of the hardened steel loading plates. The
specimen is placed into this half of the fixture and when the end
contacts the plate the clamping bolts are tightened. The other
end of the specimen is clamped into the other half of the
fixture using the same procedure. The specimen and both halves
of the fixture now become one unit and this unit is placed in the
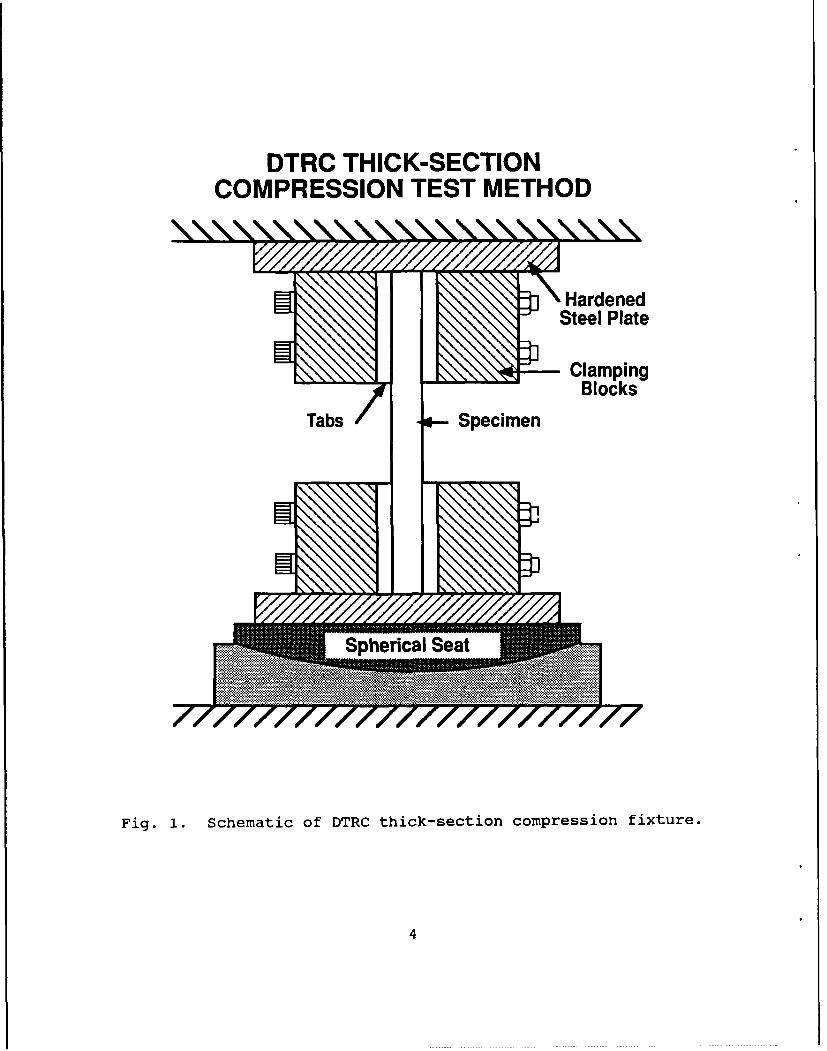
test machine for the application of load. A specimen with the
clamping blocks attached to one end is shown in Fig. 2.
The geometry of the specimens for this investigation were
adequate to support the the weight of the clamping blocks without
alignment rods.
MATERIAL SYSTEMS
Two material systems were evaluated in this investigation.
They were chosen to investigate the effects of carbon and glass
fiber reinforcements in a common epoxy matrix (Hercules 3501-6).
The effect of fiber sizing and the resulting interface chemistry
will also affect the compressive response of thick composites
however these effects were not quantified in this investigation.
The carbon reinforced prepreg tape was supplied by Hercules
5

Fig. 2. Phtg~~Of DTRC tik..et
tbi ck - ecti on cO ml press i o i x u e
6
Inc. and was AS4 fiber with 3501-6 3500 F epoxy resin. The S2
glass reinforced prepreg was supplied by Fiberite and was S2
glass fiber also with 3501-6 350 F epoxy resin. Both systems
were supplied as 12 inch wide preprea tape and were autoclave
cured at DTRC. An autoclave air temperature schedule that was
slightly different than those used for thin (< 0.25 inch) epoxy
based composites was used. This air temperature was determined
from test cures on 96 ply laminates with thermocouples placed in
three locations within the test panels.
Following fabrication, samples from each of the four panels
(two AS4/3501-6 and two S2 glass/3501-6) were removed and tested
for fiber volume fraction (FVF) and void content (ASTM D3171 and
D2734). The fiber volume fraction of the AS4/3501-6 panels
averaged 60.0 % and the void content averaged 0.34 %. The fiber
volume fraction of the S2 glass/3501-6 panels averaged 53.8 % and
the void content averaged 0.97 %.
SPECIMEN GEOMETRY
Specimens for this investigation were machined from 12 inch
by 12 inch panels, 96 plies thick, of two laminate stacking
sequences. The cured laminates were machined so unidirectional
[0]96 and crossply [02/90 116s specimens were available for both
the carbon and S2 glass reinforced laminates. The nominal
specimen dimensions were 2.00 inches wide by 0.5 inches thick by
either 6.5 or 7.5 inches long. The tab length was 2.5 inches so
the 6.5 inch long specimen had a 0.75 inch gage length and the
7
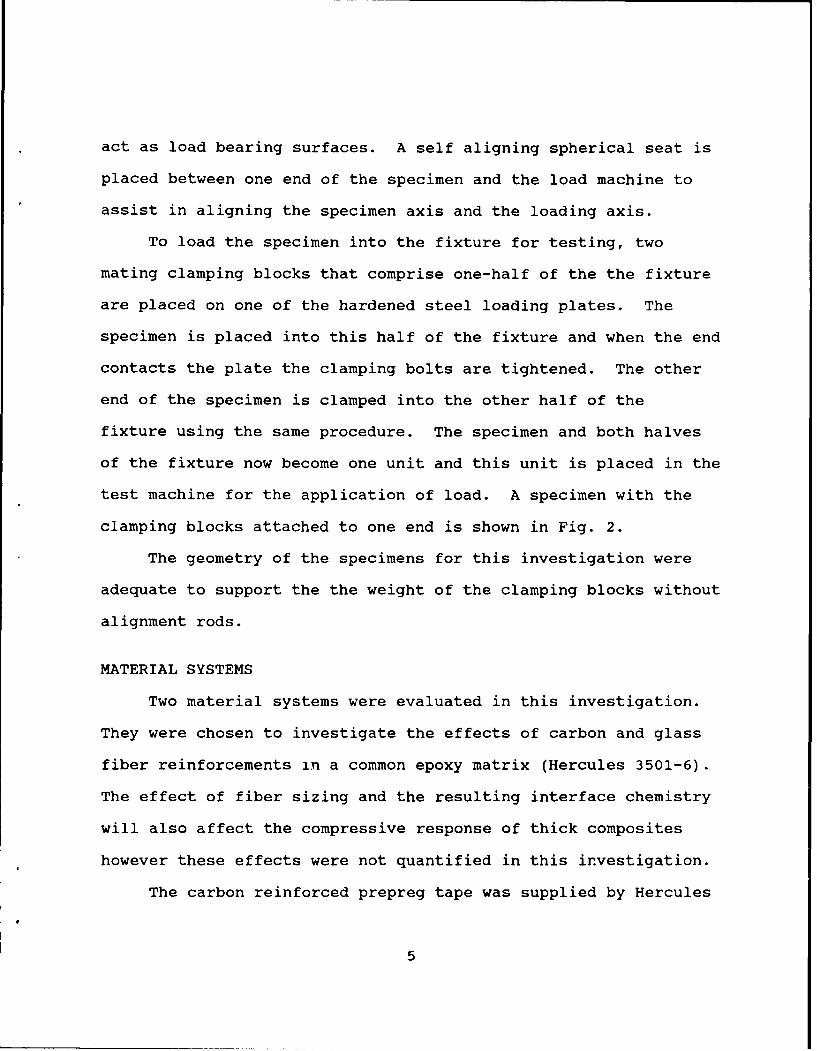
7.5 inch specimen had a 2.5 inch gage length. The specimen
geometry is shown is Fig. 3. The average specimen thickness was
0.530 inches for the AS4 specimens and 0.570 inches for the S2
glass specimens. The average tab thickness was 0.090 for the AS4
specimens and 0.070 for the S2 glass specimens.
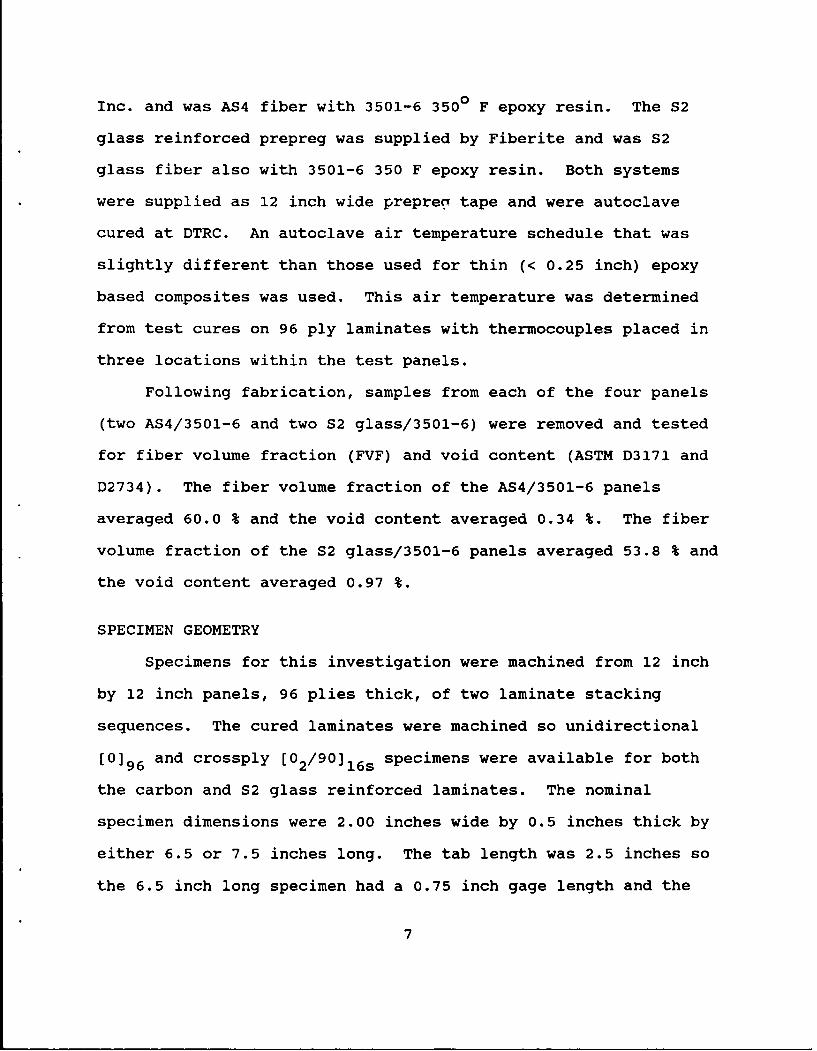
The length of the specimen gage section was selected on the
basis of a Euler column buckling analysis. The materials elastic
constants and specimen geometry is used to determine the maximum
stable gage length. The equation to determine this permissible
length-to-thickness ratio can be expresses as follows:
1 = 0.9069 E.
where
1 = specimen length Ex = longitudinal modulus
t = specimen thickness Yult = ultimate compressivestrength
This equation is derived from reference 2 and includes the
assumptions that the specimen acts a as pinned end column, the
most conservative end fixity assumption. For a material that has
a high longitudinal modulus to longitudinal shear modulus ratio
the effects of transverse shear can significantly effect column
stability. When the effects of transverse shear are included in
the above analysis a more conservative maximum gage length is
determined and the expression for length/thickness including this
8

SPECIMEN GEOMETRYx
z
0/90 strain __00/90gage on left Lstrainside, 0Ostrain gag esgage on back
Specimen Thickness: t Tab length: 5t, 2.5 in. min.Width: 4t Thickness: .25t, .125 in. min.
Gage Length: 5t, 3t
Fig. 3. Specimen geometry, material directions, andstrain gage locations.
9
effect is:
= 0.9069 L2i.2GJi
where
1 = specimen length EX = longitudinal modulus
t = specimen thickness G = through-thickness shearxz modulus
Yult = ultimate compressivestrength
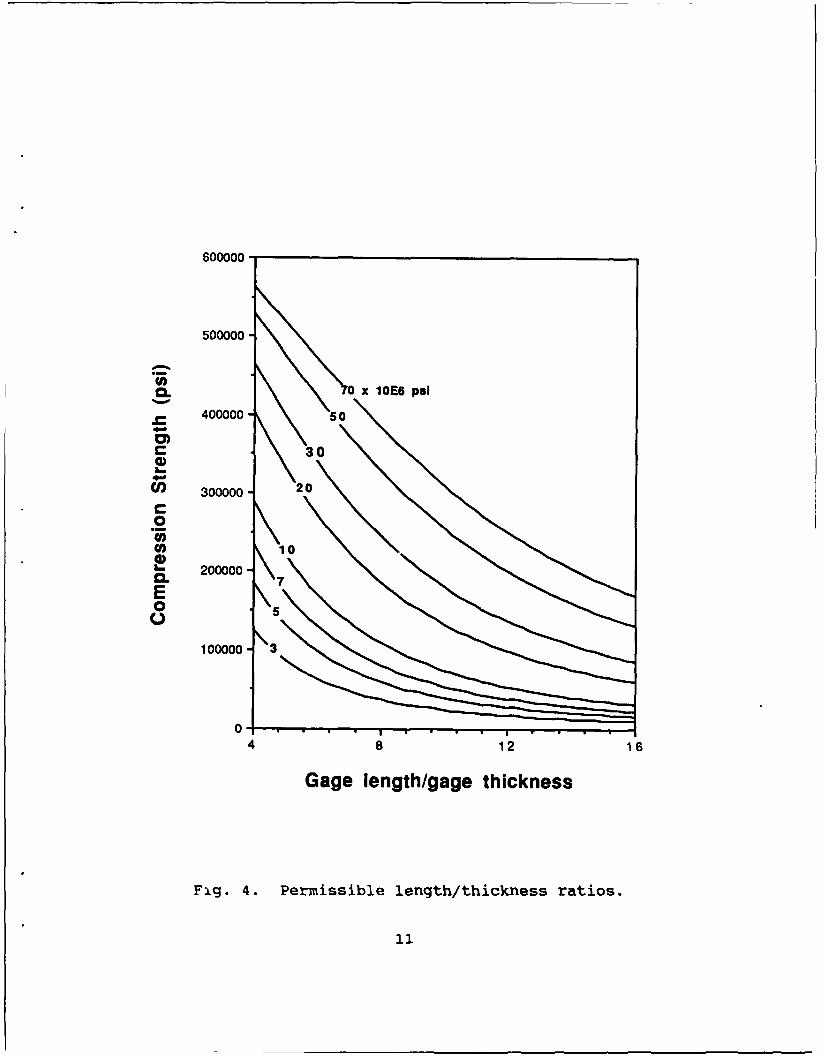
A plot showing the permissible 1/t ratios for an assumed
longitudinal modulus and strength is shown in Fig. 4.
Sixteen specimens were fabricated and evaluated for this
investigation. Eight specimens were instrumented with seven
strain gages and used to monitor strain response on both faces
and both free edges of the specimens. The remaining eight were
instrumented with two gages (front and back) and used to monitor
longitudinal strain on both faces of the specimens. The
designations and descriptions for all 16 specimens are shown in
Table 1.
THROUGH-THICKNESS POISSON'S RATIO DETERMINATION
The thickness of the 96 ply coupons investigated allowed the
direct determination of NUxz with electrical resistance strain
gages. NUxz is defined as the through-thickness Poisson's ratio
or the negative ratio of the z direction strain to the x
direction strain when a uniaxial load is applied in the x
direction. Figure 3 shows the x, y, and z specimen directions
10
600000'
500000-
a. OxlOES pal
400000- 50
0)0CD 3
Cn 300000- 20
0
010
CL 200000 -\E050.
100000- 3
4 8 12 16
Gage length/gage thickness
Fi.g. 4. Permissible length/thickness ratios.
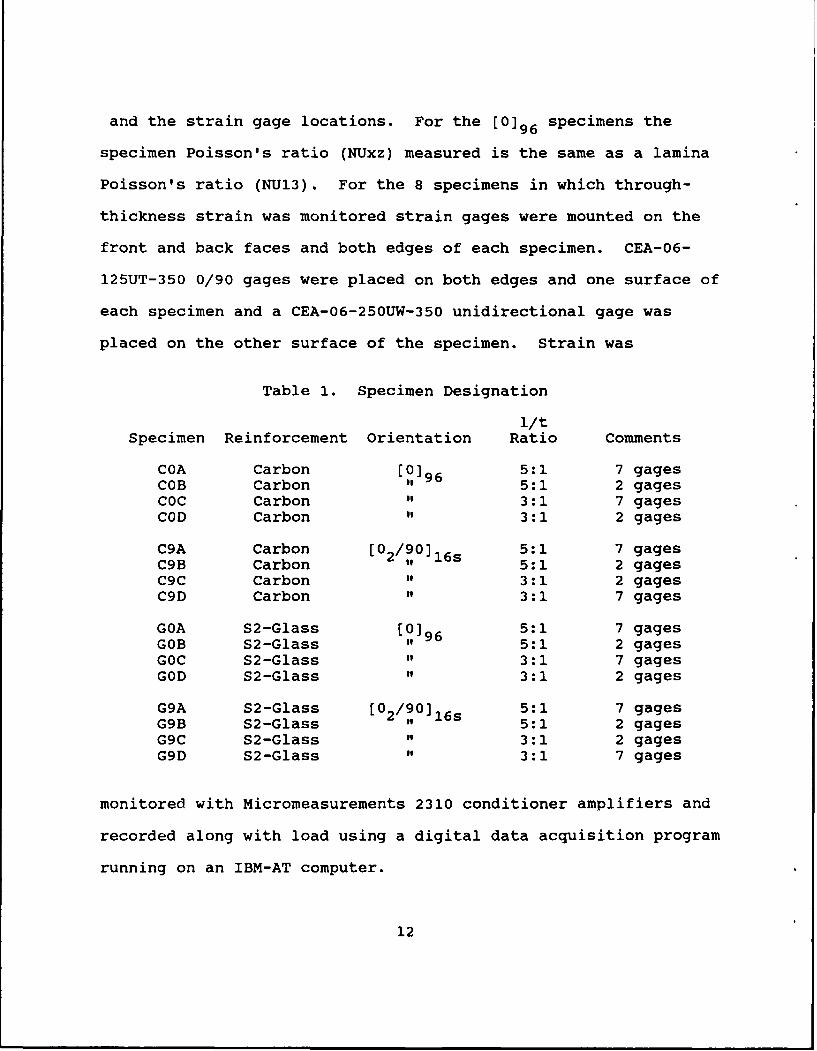
and the strain gage locations. For the [0196 specimens the
specimen Poisson's ratio (NUxz) measured is the same as a lamina
Poisson's ratio (NUl3). For the 8 specimens in which through-
thickness strain was monitored strain gages were mounted on the
front and back faces and both edges of each specimen. CEA-06-
125UT-350 0/90 gages were placed on both edges and one surface of
each specimen and a CEA-06-250UW-350 unidirectional gage was
placed on the other surface of the specimen. Strain was
Table 1. Specimen Designation
l/tSpecimen Reinforcement Orientation Ratio Comments
COA Carbon [0]96 5:1 7 gagesCOB Carbon " 5:1 2 gagesCOC Carbon " 3:1 7 gagesCOD Carbon " 3:1 2 gages
C9A Carbon [02/90]16s 5:1 7 gagesC9B Carbon it 5:1 2 gagesC9C Carbon " 3:1 2 gagesC9D Carbon " 3:1 7 gages
GOA S2-Glass [0196 5:1 7 gagesGOB S2-Glass o 5:1 2 gagesGOC S2-Glass " 3:1 7 gagesGOD S2-Glass " 3:1 2 gages
G9A S2-Glass [02/90116s 5:1 7 gagesG9B S2-Glass 5:1 2 gagesG9C S2-Glass " 3:1 2 gagesG9D S2-Glass " 3:1 7 gages
monitored with Micromeasurements 2310 conditioner amplifiers and
recorded along with load using a digital data acquisition program
running on an IBM-AT computer.
12

Prior to conducting test to failure, a series of five
repetitive tests were run to approximately 25% of the ultimate
strain to failure. These tests were run to evaluate the fixture
and determine repeatability of data from one test to the next.
Between each repetition the specimen and fixture were removed
from the test machine, the fixture bolts loosened, the specimen
was reinserted into the fixture, and the specimen and fixture
were placed into the test machine for the next test. For the
first three test repetitions edge strains and load were recorded.
Load and surface strains were recorded for the final two
repetitions. Each specimen was then loaded monotonically to
failure while all seven channels of strain and load were
recorded.
RESULTS AND DISCUSSION
The results of the repetitive tests run on each of the eight
specimens with seven channels of strain indicate that the
variation in data from strain gage to strain gage and from test
run to test run are within the accuracy of the data from specimen
to specimen. The specimen to specimen accuracy is shown in Table
2. with 7.2 % as the largest coefficient of variation for the
AS4/3501-6 [0/O/90]16s specimens.
Representative stress-strain to failure plots for each of
the four laminate/material combinations are shown in Figs. 5-8.
Longitudinal stress-strain plots from the specimens instrumented
with three (0/90) gages and one (0) gage contain four curves, one
13

96 PlY [0] AS4/Epoxy150000'
.Spec. C
125000-
1000000.
qj 75000-
50000-
25000-
01
0 250 5000 75100 10000 12500 15000
Longitudinal Microstrain
Fig. 5. Longitudinal stress-strain plot -[06carbon/epoxy. 09
14
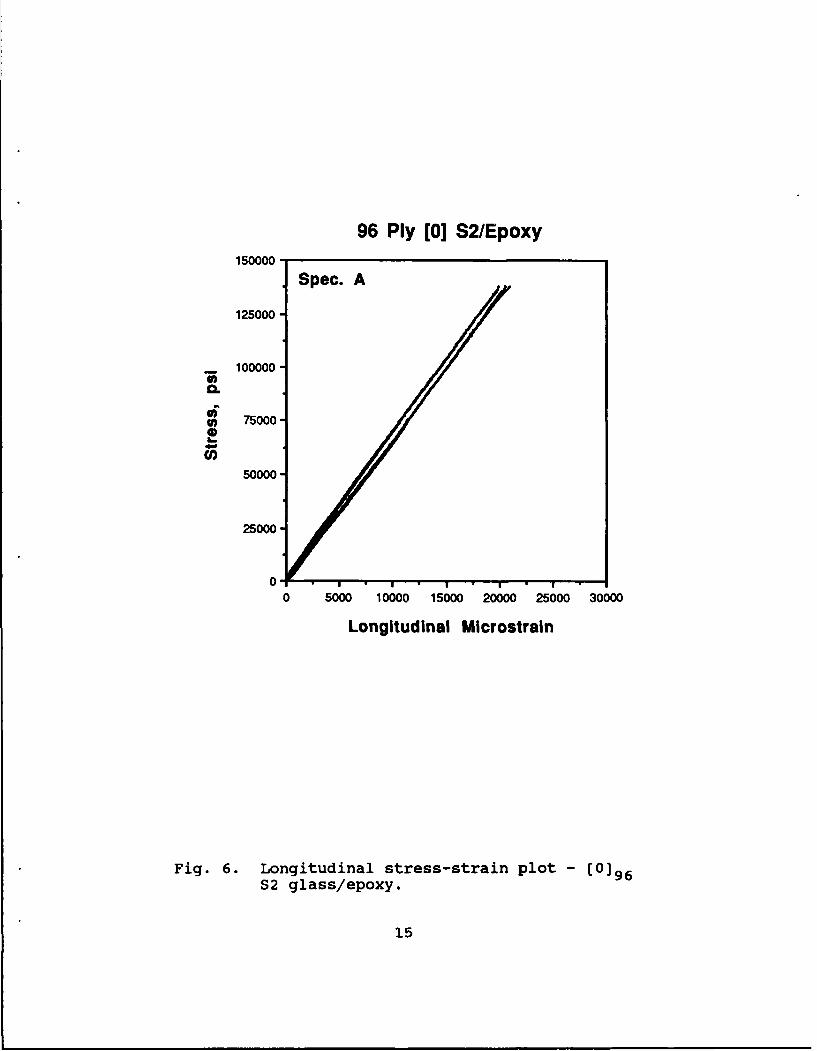
96 Ply [0] S2/Epoxy150000-
.Spec. A
125000-
100000-
a.
e 75000-
50000-
25000-
0-
0 5000 10000 15000 20000 25000 30000
Longitudinal Microstrain
Fig. 6. Longitudinal stress-strain plot - [0196S2 glass/epoxy.
15
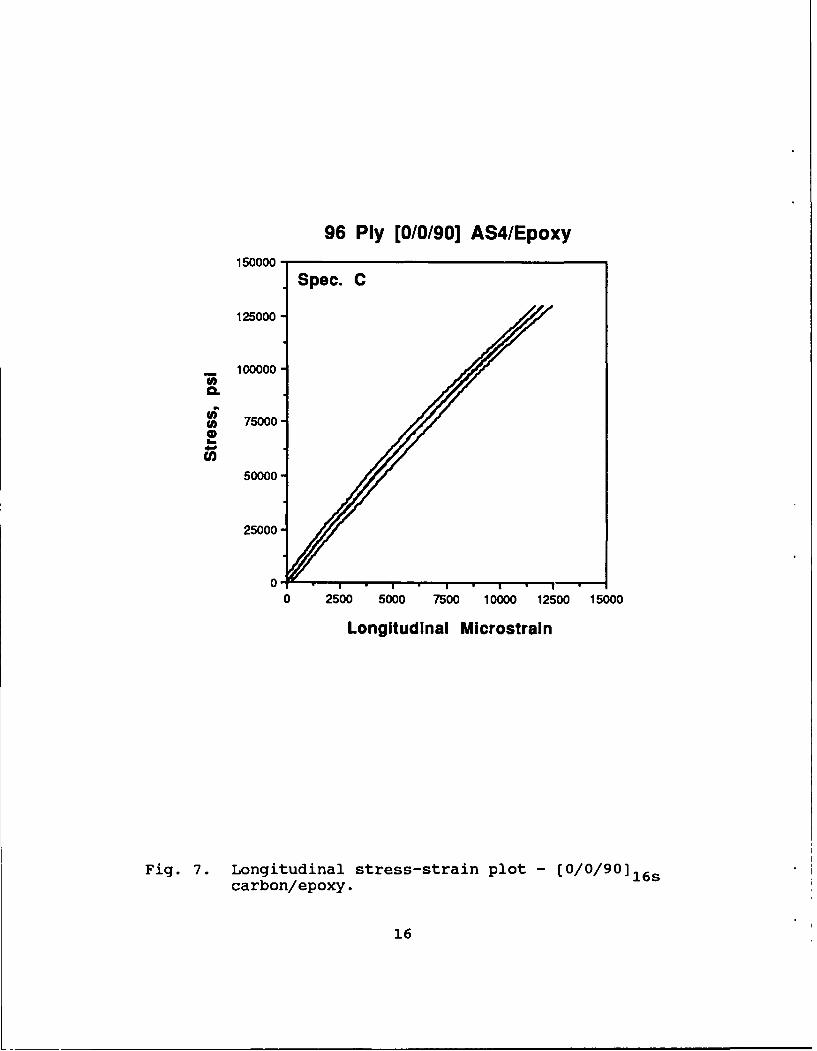
96 Ply [0/0/90] AS4/Epoxy150000-
.Spec. C
125000-
100000
U)
~ 5000
5000
2 000 - 7
0 2500 500 700 10000 12500 15000
Longitudinal Microstrain
Fig. 7. Longitudinal stress-strain plot - 10/0/90116scarbon/epoxy.
16
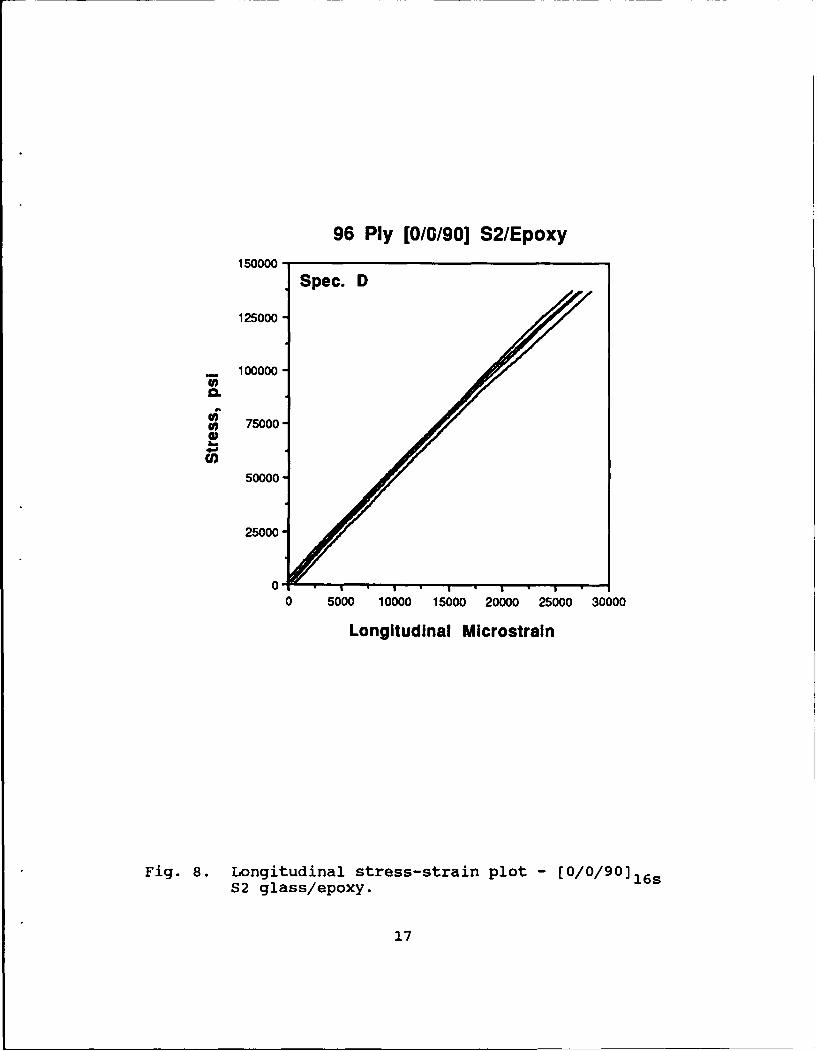
96 Ply [0/0/90] S2/Epoxy
1001 Spec. D125000-
100000-C,
S 75000-
U)
50000-
25000-
0 5000 10000 15000 20000 25000 30000
Longitudinal Microstrain
Fig. 8. Longitudinal stress-strain plot - (O/O/904l6SS2 glass/epoxy.
17
96 Ply [0/0/90] AS4/Epoxy7500-
Spec. C
a 5000-
0U0
0 2500-
0 5000 10000 15000
96 Ply [0] AS4/Epoxy7500-
Spec. C
a~ 5000-
0 2500-
00 5000 10000 15000
Longitudinal Microstrain
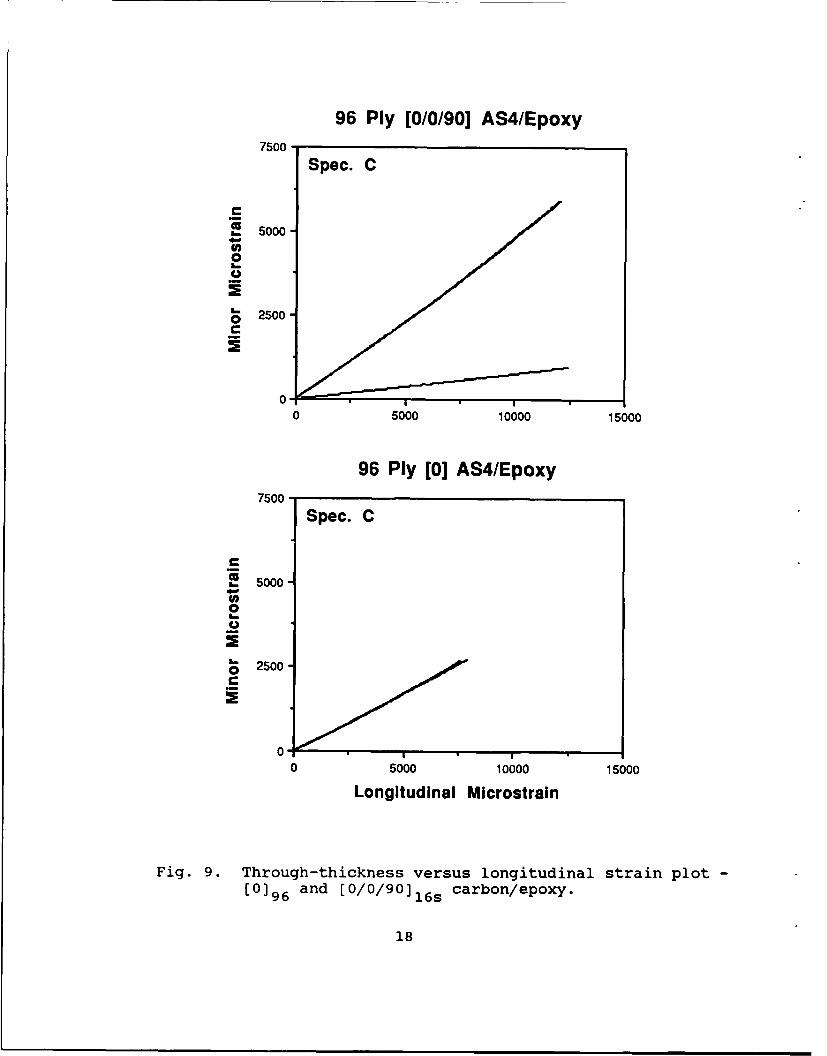
Fig. 9. Through-thickness versus longitudinal strain plot-0]6and [0o916 carbon/epoxy.
18

96 Ply [0/0/90] S2/Epoxy12500-
.Spec. D10000-
0 500
I5000
0
500
0
0 10;00 20000 30000
96 Ply [0] S2/Epoxy12500-
.Spec. A
10000-
U) 75000
50-0
500
0
010000 20000 30000
Longitudinal Microstrain
Fig. 10. Through-thickness versus longitudinal strain plot-[0196 and [0/0/90] 16s S2 glass/epoxy.
19

for each longitudinal (0 degree) gage. The longitudinal modulus
was determined from the slope of these curves. The Poisson's
ratio curves (Figs. 9 and 10) contain three curves each, a
longitudinal strain versus transverse strain for the face (0/90)
gage, and a longitudinal strain versus through-thickness strain
for each of the two edge (0/90) gages. The Poisson's ratio's
were determined from the slope of these curves which was
determined by taking a secant tangent between 1000 and 3000
longitudinal microstrain.
Tables 2 and 3 summarize the longitudinal moduli and
Poisson's ratios for the laminates and materials evaluated. The
average longitudinal moduli for each specimen represents the
average of either two (2 gages) or fourteen (7 gages) recorded
values. The average NUxz for each specimen represents the
average of eight recorded values, and the value of NUxy
represents the average of three recorded values.
A significant observation from the data in Tables 2 and 3 is
that the value of NU1 3 (NU xz) for unidirectional carbon and S2
Glass reinforced laminates is equivalent to NUI2 (NUxy). When
three dimensional material constants are not available the
assumption that NU1 3 equals NU12 is typically made, and this data
shows that the assumption of transverse isotropy is reasonable.
This conclusion has been supported in work done by Knight [3].
Unlike NUxz for unidirectional specimens, NU xz for laminates
20
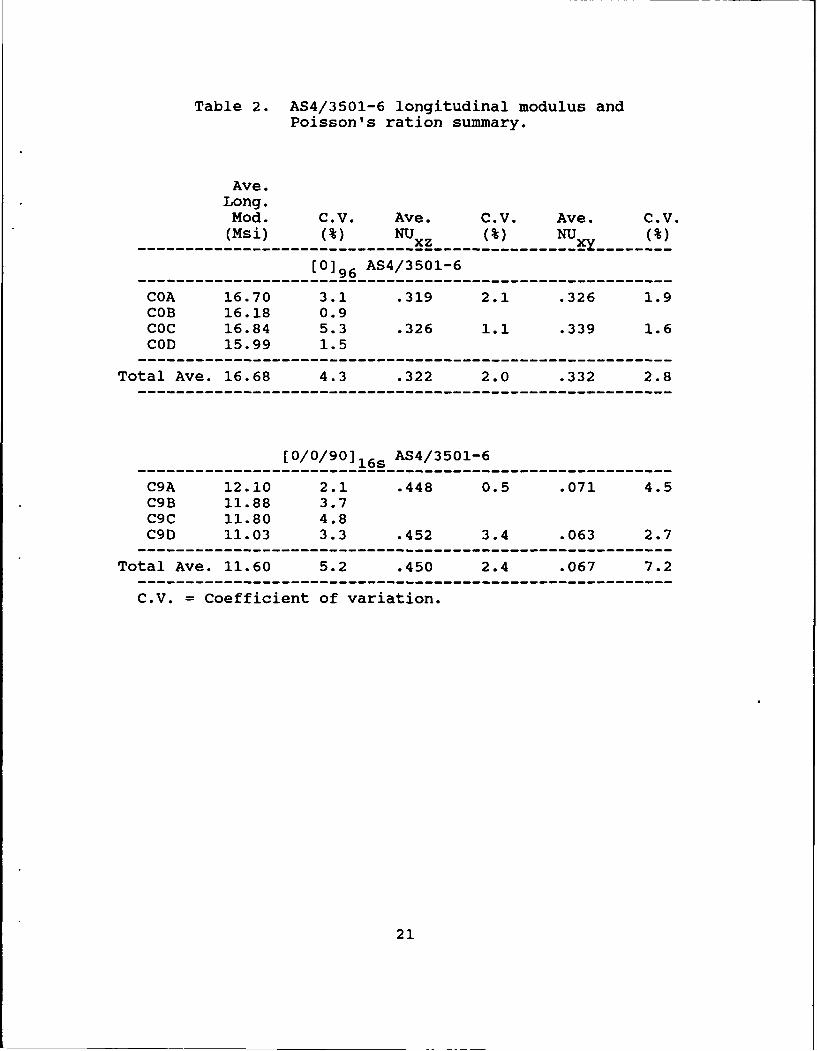
Table 2. AS4/3501-6 longitudinal modulus andPoisson's ration summary.
Ave.Long.Mod. C.V. Ave. C.V. Ave. C.V.
------- (Msi) ---- M--- NU xz (%) --- NU x ---
109 AS4/3501-6
COA 16.70 3.1 .319 2.1 .326 1.9COB 16.18 0.9COC 16.84 5.3 .326 1.1 .339 1.6COD 15.99 1.5
Total Ave. 16.68 4.3 .322 2.0 .332 2.8
[0/0/90) 16 s AS4/3501-6
C9A 12.10 2.1 .448 0.5 .071 4.5C9B 11.88 3.7C9C 11.80 4.8C9D 11.03 3.3 .452 3.4 .063 2.7
Total Ave. 11.60 5.2 .450 2.4 .067 7.2
C.V. = Coefficient of variation.
21

Table 3. S2 Glass/3501-6 longitudinal modulusand Poisson's ratio summary.
Ave.Long.Mod. C.V. Ave. C.V. Ave. C.V.(Msi) (%) NUxz (%) NU.x .(
[0)96 S2 Glass/3501-6
GOA 6.97 4.0 .300 1.4 .304 0.0GOB 7.06 2.3GOC 7.26 5.2 .312 2.4 .277 3.4GOD 7.09 1.0
Total Ave. 7.11 4.7 .306 2.8 .290 5.5
[0/0/90]16s S2 Glass/3501-6
G9A 5.61 2.0 .359 3.5 .162 1.1G9B 5.41 2.1G9C 5.62 3.1G9D 5.50 3.5 .367 2.8 .152 5.7
Total Ave. 5.55 2.9 .363 3.3 .157 5.0
C.V. = Coefficient of variation.
cannot be directly compared to any inplane lamina or laminate
properties. To evaluate the validity of the recorded values a
comparison with theoretical predictions of three dimensional
elastic constants can be made. Trethewey et. al. [4] recently
reviewed several theories for determining the effective three-
dimensional properties of layered anisotropic media. All of the
reviewed techniques replace a heterogeneous layered media with an
equivalent homogeneous anisotropic media and effectively
22

represent a set a smeared elastic properties. In this report the
theory presented by Pagano [5] is reported in detail and encoded,
and the elastic properties determined by this theory are the ones
that will be used for comparison here.
The input required for the calculation of three-dimensional
laminate properties are a complete set of three dimensional
lamina properties. The properties used to compare the
experimentally And theoretically determined Nu are listed in
Table 4. Table 5 shows a comparison of the theoretical and
experimental elastic constants for the [0/0/ 90 116s carbon and S2
Glass epoxy laminates studied. The calculated value of Nu wasxz
forced to correspond the experimental value through selection of
input data. In particular, the two values in Table 4 that were
varied were NU23 and G 23 In order to determine the sensitivity
of the analysis to the choice of these values a parametric study
was performed and the results are shown in Figs. 11 and 12. Both
figures show that the value of NUxz is insensitive to G23 but
very dependent on NU23. The value of NU23 necessary to force the
match of the theoretical and experimental NUxz data are the ones
listed in Table 4. These values of NU23 are reasonable since
they correspond to values measured experimentally in references
[3] and [6). To determine the value of NU23 consistently with
the results of this paper [90196 specimens could be fabricated,
instrumented and tested in the same manner as the thick
compression tests discussed in this report.
23

Table 4. Lamina input data for three-dimensionalelastic constant calculations.
AS4/3501-6 S2/3501-6
(60% FVF) (54% FVF)
E 16.7 Msi 7.11 Msi
E2 1.5 Msi 1.4 Msi
E3 1.5 Msi 1.4 Msi
NU2 * .33 .30
NU 3* .33 .30
NU23 .47 .38
G2** .87 Msi .98 Msi
GI3 .87 Msi .98 Msi
G23 .55 Msi .55 Msi
* from DTRC thick (0.5 inch thick) compression testing** from DTRC thin (0.040 inch thick) +-45 tension testing
other values estimated from literature
24

Table 5. Comparison of theoretical and experimentalNU )z results.
1/0 9 0 1 16 s AS4/3501-6 (0/0/9 0]1 6s S2/3501-6
Theor. Exp. Theor. Exp.
E x 11.71 11.60 5.25 5.55
E y6.6 3.3
E z1.8 1.5
NU xy .075 .067 .127 .157
NU J .451 .450 .364 .363
NU .47 .38yz
G x .87 .98
"Gx .73 .78
" .z- -- -63 -- - - - - - -- - - - - - -64 - - - - - - - - -
25
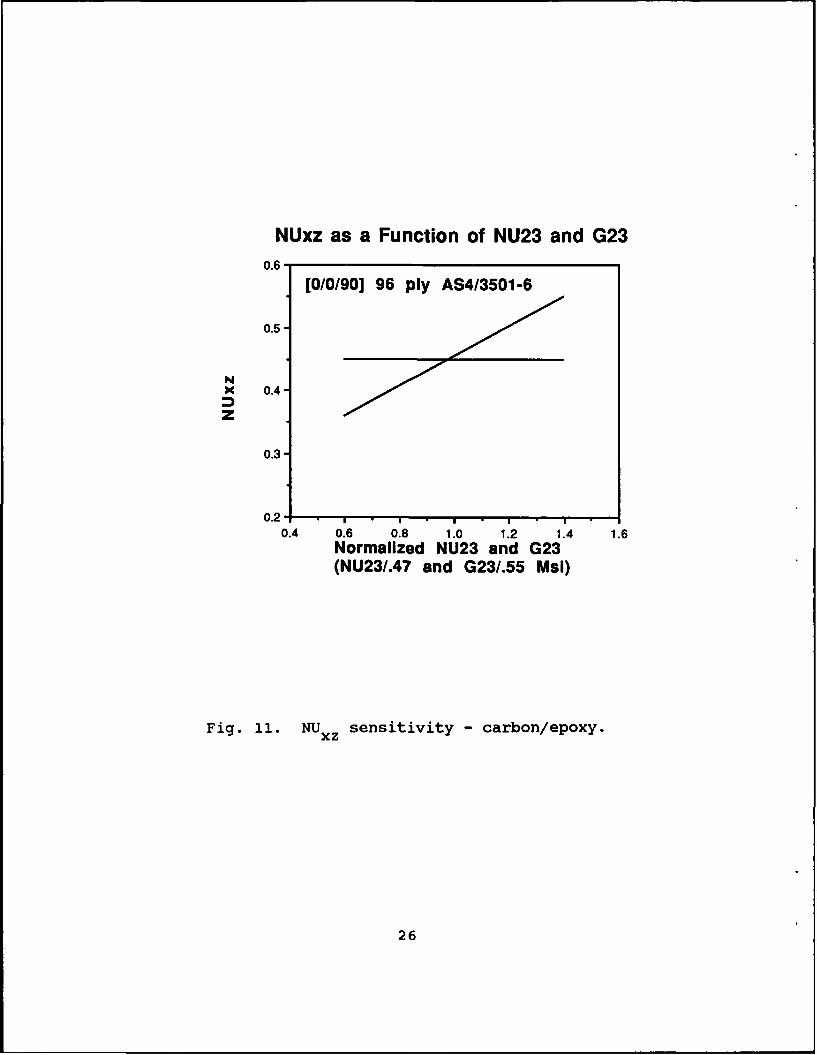
NUxz as a Function of NU23 and G230.6-
[0/0/90] 96 ply AS4/3501-6
0.5-
X 0.4-
0.3-
o.2 .
0.4 0.6 0.8 1.0 1.2 1.4 1.6Normalized NU23 and G23(NU23/.47 and G23/.55 MsI)
Fig. 11. NU xZsensitivity - carbon/epoxy.
26

NUxz as a Function of NU23 and G23
0.[0/0/90] 96 ply S23501-6
0.5-
NS0.4- G23
Z
0.3-
0.2 T -**
0 .4 0.6 0.8 1.0 1.2 1.4 1.6
Normalized NU23 and G23(NU23/.38 and G23/.55 Msl)
Fig. 12. NU xZsensitivity - S2 glass/epoxy.
27
The results of this comparison show good agreement between
theoretically and experimentally determined three-dimensional
orthotropic laminate properties. The benchmark thick-section
compression data included here correlates well with a closed-form
solution that predicts these laminate properties. Since little
experimental three-dimensional elastic constant data is available
for composite materials, and since such data is costly to
develop, the use of theoretical tools to predict these properties
is essential. This initial validation of one such tool indicates
it may be used for determining the longitudinal moduli and three-
dimensional Poisson's ratios for thick composite laminates.
CONCLUSIONS
A method for determining the through-thickness strain
response of thick composites subjected to compressive loading has
been developed and used to determine this response of AS4/epoxy
and S2 Glass/epoxy composite materials. This data was used to
determine the through-thickness elastic constants of the
materials and laminate configurations studied.
The accuracy and utility of three-dimensional models for
thick composite materials will be directly related to the
accuracy of the material properties used as input for these
models. Data from this report has shown that for thick-section
unidirectional specimens the elastic constants measured showed
good agreement with the assumption of transverse isotropy.
Furthermore, for the (0/0/90] laminates evaluated, the values
28
measured for NUxz showed good agreement with values predicted by
an analysis that provides all nine elastic constants for
orthotropic plates. Additional work validating the prediction of
the three-dimensional shear moduli of thick laminated composites
using this model is necessary.
Acknowledgments
The author would like to acknowledge the support of the DTRC
IR/IED program sponsors and in particular the support and
encouragement provided by Drs. Dave Moran and Bruce Douglas and
Mr. Joe Crisci.
29
REFERENCES
1. Camponeschi, E. T., Jr. "Compression of Composite Materials:A Review," David Taylor Research Center Report, DTRC-87-050,November (1987).
2. Timoshenko, S. P. and Gere J. M., Theory of ElasticStability, McGraw-Hill, New York (1961).
3. Knight, M. "Three-Dimensional Elastic Moduli ofGraphite/Epoxy Composites," Journal of Composite Materials,Vol. 16, pp. 153-159 (1982).
4. Trethewey, B. R., Jr., Wilkins, D. J., and Gillespie, J. W,Jr., "Three-Dimensional Elastic Properties of LaminatedComposites," CCM Report 89-04, Univ. of DE (1989).
5. Pagano, N. J., "Exact Moduli of Anisotropic Laminates,"Mechanics of Composite Materials, Sendeckyi, Ed., pp. 23-44,Academic Press (1984).
6. Kriz, R. D. and Stinchcomb, W. W., "Elastic Moduli ofTransversely Isotropic Graphite Fibers and TheirComposites," Experimental Mechanics, Vol. 19, No. 2, pp. 41-49 (1979).
30
INITIAL DISTRIBUTION
Copies CENTER DISTRIBUTION
12 DTIC Copies Code Name
3 NAVSEA 1 0115 Caplan1 05M3 (Pinto)1 92R (Swan) 1 0113 Douglas
3 NRL 1 17 Krenzke1 6383 (Badaliance)1 6383 (Wolock) 1 172 Rockwell1 6385 (Chaskelis)
1 176 Sykes1 NSWC
1 R31 (Augi) 1 1720.2 Phyillaier
1 ONT 1 1720.4 Wiggs1 225 (Kelly)
1 1730.2 Critchfield1Dr. Don Adams 1 2723 WilhelmiME Dept.Univ. of Lyoming 1 274 WangLaramie, WY 82071
1 28 Wacker1Ken Cheverton 1 2801 CrisciSPARTA Inc.4520 Executive Dr., Suite 210 1 2802 MortonChicago, IL 60616
25 2802 Camponeschi1Dr. Reaz Chaudhuri 1 2803 CavallaroDept. of Civil Eng.3220 Merrill Eng. Bldg. 1 284 FischerUniv. of UtahSalt Lake City, UT 84112 1 2844 Castelli
1 1 522.2 TIC (A)Dr. H. T. HahnThe Pennsylvania State Univ. 1 522.1 TIC (C)227 Hammond BuildingUniversity Park, PA 16802 1 5231 Office
Services

INITIAL DISTRIBUTION (Continued)
1 1
K. E. Hofer Dr. D. WilkinsL. J. Broutman & Assoc. Ltd. Director, CCM3424 South State St. University of DelawareChicago, IL 60616 Newark, DE 19716
1 1Subhash Khatri Ms. E. Gail GuynnMaterials Eng. Dept. 1201 Harvey Road, #24Drexel Univ. College Station, TX 77843Philadelphia, PA 19104
11 Mr. Jack WoodsDr. R Sierakowski Foster MillerChairman, Civil Eng. Dept. 350 Second AvenueOhio State Univ. Waltham, MA 021542070 Neil Ave.470 Hitchcock Hall 1Columbus, OH 43210 Mr. Ray Garvey
Oak Ridge National Laboratory1 P.O. Box 2003K. A. Stubenhofer Oak Ridge, TN 37831-7294Information CenterLord Corp. 1P0 Box 10039 Mr. Mark ShermanErie, PA 16514 Amoco Research Center
P.O. Box 400
1 Naperville, Il 60566Dr. Steve YurgartisME Dept. 1Clarkson Univ. Dr. Mark ShuartPotsdam, NY 13676 Langley Research Center
Mail Code 1901 Hampton, VA 23665Dr. J. R. VinsonDept. of Mech. Engineering 1Spencer Laboratory Dr. Bruce TretheweyUniv. of Delaware BASF Structural Materials Inc.Newark, DE 19716 TPC
13504-A Southpoint Boulevard1 Charlotte, NC 28217Dr. R. K. EbyMaterials Science and Engineering 1102 Maryland Hall Dr. R.B. PipesThe Johns Hopkins University Dean of EngineeringBaltimore, MD 21218 University of Delaware
Newark, DE 19716

INITIAL DISTRIBUTION (Continued)
1 1Anough Poursartip T.H. Tsiang, Sc.D.Dept. of Metals & Materials Engineering LockheedUniversity of British Columbia Aeronautical Systems Company309-6350 Stores Road Burbank, CA 91520-4717Vancouver, British ColumbiaCanada V6T lW5 1
R. H. Boschan1 Composites Development CenterJohn M. Winter, Jr. LockheedCenter for Nondestructive Evaluation Aeronautical Systems Company102 Maryland Hall Burbank, CA 91520-7637The Johns Hopkins UniversityBaltimore, MD 21218 1
Anthony A. Caiazzo, P.E.1 Materials Science CorporationMohamed G. Abdallah, Ph.D., P.E. Gwynedd Plaza IIHercules Incorporated Spring House, PA 19477Science and Technology DepartmentBacchus Works 1Magna, UT 84044-0098 Douglas S. Cairns, Ph.D.
Hercules IncorporatedScience & Technology Department
1 Bacchus WorksThomas K. Tsotsis, Ph.D. Magna, UT 84044-0098Composite MaterialsCIBA-GEIGY Corporation 15115 East La Palma Avenue Dr. David CohenAnaheim, CA 92807-2018 Hercules Aerospace Company
Missiles, Ordnance & Space Group1 Bacchus WorksJohn H. Bode, Ph.D., P.E. Magna, UT 84044-0098Honeywell Inc.Armament Systems Division 1MN48-2500 Or Ishai, D.Sc.7225 Northland Drive Professor, Faculty of MechanicalBrooklyn Park, MN 55428 Engineering
Technion - Israel Institute of1 TechnologyDon E. Pettit Technion, Haifa 32000, IsraelComposites Development CenterLockheed 1Aeronautical Systems Company John Morton, D. Phil
D74-72, B369, B6 Engineering Science & MechanicsBurbank, CA 91520-7004 Department
Virginia Polytechnic Institute1 and State UniversityK. Benjamin Su Blacksburg, VA 24061E. I. Du Pont De Nemours & CompanyEngineering Technology LaboratoryExperimental Station - 80304Wilmington, DE 19880-0304

1Vasilios PerosMartin MariettaAero & Naval Systems103 Chesapeake Park PlazaBaltimore, MD 21220
1John W. Gillespie, Jr., Ph.D.Center for Composite MaterialsComposites Manufacturing Science LaboratoryUniversity of DelawareNewark, DE 19716
1Dr. Donald L. HunstonPolymer Composites GroupPolymers DivisionNational Institute of Standardsand Technology
Building 224, Room A209Gaithersburg, MD 20899
1Prof. A. J. VizziniThe University of MarylandCollege of EngineeringDepartment of Aerospace EngineeringCollege Park, MD 20742
1Dr. Fuh-Gwo YuanDepartment of Mechanical& Aerospace Engineering
North Carolina State UniversityRaleigh, NC 27695-7910