Embed Size (px)
Citation preview

1
Lessons* from Airport Gridlock: LaGuardia Airport
(*for Demand Management)
Amedeo R. Odoni and Terence P. C. Fan
Massachusetts Institute of Technology
March 19, 2002
NAS Resource Allocation Workshop

2
Objective
• Provide background for Workshop discussions
• Recap LGA events between 4/2000 and 9/2001
• Emphasis on demand management aspects
• Implications and lessons regarding:
-- Sensitivity of airport delay to changes in demand
-- Magnitude of external delay costs relative to current levels of landing fees
-- Other complications
-- Environment in US vis-à-vis application of demand management
-- Nature of viable policies

3
Premise
• Capacity expansion should be the fundamental means for accommodating growth of demand
• Demand management should be considered when capacity expansion is problematic, especially in the short run, due to– unreasonable cost; or– technical, sociopolitical or environmental problems with
long resolution times• In such cases, demand management should rely primarily
on those approaches that interfere the least with a deregulated and competitive market:– Congestion pricing– Auctions
4
Case of LaGuardia
• Since 1969: “Slot”-based High Density Rule (HDR) – DCA, JFK, LGA, ORD; “buy-and-sell” since 1985
• Early 2000: About 1050 flights per weekday• April 2000 – Air-21 (Wendell-Ford Aviation Act for the Twenty-
first Century)– Immediate exemption from HDR for aircraft seating 70 or fewer on service
between small communities and LGA– Eventual elimination of HDR (by 2007)
• By November 2000 airlines had added over 300 flights per day; more planned– Virtual gridlock at LGA (25% of all OPSNET delays in Fall, 2000)
• December 2000: FAA and PANYNJ implemented slot lottery and announced intent to develop longer-term policy for access to LGA
• June 2001: Notice for Public Comment posted with regards to longer-term policy

5
Outline
• Sensitivity to characteristics of demand and capacity
• External delay costs vs. the current cost of access
• Sample demand management systems
• Other complications
• Conclusions

6
LGA demand before and after the lottery
November 2000 as a representative profile prior to slot lottery at LaGuardia; August 2001 as a representative after slot lottery.Source: Official Airline Guide
Scheduled operations per hour on weekdays
Time of day, e.g. 5 = 0500 - 0559
• Scheduled operations reduced by 10% (from 1,348 to 1,205/day)
0
10
20
30
40
50
60
70
80
90
100
5 7 9 11 13 15 17 19 21 23 1 3
Nov, 00
Aug, 01
75 flt/hour
Capacity of 75/hr does not include allocation of six slots for g.a. operations

7
Small reduction in demand may lead to dramatic reduction in delays
Minutes of delay per operation
• Average delay reduced by >80% during evening hours
• Lottery was critical in improving operating conditions at LGA
Capacity = 75 operations/hr
Time of day
0
20
40
60
80
100
120
5 7 9 11 13 15 17 19 21 23 1 3
Nov, 00
Aug, 01

8
A dynamic system
• A priori delay estimates may give only an upper bound on the true extent of delays
• Aircraft operators react dynamically on a day-to-day basis to operating conditions
• ASQP statistics (weekdays, Sept.- Dec. 2000): Average taxi-out time: 43 minutesAverage time from scheduled departure time to take-off: 80 minutes
On-time arrivals: 52%Cancelled flights: 9/00 => 6.7%; 10/00 =>5.1%
11/00 => 5.1%; 12/00 => 12.6%

9
Comparing Queuing Model with ASQP Data
Average departure delay at LGA (minutes/flight) for Nov 13, 00 (VFR, light wind)
Time of day
Total flight operations per hour reduced by the observed cancellation rate from ASQP data from major carriers
0
20
40
60
80
100
120
5 6 7 8 9 10 11 12 13 14 15 16 17 18 19 20 21 22 23 0
Actual departuredelay (majors)
Model - asscheduled
Model - adjustedfor cancellations

10
Matching Total Demand with Capacity is Key
Total delay per weekday (aircraft-hour)
Demand reducedDemand leveled Demand leveled
• Impact from demand leveling is small compared to demand reduction
• Some demand peaks can be allowed under demand management
0
200
400
600
800
1000
1200
1400
Nov 00 actual Nov 00 level(0700-2159)
Aug 01 actual Aug 01 level
Total delay
4 pm - 7:59 pm
11
Outline
• Sensitivity to characteristics of demand and capacity
• External delay costs vs. the current cost of access
• Sample demand management systems
• Other complications
• Conclusions

12
Marginal delay cost due to an additional operation
Marginal delay caused by an additional aircraft (aircraft-hours)
Time of day
0
2
4
6
8
10
12
14
16
18
5 7 9 11 13 15 17 19 21 23 1 3
Nov, 00
Aug, 01
• Runway at LGA virtually “saturated” prior to slot lottery
• Delays propagate throughout the day
Capacity = 75 per hour

13
Marginal delay cost dwarfs landing fee at LGA, even after lottery
Time of day – e.g. 5 = 0500 – 0559
$
0
1000
2000
3000
4000
5000
6000
7000
8000
9000
5 7 9 11 13 15 17 19 21 23 1 3
Marginaldelay cost
Actualcharge
14
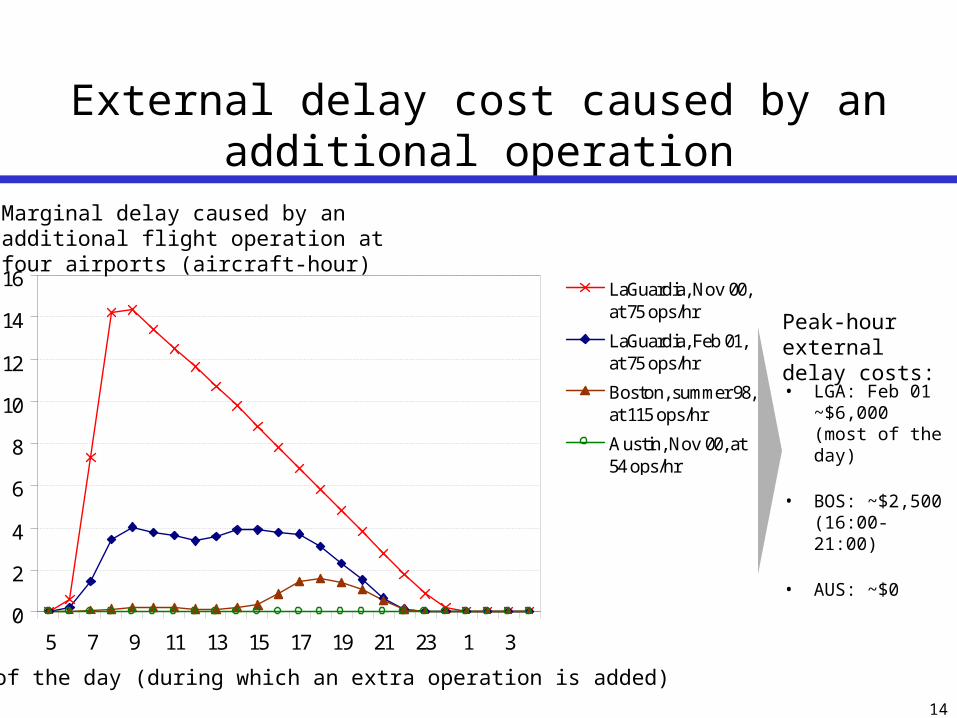
External delay cost caused by an additional operation
• LGA: Feb 01 ~$6,000 (most of the day)
• BOS: ~$2,500 (16:00-21:00)
• AUS: ~$0
Hour of the day (during which an extra operation is added)
0
2
4
6
8
10
12
14
16
5 7 9 11 13 15 17 19 21 23 1 3
LaGuardia, Nov 00,at 75 ops/hr
LaGuardia, Feb 01,at 75 ops/hr
Boston, summer 98,at 115 ops/hr
Austin, Nov 00, at54 ops/hr
Marginal delay caused by an additional flight operation at four airports (aircraft-hour)
Peak-hour external delay costs:

15
Congestion pricing
• Estimating the marginal delay cost that each additional operation causes to all other movements at an airport is central to congestion pricing
• At non-hub airports with many operators holding a limited share of airport activity, marginal delay cost is not internalized
• Congestion pricing aims at increasing efficiency of resource utilization by forcing users to internalize external costs
• Current landing (and take-off) fees at US airports bear little relationship to true external costs

16
Hub demand - Atlanta
16
Time of day – e.g. 5 = 0500 – 0559
Total scheduled movements per 15-minute intervals(November, 2000)
Source: FAA Airport Benchmark Report, 2001, Official Airline Guide
0
10
20
30
40
50
60
70
5 7 9 11 13 15 17 19 21 23
Arrivals
Departures
Approxoptimumcapacity

17
Non-hub demand- LaGuardia
17
Time of day – e.g. 5 = 0500 – 0559
Total scheduled movements per 60-minute intervals(November, 2000)
Source: Official Airline Guide Note: 75 flights/hr excludes allocation for general aviation
0
20
40
60
80
100
5 7 9 11 13 15 17 19 21 23 1 3
Arrival
Departure
At 75movements/hrof capacity
18
Important to note…
• The external costs computed, in the absence of congestion pricing, give only an upper bound on the magnitude of the congestion-based fees that might be charged
• These are not “equilibrium prices”• Equilibrium prices may turn out to be
considerably less than these upper bounds• Equilibrium prices are hard to estimate

19
Lessons
-The delay reductions that can be obtained from relatively small reductions in total daily demand
and-the external delay costs incurred in accessing runway systemscan be very large at some of the busiest airports – probably
well in excess of what most would guess
-The delay reductions that can be obtained from some “de-peaking” of daily demand profiles are typically more modest
• Adequate quantitative methods are available

20
Outline
• Sensitivity to characteristics of demand and capacity
• External delay costs vs. the current cost of access
• Sample demand management systems
• Other complications
• Conclusions

21
Proposed Demand Management Alternatives
• Three types of demand management strategies were put forward in June 2001:
1. Congestion pricing: PANYNJ (two options)2. Auctions: PANYNJ (two options)3. Administrative: FAA (three options): e.g.,
“encourage use of larger aircraft”
• In fact, all options under 1 and 2 contained strong administrative components, as well

22
Example: Congestion Pricing, Option B
• Assumes HDR slots and AIR-21 lottery slots will be abolished• Target: demand total of 78 ops per hour; possible future revisions• Toll: surcharge on top of existing landing fee; arrs and deps• 06:00-22:00 weekdays; 06:00-14:00 Sat; 09:00-22:00 Sun• Three classes of movements:1. Exempt from congestion fee: 80 movements per weekday that
formerly qualified under AIR-21 (allocated by lottery, 2 slots per airline per round of the lottery)
2. Subject to congestion fee A: all other movements formerly qualifying under AIR-21; general aviation. (A ~ $350-700)
3. Subject to congestion fee B: all other operations (B ~ $700-2,000)
23
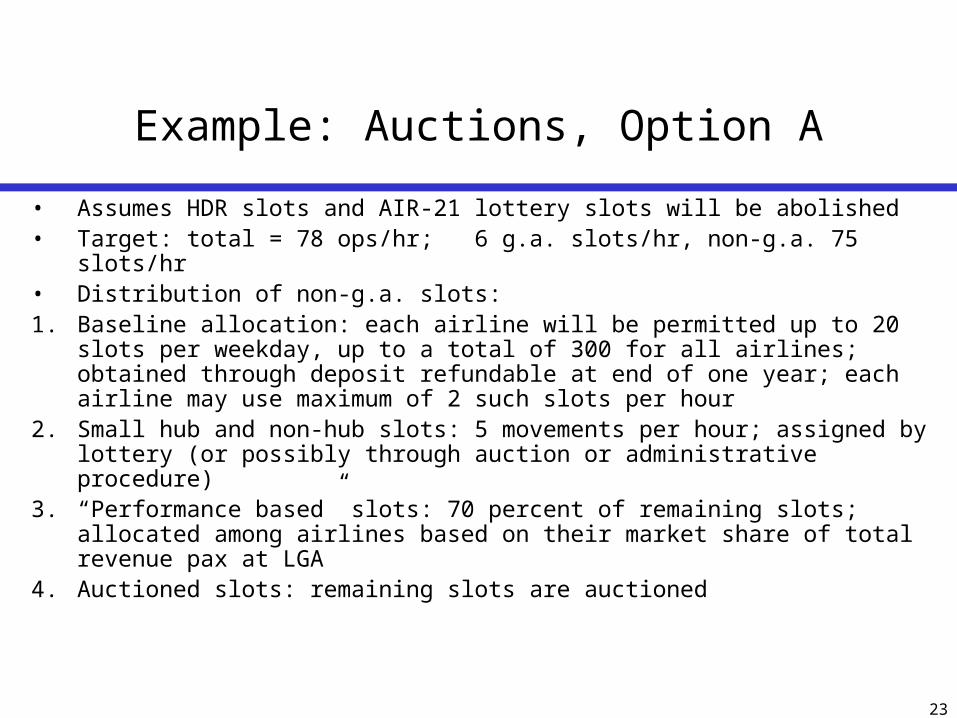
Example: Auctions, Option A
• Assumes HDR slots and AIR-21 lottery slots will be abolished• Target: total = 78 ops/hr; 6 g.a. slots/hr, non-g.a. 75 slots/hr • Distribution of non-g.a. slots:1. Baseline allocation: each airline will be permitted up to 20 slots per
weekday, up to a total of 300 for all airlines; obtained through deposit refundable at end of one year; each airline may use maximum of 2 such slots per hour
2. Small hub and non-hub slots: 5 movements per hour; assigned by lottery (or possibly through auction or administrative procedure)
3. “Performance based” slots: 70 percent of remaining slots; allocated among airlines based on their market share of total revenue pax at LGA
4. Auctioned slots: remaining slots are auctioned

24
Lessons (2)
• Public policy objectives (“fairness”, continuity, opportunity for new entrants, access for all operators, access for small communities) dictate use of hybrid demand management systems that combine administrative measures and market-based approaches
• The demand management systems that may eventually be implemented will have complex rules

25
Outline
• Sensitivity to characteristics of demand and capacity
• External delay costs vs. the current cost of access
• Sample demand management systems
• Other complications
• Conclusions

26
Target levels of demand
• Demand management measures have to aim, explicitly or implicitly, for a “target number” of daily and hourly movements at which an airport is expected to operate at an acceptable level of delay
• Airport capacity is dynamic and stochastic• Determining the target demand requires difficult trade-offs
between overall utilization of available capacity and performance when capacity is reduced
• Must look at performance over entire range of airport capacities and consider frequency with which associated weather conditions occur

27
BOS: Annual Capacity Coverage Chart(assumes 50 % arrivals and 50 % departures)
10080
80
120
40
0
604020
Movements per hour
% of time

28
What is legit?
• Fundamental statutory issues concerning demand management are unresolved, e.g.,
-- Are time-varying landing fees legitimate?-- Must all landing fees and aeronautical charges be
cost-related?-- Can airports re-distribute among users the proceeds
from access fees?• “Federal laws, regulations and US international obligations
may prevent PANYNJ from imposing these proposals. We will consider pertinent legal issues….”

29
Real-time, CDM-enabled possibilities
• CDM has opened the possibility of implementing market-based demand management mechanisms on an as-needed basis in real time
• A “Slot Exchange”

30
Outline
• Sensitivity to characteristics of demand and capacity
• External delay costs vs. the current cost of access
• Sample demand management systems
• Other complications
• Conclusions
31
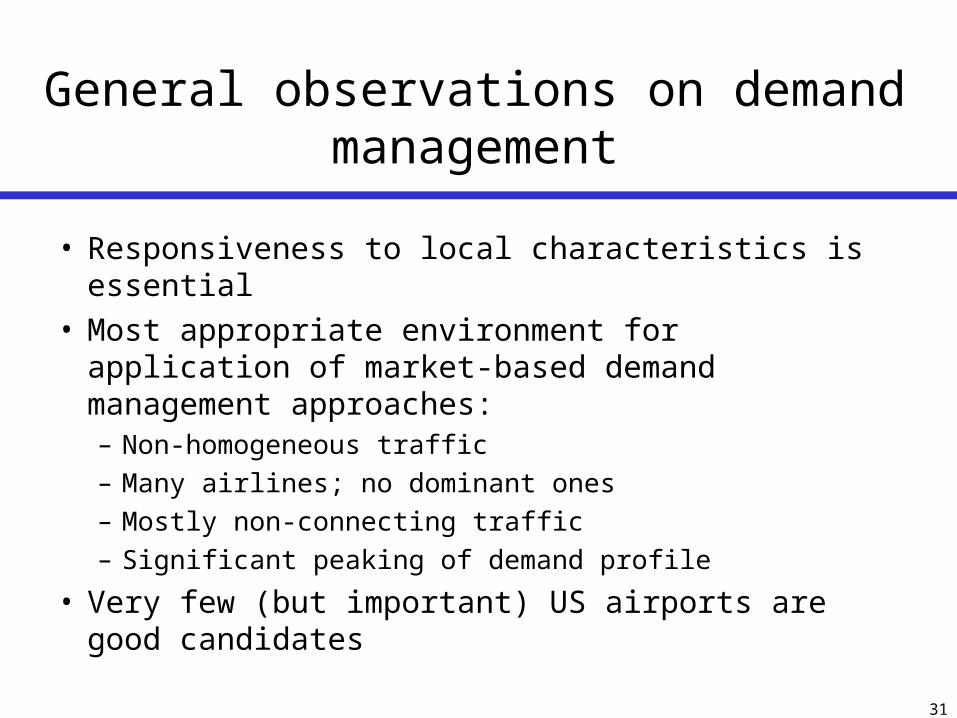
General observations on demand management
• Responsiveness to local characteristics is essential• Most appropriate environment for application of
market-based demand management approaches:– Non-homogeneous traffic
– Many airlines; no dominant ones
– Mostly non-connecting traffic
– Significant peaking of demand profile
• Very few (but important) US airports are good candidates

32
Conclusion
• Airport demand management is a very complex systems problem• Technical issues:
– Estimating magnitude of externalities– Setting target level of demand in view of dynamic and stochastic
capacity– Prediction of user response to market-based measures– Proper balance between strategic and tactical interventions
• Murky statutory framework• Conflicting stakeholder objectives• Policies must balance objectives of efficiency, reliability and equity• Any viable policy will be a hybrid of administrative and market-
based measures

33
The Queuing Model
Assume: Time-varying demand, approximated as non-homogeneous Poisson process; Time-varying capacity (“general” service times, with given expected value and
variance); approximated through Erlang family of probability distributionsInputs:
Dynamic demand profile (typically via hourly demand rates over 24 hours) Dynamic capacity profile (typically via hourly capacity rates over 24 hours)
Approach: Starting with initial conditions at time t=0, solve equations describing
evolution of queues, computing probabilities of having 0, 1, 2, 3, … aircraft in queue at times t = t, 2t, 3t, … up to end of time period of interest
Outputs:Statistics about queues (average queue length, average waiting time, total
delay, fraction of flights delayed more than X minutes, etc.)

34
Upon “leveling” temporal distribution of demand…
Time of day – e.g. 5 = 0500 – 0559
Total scheduled movements per 60-minute interval(August, 2001, after slot lottery)
0
10
20
30
40
50
60
70
80
90
5 7 9 11 13 15 17 19 21 23 1 3
Actual
Leveled
75 flts/hr

35
…some further reductions in average delay may be obtained
Time of day – e.g. 5 = 0500 – 0559
Average delayper operation in minutes/flightfrom August, 01 schedules (after slot lottery)
0
5
10
15
20
25
5 7 9 11 13 15 17 19 21 23 1 3
Actual
Leveled
36
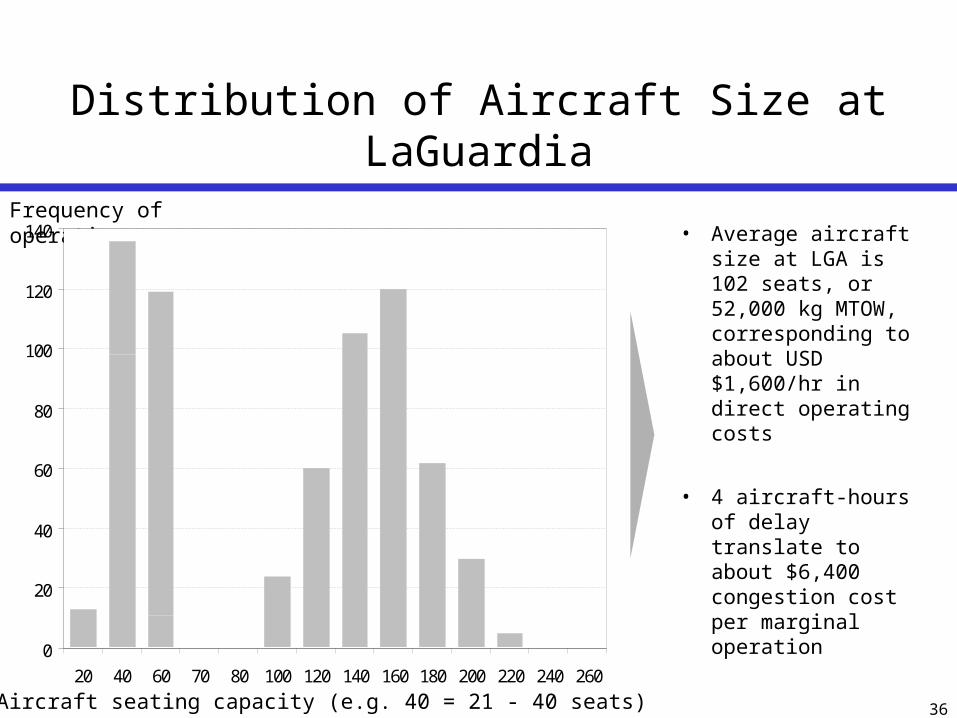
Distribution of Aircraft Size at LaGuardia
Frequency of operations• Average aircraft size
at LGA is 102 seats, or 52,000 kg MTOW, corresponding to about USD $1,600/hr in direct operating costs
• 4 aircraft-hours of delay translate to about $6,400 congestion cost per marginal operation
Aircraft seating capacity (e.g. 40 = 21 - 40 seats)
0
20
40
60
80
100
120
140
20 40 60 70 80 100 120 140 160 180 200 220 240 260