Embed Size (px)
Citation preview

1
Reinsurance Market Outlook:Value Creating Capital
Azerbaijan International Insurance Forum - AIIF 2012Baku, 04th – 05th July, 2012

2
Contents
I. Who is Aon Benfield
II. Setting the Scene

3
Who is Aon Benfield

4
About Aon
Aon plc (NYSE: AON) is the leading global provider of risk management services, insurance and reinsurance brokerage, and human resource consulting and outsourcing.
Aon plc
Aon Risk Solutions Aon Benfield Aon Hewitt
Retail Brokerage Reinsurance Human Capital Consulting
Proprietary & Confidential
$ 6.0 billion
$ 78 billion
~28,000
$ 3.8 billion
~30,000
$ 1.5 billion
$ 29 billion
~3,000
Commissions & Fees
Premium
Colleagues
$ 11.3 billion
$ 107 billion
~61,000
Total 2011

5
Aon Benfield
Aon Benfield is world’s No.1:
Treaty
Facultative
Investment bank exclusively focused in (re)insurance
Why is Aon Benfield No.1:
Experience and knowledge about each country and region
– offices in more than 50 countries
Unrivalled investments in Analytics – Over US$ 120m invested annually– Over 500 in analytics– 16 partner universities globally
Best Transactional team
Widest Market Access
Global Reach
Trusted Advisor
Numbers for 2010, Source: Business Insurance 24th October 2011
Aon Benfield CEE team
All part of ONE CEE Team with 87 members
The most experienced team in the region
27 Analytics dedicated to the region

6Aon Benfield Analytics | Reinsurance Market Outlook, April 2012
Aon Benfield CEE Business
127 direct cedents
In CEE
Placing business with 163
reinsurers.
EUR 428m ceded premium

7
Setting the Scene
Full year ended December 31, 2011

8
Economic Climate
Main issues for insurance and reinsurance market:

9Aon Benfield Analytics | Reinsurance Market Outlook, April 2012
Reinsurer Capital Change (USD Billions)
Reinsurance capacity ended 2011 down 3 percent over FY 2010 despite nearly USD113 billion in insured catastrophe losses during 2011
Reinsurers covered a higher proportion of losses in 2011 than in prior major catastrophe years because affected insurers generally held lower retentions and utilized substantial proportional contracts
Source: Individual Company Reports, Aon Benfield Analytics

10Aon Benfield Analytics | Reinsurance Market Outlook, April 2012
Aon Benfield Aggregate Combined Ratio Comparison
Source: Individual Company Reports, Aon Benfield Analytics
The ABA combined ratio increased to 108.2 percent, an increase of 13.5 percentage points compared to 2010 with a 14.1 percentage point increase in natural catastrophe losses
Reinsurer returns on equity in 2011 dropped to 3 percent due to catastrophe losses and lower investment yields; Analyst consensus earnings for public reinsurers show returns on equity rebounding to the 10 percent range for 2012 and 2013

11Aon Benfield Analytics | Reinsurance Market Outlook, April 2012
Shareholders’ funds development – FY 2011 vs FY 2010
246.6 1.6
11.7 -9.6
-0.8 5.0 -4.10.5 250.8
200
210
220
230
240
250
260
270
FY 2010SHF
Additionalcapital
Netincome
Dividends FX Investmentgains
Sharebuybacks
Other FY 2011SHF
US
D (b
illio
ns)
209.7
24.7
23.6 -7.4-1.8
8.4 -10.2
-0.5 246.6
200
210
220
230
240
250
260
270
FY 2009SHF
Additionalcapital
Netincome
Dividends FX Investmentgains
Sharebuybacks
Other FY 2010SHF
US
D (b
illio
ns)
12Aon Benfield Analytics | Reinsurance Market Outlook, April 2012
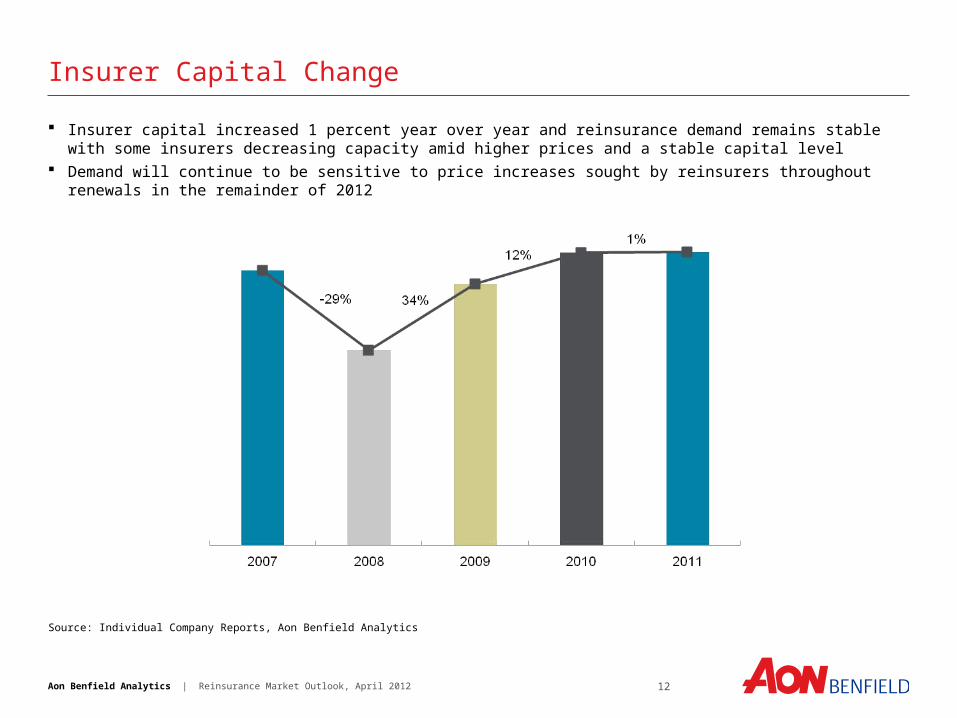
Insurer Capital Change
Source: Individual Company Reports, Aon Benfield Analytics
Insurer capital increased 1 percent year over year and reinsurance demand remains stable with some insurers decreasing capacity amid higher prices and a stable capital level
Demand will continue to be sensitive to price increases sought by reinsurers throughout renewals in the remainder of 2012

13Aon Benfield Analytics | Reinsurance Market Outlook, April 2012
Impact Forecasting Economic Loss Estimates
Source: Impact Forecasting
Global losses for 2011 are currently estimated at USD 434 billion
-
50
100
150
200
250
300
350
400
450
500
2004 2005 2006 2007 2008 2009 2010 2011
Bill
ion
s
Winter Weather
Wind
Wildfires
Tropical Cyclone
Severe Weather
Other
Hurricane/Typhoon
Flood
Earthquake

14Aon Benfield Analytics | Reinsurance Market Outlook, April 2012
2011 Economic Loss versus Recent Years’ Average
Losses in Asia alone accounted for 65 percent of total losses for 2011, more than six times the average annual economic loss in that region in recent years
Higher insurance penetration in the regions with loss in 2011 increased total loss covered by insurance to approximately 25 percent (USD 106 billion), up from 15 percent in 2010.
Source: Impact Forecasting
$0
$50
$100
$150
$200
$250
$300
Africa Asia Europe NorthAmerica(excl US)
Oceania SouthAmerica
US
Bill
ion
s
Average 2004-2010 2011

15Aon Benfield Analytics | Reinsurance Market Outlook, April 2012
3 of Top 10 Events in the past 30 Years Occurred in 2011
•The New Zealand government has only released a combined USD 30 billion economic loss total for the September 2010, February 2011 and June 2011 EQ Events.•Sources: Impact Forecasting, Insurance Information Institute, National Hurricane Center, National Climatic Data Center, USGS

16Aon Benfield Analytics | Reinsurance Market Outlook, April 2012
2011 Catastrophe Losses as Percent of FY 2010 Shareholders’ Funds
*Includes other major events, additions/releases from previous quarter(s) loss estimates (when not split by event), reinstatements, FX reconciliations, etc.Splits by event are shown as latest reported, i.e. could be from Q1, Q2, Q3 or FY 2011 results. Some Thai flood loss estimates are from preliminary announcementsAll losses are assumed pre-taxAll losses are net of reinstatement premiums except for Validus and ACEAll losses converted to USD at 2011 full year average FX ratesUS tornadoes includes Hurricane Irene for Argo, Ariel and NovaeSource: Individual company reports, Aon Benfield Analytics
The impact of the 2011 catastrophes varied widely by reinsurer Catastrophe losses in Q1 2012 were significantly less than in 2011; 2012 has resulted in
approximately USD10 billion in economic loss and nearly USD3 billion in insured loss compared to USD270 billion in economic loss in Q1 2011 and almost USD53 billion in insured loss
49%
38%
30%
27%25% 25% 24% 23%
22%21% 20% 20%
20%20% 20%
17% 17% 17% 16% 16% 16% 15% 15% 15%13% 13% 13%
12% 12%
9% 9% 9%7%
6%
4%2%
1%
-5%
5%
15%
25%
35%
45%
Adjustments / Other*
Thai Floods
Hurricane Irene
US Tornadoes
Japan Earthquake & Tsunami
New Zealand Earthquakes
Australia

17Aon Benfield Analytics | Reinsurance Market Outlook, April 2012
Timeline of 2011 Industry Events
Source: Aon Benfield Analytics
2011 was an eventful year with elevated catastrophe losses, volatile stock market conditions, record low investment yields and downgrade of U.S. debt and the European sovereign debt crisis
Jan Feb Mar Apr May Jun Jul Aug Sep Oct Nov Dec
Joplin Tornado Outbreak ~
$6.5B
Winter storms hit Midwest & Northeast
~ $1.0B
Birmingham Tornado Outbreak ~ $7.3B
Hurricane Irene ~ $4.3B
TX Wildfires ~ $.5B
A.M. Best places 6 Euro groups
"under review"
S&P warns of downgrades for 15 Euro nations
Snowstorm hits northeast
~ $.6B
10yr Treasury yield hits historical low
(1.72%)
S&P 500 down 19% from 2011
peak
S&P downgrades US
debt
Japan Earthquake and Tsunami
~ $23.5B
New Zealand Earthquake ~ $13.5B
Thailand Floods ~ $10B
18Aon Benfield Analytics | Reinsurance Market Outlook, April 2012
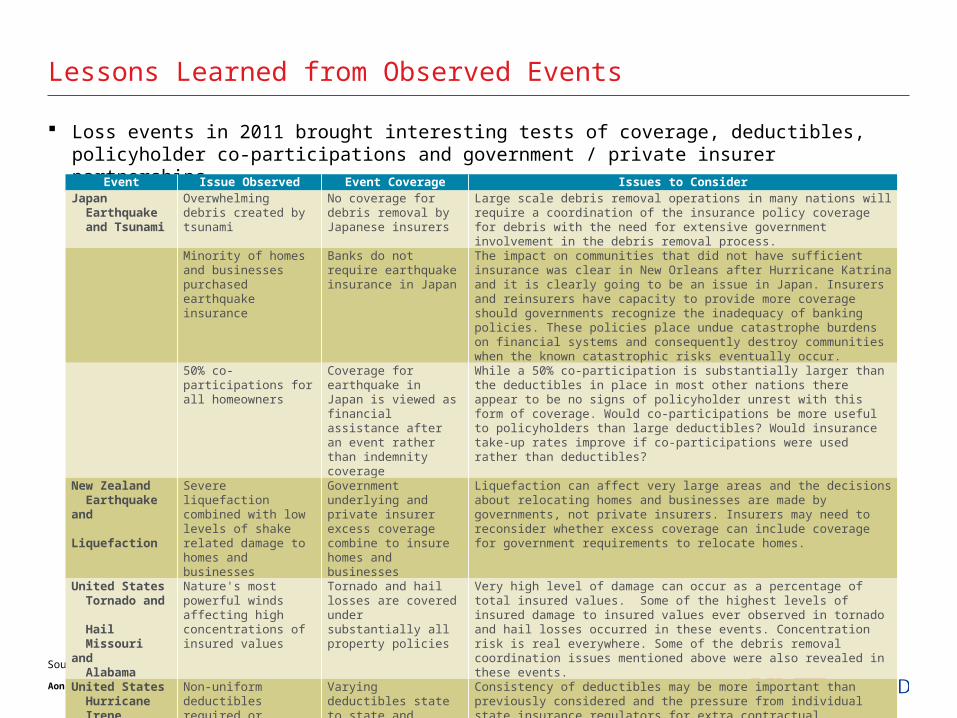
Lessons Learned from Observed Events
Source: Aon Benfield Analytics
Loss events in 2011 brought interesting tests of coverage, deductibles, policyholder co-participations and government / private insurer partnerships
Event Issue Observed Event Coverage Issues to ConsiderJapan Earthquake and Tsunami
Overwhelming debris created by tsunami
No coverage for debris removal by Japanese insurers
Large scale debris removal operations in many nations will require a coordination of the insurance policy coverage for debris with the need for extensive government involvement in the debris removal process.
Minority of homes and businesses purchased earthquake insurance
Banks do not require earthquake insurance in Japan
The impact on communities that did not have sufficient insurance was clear in New Orleans after Hurricane Katrina and it is clearly going to be an issue in Japan. Insurers and reinsurers have capacity to provide more coverage should governments recognize the inadequacy of banking policies. These policies place undue catastrophe burdens on financial systems and consequently destroy communities when the known catastrophic risks eventually occur.
50% co-participations for all homeowners
Coverage for earthquake in Japan is viewed as financial assistance after an event rather than indemnity coverage
While a 50% co-participation is substantially larger than the deductibles in place in most other nations there appear to be no signs of policyholder unrest with this form of coverage. Would co-participations be more useful to policyholders than large deductibles? Would insurance take-up rates improve if co-participations were used rather than deductibles?
New Zealand Earthquake and Liquefaction
Severe liquefaction combined with low levels of shake related damage to homes and businesses
Government underlying and private insurer excess coverage combine to insure homes and businesses
Liquefaction can affect very large areas and the decisions about relocating homes and businesses are made by governments, not private insurers. Insurers may need to reconsider whether excess coverage can include coverage for government requirements to relocate homes.
United States Tornado and Hail Missouri and Alabama
Nature's most powerful winds affecting high concentrations of insured values
Tornado and hail losses are covered under substantially all property policies
Very high level of damage can occur as a percentage of total insured values. Some of the highest levels of insured damage to insured values ever observed in tornado and hail losses occurred in these events. Concentration risk is real everywhere. Some of the debris removal coordination issues mentioned above were also revealed in these events.
United States Hurricane Irene
Non-uniform deductibles required or allowed in multiple states affected by the same event
Varying deductibles state to state and coastal versus inland in the same state
Consistency of deductibles may be more important than previously considered and the pressure from individual state insurance regulators for extra contractual allowances to policyholders may have been underappreciated.

19Aon Benfield Analytics | Reinsurance Market Outlook, April 2012
Impact of 2011 Cat losses
Economic losses of USD438bn made 2011 the costliest natural disaster year on record
Insured losses of USD112bn are second only to 2005’s USD120bn (KRW: USD90bn)
Reinsurers’ assumed losses in 2010/2011 are now likely to exceed those in 2004/2005
Compared with 2005
– industry capital is much stronger (near peak levels)
– risk modelling is much improved
– risk management is more robust
– risk tolerance is generally lower
Capital has been impacted but
– widespread capital raising is not required
– total capitalisation remains high
– the rating impact has been limited

20Aon Benfield Analytics | Reinsurance Market Outlook, April 2012
Financial strength ratings: negative action
Source: A.M. Best, S&P (ratings as at April 11, , 2012)
Allianz SE A+ Stable A+ Watch Neg AA Stable AA Negative
Ariel Reinsurance Co. Ltd. A- Stable A- Stable NR NR NR Withdrawn
Asia Capital Reinsurance Group Pte Ltd. A- Stable A- Stable A- Stable A- Negative
Caisse Centrale de Reassurance A++ Stable A++ Negative AAA Stable AA+ Negative
Flagstone Reassurance Suisse SA A- Stable A- Negative NR NR NR NR
General Reinsurance Corp. A++ Stable A++ Stable AA+ Stable AA+ Negative
Labuan Reinsurance (L) Ltd A- Stable A- Watch Neg - - - -
Mapfre Re, Compania de Reaseguros, S.A. A Stable A Watch Neg AA Negative A Negative
MS Frontier Reinsurance Ltd. A Stable A Stable AA- Stable A+ Stable
National Indemnity Co. A++ Stable A++ Stable AA+ Stable AA+ Negative
Partner Reinsurance Co. Ltd. A+ Stable A+ Negative AA- Negative A+ Stable
Platinum Underwriters Bermuda Ltd. A Stable A Stable A Stable A- Stable
Sompo Japan Insurance Inc. A+ Stable A+ Stable AA- Stable A+ Stable
Thai Reinsurance Public Co. Ltd. NR NR A- Stable BBB+ Stable
Toa Reinsurance Co. A+ Stable A+ Watch Neg A+ Stable A+ Stable
Main Operating CompanyA.M. Best S&P
January 1, 2011 Current January 1, 2011 Current

21Aon Benfield Analytics | Reinsurance Market Outlook, April 2012
Financial strength ratings: positive action
Allied World Assurance Co. Ltd. A Stable A Stable A- Positive A Stable
Arch Reinsurance Ltd. A Stable A+ Stable A+ Stable A+ Stable
AXIS Specialty Ltd. A Stable A Positive A+ Stable A+ Stable
Lancashire Insurance Co. Ltd. A- Positive A Stable A- Stable A- Stable
Montpelier Reinsurance Ltd. A- Stable A- Positive A- Stable A- Stable
Odyssey Reinsurance Co. A Stable A Stable A- Stable A- Positive
Swiss Reinsurance Co. Ltd. A Positive A+ Stable A+ Positive AA- Stable
Validus Reinsurance Ltd A- Positive A Stable A- Stable A- Stable
Mixed Messages
Alterra Bermuda Ltd. A Stable A Negative A- Positive A Stable
Tokio Millennium Re Ltd. A+ Stable A++ Stable AA Negative AA- Negative
S&P
January 1, 2011 Current January 1, 2011 Current
Main Operating Company
Main Operating Company
A.M. Best S&PJanuary 1, 2011 Current January 1, 2011 Current
A.M. Best
Source: A.M. Best, S&P (ratings as at April 11, , 2012)

22Aon Benfield Analytics | Reinsurance Market Outlook, April 2012
January 2012 Property Catastrophe Renewals Recap
Results are summarized for contracts that did not cede material losses to the expiring reinsurance program. Rate changes are based on exposure neutral pricing and measured from the expiring January 2011 terms. Source: Aon Benfield Analytics
ROL Change Capacity Change Retention Change
U.S. (accounts with Loss) +5% to +40% Stable to -5% Stable to +5%
U.S. +5% to +10% Stable to -5% Stable to +5%
ROL Change Capacity Change Retention Change
Asia PacificAustralia +40% to +75% Stable Stable to +25%China +10% to +20% Stable +10% to +15%
Hong Kong +10% -30% to -40% Stable
Indonesia -5% to +5% Stable Stable
Malaysia +5% to +10% -5% to Stable Stable
Pakistan +5% to +10% Stable Stable
Philippines +5% to +10% Stable Stable
Singapore Flat Stable Stable
Taiwan +5% to +25% -5% to -10% Stable to +5%
Thailand +100% to +600% +20% to +50% +10% to +100%
EMEANorthern (wind dominating) Flat to +5% Stable to +2.5% Flat
Southern (quake dominating) Flat to +10% Stable Flat
Americas – Non U.S.Chile Flat Stable Stable
Canada +5% to +15% -5% to-10% +5% to +15%
Brazil Flat Abundant Stable
South Africa +10% to +25% Stable Varies
U.S. Property Catastrophe January 1, 2012 Recap
Rest of the World: Property Catastrophe January 1, 2012 Recap

Aon Benfield · Vaclavske namesti 19 · 110 00 Prague 1 · Czech Republic
www.aonbenfield.com
Published by Aon Limited trading as Aon BenfieldRegistered office: 8 Devonshire Square, London EC2M 4PL.
Aon Limited is authorised and regulated by the Financial Services Authority in respect of insurance mediation activities only.