Embed Size (px)
Citation preview

15
FINANCIAL SECTION

16
Independent Auditor’s Report
Independent Auditor’s Report
Honorable Mayor and City Council City of West Des Moines, Iowa West Des Moines, Iowa
Report on the Financial Statements
We have audited the accompanying financial statements of the governmental activities, the business-type activities, each major fund and the aggregate remaining fund information of the City of West Des Moines, Iowa (the City) as of and for the year ended June 30, 2020, and the related notes to the financial statements, which collectively comprise the City’s basic financial statements as listed in the table of contents.
Management’s Responsibility for the Financial Statements
Management is responsible for the preparation and fair presentation of these financial statements in accordance with accounting principles generally accepted in the United States of America; this includes the design, implementation and maintenance of internal control relevant to the preparation and fair presentation of financial statements that are free from material misstatement, whether due to fraud or error.
Auditor’s Responsibility
Our responsibility is to express opinions on these financial statements based on our audit. We conducted our audit in accordance with auditing standards generally accepted in the United States of America and the standards applicable to financial audits contained in Government Auditing Standards, issued by the Comptroller General of the United States. Those standards require that we plan and perform the audit to obtain reasonable assurance about whether the financial statements are free from material misstatement.
An audit involves performing procedures to obtain audit evidence about the amounts and disclosures in the financial statements. The procedures selected depend on the auditor’s judgment, including the assessment of the risks of material misstatement of the financial statements, whether due to fraud or error. In making those risk assessments, the auditor considers internal control relevant to the entity’s preparation and fair presentation of the financial statements in order to design audit procedures that are appropriate in the circumstances, but not for the purpose of expressing an opinion on the effectiveness of the entity’s internal control. Accordingly, we express no such opinion. An audit also includes evaluating the appropriateness of accounting policies used and the reasonableness of significant accounting estimates made by management, as well as evaluating the overall presentation of the financial statements.
17
We believe that the audit evidence we have obtained is sufficient and appropriate to provide a basis for our audit opinions.
Opinions
In our opinion, the financial statements referred to above present fairly, in all material respects, the respective financial position of the governmental activities, the business-type activities, each major fund and the aggregate remaining fund information of the City, as of June 30, 2020, and the respective changes in financial position and, where applicable, cash flows thereof for the year then ended in accordance with accounting principles generally accepted in the United States of America.
Other Matters
Required Supplementary Information
Accounting principles generally accepted in the United States of America require that the management’s discussion and analysis, budgetary comparison, pension, and other postemployment benefit information and modified approach for infrastructure as listed in the table of contents be presented to supplement the basic financial statements. Such information, although not a part of the basic financial statements, is required by the Governmental Accounting Standards Board, who considers it to be an essential part of financial reporting for placing the basic financial statements in an appropriate operational, economic or historical context. We have applied certain limited procedures to the required supplementary information in accordance with auditing standards generally accepted in the United States of America, which consisted of inquiries of management about the methods of preparing the information and comparing the information for consistency with management’s responses to our inquiries, the basic financial statements and other knowledge we obtained during our audit of the basic financial statements. We do not express an opinion or provide any assurance on the information because the limited procedures do not provide us with sufficient evidence to express an opinion or provide any assurance.
Other Information
Our audit was conducted for the purpose of forming opinions on the financial statements that collectively comprise the City’s basic financial statements. The introductory section, combining nonmajor fund financial statements, statistical section and the schedule of expenditures of federal awards required by Title 2 U.S. Code of Federal Regulations Part 200, Uniform Administrative Requirements, Cost Principles, and Audit Requirements for Federal Awards, as listed in the table of contents, are presented for purposes of additional analysis and are not a required part of the basic financial statements.
The combining nonmajor fund financial statements and the schedule of expenditures of federal awards (supplementary information) are the responsibility of management and were derived from and relates directly to the underlying accounting and other records used to prepare the basic financial statements. Such information has been subjected to the auditing procedures applied in the audit of the basic financial statements and certain additional procedures, including comparing and reconciling such information directly to the underlying accounting and other records used to prepare the basic financial statements or to the basic financial statements themselves, and other additional procedures in accordance with auditing standards generally accepted in the United States of America. In our opinion, the supplementary information is fairly stated, in all material respects, in relation to the basic financial statements as a whole.
The introductory and statistical sections have not been subjected to the auditing procedures applied in the audit of the basic financial statements, and accordingly, we do not express an opinion or provide any assurance on it.
18
Other Reporting Required by Government Auditing Standards
In accordance with Government Auditing Standards, we also have issued our report dated January 20, 2021, on our consideration of the City’s internal control over financial reporting and on our tests of its compliance with certain provisions of laws, regulations, contracts and grant agreements and other matters. The purpose of that report is solely to describe the scope of our testing of internal control over financial reporting and compliance and the results of that testing, and not to provide an opinion on the effectiveness of the City’s internal control over financial reporting or on compliance. That report is an integral part of an audit performed in accordance with Government Auditing Standards in considering the City’s internal control over financial reporting and compliance.
West Des Moines, Iowa January 20, 2021
19
City of West Des Moines, Iowa Management’s Discussion and Analysis For Fiscal Year Ended June 30, 2020
20
As management of the City of West Des Moines, Iowa (the “City”), we offer readers of the City’s financial statements this narrative overview and analysis of the financial activities of the City for the fiscal year ended June 30, 2020 with selected comparative information for the fiscal year ended June 30, 2019. We encourage readers to consider the information presented here in conjunction with additional information that we have furnished in our letter of transmittal, which is in the Introductory Section at the front of this report.
Financial Highlights At June 30, 2020, assets and deferred outflows of resources of the City exceeded liabilities and deferred inflows of resources by $702 million. Of this amount, $56 million is unrestricted and may be used to meet the government’s ongoing obligations to citizens and creditors. By comparison, for the fiscal year ended June 30, 2019, assets and deferred outflows exceeded liabilities and deferred inflows by $667 million, of which $63 million was unrestricted. The City’s total net position increased by $35 million during the fiscal year ended June 30, 2020. Governmental activities increased by $20 million and business-type activities increased by $15 million. The City continues to be able to report positive balances in all three categories of net position; for the government as a whole, as well as its separate governmental and business-type activities. A considerable portion of expenditures each year were for capital assets, which allowed for increases to net position. As of the close of the current fiscal year, the City’s governmental funds reported combined ending fund balances of $88 million, down from $139 million in the prior year. The unassigned portion of the City’s governmental fund balance, which is available for spending at the City’s discretion, totaled $32.3 million at June 30, 2020, decreasing by $6.5 million. The City continues to hold the highest available bond rating from Moody’s Investor Services and S&P Global (Standard & Poor’s). Each of the agencies cites the City’s financial position and conservative fiscal management as strengths.
Overview of the Financial Statements This discussion and analysis is intended to serve as an introduction to the City’s basic financial statements, which are comprised of three components: 1) government-wide financial statements, 2) fund financial statements, and 3) notes to basic financial statements. This report also contains other supplementary information. Government-wide financial statements. The government-wide financial statements are designed to provide readers with a broad overview of the City’s finances, in a manner similar to private-sector business. The Statement of Net Position presents information on all of the City’s assets, deferred outflows of resources, liabilities, and deferred inflows of resources, with the difference reported as net position. Over time, increases or decreases in net position may serve as a useful indicator of whether the financial position of the City is improving or deteriorating. The Statement of Activities presents information showing how the City’s net position changed during the most recent fiscal year. All changes in net position are reported as soon as the underlying event giving rise to the change occurs, regardless of the timing of related cash flows. Thus, revenues and expenses are reported in this statement for some items that will only result in cash flows in future fiscal periods (e.g., uncollected taxes and earned but unused vacation leave).
City of West Des Moines, Iowa Management’s Discussion and Analysis For Fiscal Year Ended June 30, 2020
21
Both of the government-wide financial statements distinguish functions of the City that are principally supported by taxes and intergovernmental revenues (governmental activities) from other functions that are intended to recover all or a significant portion of their costs through user fees and charges (business-type activities). The governmental activities of the City include public safety, public works (roads, engineering, and traffic controls), health and social services, culture and recreation, community and economic development, general government, and interest on long-term debt. The business-type activities of the City include sanitary sewer, storm water, Westcom, the MidAmerican Energy RecPlex, and solid waste operations,. The government-wide financial statements include only those balances of the City of West Des Moines, as the primary government. The West Des Moines Community School District, the Waukee Community School District, the Des Moines Independent School District, the Norwalk Community School District, the Van Meter Community School District, the Winterset Community School District, and West Des Moines Water Works provide services to the citizens of West Des Moines but do not meet established criteria to be component units of the City, and thus are not included in this report. The government-wide financial statements can be found on pages 34 through 37 of this report. Fund financial statements. A fund is defined as a grouping of related accounts that is used to maintain control over resources that have been segregated for specific activities or objectives. The City of West Des Moines, like other state and local governments, uses fund accounting to ensure and demonstrate compliance with finance-related legal requirements. All of the City’s funds can be divided into three categories: governmental funds, proprietary funds, and fiduciary funds, which are described in further detail as follows:
Governmental funds are used to account for essentially the same functions reported as governmental activities in the government-wide financial statements. However, unlike the government-wide financial statements, government fund financial statements focus on near-term inflows and outflows of spendable resources, as well as on balances of spendable resources available at the end of the fiscal year. Such information may be useful in evaluating a government’s near-term financing requirements, and is typically the basis used in developing the next annual budget. Because the focus of governmental funds is narrower than that of the government-wide financial statements, it is useful to compare the information presented for governmental funds with similar information presented for governmental activities in the government-wide financial statements. By doing so, readers may better understand the long-term impact of the City’s near term financing decisions. Both the governmental fund balance sheet and governmental fund statement of revenues, expenditures, and changes in fund balances provide a reconciliation to facilitate this comparison. The City maintains sixteen individual governmental funds. Information is presented separately in the Balance Sheet - Governmental Funds and in the Statement of Revenues, Expenditures, and Changes in Fund Balances - Governmental Funds for the General Fund, Road Use Tax Fund, Tax Increment Financing Fund, Debt Service Fund, Capital Projects Fund, and Local Option Sales Tax Fund, all of which are considered to be major funds. Data from the other ten governmental funds are combined into a single, aggregated presentation under the column heading Nonmajor Governmental Funds. Individual fund data for each of these nonmajor governmental funds is provided in the form of combining statements elsewhere in this report. The City presents budgetary information as allowed by GASB Statement No. 41. The City adopts an annual appropriated budget for the activity of all funds except agency funds. Formal and legal budgetary control as required by state statute is based upon nine major classes of expenditures known as functions, not by fund or fund type. The basic governmental fund financial statements can be found on pages 38 through 41 of this report.
City of West Des Moines, Iowa Management’s Discussion and Analysis For Fiscal Year Ended June 30, 2020
22
Proprietary funds consist of two different types of funds. Enterprise funds are used to report the same functions presented as business-type activities in the government-wide financial statements. The City uses internal service funds to account for its vehicle replacement, vehicle maintenance, health and dental insurance program, workers’ compensation program and technology replacement. Because these services predominantly benefit governmental rather than business-type functions, they have been included within governmental activities in the government-wide financial statements. Proprietary funds provide the same type of information as the government-wide financial statements, only in more detail. The proprietary fund financial statements provide separate information for the major sanitary sewer operations fund, the major storm water operations fund, the major Westcom fund, the major MidAmerican Energy RecPlex fund and the nonmajor solid waste operations fund. Conversely, all internal service funds are combined into a single, aggregated presentation in the proprietary fund financial statements. Individual fund data for internal service funds is provided as combining statements elsewhere in this report. The basic proprietary fund financial statements can be found on pages 42 through 47 of this report. Fiduciary funds are used to account for resources held for the benefit of parties outside the government. Fiduciary funds are not reflected in the government-wide financial statements because the resources of those funds are not available to support the City’s own programs. The accounting used for fiduciary funds is much like that used for proprietary funds. The basic fiduciary fund financial statements can be found on page 48 of this report.
Notes to basic financial statements. The notes included herein provide additional information that is essential to a full understanding of the data provided in the government-wide and fund financial statements. The notes to basic financial statements can be found on pages 49 through 84 of this report. Other information. In addition to the basic financial statements and accompanying notes, this report also provides certain required supplementary information concerning the City, including a schedule of changes in the City’s total OPEB liability, the City’s proportionate share of the net pension liability and related contributions for both of the City’s pension plans, a budgetary comparison based on the City’s legal level of budgetary control, and infrastructure condition and maintenance records which are required as the City has elected to use the modified approach for reporting much of its infrastructure. This approach to recording infrastructure is explained in detail on page 28, while other required supplementary information can be found on pages 93 through 96 of this report. The combining statements referred to earlier in connection with nonmajor governmental funds and internal service funds are presented immediately following the required supplementary information on infrastructure. Combining statements and schedules can be found on pages 98 through 107 of this report. Government-Wide Financial Analysis Net position may serve as a useful indicator of a government’s financial standing. At June 30, 2020, the City’s assets and deferred outflows of resources exceeded liabilities and deferred inflows by $702 million. The City’s Net Position is allocated on the basis of function and categorized as either supporting a governmental or business-type purpose. A summary and discussion of Net Position is discussed on the following page.
City of West Des Moines, Iowa Management’s Discussion and Analysis For Fiscal Year Ended June 30, 2020
23
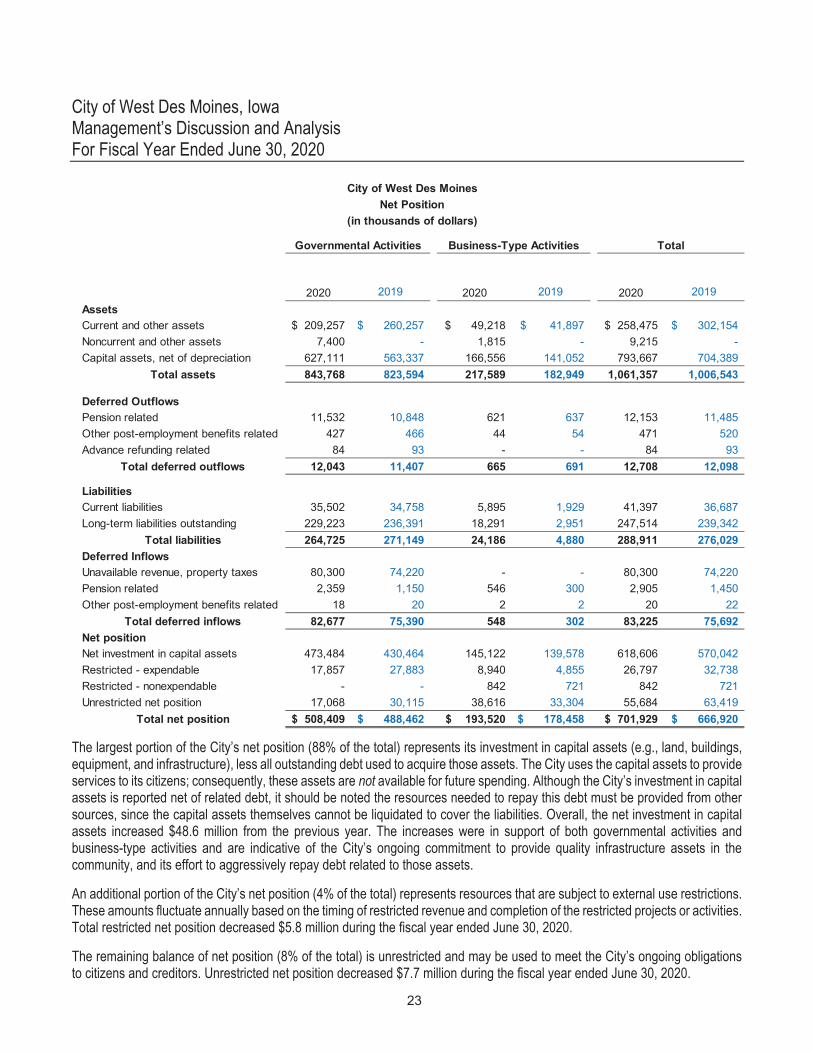
2020 2019 2020 2019 2020 2019AssetsCurrent and other assets 209,257$ 260,257$ 49,218$ 41,897$ 258,475$ 302,154$ Noncurrent and other assets 7,400 - 1,815 - 9,215 - Capital assets, net of depreciation 627,111 563,337 166,556 141,052 793,667 704,389
Total assets 843,768 823,594 217,589 182,949 1,061,357 1,006,543
Deferred OutflowsPension related 11,532 10,848 621 637 12,153 11,485 Other post-employment benefits related 427 466 44 54 471 520 Advance refunding related 84 93 - - 84 93
Total deferred outflows 12,043 11,407 665 691 12,708 12,098
LiabilitiesCurrent liabilities 35,502 34,758 5,895 1,929 41,397 36,687 Long-term liabilities outstanding 229,223 236,391 18,291 2,951 247,514 239,342
Total liabilities 264,725 271,149 24,186 4,880 288,911 276,029 Deferred InflowsUnavailable revenue, property taxes 80,300 74,220 - - 80,300 74,220 Pension related 2,359 1,150 546 300 2,905 1,450 Other post-employment benefits related 18 20 2 2 20 22
Total deferred inflows 82,677 75,390 548 302 83,225 75,692 Net positionNet investment in capital assets 473,484 430,464 145,122 139,578 618,606 570,042 Restricted - expendable 17,857 27,883 8,940 4,855 26,797 32,738 Restricted - nonexpendable - - 842 721 842 721 Unrestricted net position 17,068 30,115 38,616 33,304 55,684 63,419
Total net position 508,409$ 488,462$ 193,520$ 178,458$ 701,929$ 666,920$
(in thousands of dollars)
Governmental Activities Business-Type Activities Total
City of West Des MoinesNet Position
The largest portion of the City’s net position (88% of the total) represents its investment in capital assets (e.g., land, buildings, equipment, and infrastructure), less all outstanding debt used to acquire those assets. The City uses the capital assets to provide services to its citizens; consequently, these assets are not available for future spending. Although the City’s investment in capital assets is reported net of related debt, it should be noted the resources needed to repay this debt must be provided from other sources, since the capital assets themselves cannot be liquidated to cover the liabilities. Overall, the net investment in capital assets increased $48.6 million from the previous year. The increases were in support of both governmental activities and business-type activities and are indicative of the City’s ongoing commitment to provide quality infrastructure assets in the community, and its effort to aggressively repay debt related to those assets. An additional portion of the City’s net position (4% of the total) represents resources that are subject to external use restrictions. These amounts fluctuate annually based on the timing of restricted revenue and completion of the restricted projects or activities. Total restricted net position decreased $5.8 million during the fiscal year ended June 30, 2020. The remaining balance of net position (8% of the total) is unrestricted and may be used to meet the City’s ongoing obligations to citizens and creditors. Unrestricted net position decreased $7.7 million during the fiscal year ended June 30, 2020.
City of West Des Moines, Iowa Management’s Discussion and Analysis For Fiscal Year Ended June 30, 2020
24
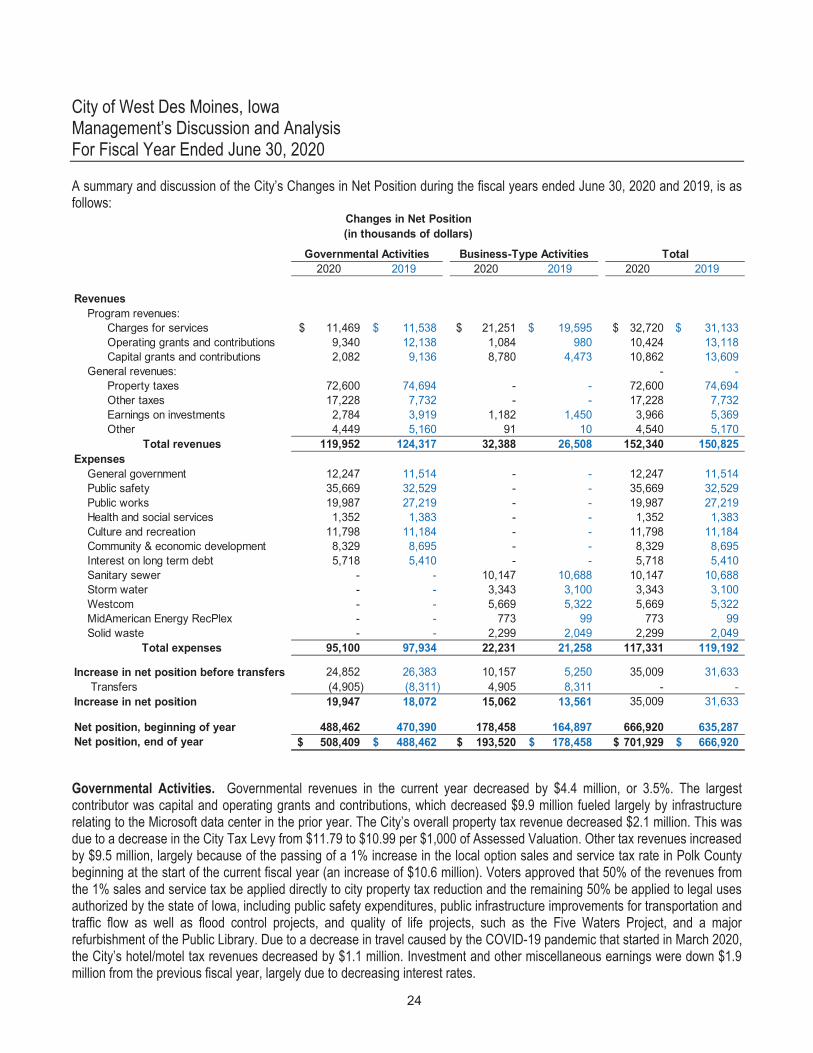
A summary and discussion of the City’s Changes in Net Position during the fiscal years ended June 30, 2020 and 2019, is as follows:
2020 2019 2020 2019 2020 2019
Revenues Program revenues: Charges for services 11,469$ 11,538$ 21,251$ 19,595$ 32,720$ 31,133$ Operating grants and contributions 9,340 12,138 1,084 980 10,424 13,118 Capital grants and contributions 2,082 9,136 8,780 4,473 10,862 13,609 General revenues: - - Property taxes 72,600 74,694 - - 72,600 74,694 Other taxes 17,228 7,732 - - 17,228 7,732 Earnings on investments 2,784 3,919 1,182 1,450 3,966 5,369 Other 4,449 5,160 91 10 4,540 5,170
Total revenues 119,952 124,317 32,388 26,508 152,340 150,825 Expenses General government 12,247 11,514 - - 12,247 11,514 Public safety 35,669 32,529 - - 35,669 32,529 Public works 19,987 27,219 - - 19,987 27,219 Health and social services 1,352 1,383 - - 1,352 1,383 Culture and recreation 11,798 11,184 - - 11,798 11,184 Community & economic development 8,329 8,695 - - 8,329 8,695 Interest on long term debt 5,718 5,410 - - 5,718 5,410 Sanitary sewer - - 10,147 10,688 10,147 10,688 Storm water - - 3,343 3,100 3,343 3,100 Westcom - - 5,669 5,322 5,669 5,322 MidAmerican Energy RecPlex - - 773 99 773 99 Solid waste - - 2,299 2,049 2,299 2,049
Total expenses 95,100 97,934 22,231 21,258 117,331 119,192
Increase in net position before transfers 24,852 26,383 10,157 5,250 35,009 31,633 Transfers (4,905) (8,311) 4,905 8,311 - - Increase in net position 19,947 18,072 15,062 13,561 35,009 31,633
Net position, beginning of year 488,462 470,390 178,458 164,897 666,920 635,287 Net position, end of year 508,409$ 488,462$ 193,520$ 178,458$ 701,929$ 666,920$
Governmental Activities
Changes in Net Position(in thousands of dollars)
Business-Type Activities Total
Governmental Activities. Governmental revenues in the current year decreased by $4.4 million, or 3.5%. The largest contributor was capital and operating grants and contributions, which decreased $9.9 million fueled largely by infrastructure relating to the Microsoft data center in the prior year. The City’s overall property tax revenue decreased $2.1 million. This was due to a decrease in the City Tax Levy from $11.79 to $10.99 per $1,000 of Assessed Valuation. Other tax revenues increased by $9.5 million, largely because of the passing of a 1% increase in the local option sales and service tax rate in Polk County beginning at the start of the current fiscal year (an increase of $10.6 million). Voters approved that 50% of the revenues from the 1% sales and service tax be applied directly to city property tax reduction and the remaining 50% be applied to legal uses authorized by the state of Iowa, including public safety expenditures, public infrastructure improvements for transportation and traffic flow as well as flood control projects, and quality of life projects, such as the Five Waters Project, and a major refurbishment of the Public Library. Due to a decrease in travel caused by the COVID-19 pandemic that started in March 2020, the City’s hotel/motel tax revenues decreased by $1.1 million. Investment and other miscellaneous earnings were down $1.9 million from the previous fiscal year, largely due to decreasing interest rates.
City of West Des Moines, Iowa Management’s Discussion and Analysis For Fiscal Year Ended June 30, 2020
25
Governmental expenses decreased $2.8 million, or 2.9% from the prior fiscal year. This was largely due a $7.2 million decrease in public works and the large fluctuation in capital outlay expenses from the prior year. Public safety expenses increased by $3.1 million due to an increase in police and fire FTE’s and a corresponding increase in compensated absences, OPEB, and Pension. General government expenses increased by $0.7 million, culture and recreation increased by $0.6 million primarily due to rising personnel costs, and interest on long term debt increased by $0.3 million due to long term debt issuances. Business-Type Activities. Revenue received through charges for services increased by $1.7 million due to the annual increase in service rates. Capital and operating grant and contribution revenues increased by $4.4 million, or approximately 80.9% which relates to contributions collected for the construction of the MidAmerican Energy RecPlex ($1.7 million), donated subdivision to the sewer and storm water fund ($1.9 million) and additional sewer fee district collections ($0.8 million). Investment and other miscellaneous earnings on business cash and investments decreased by $0.2 million (12.8%) due to decreasing balances and lower interest rates. Business-type expenses increased by $1.0 million, or approximately 4.6%, which was largely due to increased expenses by the WestCom dispatching center and the MidAmerican Energy RecPlex. At the end of the current fiscal year, the City was able to report positive balances in all three categories of net position, both for the government as a whole, as well as for its separate governmental and business-type activities. This was also the case in the prior fiscal year. Financial Analysis of the Government’s Fund Financial Statements As noted earlier, the City uses fund accounting to ensure and demonstrate compliance with finance-related legal requirements. Governmental Funds. The financial reporting requirements. In particular, unassigned fund balances serve as a useful measure of a government’s net resources available at focus of the City’s governmental funds is to provide information on near-term inflows, outflows, and balances of spendable resources. Such information is useful in assessing the City’s financing at the end of the fiscal year. The City’s governmental funds reported combined fund balances of $87.7 million as of June 30, 2020. Of this total $32.3 million constitutes unassigned fund balance, which is available for spending at the government’s discretion. $1.2 million of the balance is unspendable as it relates to inventory, prepaids, and loan receivables to be collected. The remainder of the fund balance is not available for new spending because it has already been restricted either (1) by legal requirements for debt service payments ($1.7 million); (2) for urban renewal and development in Tax Increment Financing Districts ($5.7 million); (3) for liquidation of contracts for capital improvements ($36.4 million); (4) for various local option sales tax initiatives as directed by voters ($4.2 million); or (5) various other purposes ($6.2 million). The unassigned balance of the General Fund, the chief operating fund of the City, decreased $3.1 million, or 8.1%, to a total of $35.7 million at June 30, 2020. A major portion of this decrease was a budgeted decision to use reserves to fund renovations within the City Hall building. Also contributing to the decrease were lower-than anticipated revenue from Hotel/Motel taxes and a drop in recreational program revenue, both primarily due to COVID-19. As a measure of the General Fund’s liquidity, it is generally useful to compare unassigned fund balance to total annual fund expenditures. The unassigned portion of the General Fund balance at June 30, 2020, represents approximately 55.2% of annual General Fund expenditures. The City strives to maintain an average fund balance of at least 25.0% of General Fund expenditures for working capital needs due to fluctuations in revenue, as property tax revenue, the overwhelming majority of revenue, is only collected semi-annually with the majority of the revenue remitted to the City by the respective county treasurers in the months of October and April each year. The City’s General Fund revenue saw an overall decrease of $0.4 million, despite an increase in property tax and other City tax revenue of $2.7 million. The fund saw $1.3 million decrease in intergovernmental revenue, the primary driver of this variance was the expiration of an agreement with Dallas County in which the county agreed to supplement the City’s revenue over a
City of West Des Moines, Iowa Management’s Discussion and Analysis For Fiscal Year Ended June 30, 2020
26
revenue of $2.7 million. The fund saw $1.3 million decrease in intergovernmental revenue, the primary driver of this variance was the expiration of an agreement with Dallas County in which the county agreed to supplement the City’s revenue over a period of years in return for the City’s significant investment in the Jordan Creek Town Center. Other factors in the overall decrease were a $0.6 million decrease in charges for services due to reduced programming due to COVID-19 (primarily the closing of the City’s two aquatic centers), and a $1 million decrease in use of money and property (investment earnings). General Fund expenditures increased by $1.8 million, or approximately 2.9%. Nearly all can be attributed to rising employee costs, including salaries, pensions, and insurance. The Road Use Tax Revenue collected by the State of Iowa and allocated to the City increased by $0.3 million (+3.9%) from the previous fiscal year. Revenue is tied to vehicle registrations and the sale of fuel, but it is unknown whether the trend was due to price fluctuation or other factors. An increase in transfers out, largely to fund construction of a new Public Services Maintenance facility led to a fiscal 2020 increase in other financing uses of $17.4 million. The overall ending Road Use Tax Fund balance at June 30, 2020, was a deficit balance of $3.3 million, which, following appropriate Council action, was temporarily covered by a loan from the City’s General Fund. The Tax Increment Financing (TIF) Fund had a fund balance of $5.7 million at June 30, 2020, which represents an increase of $2.0 million, or 54.8% from the prior year. There were rising levels of collections, but the primary reasons for the increase were a need to collect funding for upcoming rebates and infrastructure obligations related to development agreements. Since property taxes are collected in arrears, the City continues to benefit from past growth in these areas. The property taxes collected in these special financing districts are generally transferred from the Tax Increment Financing Fund to other funds to cover bonded debt, other loans, advances, and contracts used to finance infrastructure improvements in these TIF districts. The Debt Service Fund had a fund balance of $1.7 million at June 30, 2020, which represents a decrease of 45.9%, from the prior year. This decrease was due to a planned aggressive repayment schedule for 2020 Series A General Obligation Bonds. The continued long-term strategy for the fund is to maintain a minimum reserve balance approximately equal to 25% of total interest payable each fiscal year and because the fund was in a strong position, the 2020 bonds were structured accordingly. The Capital Projects Fund had a fund balance of $36.4 million at June 30, 2020, which represents a decrease in fund balance of $34.5 million, or 48.7%. The decrease was largely due to several large projects undertaken during fiscal 2020, as over $82.7 million was expended from the fund. The Local Option Sales Tax Fund had a fund balance of $4.2 million at June 30, 2020, which represents an increase of 368.9% from the prior year. This large increase was due to a voter-initiated change which allowed for collection of Local Option Sales Tax in the West Des Moines portion of Polk County beginning July 1, 2019. Previously, Local Option Sales Tax was only collected in the Dallas County portion of West Des Moines. The ballot language approved by the voters in each of the counties requires 50% of all revenue collected to be applied directly to city property tax reduction while the other 50% is to be applied only to expenditures for public safety, public infrastructure, pubic parks, sports and recreational facilities and trails, or the public library. Proprietary Funds. The City’s proprietary funds financial statements provide detail which supports information found in the government-wide financial statements. Total net position of the City’s Sanitary Sewer Fund at June 30, 2020, was $110.3 million. This is comprised of a $65.9 million investment in capital assets and $44.4 million in unrestricted net position. The net position of the Sanitary Sewer Fund increased $5.6 million, or 5.4%, which was the result of $0.4 million in increased revenue, a reduction of $0.7 million in operating expenditures, a $1.1 million decrease in capital spending, and capital contributions of infrastructure from developers of $3.5 million. Total net position of the City’s Storm Water Fund at the end of the current year was $69.6 million. This is comprised of $75.9
City of West Des Moines, Iowa Management’s Discussion and Analysis For Fiscal Year Ended June 30, 2020
27
beginning July 1, 2018, and extending through 2022. The prior rate had been in place since fiscal year ending June 30, 2010. In addition, the City authorized internal loans from the sewer fund to the stormwater fund in the amounts of $6.2 million and $7.5 million in fiscal years 2018 and 2019, respectively. Each loan will be repaid over a 15 year term and the outstanding balance at June 30, 2020 was $12.5 million. Total net position of the Westcom Fund at the end of the current year was $1.1 million. This is comprised of $1.0 million investment in capital assets (City’s share of net capital assets, or 55%), $0.8 million restricted by other entities (other participants share of net capital assets, 45%), and a shortfall of $0.7 million. With the restatement of the fund in fiscal year 2019 to full accrual, long term debt obligations such as OPEB, pension, and compensated absences have now been recognized. In accordance with the current agreement with participant cities, these costs have not been previously included in charges for services. This issue is currently being discussed. Total net position of the MidAmerican Energy RecPlex Fund at the end of the current year was $11.3 million. This is comprised of $2.4 million investment in capital assets and $8.9 million has been restricted by other entities for the construction of the facility. The construction of the multi-sport complex is underway with a completion date in fiscal year 2021. It’s worth noting that $1.1 million was transferred from the Hotel Motel fund to cover the current year principal and interest debt payments. Total net position of the Solid Waste Fund at the end of the current year was $0.6 million, all of which was unrestricted. The Solid Waste Fund does not have any investment in capital assets as all assets are handled by a private contractor. The fund balance did not change significantly from the previous year.
Budgetary Highlights The City presents budgetary information as allowed by GASB Statement No. 41. Budgets are based on nine functional areas as required by state statute, not by fund or fund type. During the year ended June 30, 2020, no disbursements exceeded the budget. During the fiscal year ended June 30, 2020, there were three budget amendments, dated October 7, 2019, February 3, 2020, and May 18, 2020. Amendments are a routine occurrence for the City and are primarily due to changes in the timing of capital improvement projects and related grant and other receipts for these projects. Because the City’s June 30 fiscal year end occurs during the “construction season” in Iowa, it is difficult to judge in advance, that portion of construction projects which will be in process on June 30. The budget is also routinely amended each year to adjust projected fiscal year beginning balances to equal actual audited fund balances. Other adjustments addressed through amendment during the fiscal year included the passage of Local Option Sales Tax in Polk County resulting in additional revenue and a subsequent decision to hire 12 public safety employees (7 police officers and 5 firefighters) with this revenue, the effects of COVID-19 on certain revenues, an increase in project scope and the underlying construction cost of the MidAmerican Energy Rec Plex, the addition of 5 staff in the City’s Information Technology Department following recommendations for improvement following a cyber-attack on the City’s network, and many other smaller considerations. Capital Assets and Debt Administration Capital assets. The City’s investment in capital assets for its governmental and business-type activities as of June 30, 2020, amounts to $794 million (net of accumulated depreciation). This investment in capital assets includes land, intangibles, fiber network, construction in progress, buildings, improvements other than buildings (e.g. recreation trails, athletic fields, and parking lots), vehicles and equipment, and infrastructure (e.g. roads, bridges, sanitary and storm sewer lines). The total increase in the City of West Des Moines’ capital assets for the current fiscal year was 12.7%, and is largely due to infrastructure completed as part of several arterial street widening projects (most notably new sections of Veterans Parkway and Grand Prairie Parkway), and to a lesser degree, due to improvements to city building facilities (most notably City Hall renovation and continuing
City of West Des Moines, Iowa Management’s Discussion and Analysis For Fiscal Year Ended June 30, 2020
28
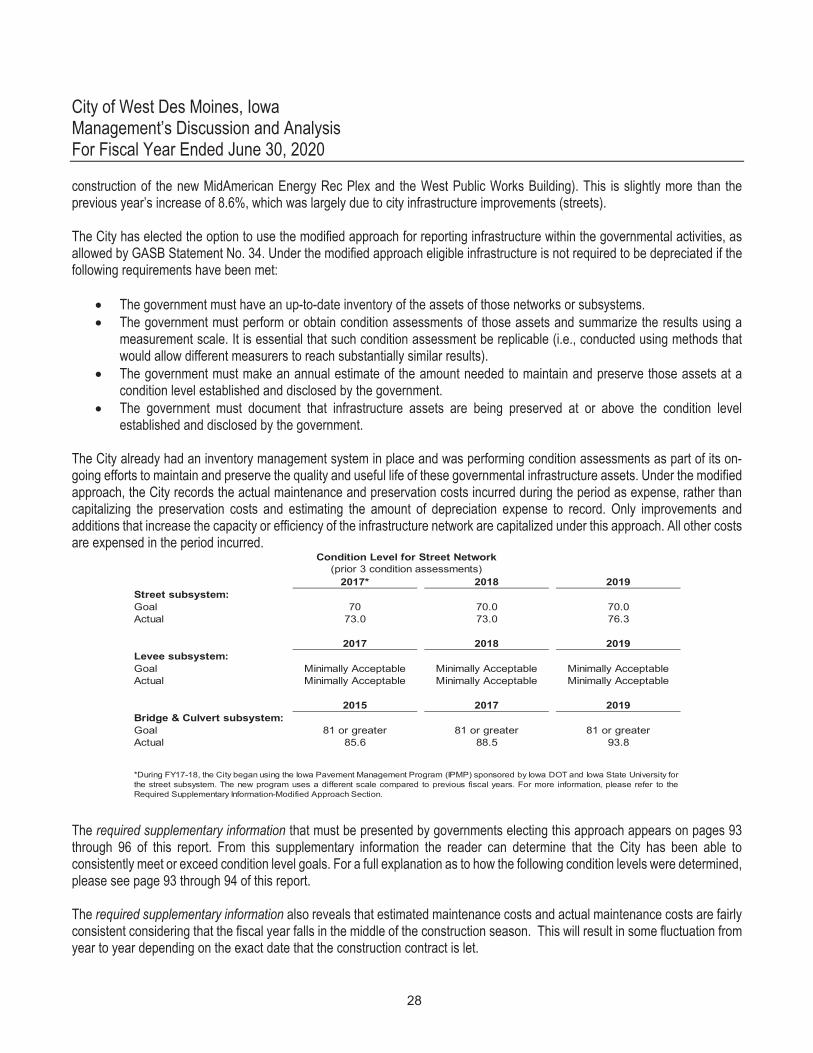
construction of the new MidAmerican Energy Rec Plex and the West Public Works Building). This is slightly more than the previous year’s increase of 8.6%, which was largely due to city infrastructure improvements (streets). The City has elected the option to use the modified approach for reporting infrastructure within the governmental activities, as allowed by GASB Statement No. 34. Under the modified approach eligible infrastructure is not required to be depreciated if the following requirements have been met:
The government must have an up-to-date inventory of the assets of those networks or subsystems. The government must perform or obtain condition assessments of those assets and summarize the results using a
measurement scale. It is essential that such condition assessment be replicable (i.e., conducted using methods that would allow different measurers to reach substantially similar results).
The government must make an annual estimate of the amount needed to maintain and preserve those assets at a condition level established and disclosed by the government.
The government must document that infrastructure assets are being preserved at or above the condition level established and disclosed by the government.
The City already had an inventory management system in place and was performing condition assessments as part of its on-going efforts to maintain and preserve the quality and useful life of these governmental infrastructure assets. Under the modified approach, the City records the actual maintenance and preservation costs incurred during the period as expense, rather than capitalizing the preservation costs and estimating the amount of depreciation expense to record. Only improvements and additions that increase the capacity or efficiency of the infrastructure network are capitalized under this approach. All other costs are expensed in the period incurred.
2017* 2018 2019Street subsystem:Goal 70 70.0 70.0Actual 73.0 73.0 76.3
2017 2018 2019Levee subsystem:Goal Minimally Acceptable Minimally Acceptable Minimally AcceptableActual Minimally Acceptable Minimally Acceptable Minimally Acceptable
2015 2017 2019Bridge & Culvert subsystem:Goal 81 or greater 81 or greater 81 or greaterActual 85.6 88.5 93.8
Condition Level for Street Network(prior 3 condition assessments)
*During FY17-18, the City began using the Iowa Pavement Management Program (IPMP) sponsored by Iowa DOT and Iowa State University forthe street subsystem. The new program uses a different scale compared to previous fiscal years. For more information, please refer to theRequired Supplementary Information-Modified Approach Section.
The required supplementary information that must be presented by governments electing this approach appears on pages 93 through 96 of this report. From this supplementary information the reader can determine that the City has been able to consistently meet or exceed condition level goals. For a full explanation as to how the following condition levels were determined, please see page 93 through 94 of this report. The required supplementary information also reveals that estimated maintenance costs and actual maintenance costs are fairly consistent considering that the fiscal year falls in the middle of the construction season. This will result in some fluctuation from year to year depending on the exact date that the construction contract is let.
City of West Des Moines, Iowa Management’s Discussion and Analysis For Fiscal Year Ended June 30, 2020
29
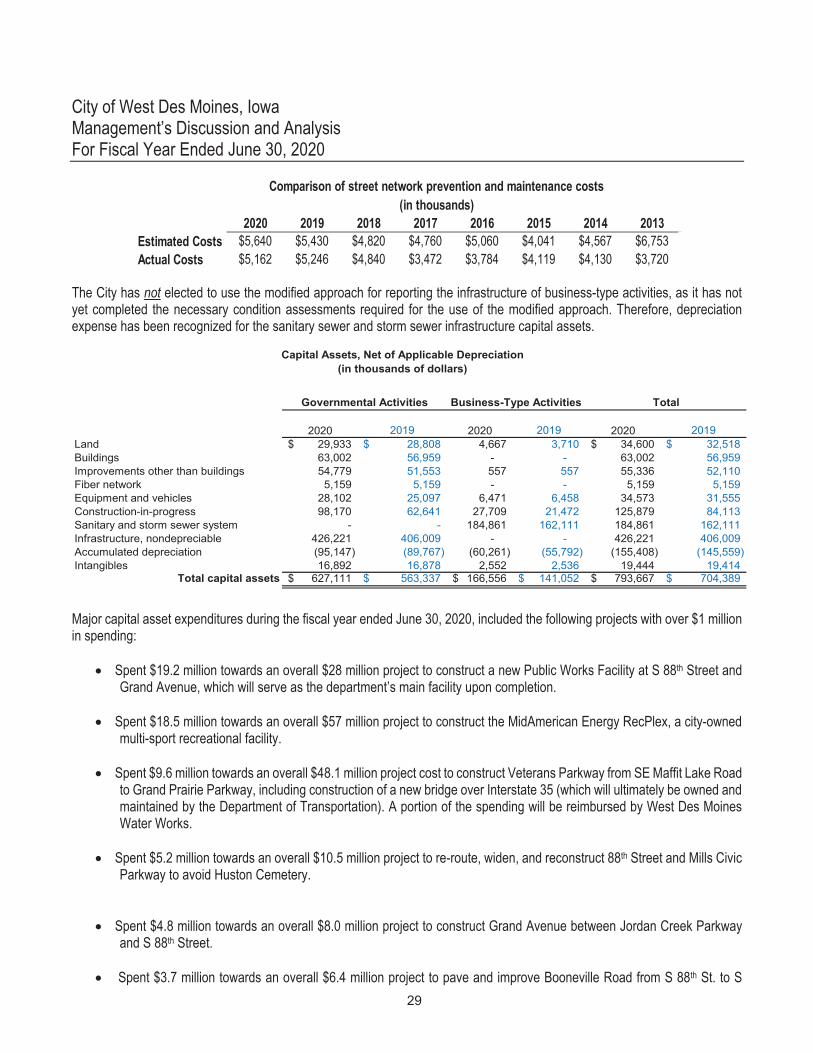
2020 2019 2018 2017 2016 2015 2014 2013Estimated Costs $5,640 $5,430 $4,820 $4,760 $5,060 $4,041 $4,567 $6,753Actual Costs $5,162 $5,246 $4,840 $3,472 $3,784 $4,119 $4,130 $3,720
Comparison of street network prevention and maintenance costs(in thousands)
The City has not elected to use the modified approach for reporting the infrastructure of business-type activities, as it has not yet completed the necessary condition assessments required for the use of the modified approach. Therefore, depreciation expense has been recognized for the sanitary sewer and storm sewer infrastructure capital assets.
Capital Assets, Net of Applicable Depreciation(in thousands of dollars)
2020 2019 2020 2019 2020 2019Land 29,933$ 28,808$ 4,667 3,710 34,600$ 32,518$ Buildings 63,002 56,959 - - 63,002 56,959 Improvements other than buildings 54,779 51,553 557 557 55,336 52,110 Fiber network 5,159 5,159 - - 5,159 5,159 Equipment and vehicles 28,102 25,097 6,471 6,458 34,573 31,555 Construction-in-progress 98,170 62,641 27,709 21,472 125,879 84,113 Sanitary and storm sewer system - - 184,861 162,111 184,861 162,111 Infrastructure, nondepreciable 426,221 406,009 - - 426,221 406,009 Accumulated depreciation (95,147) (89,767) (60,261) (55,792) (155,408) (145,559) Intangibles 16,892 16,878 2,552 2,536 19,444 19,414
Total capital assets 627,111$ 563,337$ 166,556$ 141,052$ 793,667$ 704,389$
Governmental Activities Business-Type Activities Total
Major capital asset expenditures during the fiscal year ended June 30, 2020, included the following projects with over $1 million in spending:
Spent $19.2 million towards an overall $28 million project to construct a new Public Works Facility at S 88th Street and Grand Avenue, which will serve as the department’s main facility upon completion.
Spent $18.5 million towards an overall $57 million project to construct the MidAmerican Energy RecPlex, a city-owned
multi-sport recreational facility.
Spent $9.6 million towards an overall $48.1 million project cost to construct Veterans Parkway from SE Maffit Lake Road to Grand Prairie Parkway, including construction of a new bridge over Interstate 35 (which will ultimately be owned and maintained by the Department of Transportation). A portion of the spending will be reimbursed by West Des Moines Water Works.
Spent $5.2 million towards an overall $10.5 million project to re-route, widen, and reconstruct 88th Street and Mills Civic
Parkway to avoid Huston Cemetery.
Spent $4.8 million towards an overall $8.0 million project to construct Grand Avenue between Jordan Creek Parkway and S 88th Street.
Spent $3.7 million towards an overall $6.4 million project to pave and improve Booneville Road from S 88th St. to S
City of West Des Moines, Iowa Management’s Discussion and Analysis For Fiscal Year Ended June 30, 2020
30
100th St., including reconstruction of the existing bridge over Sugar Creek.
Spent $2.5 million towards an overall $5.5 million project to renovate West Des Moines City Hall, including replacement of the heating and cooling systems, installation of new carpet, and several security-related upgrades.
Spent $2.1 million towards an overall $2.5 million project to construct a new Boathouse and Watercraft Rental Facility at Raccoon River Park.
Spent $2.0 million of an estimated $4.4 million project to construct fiber conduit routes to support Microsoft’s data center
operation. The entire cost of the project will be reimbursed by Microsoft.
Spent $1.7 million towards an overall $2.5 million project to pave and widen SW 60th Street in Madison County to support the Microsoft Osmium Data Center.
Spent $1.6 million towards an overall $20.2 million project to construct South Grand Prairie Parkway from Raccoon
River Drive to Veterans Parkway, including a bridge spanning the Raccoon River. A portion of the spending will ultimately be reimbursed by West Des Moines Water Works.
Spent $1.6 million towards an overall $15.7 million project to widen and improve Ashworth Road from Jordan Creek Parkway to the City’s western boundary, including construction of a new bridge over Interstate 80 which will ultimately be owned and maintained by the Department of Transportation.
Spent $1.3 million to construct S 85th Street from Cascade Avenue to Mills Civic Parkway to support a new headquarters building for Sammons Financial.
Spent $1.3 million towards an overall $2.1 million project to renovate the interior of the West Des Moines Public Library,
including updating restrooms, carpeting, furniture, and office areas.
Spent $1.2 million of Sewer Funds to extend the Raccoon River Basin Segment 5 Sewer in order to facilitate future development.
Spent $1.1 million to widen and improve EP True Parkway from Jordan Creek Parkway to 81st Street, including
installation of a new pedestrian crossing signal.
Additional information concerning the City’s capital assets can be found in Note 1 and Note 3 of the Notes to Basic Financial Statements on pages 49 through 56 and 60 through 61, respectively.
Long-term debt. At the close of the fiscal year ended June 30, 2020, the City had total bonded debt outstanding of $217.1 million (including unamortized net premium), all backed by the full faith and credit of the government. During the fiscal year the City’s total bonded debt increased as $30.5 million of new debt was issued during the current fiscal year versus $24.9 million of retirements. The Iowa State Constitution limits the amount of general obligation debt which may be issued by a city to 5% of the actual assessed value of all its taxable property. The current debt limitation for the City is approximately $414.4 million. With outstanding general obligation principal debt of $208.1 million (general obligation bonds plus other debt subject to the limitation), the City had utilized 50% of the debit limit as of June 30, 2020.
City of West Des Moines, Iowa Management’s Discussion and Analysis For Fiscal Year Ended June 30, 2020
31
Additional information on the City’s long-term debt can be found in Note 4 on pages 62 through 65 of this report. Economic Factors, Budgets, and Rates for the Upcoming Fiscal Year As one of the faster growing cities in the State of Iowa, West Des Moines expects growth both in population and in overall property valuations to continue over the next several years. A distinct advantage of West Des Moines is its unusual position as a desirable suburban city for residential growth while at the same time maintaining a strong retail, office, and commercial presence. The City’s overall economic balance is 60%-65% residential valuation (including a significant presence of multi-family dwellings) and 35-40% commercial and industrial valuation. Legislative action originally passed in May 2013 continues to affect taxable valuations for commercial and multi-family residential property. This legislation included a 10% cut to commercial tax rates over a period beginning July 1, 2014. The lost commercial revenue is being funded by the State of Iowa but is only guaranteed to match the lost revenues through the end of fiscal 2020. Thus, the City continues to engage in very conservative revenue budgeting practices. Historically, the City’s tax base has grown between 2% and 9% annually. The City’s tax base (taxable valuation) increased 5.8% annually from 2006-2010 but slowed for several years (2011-2015) during the economic recession. The past four years have seen an economic recovery and again there has been impressive, steady growth. The City’s tax base grew 4.2% from 2016 to 2017, another 4.5% from 2017 to 2018, and finally 8.7% from 2018 to 2019 to reach a total assessed valuation at January 1, 2019, of $9.01 billion. Valuations as of January 1, 2020, were not available at the time of this report. The budget for fiscal year ending June 30, 2020, decreased the City’s levy rate from $11.79 to $10.99 per $1,000 of taxable valuation. This happened after a similar decrease for fiscal 2019 from $12.00 to $11.79. The decreases were largely made possible by voter-approved local option sales taxes, first for the Dallas County portion of the City in 2017 and then for the Polk County portion in 2019. The voters directed that at least 50% of the revenue will directly be pledged for property tax reduction, with the balance available for specific initiatives including quality of life amenities and public safety. The Polk County local sales tax generated approximately $10.5 million in revenue to the City in its first year of collections (FY 2020), and the Dallas County portion totaled $2.7 million over the same period. Future year tax growth assumptions remain conservative, reflecting between 1% and 3% annual growth. While West Des Moines continues to experience moderate growth in its tax base, valuations are determined at the county level. Recent valuation rollbacks and appeals have resulted a need to project future revenue and expenditure levels to ensure adequate funding for services will be available in future budget cycles for operations. The City has essentially budgeted for breakeven results, without the use of this fund balance and without a property tax rate increase (prior to reductions due to local option sales tax collections), for the fiscal year ending June 30, 2021. As measured by current actual property valuation and recent population data, valuation compares very strongly to comparable cities, at approximately $133,000 per capita. The City’s taxable valuation per capita of over $90,000 remains the highest of Iowa’s top ten most populated cities, which allows West Des Moines to maintain the third lowest tax rate of those same ten cities. See additional information and measures regarding the City in the Statistical Section of this report. While the City has certainly been affected in nearly all areas by COVID-19, an analysis of revenue trends since the onset of the pandemic shows that over 99% of budgeted revenue was collected during FY 2020. In addition, the early months of FY 2021 show encouraging results as well. While some of the City’s specific revenue centers showed sharp decreases (most notably Hotel/Motel taxes, recreational facility rentals, and aquatic center admissions), other larger revenue centers such as property taxes, building permits, and even sales taxes remained mostly steady. The effects of COVID-19 has also caused an increase in certain expenditures, but fortunately the city has qualified for Federal CARES act funding and other grants, and those opportunities coupled together with diligent planning, should provide the stability needed to stay within budgetary guidelines.
City of West Des Moines, Iowa Management’s Discussion and Analysis For Fiscal Year Ended June 30, 2020
32
Requests for Information This financial report is designed to provide a general overview of the City of West Des Moines’ finances for all those with an interest in the City’s finances. Questions concerning any of the information provided in this report or requests for additional information should be addressed to the Finance Department at 4200 Mills Civic Parkway, Suite 2B or by mail to the City of West Des Moines, Finance Department, Post Office Box 65320, West Des Moines, Iowa.
33
BASIC FINANCIAL STATEMENTS
See Notes to Basic Financial Statements. 34
Governmental Activities
Business-type Activities Total
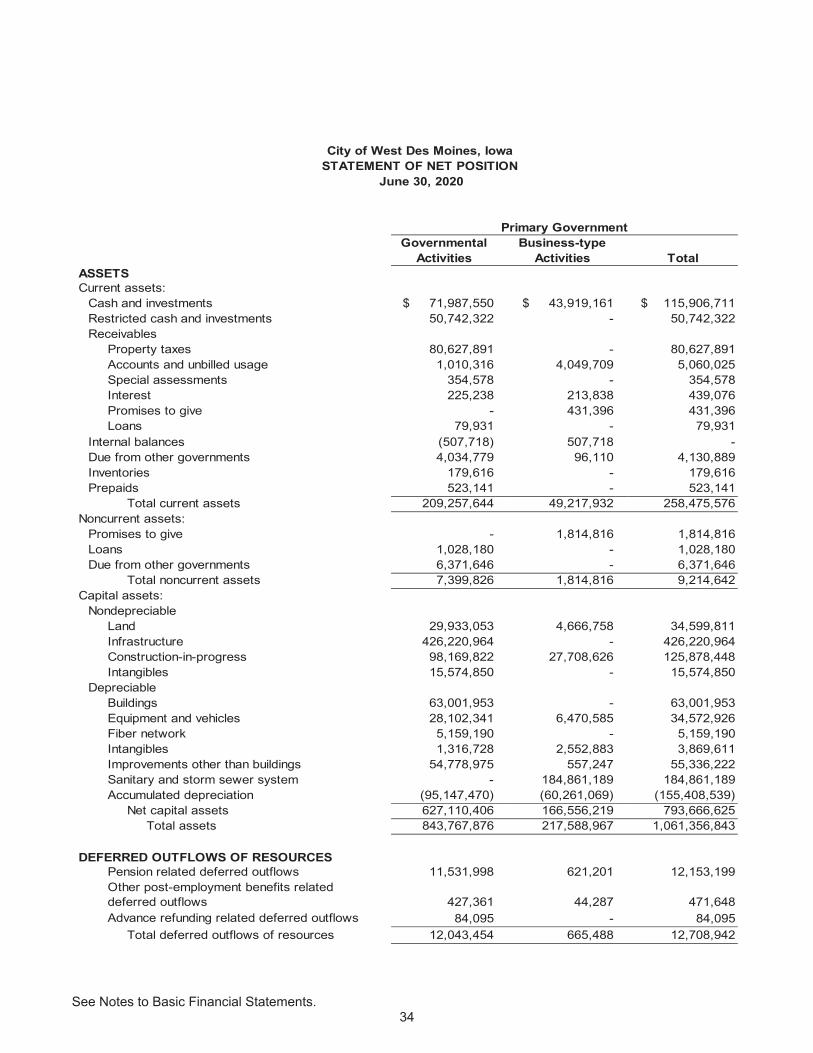
ASSETSCurrent assets:
Cash and investments $ 71,987,550 $ 43,919,161 $ 115,906,711 Restricted cash and investments 50,742,322 - 50,742,322 Receivables
Property taxes 80,627,891 - 80,627,891 Accounts and unbilled usage 1,010,316 4,049,709 5,060,025 Special assessments 354,578 - 354,578 Interest 225,238 213,838 439,076 Promises to give - 431,396 431,396 Loans 79,931 - 79,931
Internal balances (507,718) 507,718 - Due from other governments 4,034,779 96,110 4,130,889 Inventories 179,616 - 179,616 Prepaids 523,141 - 523,141
Total current assets 209,257,644 49,217,932 258,475,576 Noncurrent assets:
Promises to give - 1,814,816 1,814,816 Loans 1,028,180 - 1,028,180 Due from other governments 6,371,646 - 6,371,646
Total noncurrent assets 7,399,826 1,814,816 9,214,642 Capital assets:
NondepreciableLand 29,933,053 4,666,758 34,599,811 Infrastructure 426,220,964 - 426,220,964 Construction-in-progress 98,169,822 27,708,626 125,878,448 Intangibles 15,574,850 - 15,574,850
DepreciableBuildings 63,001,953 - 63,001,953 Equipment and vehicles 28,102,341 6,470,585 34,572,926 Fiber network 5,159,190 - 5,159,190 Intangibles 1,316,728 2,552,883 3,869,611 Improvements other than buildings 54,778,975 557,247 55,336,222 Sanitary and storm sewer system - 184,861,189 184,861,189 Accumulated depreciation (95,147,470) (60,261,069) (155,408,539)
Net capital assets 627,110,406 166,556,219 793,666,625 Total assets 843,767,876 217,588,967 1,061,356,843
DEFERRED OUTFLOWS OF RESOURCESPension related deferred outflows 11,531,998 621,201 12,153,199 Other post-employment benefits related deferred outflows 427,361 44,287 471,648 Advance refunding related deferred outflows 84,095 - 84,095
Total deferred outflows of resources 12,043,454 665,488 12,708,942
City of West Des Moines, IowaSTATEMENT OF NET POSITION
June 30, 2020
Primary Government
See Notes to Basic Financial Statements. 35
Governmental Activities
Business-type Activities Total
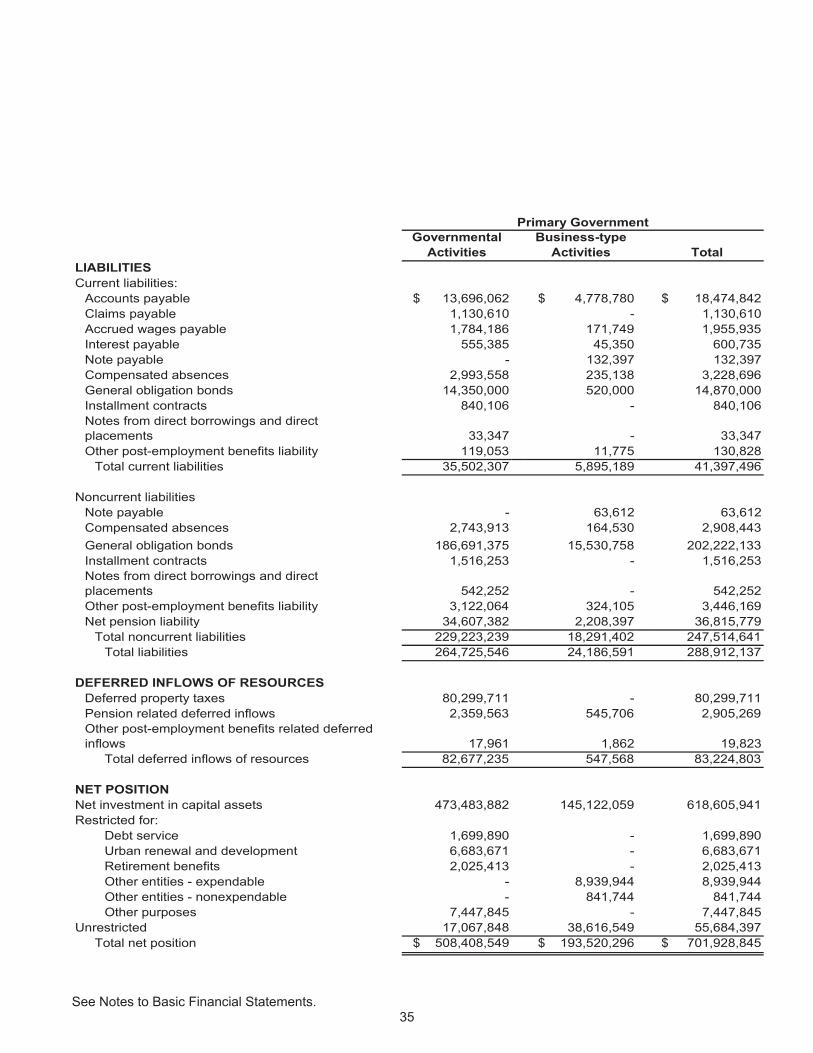
LIABILITIESCurrent liabilities:
Accounts payable $ 13,696,062 $ 4,778,780 $ 18,474,842 Claims payable 1,130,610 - 1,130,610 Accrued wages payable 1,784,186 171,749 1,955,935 Interest payable 555,385 45,350 600,735 Note payable - 132,397 132,397 Compensated absences 2,993,558 235,138 3,228,696 General obligation bonds 14,350,000 520,000 14,870,000 Installment contracts 840,106 - 840,106 Notes from direct borrowings and direct placements 33,347 - 33,347 Other post-employment benefits liability 119,053 11,775 130,828
Total current liabilities 35,502,307 5,895,189 41,397,496
Noncurrent liabilitiesNote payable - 63,612 63,612 Compensated absences 2,743,913 164,530 2,908,443 General obligation bonds 186,691,375 15,530,758 202,222,133 Installment contracts 1,516,253 - 1,516,253 Notes from direct borrowings and direct placements 542,252 - 542,252 Other post-employment benefits liability 3,122,064 324,105 3,446,169 Net pension liability 34,607,382 2,208,397 36,815,779
Total noncurrent liabilities 229,223,239 18,291,402 247,514,641 Total liabilities 264,725,546 24,186,591 288,912,137
DEFERRED INFLOWS OF RESOURCESDeferred property taxes 80,299,711 - 80,299,711 Pension related deferred inflows 2,359,563 545,706 2,905,269 Other post-employment benefits related deferred inflows 17,961 1,862 19,823
Total deferred inflows of resources 82,677,235 547,568 83,224,803
NET POSITIONNet investment in capital assets 473,483,882 145,122,059 618,605,941 Restricted for:
Debt service 1,699,890 - 1,699,890 Urban renewal and development 6,683,671 - 6,683,671 Retirement benefits 2,025,413 - 2,025,413 Other entities - expendable - 8,939,944 8,939,944 Other entities - nonexpendable - 841,744 841,744 Other purposes 7,447,845 - 7,447,845
Unrestricted 17,067,848 38,616,549 55,684,397 Total net position $ 508,408,549 $ 193,520,296 $ 701,928,845
Primary Government
See Notes to Basic Financial Statements. 36
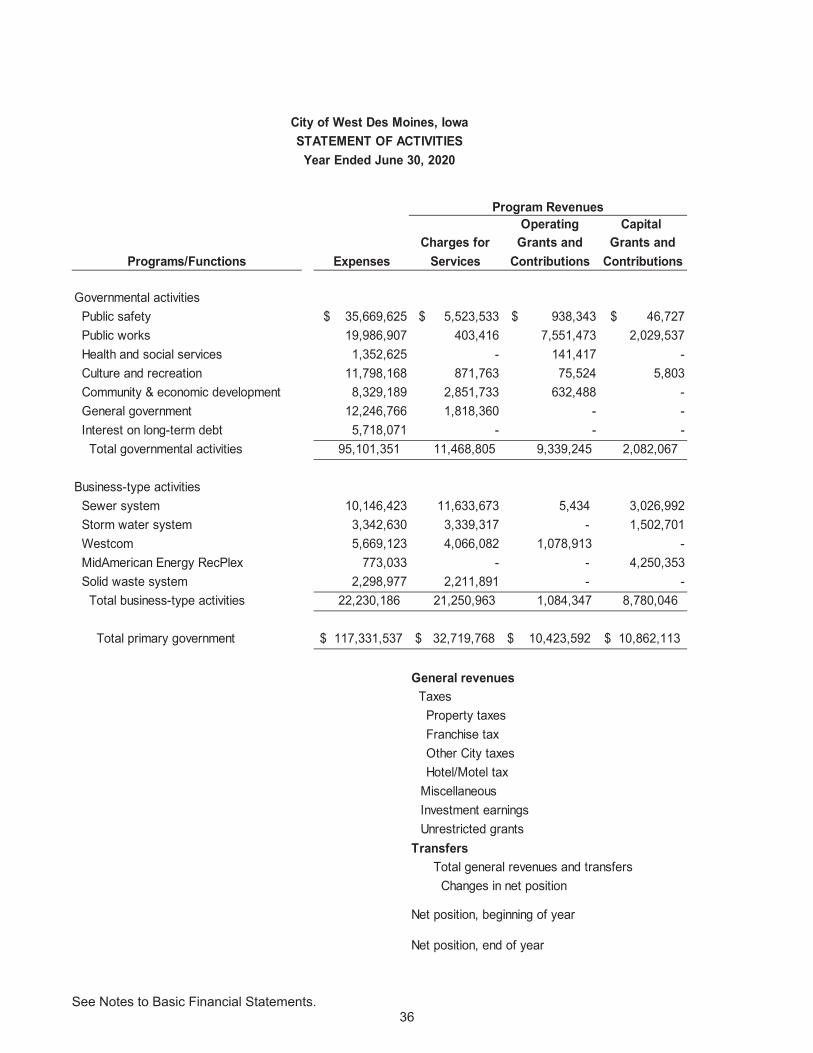
Operating Capital Charges for Grants and Grants and
Programs/Functions Expenses Services Contributions Contributions
Governmental activities Public safety $ 35,669,625 $ 5,523,533 $ 938,343 $ 46,727 Public works 19,986,907 403,416 7,551,473 2,029,537 Health and social services 1,352,625 - 141,417 - Culture and recreation 11,798,168 871,763 75,524 5,803 Community & economic development 8,329,189 2,851,733 632,488 - General government 12,246,766 1,818,360 - - Interest on long-term debt 5,718,071 - - - Total governmental activities 95,101,351 11,468,805 9,339,245 2,082,067
Business-type activities Sewer system 10,146,423 11,633,673 5,434 3,026,992 Storm water system 3,342,630 3,339,317 - 1,502,701 Westcom 5,669,123 4,066,082 1,078,913 - MidAmerican Energy RecPlex 773,033 - - 4,250,353 Solid waste system 2,298,977 2,211,891 - - Total business-type activities 22,230,186 21,250,963 1,084,347 8,780,046
Total primary government $ 117,331,537 $ 32,719,768 $ 10,423,592 $ 10,862,113
Unrestricted grants
Net position, beginning of year
Changes in net position
Property taxes
Net position, end of year
Franchise tax Other City taxes Hotel/Motel tax
MiscellaneousInvestment earnings
Transfers
Year Ended June 30, 2020STATEMENT OF ACTIVITIES
City of West Des Moines, Iowa
Total general revenues and transfers
Program Revenues
General revenues Taxes
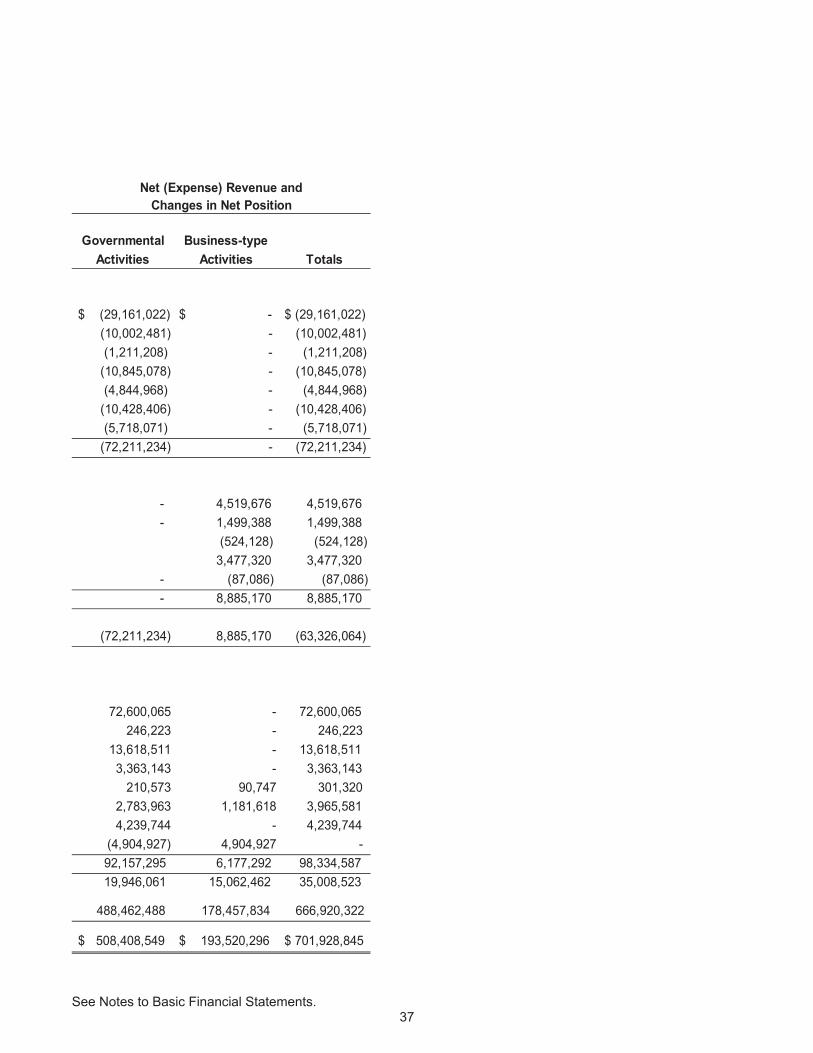
See Notes to Basic Financial Statements. 37
Governmental Business-typeActivities Activities Totals
$ (29,161,022) $ - $ (29,161,022) (10,002,481) - (10,002,481) (1,211,208) - (1,211,208) (10,845,078) - (10,845,078) (4,844,968) - (4,844,968) (10,428,406) - (10,428,406) (5,718,071) - (5,718,071) (72,211,234) - (72,211,234)
- 4,519,676 4,519,676 - 1,499,388 1,499,388
(524,128) (524,128) 3,477,320 3,477,320
- (87,086) (87,086) - 8,885,170 8,885,170
(72,211,234) 8,885,170 (63,326,064)
72,600,065 - 72,600,065 246,223 - 246,223 13,618,511 - 13,618,511 3,363,143 - 3,363,143 210,573 90,747 301,320 2,783,963 1,181,618 3,965,581 4,239,744 - 4,239,744 (4,904,927) 4,904,927 - 92,157,295 6,177,292 98,334,587 19,946,061 15,062,462 35,008,523
488,462,488 178,457,834 666,920,322
$ 508,408,549 $ 193,520,296 $ 701,928,845
Net (Expense) Revenue andChanges in Net Position
See Notes to Basic Financial Statements. 38
GeneralRoad Use
Tax
Tax Increment Financing Debt Service
Capital Projects
Local Option Sales Tax
Total Nonmajor
Governmental Funds
Total Governmental
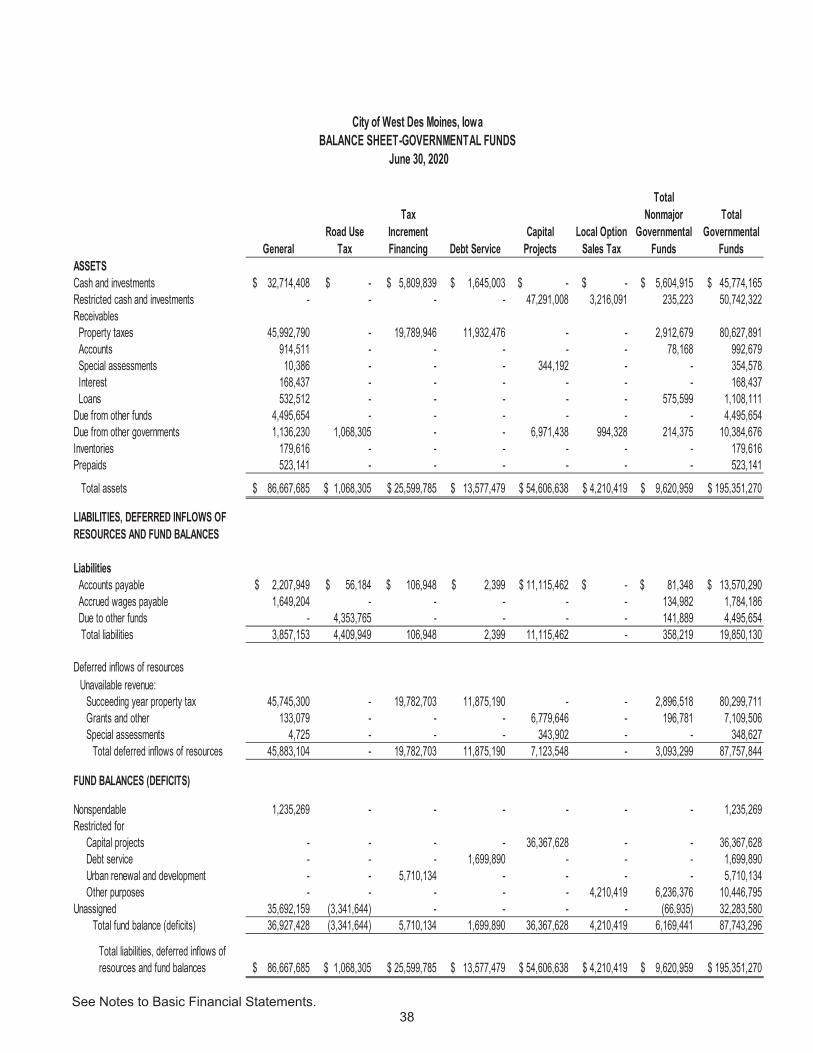
FundsASSETSCash and investments $ 32,714,408 $ - $ 5,809,839 $ 1,645,003 $ - $ - $ 5,604,915 $ 45,774,165 Restricted cash and investments - - - - 47,291,008 3,216,091 235,223 50,742,322 Receivables Property taxes 45,992,790 - 19,789,946 11,932,476 - - 2,912,679 80,627,891 Accounts 914,511 - - - - - 78,168 992,679 Special assessments 10,386 - - - 344,192 - - 354,578 Interest 168,437 - - - - - - 168,437 Loans 532,512 - - - - - 575,599 1,108,111 Due from other funds 4,495,654 - - - - - - 4,495,654 Due from other governments 1,136,230 1,068,305 - - 6,971,438 994,328 214,375 10,384,676 Inventories 179,616 - - - - - - 179,616 Prepaids 523,141 - - - - - - 523,141
Total assets $ 86,667,685 $ 1,068,305 $ 25,599,785 $ 13,577,479 $ 54,606,638 $ 4,210,419 $ 9,620,959 $ 195,351,270
LIABILITIES, DEFERRED INFLOWS OF RESOURCES AND FUND BALANCES
Liabilities Accounts payable $ 2,207,949 $ 56,184 $ 106,948 $ 2,399 $ 11,115,462 $ - $ 81,348 $ 13,570,290 Accrued wages payable 1,649,204 - - - - - 134,982 1,784,186 Due to other funds - 4,353,765 - - - - 141,889 4,495,654 Total liabilities 3,857,153 4,409,949 106,948 2,399 11,115,462 - 358,219 19,850,130
Deferred inflows of resourcesUnavailable revenue:
Succeeding year property tax 45,745,300 - 19,782,703 11,875,190 - - 2,896,518 80,299,711 Grants and other 133,079 - - - 6,779,646 - 196,781 7,109,506 Special assessments 4,725 - - - 343,902 - - 348,627
Total deferred inflows of resources 45,883,104 - 19,782,703 11,875,190 7,123,548 - 3,093,299 87,757,844
FUND BALANCES (DEFICITS)
Nonspendable 1,235,269 - - - - - - 1,235,269 Restricted for
Capital projects - - - - 36,367,628 - - 36,367,628 Debt service - - - 1,699,890 - - - 1,699,890 Urban renewal and development - - 5,710,134 - - - - 5,710,134 Other purposes - - - - - 4,210,419 6,236,376 10,446,795
Unassigned 35,692,159 (3,341,644) - - - - (66,935) 32,283,580 Total fund balance (deficits) 36,927,428 (3,341,644) 5,710,134 1,699,890 36,367,628 4,210,419 6,169,441 87,743,296
Total liabilities, deferred inflows of resources and fund balances $ 86,667,685 $ 1,068,305 $ 25,599,785 $ 13,577,479 $ 54,606,638 $ 4,210,419 $ 9,620,959 $ 195,351,270
City of West Des Moines, IowaBALANCE SHEET-GOVERNMENTAL FUNDS
June 30, 2020
See Notes to Basic Financial Statements. 39
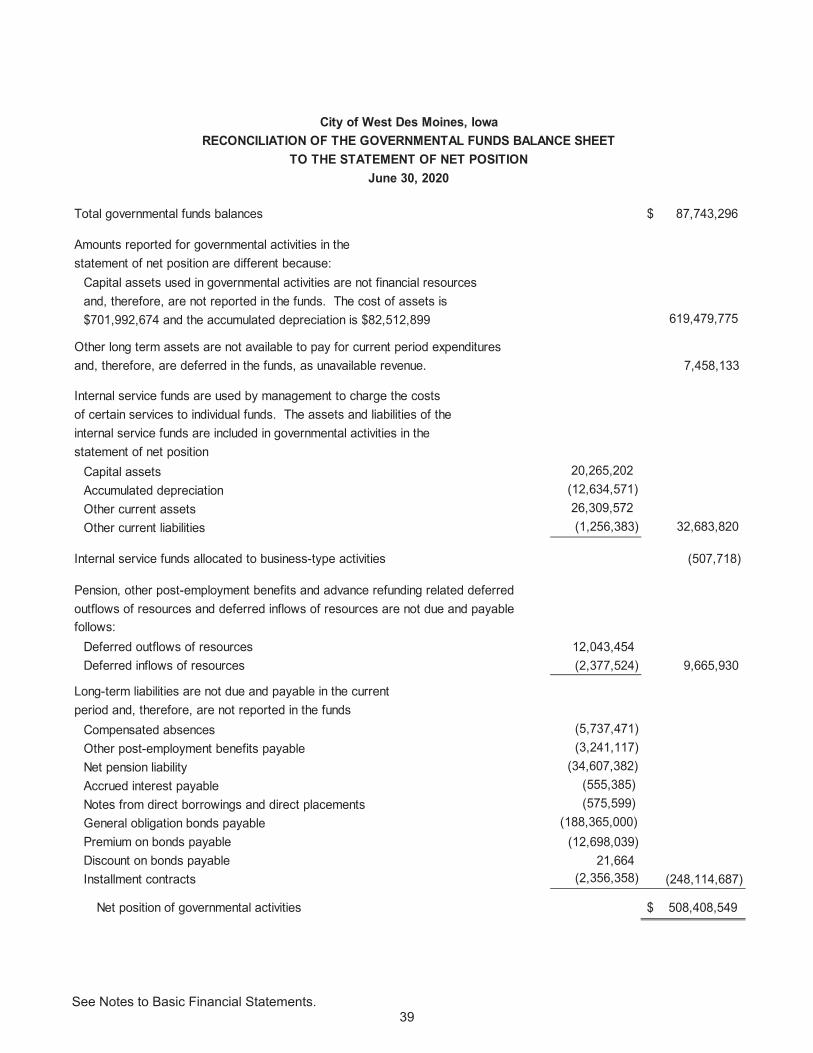
Total governmental funds balances $ 87,743,296
Amounts reported for governmental activities in the statement of net position are different because:
Capital assets used in governmental activities are not financial resourcesand, therefore, are not reported in the funds. The cost of assets is$701,992,674 and the accumulated depreciation is $82,512,899 619,479,775
Other long term assets are not available to pay for current period expendituresand, therefore, are deferred in the funds, as unavailable revenue. 7,458,133
Internal service funds are used by management to charge the costsof certain services to individual funds. The assets and liabilities of theinternal service funds are included in governmental activities in thestatement of net position
Capital assets 20,265,202 Accumulated depreciation (12,634,571)Other current assets 26,309,572 Other current liabilities (1,256,383) 32,683,820
Internal service funds allocated to business-type activities (507,718)
Pension, other post-employment benefits and advance refunding related deferredoutflows of resources and deferred inflows of resources are not due and payablefollows:
Deferred outflows of resources 12,043,454 Deferred inflows of resources (2,377,524) 9,665,930
Long-term liabilities are not due and payable in the currentperiod and, therefore, are not reported in the funds
Compensated absences (5,737,471)Other post-employment benefits payable (3,241,117)Net pension liability (34,607,382)Accrued interest payable (555,385)Notes from direct borrowings and direct placements (575,599)General obligation bonds payable (188,365,000)Premium on bonds payable (12,698,039) Discount on bonds payable 21,664 Installment contracts (2,356,358) (248,114,687)
Net position of governmental activities $ 508,408,549
City of West Des Moines, IowaRECONCILIATION OF THE GOVERNMENTAL FUNDS BALANCE SHEET
TO THE STATEMENT OF NET POSITIONJune 30, 2020
See Notes to Basic Financial Statements. 40
General Road Use Tax
Tax Increment Financing Debt Service
Capital Projects
Local Option Sales Tax
Total Nonmajor
Governmental Funds
Total Governmental
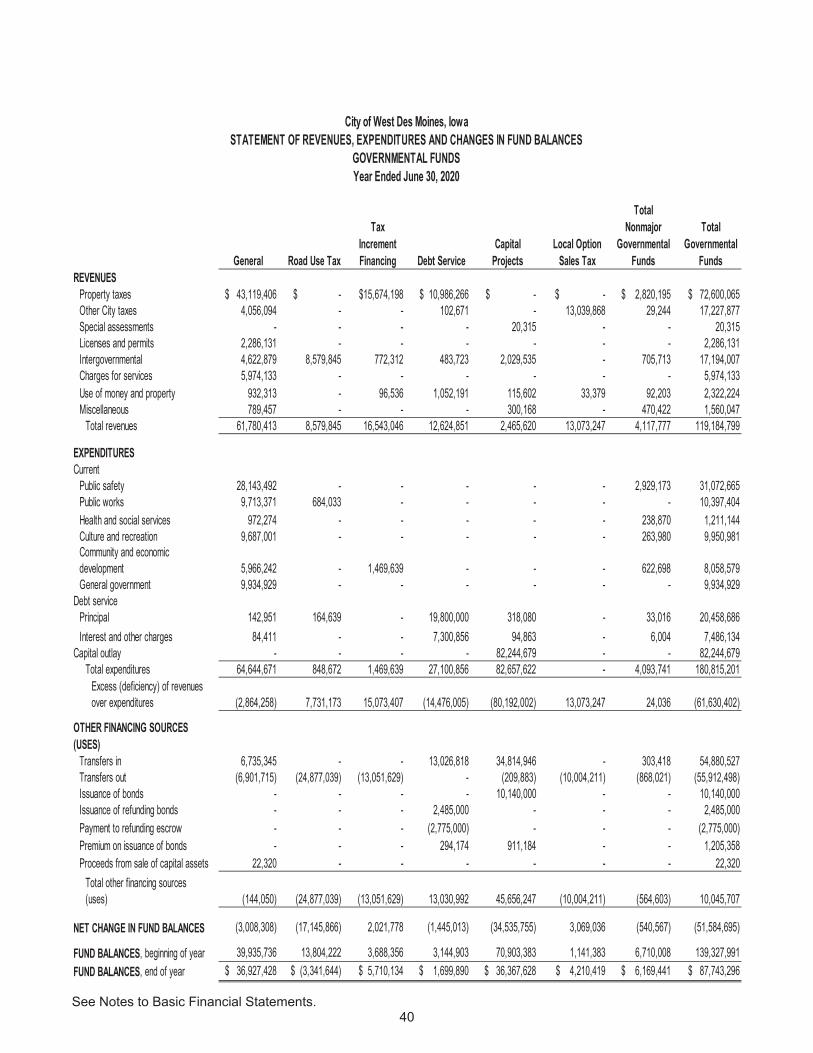
FundsREVENUES
Property taxes $ 43,119,406 $ - $15,674,198 $ 10,986,266 $ - $ - $ 2,820,195 $ 72,600,065 Other City taxes 4,056,094 - - 102,671 - 13,039,868 29,244 17,227,877 Special assessments - - - - 20,315 - - 20,315 Licenses and permits 2,286,131 - - - - - - 2,286,131 Intergovernmental 4,622,879 8,579,845 772,312 483,723 2,029,535 - 705,713 17,194,007 Charges for services 5,974,133 - - - - - - 5,974,133 Use of money and property 932,313 - 96,536 1,052,191 115,602 33,379 92,203 2,322,224 Miscellaneous 789,457 - - - 300,168 - 470,422 1,560,047
Total revenues 61,780,413 8,579,845 16,543,046 12,624,851 2,465,620 13,073,247 4,117,777 119,184,799
EXPENDITURESCurrent
Public safety 28,143,492 - - - - - 2,929,173 31,072,665 Public works 9,713,371 684,033 - - - - - 10,397,404 Health and social services 972,274 - - - - - 238,870 1,211,144 Culture and recreation 9,687,001 - - - - - 263,980 9,950,981 Community and economic development 5,966,242 - 1,469,639 - - - 622,698 8,058,579 General government 9,934,929 - - - - - - 9,934,929
Debt servicePrincipal 142,951 164,639 - 19,800,000 318,080 - 33,016 20,458,686 Interest and other charges 84,411 - - 7,300,856 94,863 - 6,004 7,486,134
Capital outlay - - - - 82,244,679 - - 82,244,679 Total expenditures 64,644,671 848,672 1,469,639 27,100,856 82,657,622 - 4,093,741 180,815,201
Excess (deficiency) of revenues over expenditures (2,864,258) 7,731,173 15,073,407 (14,476,005) (80,192,002) 13,073,247 24,036 (61,630,402)
OTHER FINANCING SOURCES (USES)
Transfers in 6,735,345 - - 13,026,818 34,814,946 - 303,418 54,880,527 Transfers out (6,901,715) (24,877,039) (13,051,629) - (209,883) (10,004,211) (868,021) (55,912,498)Issuance of bonds - - - - 10,140,000 - - 10,140,000 Issuance of refunding bonds - - - 2,485,000 - - - 2,485,000 Payment to refunding escrow - - - (2,775,000) - - - (2,775,000)Premium on issuance of bonds - - - 294,174 911,184 - - 1,205,358 Proceeds from sale of capital assets 22,320 - - - - - - 22,320
Total other financing sources (uses) (144,050) (24,877,039) (13,051,629) 13,030,992 45,656,247 (10,004,211) (564,603) 10,045,707
NET CHANGE IN FUND BALANCES (3,008,308) (17,145,866) 2,021,778 (1,445,013) (34,535,755) 3,069,036 (540,567) (51,584,695)
FUND BALANCES, beginning of year 39,935,736 13,804,222 3,688,356 3,144,903 70,903,383 1,141,383 6,710,008 139,327,991 FUND BALANCES, end of year $ 36,927,428 $ (3,341,644) $ 5,710,134 $ 1,699,890 $ 36,367,628 $ 4,210,419 $ 6,169,441 $ 87,743,296
City of West Des Moines, IowaSTATEMENT OF REVENUES, EXPENDITURES AND CHANGES IN FUND BALANCES
GOVERNMENTAL FUNDSYear Ended June 30, 2020
See Notes to Basic Financial Statements. 41
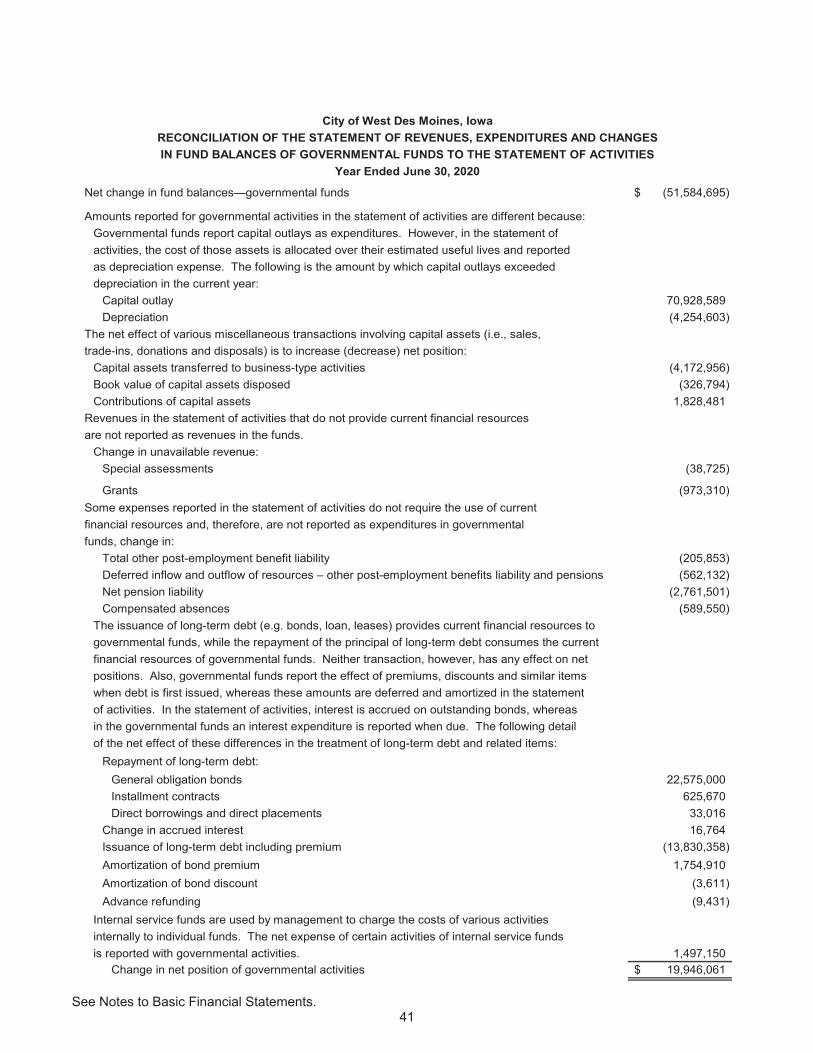
Net change in fund balances—governmental funds (51,584,695)$
Amounts reported for governmental activities in the statement of activities are different because:Governmental funds report capital outlays as expenditures. However, in the statement ofactivities, the cost of those assets is allocated over their estimated useful lives and reportedas depreciation expense. The following is the amount by which capital outlays exceededdepreciation in the current year:
Capital outlay 70,928,589 Depreciation (4,254,603)
The net effect of various miscellaneous transactions involving capital assets (i.e., sales,trade-ins, donations and disposals) is to increase (decrease) net position:
Capital assets transferred to business-type activities (4,172,956) Book value of capital assets disposed (326,794) Contributions of capital assets 1,828,481
Revenues in the statement of activities that do not provide current financial resourcesare not reported as revenues in the funds.
Change in unavailable revenue:Special assessments (38,725)
Grants (973,310) Some expenses reported in the statement of activities do not require the use of currentfinancial resources and, therefore, are not reported as expenditures in governmentalfunds, change in:
Total other post-employment benefit liability (205,853) Deferred inflow and outflow of resources – other post-employment benefits liability and pensions (562,132) Net pension liability (2,761,501) Compensated absences (589,550)
The issuance of long-term debt (e.g. bonds, loan, leases) provides current financial resources togovernmental funds, while the repayment of the principal of long-term debt consumes the currentfinancial resources of governmental funds. Neither transaction, however, has any effect on netpositions. Also, governmental funds report the effect of premiums, discounts and similar itemswhen debt is first issued, whereas these amounts are deferred and amortized in the statementof activities. In the statement of activities, interest is accrued on outstanding bonds, whereasin the governmental funds an interest expenditure is reported when due. The following detailof the net effect of these differences in the treatment of long-term debt and related items:
Repayment of long-term debt:General obligation bonds 22,575,000 Installment contracts 625,670 Direct borrowings and direct placements 33,016
Change in accrued interest 16,764 Issuance of long-term debt including premium (13,830,358) Amortization of bond premium 1,754,910 Amortization of bond discount (3,611) Advance refunding (9,431)
Internal service funds are used by management to charge the costs of various activitiesinternally to individual funds. The net expense of certain activities of internal service fundsis reported with governmental activities. 1,497,150
Change in net position of governmental activities 19,946,061$
City of West Des Moines, IowaRECONCILIATION OF THE STATEMENT OF REVENUES, EXPENDITURES AND CHANGESIN FUND BALANCES OF GOVERNMENTAL FUNDS TO THE STATEMENT OF ACTIVITIES
Year Ended June 30, 2020
See Notes to Basic Financial Statements. 42
Sewer SystemStorm Water
System Westcom
MidAmerican Energy RecPlex
Nonmajor Solid Waste
Total Enterprise
FundsInternal
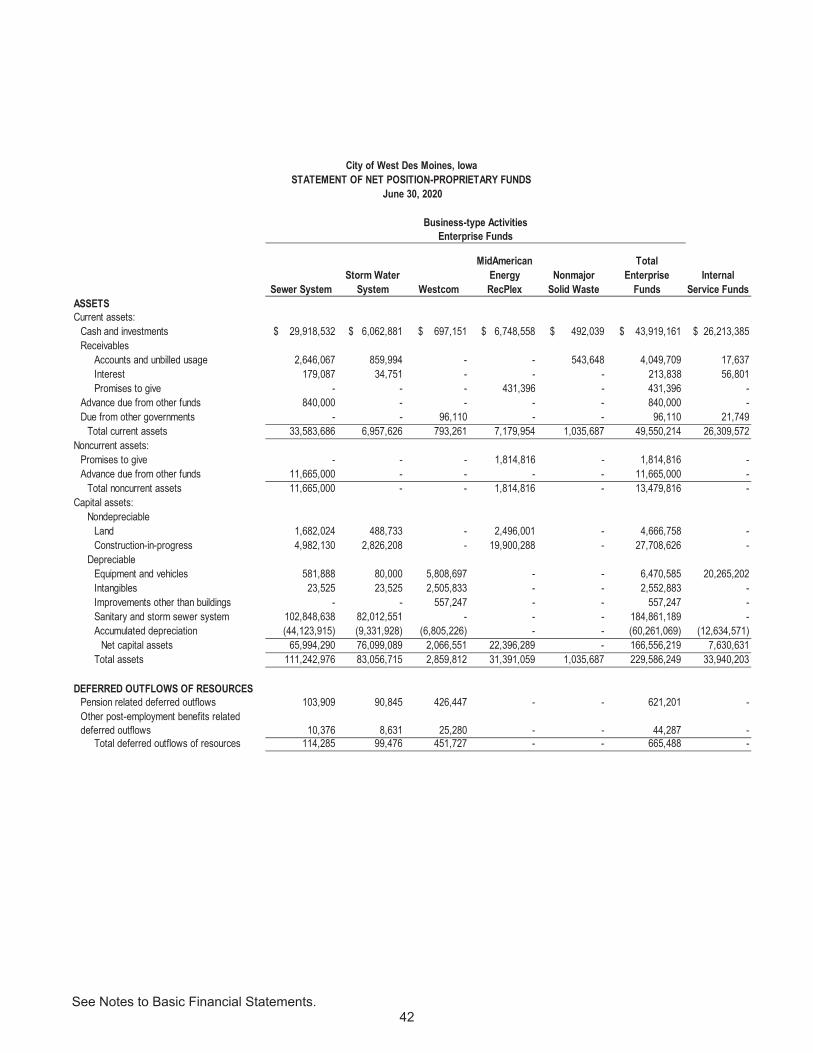
Service FundsASSETSCurrent assets:
Cash and investments $ 29,918,532 $ 6,062,881 $ 697,151 $ 6,748,558 $ 492,039 $ 43,919,161 $ 26,213,385 Receivables
Accounts and unbilled usage 2,646,067 859,994 - - 543,648 4,049,709 17,637 Interest 179,087 34,751 - - - 213,838 56,801 Promises to give - - - 431,396 - 431,396 -
Advance due from other funds 840,000 - - - - 840,000 - Due from other governments - - 96,110 - - 96,110 21,749
Total current assets 33,583,686 6,957,626 793,261 7,179,954 1,035,687 49,550,214 26,309,572 Noncurrent assets:
Promises to give - - - 1,814,816 - 1,814,816 - Advance due from other funds 11,665,000 - - - - 11,665,000 -
Total noncurrent assets 11,665,000 - - 1,814,816 - 13,479,816 - Capital assets:
NondepreciableLand 1,682,024 488,733 - 2,496,001 - 4,666,758 - Construction-in-progress 4,982,130 2,826,208 - 19,900,288 - 27,708,626 -
DepreciableEquipment and vehicles 581,888 80,000 5,808,697 - - 6,470,585 20,265,202 Intangibles 23,525 23,525 2,505,833 - - 2,552,883 - Improvements other than buildings - - 557,247 - - 557,247 - Sanitary and storm sewer system 102,848,638 82,012,551 - - - 184,861,189 - Accumulated depreciation (44,123,915) (9,331,928) (6,805,226) - - (60,261,069) (12,634,571)
Net capital assets 65,994,290 76,099,089 2,066,551 22,396,289 - 166,556,219 7,630,631 Total assets 111,242,976 83,056,715 2,859,812 31,391,059 1,035,687 229,586,249 33,940,203
DEFERRED OUTFLOWS OF RESOURCESPension related deferred outflows 103,909 90,845 426,447 - - 621,201 - Other post-employment benefits related deferred outflows 10,376 8,631 25,280 - - 44,287 -
Total deferred outflows of resources 114,285 99,476 451,727 - - 665,488 -
City of West Des Moines, IowaSTATEMENT OF NET POSITION-PROPRIETARY FUNDS
June 30, 2020
Business-type ActivitiesEnterprise Funds
See Notes to Basic Financial Statements. 43
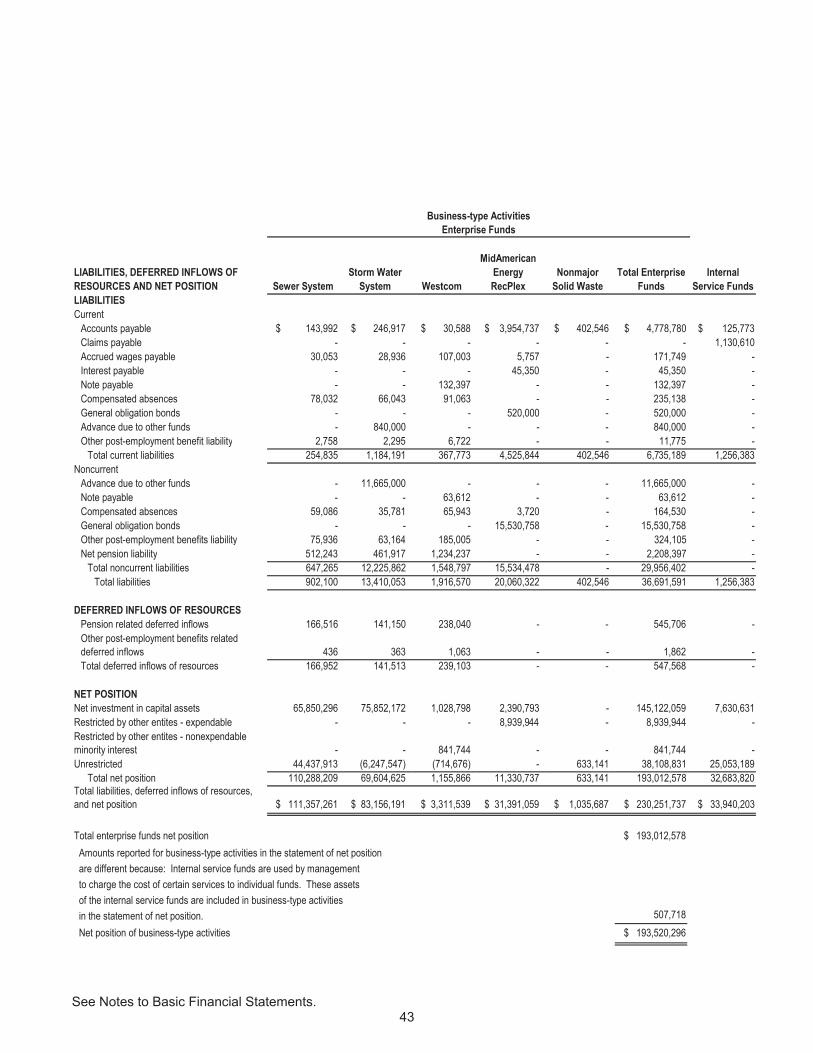
LIABILITIES, DEFERRED INFLOWS OF RESOURCES AND NET POSITION Sewer System
Storm Water System Westcom
MidAmerican Energy RecPlex
Nonmajor Solid Waste
Total Enterprise Funds
Internal Service Funds
LIABILITIESCurrent
Accounts payable $ 143,992 $ 246,917 $ 30,588 $ 3,954,737 $ 402,546 $ 4,778,780 $ 125,773 Claims payable - - - - - - 1,130,610 Accrued wages payable 30,053 28,936 107,003 5,757 - 171,749 - Interest payable - - - 45,350 - 45,350 - Note payable - - 132,397 - - 132,397 - Compensated absences 78,032 66,043 91,063 - - 235,138 - General obligation bonds - - - 520,000 - 520,000 - Advance due to other funds - 840,000 - - - 840,000 - Other post-employment benefit liability 2,758 2,295 6,722 - - 11,775 -
Total current liabilities 254,835 1,184,191 367,773 4,525,844 402,546 6,735,189 1,256,383 Noncurrent
Advance due to other funds - 11,665,000 - - - 11,665,000 - Note payable - - 63,612 - - 63,612 - Compensated absences 59,086 35,781 65,943 3,720 - 164,530 - General obligation bonds - - - 15,530,758 - 15,530,758 - Other post-employment benefits liability 75,936 63,164 185,005 - - 324,105 - Net pension liability 512,243 461,917 1,234,237 - - 2,208,397 -
Total noncurrent liabilities 647,265 12,225,862 1,548,797 15,534,478 - 29,956,402 - Total liabilities 902,100 13,410,053 1,916,570 20,060,322 402,546 36,691,591 1,256,383
DEFERRED INFLOWS OF RESOURCESPension related deferred inflows 166,516 141,150 238,040 - - 545,706 - Other post-employment benefits related deferred inflows 436 363 1,063 - - 1,862 - Total deferred inflows of resources 166,952 141,513 239,103 - - 547,568 -
NET POSITIONNet investment in capital assets 65,850,296 75,852,172 1,028,798 2,390,793 - 145,122,059 7,630,631 Restricted by other entites - expendable - - - 8,939,944 - 8,939,944 - Restricted by other entites - nonexpendable minority interest - - 841,744 - - 841,744 - Unrestricted 44,437,913 (6,247,547) (714,676) - 633,141 38,108,831 25,053,189
Total net position 110,288,209 69,604,625 1,155,866 11,330,737 633,141 193,012,578 32,683,820 Total liabilities, deferred inflows of resources, and net position $ 111,357,261 $ 83,156,191 $ 3,311,539 $ 31,391,059 $ 1,035,687 $ 230,251,737 $ 33,940,203
Total enterprise funds net position $ 193,012,578 Amounts reported for business-type activities in the statement of net position are different because: Internal service funds are used by management to charge the cost of certain services to individual funds. These assets of the internal service funds are included in business-type activities in the statement of net position. 507,718 Net position of business-type activities $ 193,520,296
Enterprise FundsBusiness-type Activities
See Notes to Basic Financial Statements. 44
Sewer SystemStorm Water
System Westcom
MidAmerican Energy RecPlex
Nonmajor Solid Waste
Total Enterprise Funds
Internal Service Funds
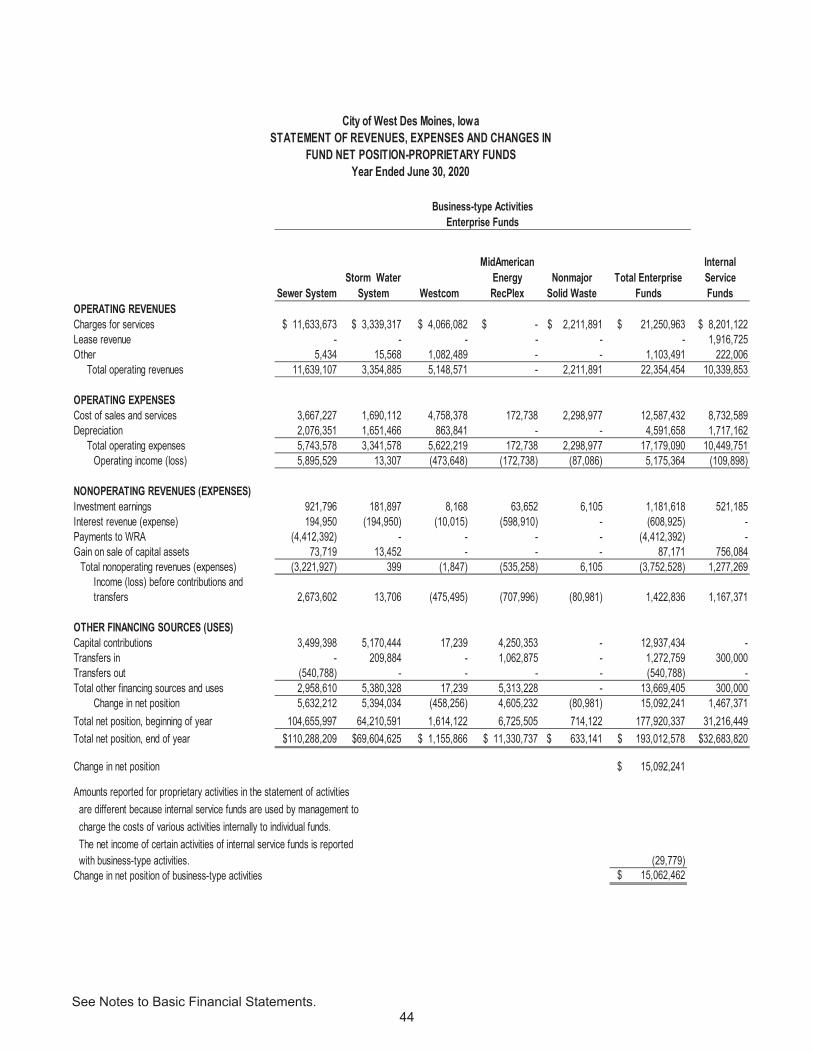
OPERATING REVENUESCharges for services $ 11,633,673 $ 3,339,317 $ 4,066,082 $ - $ 2,211,891 $ 21,250,963 $ 8,201,122 Lease revenue - - - - - - 1,916,725 Other 5,434 15,568 1,082,489 - - 1,103,491 222,006
Total operating revenues 11,639,107 3,354,885 5,148,571 - 2,211,891 22,354,454 10,339,853
OPERATING EXPENSESCost of sales and services 3,667,227 1,690,112 4,758,378 172,738 2,298,977 12,587,432 8,732,589 Depreciation 2,076,351 1,651,466 863,841 - - 4,591,658 1,717,162
Total operating expenses 5,743,578 3,341,578 5,622,219 172,738 2,298,977 17,179,090 10,449,751 Operating income (loss) 5,895,529 13,307 (473,648) (172,738) (87,086) 5,175,364 (109,898)
NONOPERATING REVENUES (EXPENSES)Investment earnings 921,796 181,897 8,168 63,652 6,105 1,181,618 521,185 Interest revenue (expense) 194,950 (194,950) (10,015) (598,910) - (608,925) - Payments to WRA (4,412,392) - - - - (4,412,392) - Gain on sale of capital assets 73,719 13,452 - - - 87,171 756,084
Total nonoperating revenues (expenses) (3,221,927) 399 (1,847) (535,258) 6,105 (3,752,528) 1,277,269 Income (loss) before contributions and transfers 2,673,602 13,706 (475,495) (707,996) (80,981) 1,422,836 1,167,371
OTHER FINANCING SOURCES (USES)Capital contributions 3,499,398 5,170,444 17,239 4,250,353 - 12,937,434 - Transfers in - 209,884 - 1,062,875 - 1,272,759 300,000 Transfers out (540,788) - - - - (540,788) - Total other financing sources and uses 2,958,610 5,380,328 17,239 5,313,228 - 13,669,405 300,000
Change in net position 5,632,212 5,394,034 (458,256) 4,605,232 (80,981) 15,092,241 1,467,371 Total net position, beginning of year 104,655,997 64,210,591 1,614,122 6,725,505 714,122 177,920,337 31,216,449 Total net position, end of year $110,288,209 $69,604,625 $ 1,155,866 $ 11,330,737 $ 633,141 $ 193,012,578 $32,683,820
Change in net position $ 15,092,241
Amounts reported for proprietary activities in the statement of activities are different because internal service funds are used by management to charge the costs of various activities internally to individual funds. The net income of certain activities of internal service funds is reported with business-type activities. (29,779)Change in net position of business-type activities $ 15,062,462
Enterprise Funds
City of West Des Moines, IowaSTATEMENT OF REVENUES, EXPENSES AND CHANGES IN
Year Ended June 30, 2020
Business-type Activities
FUND NET POSITION-PROPRIETARY FUNDS

45
This page is intentionally blank
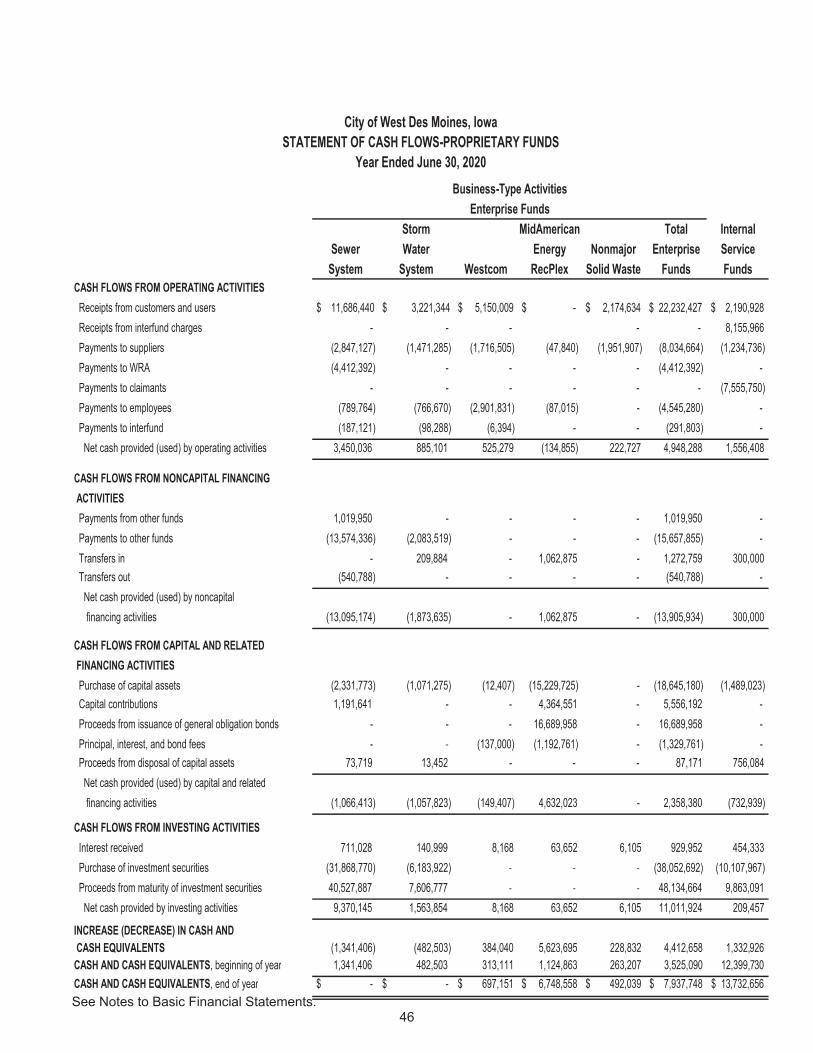
See Notes to Basic Financial Statements. 46
Storm MidAmerican Total InternalSewer Water Energy Nonmajor Enterprise Service
System System Westcom RecPlex Solid Waste Funds FundsCASH FLOWS FROM OPERATING ACTIVITIES Receipts from customers and users $ 11,686,440 $ 3,221,344 $ 5,150,009 $ - $ 2,174,634 $ 22,232,427 $ 2,190,928 Receipts from interfund charges - - - - - 8,155,966 Payments to suppliers (2,847,127) (1,471,285) (1,716,505) (47,840) (1,951,907) (8,034,664) (1,234,736) Payments to WRA (4,412,392) - - - - (4,412,392) - Payments to claimants - - - - - - (7,555,750) Payments to employees (789,764) (766,670) (2,901,831) (87,015) - (4,545,280) - Payments to interfund (187,121) (98,288) (6,394) - - (291,803) - Net cash provided (used) by operating activities 3,450,036 885,101 525,279 (134,855) 222,727 4,948,288 1,556,408
CASH FLOWS FROM NONCAPITAL FINANCING ACTIVITIES Payments from other funds 1,019,950 - - - - 1,019,950 - Payments to other funds (13,574,336) (2,083,519) - - - (15,657,855) - Transfers in - 209,884 - 1,062,875 - 1,272,759 300,000 Transfers out (540,788) - - - - (540,788) - Net cash provided (used) by noncapital financing activities (13,095,174) (1,873,635) - 1,062,875 - (13,905,934) 300,000
CASH FLOWS FROM CAPITAL AND RELATED FINANCING ACTIVITIES Purchase of capital assets (2,331,773) (1,071,275) (12,407) (15,229,725) - (18,645,180) (1,489,023) Capital contributions 1,191,641 - - 4,364,551 - 5,556,192 - Proceeds from issuance of general obligation bonds - - - 16,689,958 - 16,689,958 - Principal, interest, and bond fees - - (137,000) (1,192,761) - (1,329,761) - Proceeds from disposal of capital assets 73,719 13,452 - - - 87,171 756,084 Net cash provided (used) by capital and related financing activities (1,066,413) (1,057,823) (149,407) 4,632,023 - 2,358,380 (732,939)
CASH FLOWS FROM INVESTING ACTIVITIES Interest received 711,028 140,999 8,168 63,652 6,105 929,952 454,333 Purchase of investment securities (31,868,770) (6,183,922) - - - (38,052,692) (10,107,967) Proceeds from maturity of investment securities 40,527,887 7,606,777 - - - 48,134,664 9,863,091 Net cash provided by investing activities 9,370,145 1,563,854 8,168 63,652 6,105 11,011,924 209,457
INCREASE (DECREASE) IN CASH AND CASH EQUIVALENTS (1,341,406) (482,503) 384,040 5,623,695 228,832 4,412,658 1,332,926 CASH AND CASH EQUIVALENTS, beginning of year 1,341,406 482,503 313,111 1,124,863 263,207 3,525,090 12,399,730 CASH AND CASH EQUIVALENTS, end of year $ - $ - $ 697,151 $ 6,748,558 $ 492,039 $ 7,937,748 $ 13,732,656
City of West Des Moines, IowaSTATEMENT OF CASH FLOWS-PROPRIETARY FUNDS
Year Ended June 30, 2020Business-Type Activities
Enterprise Funds
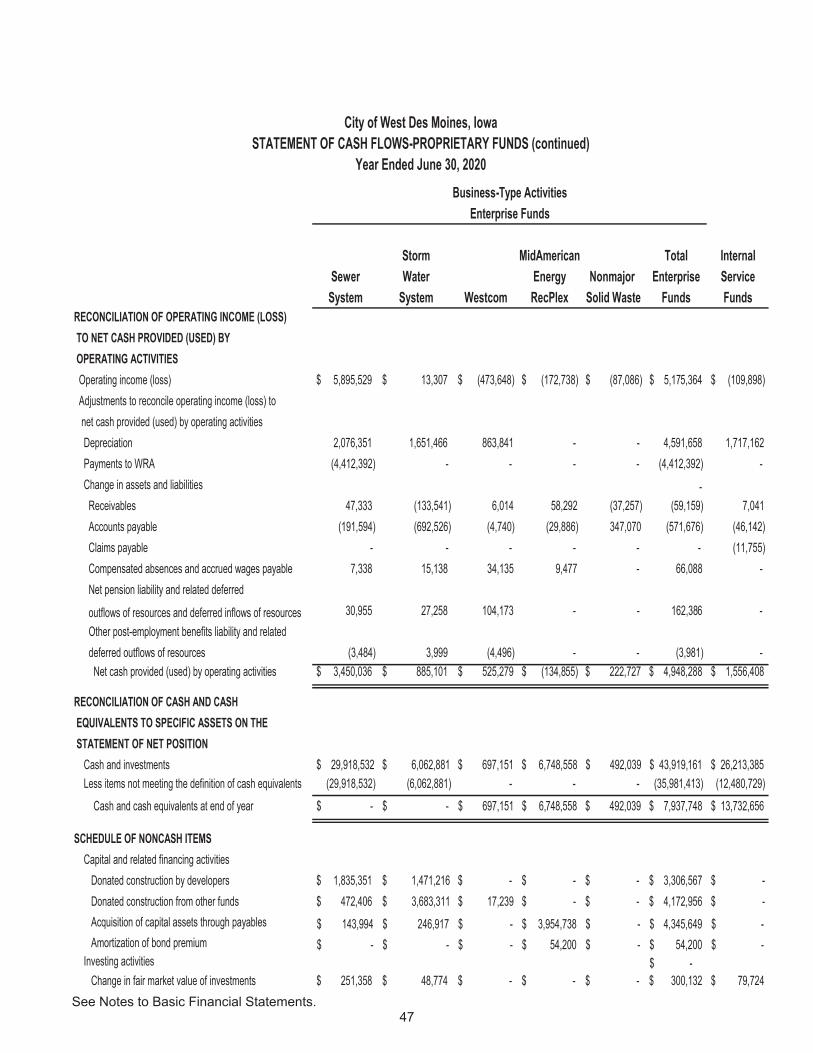
See Notes to Basic Financial Statements. 47
Storm MidAmerican Total InternalSewer Water Energy Nonmajor Enterprise Service
System System Westcom RecPlex Solid Waste Funds FundsRECONCILIATION OF OPERATING INCOME (LOSS) TO NET CASH PROVIDED (USED) BY OPERATING ACTIVITIES Operating income (loss) $ 5,895,529 $ 13,307 $ (473,648) $ (172,738) $ (87,086) $ 5,175,364 $ (109,898) Adjustments to reconcile operating income (loss) to net cash provided (used) by operating activities Depreciation 2,076,351 1,651,466 863,841 - - 4,591,658 1,717,162 Payments to WRA (4,412,392) - - - - (4,412,392) - Change in assets and liabilities - Receivables 47,333 (133,541) 6,014 58,292 (37,257) (59,159) 7,041 Accounts payable (191,594) (692,526) (4,740) (29,886) 347,070 (571,676) (46,142) Claims payable - - - - - - (11,755) Compensated absences and accrued wages payable 7,338 15,138 34,135 9,477 - 66,088 - Net pension liability and related deferred
outflows of resources and deferred inflows of resources 30,955 27,258 104,173 - - 162,386 - Other post-employment benefits liability and related deferred outflows of resources (3,484) 3,999 (4,496) - - (3,981) - Net cash provided (used) by operating activities $ 3,450,036 $ 885,101 $ 525,279 $ (134,855) $ 222,727 $ 4,948,288 $ 1,556,408
RECONCILIATION OF CASH AND CASH EQUIVALENTS TO SPECIFIC ASSETS ON THE STATEMENT OF NET POSITION Cash and investments $ 29,918,532 $ 6,062,881 $ 697,151 $ 6,748,558 $ 492,039 $ 43,919,161 $ 26,213,385 Less items not meeting the definition of cash equivalents (29,918,532) (6,062,881) - - - (35,981,413) (12,480,729) Cash and cash equivalents at end of year $ - $ - $ 697,151 $ 6,748,558 $ 492,039 $ 7,937,748 $ 13,732,656
SCHEDULE OF NONCASH ITEMS Capital and related financing activities Donated construction by developers $ 1,835,351 $ 1,471,216 $ - $ - $ - $ 3,306,567 $ - Donated construction from other funds $ 472,406 $ 3,683,311 $ 17,239 $ - $ - $ 4,172,956 $ - Acquisition of capital assets through payables 143,994$ 246,917$ -$ 3,954,738$ -$ 4,345,649$ -$ Amortization of bond premium -$ -$ -$ 54,200$ -$ 54,200$ -$ Investing activities -$ Change in fair market value of investments $ 251,358 $ 48,774 $ - $ - $ - $ 300,132 $ 79,724
Business-Type ActivitiesEnterprise Funds
City of West Des Moines, IowaSTATEMENT OF CASH FLOWS-PROPRIETARY FUNDS (continued)
Year Ended June 30, 2020
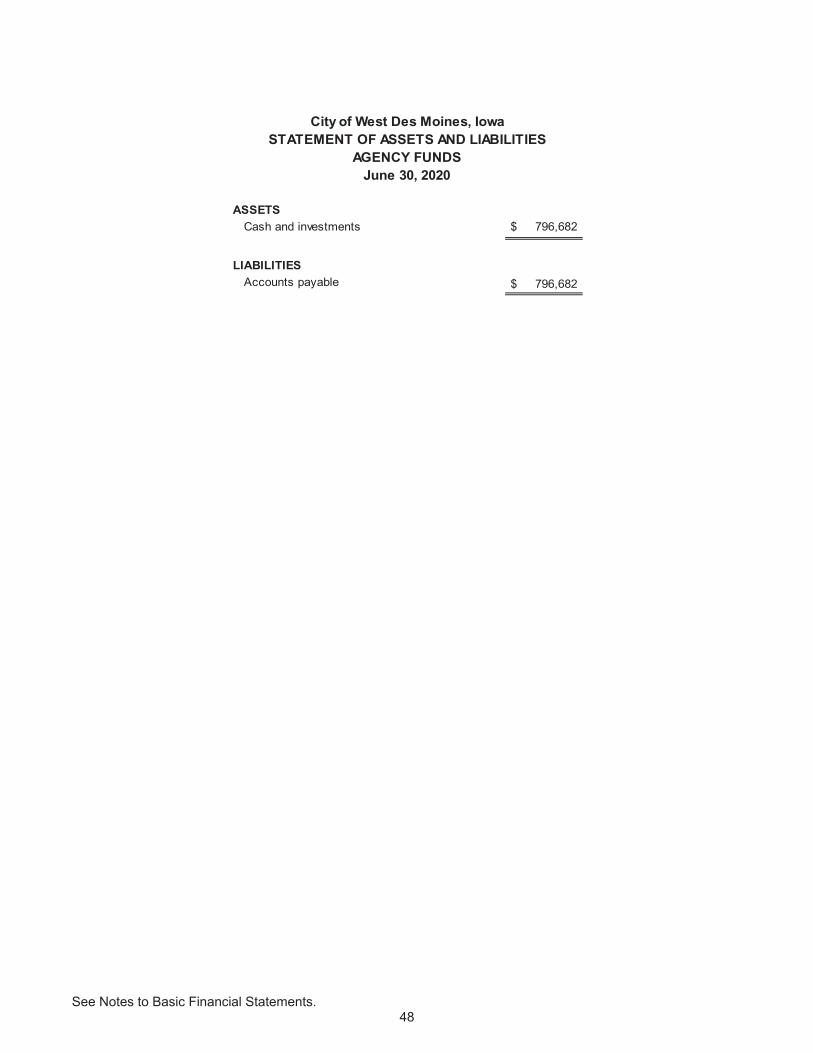
See Notes to Basic Financial Statements. 48
ASSETS Cash and investments $ 796,682
LIABILITIES Accounts payable 796,682$
City of West Des Moines, IowaSTATEMENT OF ASSETS AND LIABILITIES
June 30, 2020AGENCY FUNDS
49
City of West Des Moines, Iowa NOTES TO BASIC FINANCIAL STATEMENTS
NOTE 1 SUMMARY OF SIGNIFICANT ACCOUNTING POLICIES Reporting Entity The City of West Des Moines (the City) is a political subdivision of the State of Iowa located in Polk, Dallas, Madison and Warren counties. It was first incorporated in 1893 and operates under the Home Rule provisions of the Constitution of Iowa. The City operates under the Mayor-Council form of government, with the Mayor and Council Members elected on a nonpartisan basis. The City provides numerous services to citizens, including public safety, public works, culture and recreation, community and economic development, health and social services, public improvements and general administrative services. It also provides sewer, storm water, solid waste utilities and dispatching services (Westcom). The City continues construction of a City-owned multi-sport recreational facility (MidAmerican Energy RecPlex). The financial statements of the City have been prepared in conformity with accounting principles generally accepted in the United States of America as prescribed by the Governmental Accounting Standards Board. For financial reporting purposes, the City has included all funds, organizations, agencies, boards, commissions and authorities. The City has also considered all potential component units for which it is financially accountable and other organizations for which the nature and significance of their relationship with the City are such that exclusions would cause the City’s financial statements to be misleading or incomplete. The Governmental Accounting Standards Board has set forth criteria to be considered in determining financial accountability. These criteria include appointing a voting majority of an organization’s governing body and (1) the ability of the City to impose its will on that organization or (2) the potential for the organization to provide specific benefits to or impose specific financial burdens on the City. Based on these criteria, the City reports Westcom, a legally separate entity, that is, in substance part of the City’s general operations. Westcom is governed by a management committee as outlined in the 28E agreement. Although it is legally separate from the City, Westcom is reported as if it were part of the primary government because its sole function is the management of the region’s public safety emergency dispatch. The activities of Westcom are included in the accompanying financial statements as a major enterprise fund within the business-type activities. Westcom does not have separately issued financial statements. The minority interest of the component unit is reported as restricted net position, nonexpendable in accordance with GASB 61, paragraph 12. Basis of Presentation
Government-wide and fund financial statements: The government-wide financial statements (i.e., the Statement of Net Position and the Statement of Activities) report information on all of the non-fiduciary activities of the City. As a general rule, the effect of inter-fund activity has been eliminated from the government-wide financial statements. Exceptions to this general rule are charges between the City’s proprietary functions and various other functions of the government. Elimination of these charges would distort the direct costs and program revenues reported for the various functions concerned. Governmental activities, which normally are supported by taxes and intergovernmental revenues, are reported separately from business-type activities, which rely to a significant extent for support on fees and charges for services. The Statement of Net Position presents the City’s assets, deferred outflows of resources, liabilities, and deferred inflows of resources, with the difference reported as net position. Three categories of net position are reported:
Net investment in capital assets consists of capital assets, net of accumulated depreciation and reduced by outstanding balances for bonds, notes and other debt attributable to the acquisition, construction or improvement of those assets. Restricted net position results when constraints placed on the use of net position are either externally imposed by law through constitutional provisions or enabling legislation.
50
City of West Des Moines, Iowa NOTES TO BASIC FINANCIAL STATEMENTS
NOTE 1 SUMMARY OF SIGNIFICANT ACCOUNTING POLICIES (continued) Basis of Presentation (continued)
Unrestricted net position consists of net position not meeting the definition of the two preceding categories. Unrestricted net position often has constraints on resources imposed by management which can be removed or modified.
The Statement of Activities demonstrates the degree to which the direct expenses of a given function are offset by program revenues. Direct expenses are those that are clearly identifiable with a specific function. There are no indirect expenses. Program revenues include 1) charges to customers or applicants who purchase, use or
directly benefit from goods, services or privileges provided by a given function and 2) grants and contributions that are restricted to meeting the operational or capital requirements of a particular function. Taxes and other items not included among program revenues are reported as general revenues. Separate financial statements are provided for governmental funds, proprietary funds, and fiduciary funds, even though the latter are excluded from the government-wide financial statements. The focus of fund financial statements is on major funds. Major individual governmental funds and major individual enterprise funds are reported as separate columns in the fund financial statements. Nonmajor funds are aggregated and presented in a single column. Fund Accounting: The accounts of the City are organized on the basis of funds, each of which is considered to be a separate accounting entity. The operations of each fund are accounted for by providing a separate set of self-balancing accounts which comprise its assets, deferred outflows of resources, liabilities, and deferred inflows of resources, fund balance/net position, revenues and expenditures or expenses, as appropriate. The City has the following funds:
Governmental Fund Types: Governmental fund types are those funds through which most governmental functions typically are financed. Governmental fund reporting focuses on the sources, uses and balances of current financial resources. Expendable assets are assigned to the various governmental funds according to the purposes for which they may or must be used; current liabilities are assigned to the fund from which they are paid; and the difference between governmental fund assets, liabilities, and deferred inflows of resources, the fund equity, is referred to as "fund balance". The measurement focus is upon determination of changes in financial positions, rather than upon net income determination. The following are the City's major governmental funds:
General Fund: The General Fund is the government's primary operating fund. It accounts for all financial resources of the general government, except those required to be accounted for in another fund. Road Use Tax Fund (Special Revenue): To account for the proceeds from road use tax monies. Tax Increment Financing Fund (Special Revenue): To account for the accumulation of resources generated by TIF districts to be used for urban renewal and development. Property tax revenue generated on increased assessed valuations within TIF districts are the resources accounted for in this fund. Debt Service Fund: To account for the servicing of the general long-term debt not financed by a specific source. Capital Projects Fund: To account for the acquisition and construction of major capital facilities and other capital assets, with the exception of those that are financed through proprietary fund types. Local Option Sales Tax Fund: To account for the voter-approved local option sales tax in Dallas and
51
City of West Des Moines, Iowa NOTES TO BASIC FINANCIAL STATEMENTS
NOTE 1 SUMMARY OF SIGNIFICANT ACCOUNTING POLICIES (continued) Basis of Presentation (continued)
Polk County with 50% of the revenue pledged for property tax reduction and 50% to be used for certain initiatives including quality of life amenities and increased public safety spending.
The other governmental funds of the City are considered nonmajor and are as follows:
Special Revenue Funds: Are used to account for the proceeds of specific revenue sources (other than certain capital projects that are legally restricted to expenditures for specific projects).
Fund Accounting (continued)
Police and Fire Retirement Fund: To account for the remaining balances of the self-administered pension plans after a transfer to a state administered plan which may be used by the City to meet future pension funding requirements as prescribed by law. Employee Benefit Fund: To account for the property tax revenues collected to be used for City employees' health insurance and pension costs. Economic Development Fund: To account for grants, contributions, and loan repayments to be used for general economic development and redevelopment purposes of the City including low interest loans the City makes to private companies for economic development purposes, as well as the acquisition and sale of land. Housing Programs Fund: To account for the U.S. Department of Housing and Urban Development Block Grant programs as well as miscellaneous other grants and contributions to provide housing assistance and housing rehabilitation programs. Human Services Child Care & Medical Clinic: To account for the human services child care and medical clinic donations and related expenditures. Parks Fund: To account for the donations identified to specifically assist the park programs and annual tree planting.
Library Fund: To account for reimbursements from the State of Iowa for library materials lent to non-City residents and other libraries in Iowa, and used for improvements to the Library. This Fund also accounts for money received through donations and fund raising activities for the Library. Public Safety Fund: To account for grants and contributions specifically identified for use in public safety activities such as contributions for the purchase of public access defibrillators. This fund is also used to account for funds received by the City as a result of drug seizures. Dallas County Local Housing Trust Fund: To account for grants from the Iowa Finance Authority and other Dallas County Local Housing Trust Fund revenues and related expenditures. Community Development Block Grant Fund: To account for the community development block grant revenues and related expenditures.
Proprietary Fund Types: Proprietary fund types are used to account for a government's ongoing organizations and activities which are similar to those often found in the private sector (business-type activities). The measurement focus is upon income determination, financial positions and cash flows.
52
City of West Des Moines, Iowa NOTES TO BASIC FINANCIAL STATEMENTS
NOTE 1 SUMMARY OF SIGNIFICANT ACCOUNTING POLICIES (continued) Basis of Presentation (continued)
Enterprise Funds: Are used to account for those operations that are financed and operated in a manner similar to private business or where the City has decided that the determination of revenues earned, costs incurred and/or net income is necessary for management accountability. The following are the City's major enterprise funds:
Sewer System Fund: To account for the operations of the City's sanitary sewer systems including the revenue from usage fees, the operating costs associated with it, any capital projects and all bond issues.
Storm Water System Fund: To account for the operations of the City's storm water sewer systems including revenue from usage fees, operating costs, capital projects, and all bond issues. Westcom Fund: To account for the operations of the City’s dispatching services. MidAmerican Energy RecPlex: to account for the operations of the City-owned multi-sport recreational facility.
The other enterprise fund of the City is considered nonmajor and is as follows:
Solid Waste Fund: To account for the operations of the City's solid waste collection system.
Internal Service Funds: Are used to finance and account for services and commodities provided by designated departments or agencies to other departments and agencies of the City. The following are the City's internal service funds:
Vehicle Replacement Fund: To account for replacement costs related to vehicles and equipment of the City. Vehicle Maintenance Fund: To account for the maintenance costs related to the vehicles and equipment of the City. Health and Dental Insurance Fund: To account for the health and dental insurance premiums and claims for all City employees. Worker's Compensation Insurance Fund: To account for the worker's compensation premiums and claims. Technology Replacement Fund: To account for replacement costs related to technology used by the City, such as hardware and software.
Fiduciary Fund Types: Fiduciary fund types are used to account for fiduciary net position and changes in net position held by a governmental unit in a trustee capacity or as an agent for individuals, private organizations, other governmental units and/or other funds. The City has the following fiduciary fund type:
Agency Funds: Are custodial in nature (assets equal liabilities) and do not involve measurement or results of operations. The City has the following agency funds:
Collections and Deposits Fund: To account for collections and deposits received by the City from external parties for purposes such as escrow accounts for transitional housing program participants, deposits by transient vendors to ensure compliance with temporary use permits and deposits from
53
City of West Des Moines, Iowa NOTES TO BASIC FINANCIAL STATEMENTS
NOTE 1 SUMMARY OF SIGNIFICANT ACCOUNTING POLICIES (continued) Basis of Presentation (continued)
developers pending completion of remaining site plan requirements. Section 125 Plan Fund: To account for current payroll deductions of City employees for future use as group insurance premiums.
Measurement Focus and Basis of Accounting The government-wide financial statements are reported using the economic resources measurement focus and the accrual basis of accounting, as are the proprietary fund and fiduciary fund financial statements. Revenues are recorded when earned and expenses are recorded when a liability is incurred, regardless of the timing of related cash flows. Property tax is recognized as revenue in the year in which it is levied. Grants and similar items are recognized as revenue as soon as all eligibility requirements imposed by the provider have been satisfied. Governmental fund financial statements are reported using the current financial resources measurement focus and the modified accrual basis of accounting. Revenues are recognized as soon as they are both measurable and available. Revenues are considered to be available when they are collectible within the current period or soon enough thereafter to pay liabilities of the current period. For this purpose, the City considers revenues to be available if they are collected within 60 days of the current fiscal period.
Property tax, local option sales tax, intergovernmental revenues (shared revenues, grants and reimbursements from other governments) and interest are considered to be susceptible to accrual. All other revenue items are considered to be measurable and available only when cash is received by the City. Expenditures generally are recorded when a liability is incurred, as under accrual accounting. However, principal and interest on long-term debt, claims and judgments and compensated absences are recognized as expenditures only when payment is due. Capital asset acquisitions are reported as expenditures in governmental funds. Proceeds of general long-term debt are reported as other financing sources. When an expenditure is incurred in governmental funds that can be paid using either restricted or unrestricted resources, the City’s policy is generally to first apply the expenditure toward restricted fund balance and then to less-restrictive classifications - committed, assigned and then unassigned fund balances. Under terms of grant agreements, the City funds certain programs by a combination of specific cost-reimbursement grants, categorical block grants and general revenues. Thus, when program expenses are incurred, there is both restricted and unrestricted net position available to finance the program. It is the City’s policy to first apply cost-reimbursement grant resources to such programs, followed by categorical block grants and then by general revenues. Property taxes are recognized at the time an enforceable legal claim is established. This is deemed to occur when the budget is certified. The current tax levy was certified in February 2020, the date at which a lien attaches, based on the 2019 assessed valuations. These taxes are due in two installments, on September 30 and the following March 31, with a 1½% per month penalty for delinquent payment. Since the 2019 tax levy is budgeted and levied for fiscal year 2021, the revenue from this tax levy has been deferred.
Proprietary funds distinguish operating revenues and expenses from non-operating items. Operating revenues and expenses generally result from providing services and producing and delivering goods in connection with a proprietary fund's principal ongoing operations. The principal operating revenues of the City's enterprise funds are charges to customers for sales and services. Operating expenses for enterprise funds include the cost of sales and services, administrative expenses and depreciation on capital assets. All revenues and expenses not meeting this definition are reported as non-operating revenues and expenses.
54
City of West Des Moines, Iowa NOTES TO BASIC FINANCIAL STATEMENTS
NOTE 1 SUMMARY OF SIGNIFICANT ACCOUNTING POLICIES (continued) The City maintains its financial records on the cash basis during the fiscal year. The financial statements of the City are prepared by making adjusting entries to the cash basis financial records at the end of the fiscal year. Summary of Significant Accounting Policies: The significant accounting policies followed by the City include the following:
Cash, Pooled Investments and Cash Equivalents: The City maintains a cash and investment pool to maximize investment opportunities. Income from investments is recorded in the General Fund unless otherwise provided by law. Each fund's portion of total cash and investments is reported as such within this report. In addition, certain investments are separately held by several of the City's funds. Investments are reported at fair value except for non-negotiable certificates of deposit which are stated at cost. Securities traded on the national or international exchange are valued at the last reported sales price at current exchange rates.
For purposes of the Statement of Cash Flows for proprietary fund type funds, the City considers pooled cash and investments to be cash equivalents as these pooled amounts have the same characteristics of demand deposits and all highly liquid investments with a maturity of three months or less when purchased. Certificates of deposit with a maturity greater than three months are considered investments. Cash equivalents also include restricted cash and investments. Property Taxes Receivable, Including Tax Increment Financing: Property tax, including tax increment financing in governmental funds, is accounted for using the modified accrual basis of accounting. Property tax receivable is recognized in these funds on the levy or lien date, which is the date that the tax asking is certified by the City Council to the County Board of Supervisors. Current year property tax receivable represents taxes collected by the County but not remitted to the City at June 30, 2020 and unpaid taxes. The succeeding year property tax receivable represents taxes certified by the City Council to be collected in the next fiscal year for the purposes set out in the budget for the next fiscal year. By statute, the City Council is required to certify its budget to the County Auditor by March 15 of each year for the subsequent fiscal year. However, by statute, the tax asking and budget certification for the following fiscal year becomes effective on the first day of that year. Although the succeeding year property tax receivable has been recorded, the related revenue is reported as a deferred inflow of resources in both the government-wide and the fund financial statements and will not be recognized as revenue until the year for which it is levied.
Property tax revenues recognized in these funds become due and collectible in September and March of the current fiscal year with a 1 ½% per month penalty for delinquent payments; is based on January 1, 2018, assessed property valuations; is for the tax accrual period July 1, 2019 through June 30, 2020, and reflects tax asking contained in the budget certified to the County Board of Supervisors in February 2019. Accounts Receivable: results primarily from services provided to citizens and are accounted for in the governmental funds. Sanitary sewer, storm water sewer, solid waste, dispatching services, and the MidAmerican Energy RecPlex are accounted for in the enterprise funds. All are net of an allowance for uncollectibles. Unbilled usage for service consumed between periodic scheduled billing dates is estimated and is recognized as revenue in the period in which the service is provided.
Special Assessments Receivable: represents the amounts due from individuals for work done which benefits their property. These assessments are payable by individuals in not less than ten nor more than twenty annual installments. Each annual installment with interest on the unpaid balance is due on September 30 and is subject to the same interest and penalties as other tax. Interest Receivable: represents the amounts due from earnings on investments. Promises to Give: represents promises made directly to the City from individuals and businesses to be used in
55
City of West Des Moines, Iowa NOTES TO BASIC FINANCIAL STATEMENTS
NOTE 1 SUMMARY OF SIGNIFICANT ACCOUNTING POLICIES (continued) Summary of Significant Accounting Policies (continued)
the construction on the MidAmerican Energy RecPlex. Approximately $431,000 of the $2,246,212 receivable at June 30, 2020 is expected to be received with one year. The entire balance is expected to be received in ten years.
Loans Receivable: represents amounts due from businesses related to the City’s economic incentive programs and the amounts due relating to notes from direct borrowings and direct placements. Due from Other Governments: Due from other governments represents amounts due from the State of Iowa, various shared revenues, grants and reimbursements from other governments. Inventories: consists of materials and supplies and are valued at cost using the first-in, first-out (FIFO) method. The costs of governmental fund type inventories are recorded as expenditures using the purchase method. Prepaids: consists of software maintenance, support, and warranty extending beyond the current fiscal year end. The associated expenditure is recognized in the period benefited by the prepayment.
Restricted Assets: Funds invested from contributions which carry specific restrictions for their use are classified as restricted assets. Bond Issuance Costs: in the government-wide financial statements and the fund financial statements, bond issuance costs are recognized during the current period. Issuance costs, whether or not withheld from the actual debt proceeds received, are reported as expenses in the government-wide financial statement and proprietary fund types in the fund financial statement. Governmental funds recognize the costs as debt service expenditures. Capital Assets: including land, buildings, improvements other than buildings, intangibles, equipment and vehicles, infrastructure, construction-in-progress, sanitary and storm water sewer system are reported in the applicable governmental or business-type activities columns in the government-wide financial statements. Capital assets are defined by the City as assets with an initial, individual cost of more than $5,000 and an initial useful life of one year or greater. Assets are recorded at historical cost if purchased or constructed. Donated capital assets are recorded at acquisition value at the date of donation. The costs of normal maintenance and repairs that do not add to the value of the asset or materially extend the life of the asset are not capitalized. The City has chosen the modified approach, as defined by GASB Statement No. 34, for reporting the governmental activities infrastructure assets. The modified approach for reporting infrastructure assets takes into consideration the fact that many infrastructure assets may reasonably be expected to continue to function indefinitely if they are adequately preserved and maintained. Therefore, these particular assets would not be depreciated over a useful life. The City has established an asset management system and has committed to maintain the following networks of infrastructure asset at an established condition level as determined by the City’s Public Services department (1) roadways and pavements (2) bridges (3) flood control levees and (4) street culverts. The Required Supplementary Information Section of this report provides additional information regarding the condition assessment and the estimated and actual costs to maintain the assets
Major outlays for capital assets and improvements are capitalized as projects are constructed. Prior to fiscal year 2020, interest incurred during the construction phase of capital assets of business-type activities was included as part of the capitalized value of the assets constructed. For fiscal year 2020, the City adopted GASB 89, Accounting for Interest Cost Incurred before the End of a Construction Period, which requires such costs to be
56
City of West Des Moines, Iowa NOTES TO BASIC FINANCIAL STATEMENTS
NOTE 1 SUMMARY OF SIGNIFICANT ACCOUNTING POLICIES (continued) Summary of Significant Accounting Policies (continued)
expensed in the period incurred. GASB 89 provisions have been applied prospectively in accordance with the transition provisions in the pronouncement. Accordingly, GASB 89 has no effect on beginning net position. Depreciation has been provided using the straight-line method over the estimated useful lives of the respective assets. The estimated useful lives for each capital asset type are as follows:
Asset class Estimated useful lives (in years)Buildings 30Improvements other than buildings 15Equipment and vehicles 3 - 15Fiber network 20Sanitary and storm water sewer system 50Intangibles 5
The City's collection of works of art and other similar assets are not capitalized. These collections are unencumbered, held for public exhibition and education, protected, cared for and preserved and subject to City policy that requires proceeds from the sale of these items to be used to acquire other collection items.
Deferred Outflows of Resources: Deferred outflows of resources represent a consumption of net position that applies to a future period(s) and will not be recognized as an outflow of resources (expense/expenditure) until then. Deferred outflows of resources consist of unrecognized items not yet charged to pension and OPEB expense and contributions from the employer after the measurement date, but before the end of the employer’s reporting period. Deferred Inflows of Resources: Deferred inflows of resources represent an acquisition of net position that applies to a future period(s) and will not be recognized as an inflow of resources (revenue) until that time. Although certain revenues are measurable, they are not available. Available means collected within the current period, or expected to be collected soon enough thereafter to be used to pay liabilities of the current period. Deferred inflows of resources in the governmental fund financial statements represent the amount of assets that have been recognized, but the related revenue has not been recognized since it is not available. Deferred inflows of resources at the governmental fund level consist of the succeeding year property tax receivable, and other receivables not collected within 60 days of the current fiscal period. Deferred inflows of resources in the Statement of Net Position consist of succeeding year property tax receivable that will not be recognized as revenue until the year for which they are levied, the unamortized portion of the net difference between projected and actual earnings on pension plan investments, and other unrecognized items not yet charged to pension and OPEB expense. Interfund Transactions: Transactions among City funds that would be treated as revenues and expenditures or expenses if they involved organizations external to City government are accounted for as revenues and expenditures or expenses in the funds involved. Transactions which constitute reimbursements to a fund for expenditures initially made from it which are properly applicable to another fund are recorded as expenditures in the reimbursing fund and as reductions of expenditures in the reimbursed fund. Transactions, which constitute the transfer of resources from a fund receiving revenues to a fund through which the revenues are to be expended, are separately reported in the respective fund's operating statements.
57
City of West Des Moines, Iowa NOTES TO BASIC FINANCIAL STATEMENTS
NOTE 1 SUMMARY OF SIGNIFICANT ACCOUNTING POLICIES (continued) Summary of Significant Accounting Policies (continued)
Activity between funds, that are representative of lending/borrowing arrangements at the end of the fiscal year, are referred to as "due to/from other funds" in the fund financial statements. Any residual balances outstanding between the governmental activities and business-type activities are reported in the government-wide financial statements as "internal balances".
Compensated Absences: City employees accumulate vacation benefits for subsequent use or payment upon termination, death or retirement. City employees also accumulate sick leave benefits for subsequent use or payment at one-half the accumulated value upon death or retirement. For proprietary fund types, these accumulations are recorded as expenses and liabilities of the appropriate fund in the fiscal year earned. For governmental fund types, the amount of accumulated unpaid vacation which is payable from available resources is recorded as a liability of the respective fund only if they have matured. Examples of these are employee retirements and resignations. There is no amount considered due as of year-end or reported in the fund financial statements. However, the entire compensated absence liability, computed based on rates of pay in effect at June 30, 2020, is reported on the government-wide financial statements. The compensated absences liability attributable to the governmental activities will be paid primarily by the General Fund.
Long-Term Liabilities: In the government-wide and proprietary fund financial statements, long-term debt and other long-term obligations are reported as liabilities in the applicable governmental or business type activities column in the Statement of Net Position and the proprietary fund Statement of Net Position. In the governmental fund financial statements, the face amount of debt issued is reported as other financing sources. Issuance costs, whether or not withheld from the actual debt proceeds received, are reported as debt service expenditures. Pensions: For purposes of measuring the net pension liability, deferred outflows of resources and deferred inflows of resources related to pensions, and pension expense, information about the fiduciary net position of the City’s two pension systems, and additions to/deductions from the pensions’ fiduciary net position have been determined on the same basis as they are reported by each respective pension system. For this purpose, benefit payments (including refunds of employee contributions) are recognized when due and payable in accordance with the benefit terms. Investments are reported at fair value. The net pension liability attributable to the governmental activities will be paid primarily by the general fund. Total other post-employment benefits (OPEB) liability: For purposes of measuring the total OPEB liability, deferred outflows of resources, and deferred inflows of resources related to OPEB and OPEB expense, information has been determined based on the City’s actuary report. For this purpose, benefit payments are recognized when due and payable in accordance with the benefit terms. The total OPEB liability attributable to the governmental activities will be paid primarily by the general fund. Fund Balance: In the governmental fund financial statements, fund balances are classified as follows:
Nonspendable - Amounts which cannot be spent either because they are in a non-spendable form or because they are legally or contractually required to be maintained intact. Restricted - Amounts restricted to specific purposes when constraints placed on the use of the resources are either externally imposed by creditors, grantors, contributors, or laws or regulations of other governments imposed by law through constitutional provisions or enabling legislation.
Committed - Amounts which can be used only for specific purposes pursuant to constraints formally imposed by the highest level of decision-making authority. The City Council is the highest level of decision-making authority and can, through ordinance or resolution approved prior to fiscal year end, commit fund balance.
58
City of West Des Moines, Iowa NOTES TO BASIC FINANCIAL STATEMENTS
NOTE 1 SUMMARY OF SIGNIFICANT ACCOUNTING POLICIES (continued) Summary of Significant Accounting Policies (continued)
For the purpose of financial commitments, ordinances and resolutions are equally binding. Committed amounts cannot be used for any other purpose unless the City Council removes or changes the specified use by taking the same action it employed to commit those amounts. At this time no amounts have been committed by the City Council.
Assigned - Amounts the City intends to use for a specific purpose. The intent is expressed by the governing body itself, or a body or official to which the City has delegated the authority to assign amounts to be used for specific purposes. It does not require formal action of the City. At this time no amounts have been assigned nor has any specific authority to assign fund equity been delegated by the City, governing bodies or officials. Unassigned - All amounts not included in other spendable classifications. The General fund is the only fund that would report a positive amount in unassigned fund balance.
When an expenditure is incurred in governmental funds which can be paid using either restricted or unrestricted resources, it is the City’s policy to pay the expenditure from restricted fund balance and then from less-restrictive classifications of committed, assigned and then unassigned fund balance.
Net Position: Net position represents the difference between assets, deferred inflows of resources, liabilities, and deferred outflows of resources. Net investment in capital assets consists of capital assets, net of accumulated depreciation, reduced by the outstanding balances of any borrowings used for the acquisition, construction or improvement of those assets. Net investment in capital assets excludes unspent debt proceeds. As of June 30, 2020, the City had $31,396,209 in unspent debt proceeds available for projects in governmental funds. Net position is reported as restricted when there are limitations imposed on its use through enabling legislation or through external restrictions imposed by creditors, grantors or laws or regulations of other governments. Net position restricted through enabling legislation consists of $2,025,413 for retirement benefits, and $6,108,072 for tax increment projects. All other restrictions are imposed by outside parties through grants, debt agreements or donors. The City first applies restricted resources when an expense is incurred for purposes for which both restricted and unrestricted net position are available. Use of Estimates: The preparation of financial statements in conformity with accounting principles generally accepted in the United States of America requires management to make estimates and assumptions that affect the reported amounts of assets and liabilities and disclosure of contingent assets and liabilities at the date of the basic financial statements and the reported amounts of revenues and expenses during the reporting period. Actual results could differ from those estimates.
NOTE 2 CASH AND INVESTMENTS As of June 30, 2020, the City's cash and investments were as follows: Cash and investments, statement of net position $115,906,711 Restricted cash and investments 50,742,322 Cash and investments, fiduciary funds 796,682 $167,445,715 As of June 30, 2020, the City had investments in U.S. Agency coupon securities with a fair value of $20,226,590. The City categorized its fair value measurement within the fair value hierarchy established by generally accepted accounting principles. The hierarchy is based on the valuation inputs used to measure the fair value of the asset. Level 1 inputs are quoted prices in active markets for identical assets. Level 2 inputs are significant other observable
59
City of West Des Moines, Iowa NOTES TO BASIC FINANCIAL STATEMENTS
NOTE 2 CASH AND INVESTMENTS (continued) inputs. Level 3 inputs are significant unobservable inputs. All of the City’s investments in U.S. Agency coupon securities are valued using significant other observable inputs (level 2 inputs). There have been no changes in valuation methodologies at June 30, 2020 compared to June 30, 2019. Authorized Investments: The City is authorized by statute to invest public funds in obligations of the United States government, its agencies and instrumentalities; certificates of deposit or other evidences of deposit at federally insured depository institutions approved by the City Council; prime eligible bankers acceptances; certain high-rated commercial paper; perfected repurchase agreements; certain registered open-end management investment companies; certain joint investment trusts; and warrants or improvement certificates of a drainage district. However, the City's investment policy additionally limits investments in commercial paper to obligations at the time of purchase rated within the two highest ratings issued by nationally recognized statistical rating organizations with a maturity less than 270 days. Interest Rate Risk: Interest rate risk is the risk that changes in market interest rates will adversely affect the fair value of an investment. Generally, the longer the maturity of an investment the greater the sensitivity of its fair value to changes in market interest rates. In accordance with the City's investment policy, the City minimizes the fair value risk of investments in the portfolio by structuring its investment portfolio so that securities mature to meet cash requirements for operations, thereby avoiding the need to sell securities in the open market prior to maturity. The City employs a laddered maturity approach to its investments in U.S. Agency coupon securities. Within 12 months, $7,678,108 of the fair value will mature. An additional $12,548,482 will mature between 13 and 24 months. Credit Risk: Generally, credit risk is the risk that an issuer of an investment will not fulfill its obligation to the holder of the investment. This is measured by the assignment of a rating by a nationally recognized statistical rating organization. The City’s investment policy limits investments in commercial paper and other corporate debt to the top two highest classifications. The City did not invest in any commercial paper or other corporate debt during the year. All $20,226,590 of the fair value invested in U.S. Agency coupon securities are rated Aaa by Fitch, Standard and Poor’s, and Moody’s. The City adheres to investment policies established in the State of Iowa code. Concentration of Credit Risk: The City's investment policy seeks diversification to reduce overall portfolio risk while attaining market rates of return to enable the City to meet all anticipated cash requirements. The policy limits the City to holding a minimum of 5% of the total portfolio in highly marketable short-term treasuries, short-term federal government agencies, checking with interest, government pooled account or a combination of all four. The policy limits investments in order to avoid over-concentration in securities of a specific issuer and limits certificates of deposit to the amount approved by City Council for each financial institution in accordance with the Code of Iowa. Custodial Credit Risk-Deposits: Custodial credit risk for deposits is the risk that, in the event of the failure of a depository financial institution, a government will not be able to recover its deposits or will not be able to recover collateral securities that are in the possession of an outside party. It is the City’s policy to require that time deposits in excess of FDIC insurance limits be secured by collateral or private insurance to protect public deposits in a single financial institution if it were to default. Chapter 12C of the Code of Iowa requires all City funds be deposited into an approved depository and be either insured or collateralized. As of June 30, 2020, the City’s deposits with financial institutions were entirely covered by federal depository insurance or insured by the state through pooled collateral, state sinking funds and by the state’s ability to assess for lost funds. The City’s investments were covered by investments purchased and held by an independent third party. Custodial Credit Risk-Investments: For an investment, this is the risk that, in the event of the failure of the counterparty, the City will not be able to recover the value of its investments or collateral securities that are in the possession of an outside party. The City had no custodial risk with regards to investments since all investments were held by the City or its agent in the City’s name.
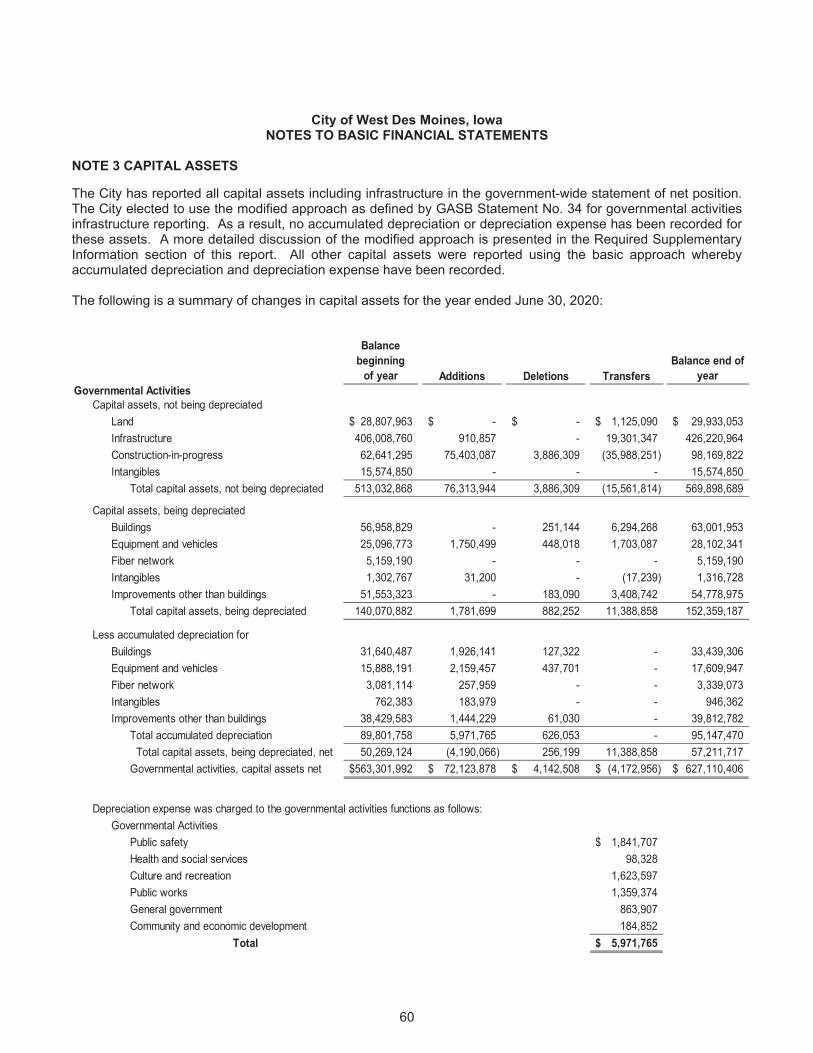
60
City of West Des Moines, Iowa NOTES TO BASIC FINANCIAL STATEMENTS
NOTE 3 CAPITAL ASSETS The City has reported all capital assets including infrastructure in the government-wide statement of net position. The City elected to use the modified approach as defined by GASB Statement No. 34 for governmental activities infrastructure reporting. As a result, no accumulated depreciation or depreciation expense has been recorded for these assets. A more detailed discussion of the modified approach is presented in the Required Supplementary Information section of this report. All other capital assets were reported using the basic approach whereby accumulated depreciation and depreciation expense have been recorded. The following is a summary of changes in capital assets for the year ended June 30, 2020:
Balance beginning
of year Additions Deletions TransfersBalance end of
yearGovernmental Activities
Capital assets, not being depreciatedLand 28,807,963$ -$ -$ 1,125,090$ 29,933,053$ Infrastructure 406,008,760 910,857 - 19,301,347 426,220,964 Construction-in-progress 62,641,295 75,403,087 3,886,309 (35,988,251) 98,169,822 Intangibles 15,574,850 - - - 15,574,850
Total capital assets, not being depreciated 513,032,868 76,313,944 3,886,309 (15,561,814) 569,898,689
Capital assets, being depreciatedBuildings 56,958,829 - 251,144 6,294,268 63,001,953 Equipment and vehicles 25,096,773 1,750,499 448,018 1,703,087 28,102,341 Fiber network 5,159,190 - - - 5,159,190 Intangibles 1,302,767 31,200 - (17,239) 1,316,728 Improvements other than buildings 51,553,323 - 183,090 3,408,742 54,778,975
Total capital assets, being depreciated 140,070,882 1,781,699 882,252 11,388,858 152,359,187
Less accumulated depreciation forBuildings 31,640,487 1,926,141 127,322 - 33,439,306 Equipment and vehicles 15,888,191 2,159,457 437,701 - 17,609,947 Fiber network 3,081,114 257,959 - - 3,339,073 Intangibles 762,383 183,979 - - 946,362 Improvements other than buildings 38,429,583 1,444,229 61,030 - 39,812,782
Total accumulated depreciation 89,801,758 5,971,765 626,053 - 95,147,470 Total capital assets, being depreciated, net 50,269,124 (4,190,066) 256,199 11,388,858 57,211,717 Governmental activities, capital assets net 563,301,992$ 72,123,878$ 4,142,508$ (4,172,956)$ 627,110,406$
Depreciation expense was charged to the governmental activities functions as follows:Governmental Activities
Public safety 1,841,707$ Health and social services 98,328 Culture and recreation 1,623,597 Public works 1,359,374 General government 863,907 Community and economic development 184,852 Total 5,971,765$
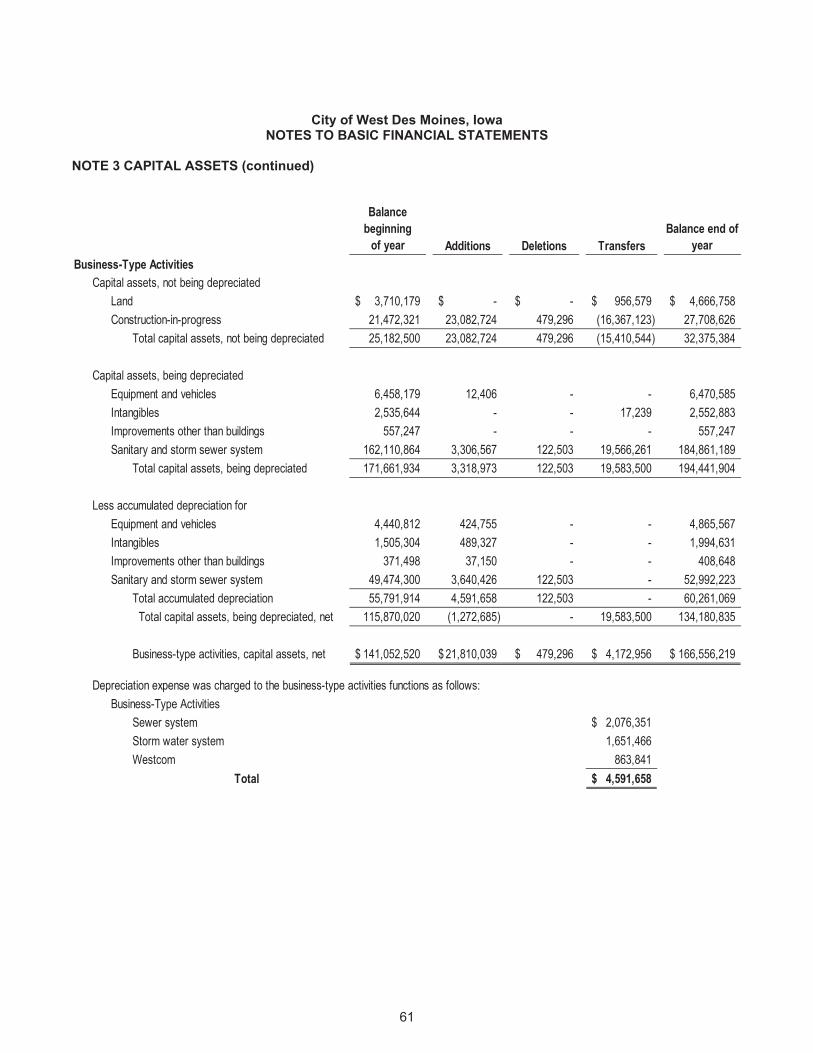
61
City of West Des Moines, Iowa NOTES TO BASIC FINANCIAL STATEMENTS
NOTE 3 CAPITAL ASSETS (continued)
Balance beginning
of year Additions Deletions TransfersBalance end of
yearBusiness-Type Activities
Capital assets, not being depreciatedLand 3,710,179$ -$ -$ 956,579$ 4,666,758$ Construction-in-progress 21,472,321 23,082,724 479,296 (16,367,123) 27,708,626
Total capital assets, not being depreciated 25,182,500 23,082,724 479,296 (15,410,544) 32,375,384
Capital assets, being depreciatedEquipment and vehicles 6,458,179 12,406 - - 6,470,585 Intangibles 2,535,644 - - 17,239 2,552,883 Improvements other than buildings 557,247 - - - 557,247 Sanitary and storm sewer system 162,110,864 3,306,567 122,503 19,566,261 184,861,189
Total capital assets, being depreciated 171,661,934 3,318,973 122,503 19,583,500 194,441,904
Less accumulated depreciation forEquipment and vehicles 4,440,812 424,755 - - 4,865,567 Intangibles 1,505,304 489,327 - - 1,994,631 Improvements other than buildings 371,498 37,150 - - 408,648 Sanitary and storm sewer system 49,474,300 3,640,426 122,503 - 52,992,223
Total accumulated depreciation 55,791,914 4,591,658 122,503 - 60,261,069 Total capital assets, being depreciated, net 115,870,020 (1,272,685) - 19,583,500 134,180,835
Business-type activities, capital assets, net 141,052,520$ 21,810,039$ 479,296$ 4,172,956$ 166,556,219$
Depreciation expense was charged to the business-type activities functions as follows:Business-Type Activities
Sewer system 2,076,351$ Storm water system 1,651,466 Westcom 863,841 Total 4,591,658$
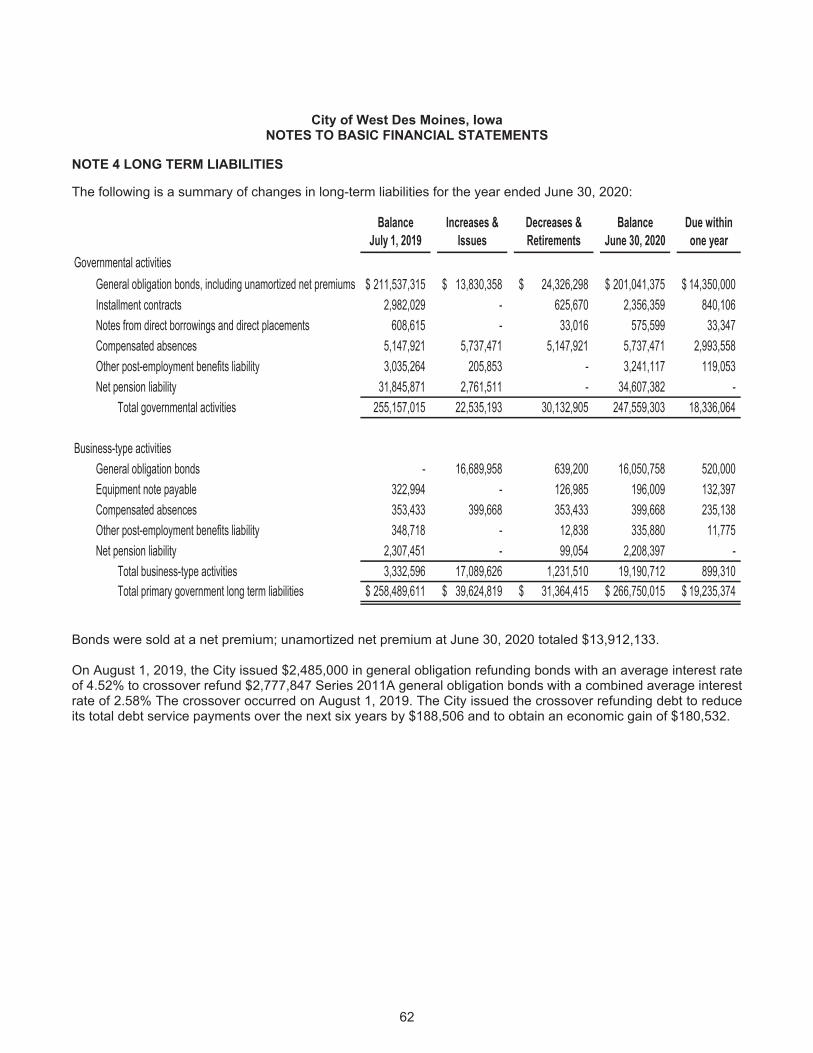
62
City of West Des Moines, Iowa NOTES TO BASIC FINANCIAL STATEMENTS
NOTE 4 LONG TERM LIABILITIES The following is a summary of changes in long-term liabilities for the year ended June 30, 2020:
Balance July 1, 2019
Increases & Issues
Decreases & Retirements
Balance June 30, 2020
Due within one year
Governmental activities211,537,315$ 13,830,358$ 24,326,298$ 201,041,375$ 14,350,000$
Installment contracts 2,982,029 - 625,670 2,356,359 840,106 Notes from direct borrowings and direct placements 608,615 - 33,016 575,599 33,347 Compensated absences 5,147,921 5,737,471 5,147,921 5,737,471 2,993,558 Other post-employment benefits liability 3,035,264 205,853 - 3,241,117 119,053 Net pension liability 31,845,871 2,761,511 - 34,607,382 -
Total governmental activities 255,157,015 22,535,193 30,132,905 247,559,303 18,336,064
Business-type activitiesGeneral obligation bonds - 16,689,958 639,200 16,050,758 520,000 Equipment note payable 322,994 - 126,985 196,009 132,397 Compensated absences 353,433 399,668 353,433 399,668 235,138 Other post-employment benefits liability 348,718 - 12,838 335,880 11,775 Net pension liability 2,307,451 - 99,054 2,208,397 -
Total business-type activities 3,332,596 17,089,626 1,231,510 19,190,712 899,310 Total primary government long term liabilities 258,489,611$ 39,624,819$ 31,364,415$ 266,750,015$ 19,235,374$
General obligation bonds, including unamortized net premiums
Bonds were sold at a net premium; unamortized net premium at June 30, 2020 totaled $13,912,133. On August 1, 2019, the City issued $2,485,000 in general obligation refunding bonds with an average interest rate of 4.52% to crossover refund $2,777,847 Series 2011A general obligation bonds with a combined average interest rate of 2.58% The crossover occurred on August 1, 2019. The City issued the crossover refunding debt to reduce its total debt service payments over the next six years by $188,506 and to obtain an economic gain of $180,532.
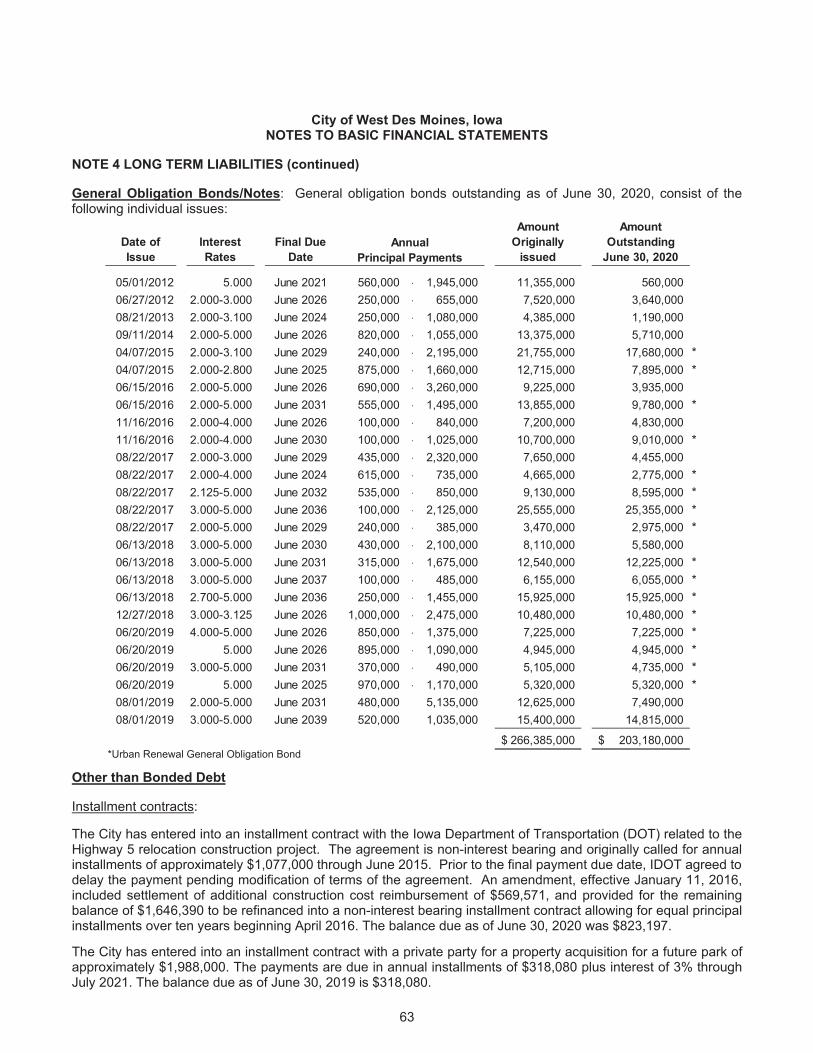
63
City of West Des Moines, Iowa NOTES TO BASIC FINANCIAL STATEMENTS
NOTE 4 LONG TERM LIABILITIES (continued) General Obligation Bonds/Notes: General obligation bonds outstanding as of June 30, 2020, consist of the following individual issues:
Date of Issue
Interest Rates
Final Due Date
Amount Originally
issued
Amount Outstanding
June 30, 2020
05/01/2012 5.000 June 2021 560,000 - 1,945,000 11,355,000 560,000 06/27/2012 2.000-3.000 June 2026 250,000 - 655,000 7,520,000 3,640,000 08/21/2013 2.000-3.100 June 2024 250,000 - 1,080,000 4,385,000 1,190,000 09/11/2014 2.000-5.000 June 2026 820,000 - 1,055,000 13,375,000 5,710,000 04/07/2015 2.000-3.100 June 2029 240,000 - 2,195,000 21,755,000 17,680,000 *04/07/2015 2.000-2.800 June 2025 875,000 - 1,660,000 12,715,000 7,895,000 *06/15/2016 2.000-5.000 June 2026 690,000 - 3,260,000 9,225,000 3,935,000 06/15/2016 2.000-5.000 June 2031 555,000 - 1,495,000 13,855,000 9,780,000 *11/16/2016 2.000-4.000 June 2026 100,000 - 840,000 7,200,000 4,830,000 11/16/2016 2.000-4.000 June 2030 100,000 - 1,025,000 10,700,000 9,010,000 *08/22/2017 2.000-3.000 June 2029 435,000 - 2,320,000 7,650,000 4,455,000 08/22/2017 2.000-4.000 June 2024 615,000 - 735,000 4,665,000 2,775,000 *08/22/2017 2.125-5.000 June 2032 535,000 - 850,000 9,130,000 8,595,000 *08/22/2017 3.000-5.000 June 2036 100,000 - 2,125,000 25,555,000 25,355,000 *08/22/2017 2.000-5.000 June 2029 240,000 - 385,000 3,470,000 2,975,000 *06/13/2018 3.000-5.000 June 2030 430,000 - 2,100,000 8,110,000 5,580,000 06/13/2018 3.000-5.000 June 2031 315,000 - 1,675,000 12,540,000 12,225,000 *06/13/2018 3.000-5.000 June 2037 100,000 - 485,000 6,155,000 6,055,000 *06/13/2018 2.700-5.000 June 2036 250,000 - 1,455,000 15,925,000 15,925,000 *12/27/2018 3.000-3.125 June 2026 1,000,000 - 2,475,000 10,480,000 10,480,000 *06/20/2019 4.000-5.000 June 2026 850,000 - 1,375,000 7,225,000 7,225,000 *06/20/2019 5.000 June 2026 895,000 - 1,090,000 4,945,000 4,945,000 *06/20/2019 3.000-5.000 June 2031 370,000 - 490,000 5,105,000 4,735,000 *06/20/2019 5.000 June 2025 970,000 - 1,170,000 5,320,000 5,320,000 *08/01/2019 2.000-5.000 June 2031 480,000 5,135,000 12,625,000 7,490,000 08/01/2019 3.000-5.000 June 2039 520,000 1,035,000 15,400,000 14,815,000
266,385,000$ 203,180,000$ *Urban Renewal General Obligation Bond
Annual Principal Payments
Other than Bonded Debt Installment contracts: The City has entered into an installment contract with the Iowa Department of Transportation (DOT) related to the Highway 5 relocation construction project. The agreement is non-interest bearing and originally called for annual installments of approximately $1,077,000 through June 2015. Prior to the final payment due date, IDOT agreed to delay the payment pending modification of terms of the agreement. An amendment, effective January 11, 2016, included settlement of additional construction cost reimbursement of $569,571, and provided for the remaining balance of $1,646,390 to be refinanced into a non-interest bearing installment contract allowing for equal principal installments over ten years beginning April 2016. The balance due as of June 30, 2020 was $823,197. The City has entered into an installment contract with a private party for a property acquisition for a future park of approximately $1,988,000. The payments are due in annual installments of $318,080 plus interest of 3% through July 2021. The balance due as of June 30, 2019 is $318,080.
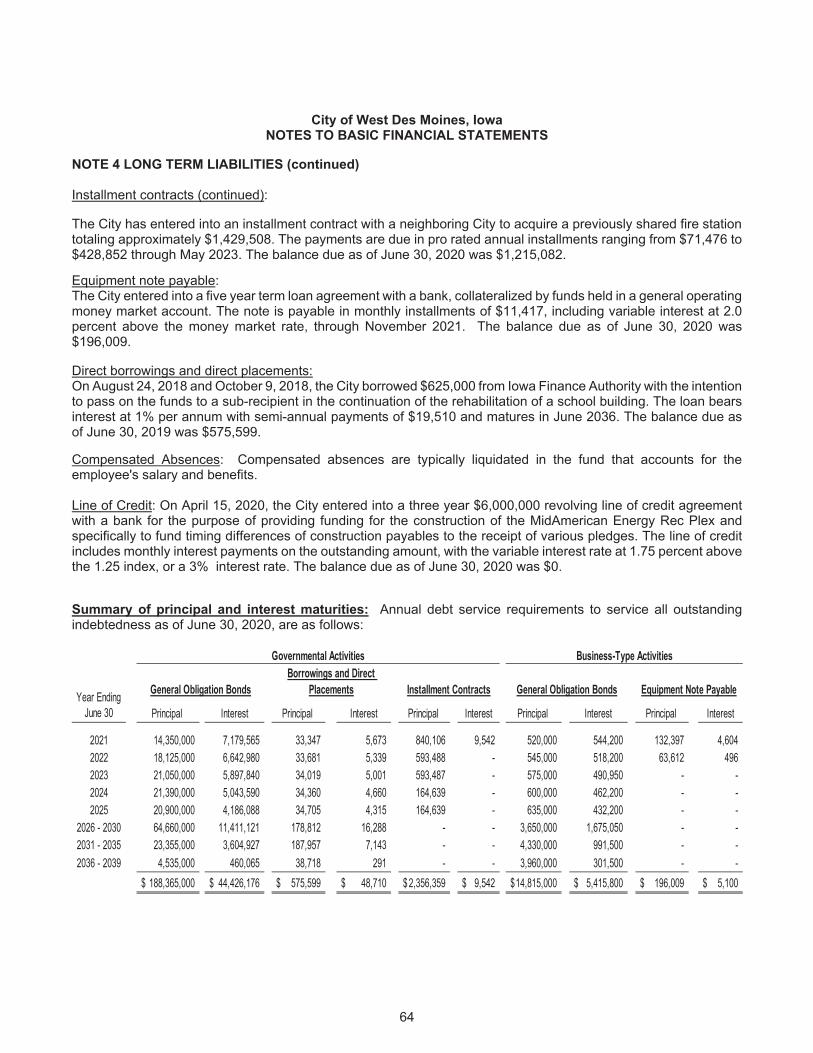
64
City of West Des Moines, Iowa NOTES TO BASIC FINANCIAL STATEMENTS
NOTE 4 LONG TERM LIABILITIES (continued) Installment contracts (continued): The City has entered into an installment contract with a neighboring City to acquire a previously shared fire station totaling approximately $1,429,508. The payments are due in pro rated annual installments ranging from $71,476 to $428,852 through May 2023. The balance due as of June 30, 2020 was $1,215,082. Equipment note payable: The City entered into a five year term loan agreement with a bank, collateralized by funds held in a general operating money market account. The note is payable in monthly installments of $11,417, including variable interest at 2.0 percent above the money market rate, through November 2021. The balance due as of June 30, 2020 was $196,009. Direct borrowings and direct placements: On August 24, 2018 and October 9, 2018, the City borrowed $625,000 from Iowa Finance Authority with the intention to pass on the funds to a sub-recipient in the continuation of the rehabilitation of a school building. The loan bears interest at 1% per annum with semi-annual payments of $19,510 and matures in June 2036. The balance due as of June 30, 2019 was $575,599. Compensated Absences: Compensated absences are typically liquidated in the fund that accounts for the employee's salary and benefits. Line of Credit: On April 15, 2020, the City entered into a three year $6,000,000 revolving line of credit agreement with a bank for the purpose of providing funding for the construction of the MidAmerican Energy Rec Plex and specifically to fund timing differences of construction payables to the receipt of various pledges. The line of credit includes monthly interest payments on the outstanding amount, with the variable interest rate at 1.75 percent above the 1.25 index, or a 3% interest rate. The balance due as of June 30, 2020 was $0. Summary of principal and interest maturities: Annual debt service requirements to service all outstanding indebtedness as of June 30, 2020, are as follows:
Principal Interest Principal Interest Principal Interest Principal Interest Principal Interest
2021 14,350,000 7,179,565 33,347 5,673 840,106 9,542 520,000 544,200 132,397 4,604 2022 18,125,000 6,642,980 33,681 5,339 593,488 - 545,000 518,200 63,612 496 2023 21,050,000 5,897,840 34,019 5,001 593,487 - 575,000 490,950 - - 2024 21,390,000 5,043,590 34,360 4,660 164,639 - 600,000 462,200 - - 2025 20,900,000 4,186,088 34,705 4,315 164,639 - 635,000 432,200 - -
2026 - 2030 64,660,000 11,411,121 178,812 16,288 - - 3,650,000 1,675,050 - - 2031 - 2035 23,355,000 3,604,927 187,957 7,143 - - 4,330,000 991,500 - - 2036 - 2039 4,535,000 460,065 38,718 291 - - 3,960,000 301,500 - -
188,365,000$ 44,426,176$ 575,599$ 48,710$ 2,356,359$ 9,542$ 14,815,000$ 5,415,800$ 196,009$ 5,100$
Year Ending June 30
Equipment Note Payable
Governmental Activities
General Obligation Bonds Installment ContractsBorrowings and Direct
Placements General Obligation Bonds
Business-Type Activities
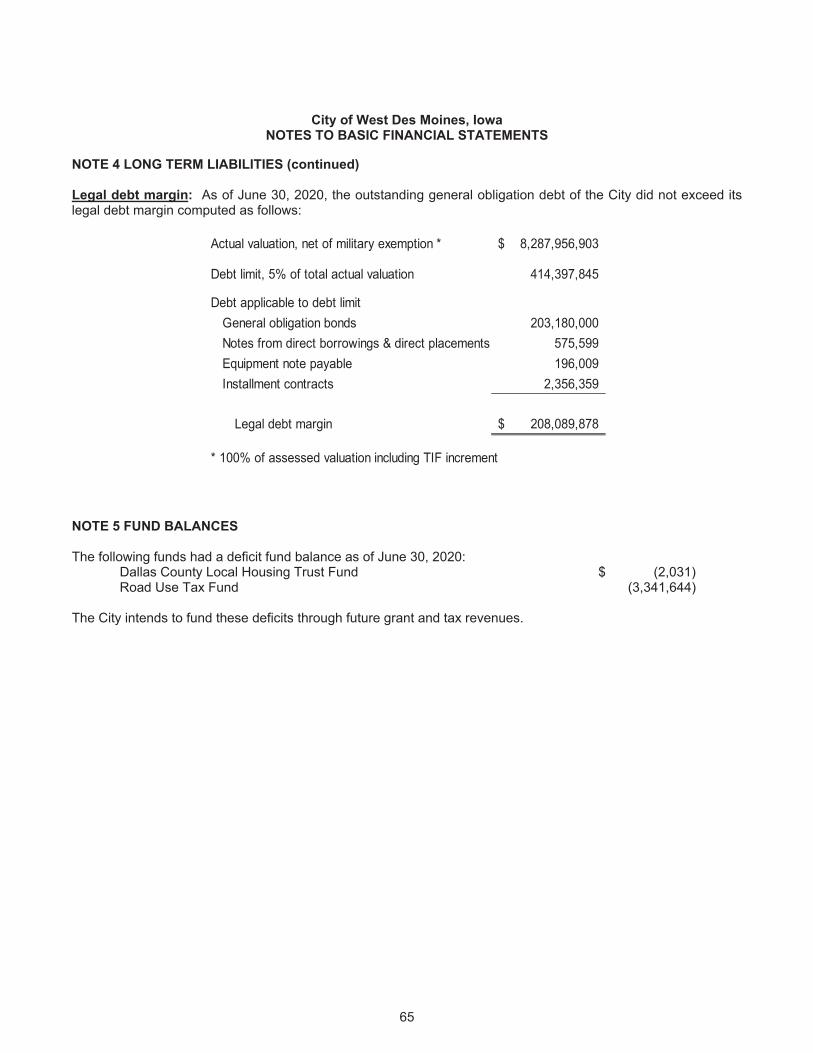
65
City of West Des Moines, Iowa NOTES TO BASIC FINANCIAL STATEMENTS
NOTE 4 LONG TERM LIABILITIES (continued) Legal debt margin: As of June 30, 2020, the outstanding general obligation debt of the City did not exceed its legal debt margin computed as follows:
Actual valuation, net of military exemption * 8,287,956,903$
Debt limit, 5% of total actual valuation 414,397,845
Debt applicable to debt limitGeneral obligation bonds 203,180,000 Notes from direct borrowings & direct placements 575,599 Equipment note payable 196,009 Installment contracts 2,356,359
Legal debt margin 208,089,878$
* 100% of assessed valuation including TIF increment
NOTE 5 FUND BALANCES The following funds had a deficit fund balance as of June 30, 2020: Dallas County Local Housing Trust Fund $ (2,031) Road Use Tax Fund (3,341,644) The City intends to fund these deficits through future grant and tax revenues.
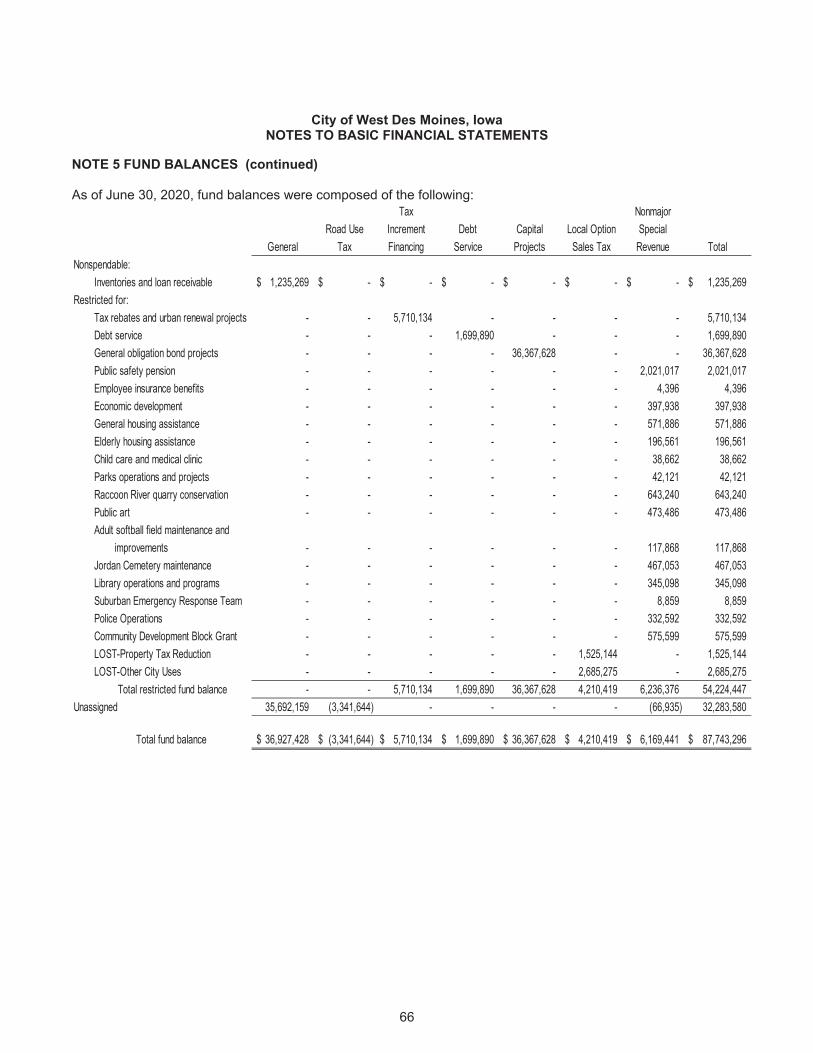
66
City of West Des Moines, Iowa NOTES TO BASIC FINANCIAL STATEMENTS
NOTE 5 FUND BALANCES (continued) As of June 30, 2020, fund balances were composed of the following:
Tax NonmajorRoad Use Increment Debt Capital Local Option Special
General Tax Financing Service Projects Sales Tax Revenue TotalNonspendable:
Inventories and loan receivable 1,235,269$ -$ -$ -$ -$ -$ -$ 1,235,269$ Restricted for:
Tax rebates and urban renewal projects - - 5,710,134 - - - - 5,710,134 Debt service - - - 1,699,890 - - - 1,699,890 General obligation bond projects - - - - 36,367,628 - - 36,367,628 Public safety pension - - - - - - 2,021,017 2,021,017 Employee insurance benefits - - - - - - 4,396 4,396 Economic development - - - - - - 397,938 397,938 General housing assistance - - - - - - 571,886 571,886 Elderly housing assistance - - - - - - 196,561 196,561 Child care and medical clinic - - - - - - 38,662 38,662 Parks operations and projects - - - - - - 42,121 42,121 Raccoon River quarry conservation - - - - - - 643,240 643,240 Public art - - - - - - 473,486 473,486 Adult softball field maintenance and
improvements - - - - - - 117,868 117,868 Jordan Cemetery maintenance - - - - - - 467,053 467,053 Library operations and programs - - - - - - 345,098 345,098 Suburban Emergency Response Team - - - - - - 8,859 8,859 Police Operations - - - - - - 332,592 332,592 Community Development Block Grant - - - - - - 575,599 575,599 LOST-Property Tax Reduction - - - - - 1,525,144 - 1,525,144 LOST-Other City Uses - - - - - 2,685,275 - 2,685,275
Total restricted fund balance - - 5,710,134 1,699,890 36,367,628 4,210,419 6,236,376 54,224,447 Unassigned 35,692,159 (3,341,644) - - - - (66,935) 32,283,580
Total fund balance 36,927,428$ (3,341,644)$ 5,710,134$ 1,699,890$ 36,367,628$ 4,210,419$ 6,169,441$ 87,743,296$
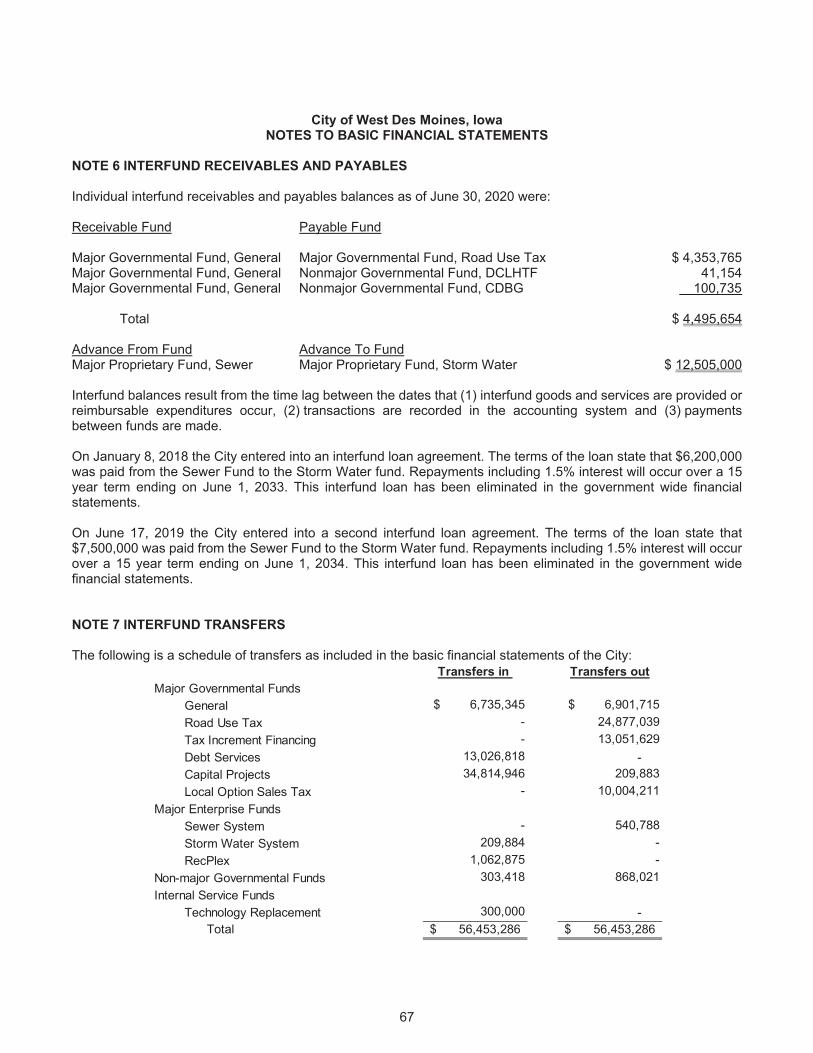
67
City of West Des Moines, Iowa NOTES TO BASIC FINANCIAL STATEMENTS
NOTE 6 INTERFUND RECEIVABLES AND PAYABLES Individual interfund receivables and payables balances as of June 30, 2020 were: Receivable Fund Payable Fund Major Governmental Fund, General Major Governmental Fund, Road Use Tax $ 4,353,765 Major Governmental Fund, General Nonmajor Governmental Fund, DCLHTF 41,154 Major Governmental Fund, General Nonmajor Governmental Fund, CDBG 100,735 Total $ 4,495,654 Advance From Fund Advance To Fund Major Proprietary Fund, Sewer Major Proprietary Fund, Storm Water $ 12,505,000 Interfund balances result from the time lag between the dates that (1) interfund goods and services are provided or reimbursable expenditures occur, (2) transactions are recorded in the accounting system and (3) payments between funds are made. On January 8, 2018 the City entered into an interfund loan agreement. The terms of the loan state that $6,200,000 was paid from the Sewer Fund to the Storm Water fund. Repayments including 1.5% interest will occur over a 15 year term ending on June 1, 2033. This interfund loan has been eliminated in the government wide financial statements. On June 17, 2019 the City entered into a second interfund loan agreement. The terms of the loan state that $7,500,000 was paid from the Sewer Fund to the Storm Water fund. Repayments including 1.5% interest will occur over a 15 year term ending on June 1, 2034. This interfund loan has been eliminated in the government wide financial statements.
NOTE 7 INTERFUND TRANSFERS The following is a schedule of transfers as included in the basic financial statements of the City:
Transfers in Transfers outMajor Governmental Funds
General $ 6,735,345 $ 6,901,715 Road Use Tax - 24,877,039 Tax Increment Financing - 13,051,629 Debt Services 13,026,818 - Capital Projects 34,814,946 209,883 Local Option Sales Tax - 10,004,211
Major Enterprise FundsSewer System - 540,788 Storm Water System 209,884 - RecPlex 1,062,875 -
Non-major Governmental Funds 303,418 868,021 Internal Service Funds
Technology Replacement 300,000 - Total 56,453,286$ 56,453,286$
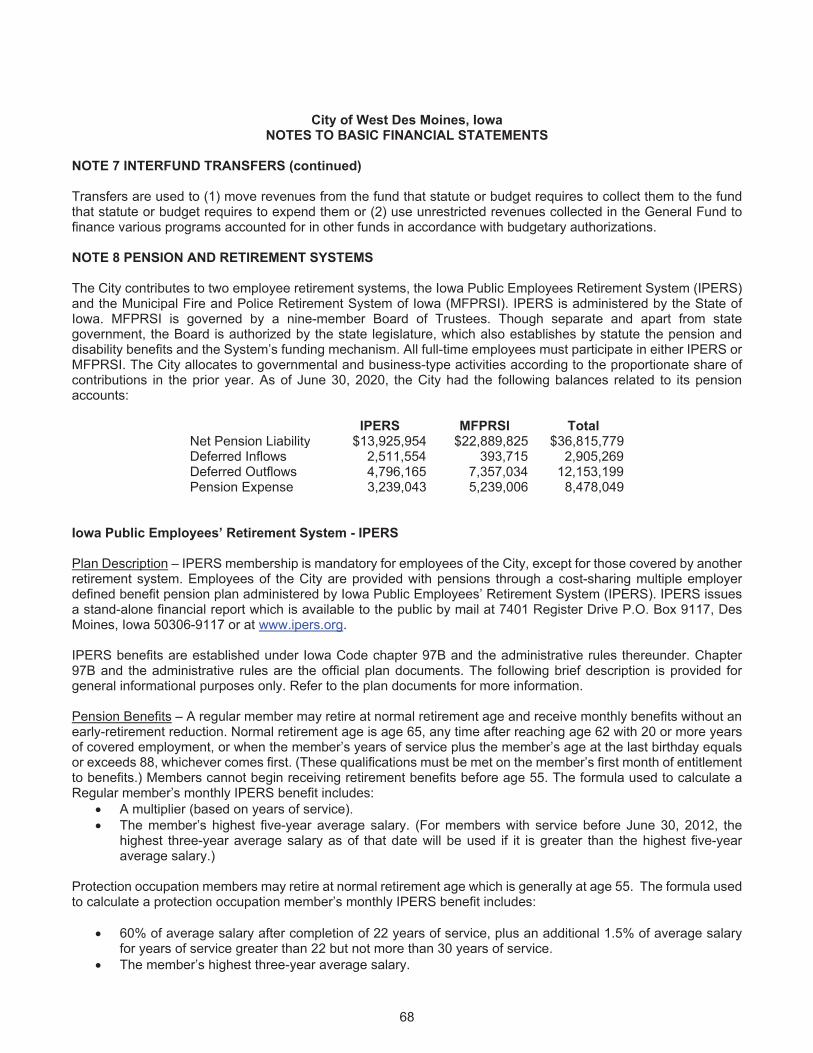
68
City of West Des Moines, Iowa NOTES TO BASIC FINANCIAL STATEMENTS
NOTE 7 INTERFUND TRANSFERS (continued) Transfers are used to (1) move revenues from the fund that statute or budget requires to collect them to the fund that statute or budget requires to expend them or (2) use unrestricted revenues collected in the General Fund to finance various programs accounted for in other funds in accordance with budgetary authorizations. NOTE 8 PENSION AND RETIREMENT SYSTEMS The City contributes to two employee retirement systems, the Iowa Public Employees Retirement System (IPERS) and the Municipal Fire and Police Retirement System of Iowa (MFPRSI). IPERS is administered by the State of Iowa. MFPRSI is governed by a nine-member Board of Trustees. Though separate and apart from state government, the Board is authorized by the state legislature, which also establishes by statute the pension and disability benefits and the System’s funding mechanism. All full-time employees must participate in either IPERS or MFPRSI. The City allocates to governmental and business-type activities according to the proportionate share of contributions in the prior year. As of June 30, 2020, the City had the following balances related to its pension accounts:
IPERS MFPRSI Total Net Pension Liability $13,925,954 $22,889,825 $36,815,779 Deferred Inflows 2,511,554 393,715 2,905,269 Deferred Outflows 4,796,165 7,357,034 12,153,199 Pension Expense 3,239,043 5,239,006 8,478,049
Iowa Public Employees’ Retirement System - IPERS Plan Description – IPERS membership is mandatory for employees of the City, except for those covered by another retirement system. Employees of the City are provided with pensions through a cost-sharing multiple employer defined benefit pension plan administered by Iowa Public Employees’ Retirement System (IPERS). IPERS issues a stand-alone financial report which is available to the public by mail at 7401 Register Drive P.O. Box 9117, Des Moines, Iowa 50306-9117 or at www.ipers.org. IPERS benefits are established under Iowa Code chapter 97B and the administrative rules thereunder. Chapter 97B and the administrative rules are the official plan documents. The following brief description is provided for general informational purposes only. Refer to the plan documents for more information. Pension Benefits – A regular member may retire at normal retirement age and receive monthly benefits without an early-retirement reduction. Normal retirement age is age 65, any time after reaching age 62 with 20 or more years of covered employment, or when the member’s years of service plus the member’s age at the last birthday equals or exceeds 88, whichever comes first. (These qualifications must be met on the member’s first month of entitlement to benefits.) Members cannot begin receiving retirement benefits before age 55. The formula used to calculate a Regular member’s monthly IPERS benefit includes:
A multiplier (based on years of service). The member’s highest five-year average salary. (For members with service before June 30, 2012, the
highest three-year average salary as of that date will be used if it is greater than the highest five-year average salary.)
Protection occupation members may retire at normal retirement age which is generally at age 55. The formula used to calculate a protection occupation member’s monthly IPERS benefit includes:
60% of average salary after completion of 22 years of service, plus an additional 1.5% of average salary for years of service greater than 22 but not more than 30 years of service.
The member’s highest three-year average salary.
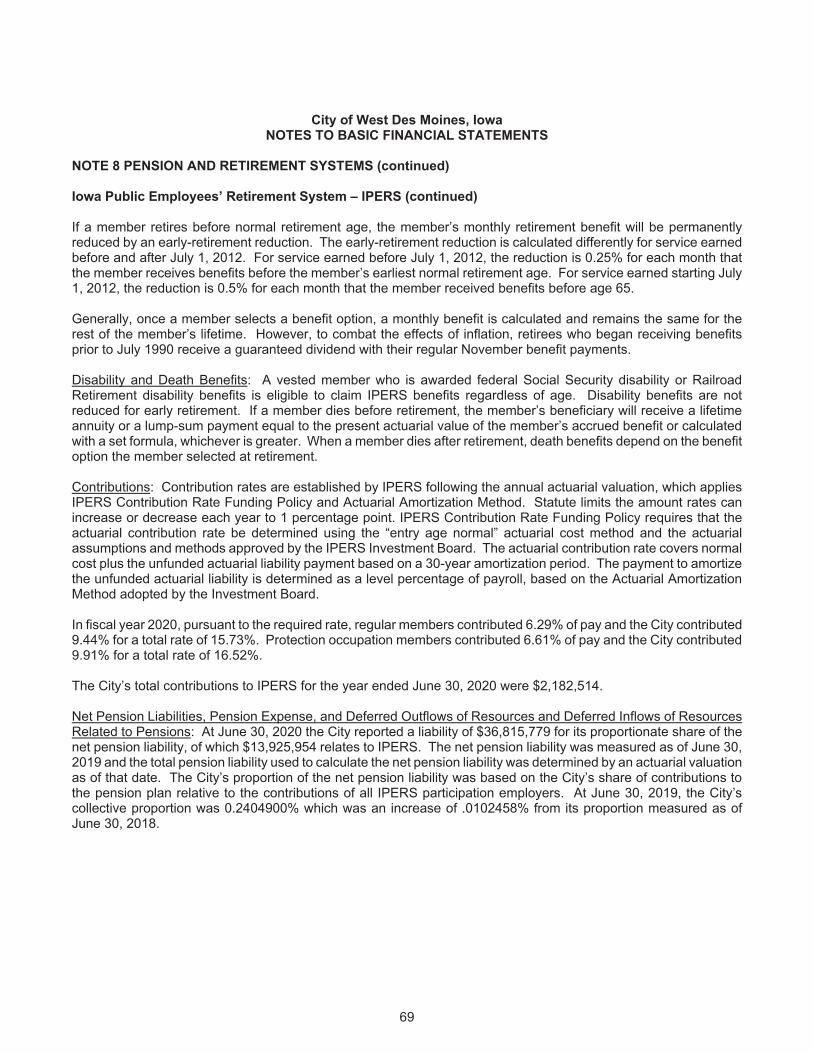
69
City of West Des Moines, Iowa NOTES TO BASIC FINANCIAL STATEMENTS
NOTE 8 PENSION AND RETIREMENT SYSTEMS (continued) Iowa Public Employees’ Retirement System – IPERS (continued) If a member retires before normal retirement age, the member’s monthly retirement benefit will be permanently reduced by an early-retirement reduction. The early-retirement reduction is calculated differently for service earned before and after July 1, 2012. For service earned before July 1, 2012, the reduction is 0.25% for each month that the member receives benefits before the member’s earliest normal retirement age. For service earned starting July 1, 2012, the reduction is 0.5% for each month that the member received benefits before age 65. Generally, once a member selects a benefit option, a monthly benefit is calculated and remains the same for the rest of the member’s lifetime. However, to combat the effects of inflation, retirees who began receiving benefits prior to July 1990 receive a guaranteed dividend with their regular November benefit payments. Disability and Death Benefits: A vested member who is awarded federal Social Security disability or Railroad Retirement disability benefits is eligible to claim IPERS benefits regardless of age. Disability benefits are not reduced for early retirement. If a member dies before retirement, the member’s beneficiary will receive a lifetime annuity or a lump-sum payment equal to the present actuarial value of the member’s accrued benefit or calculated with a set formula, whichever is greater. When a member dies after retirement, death benefits depend on the benefit option the member selected at retirement. Contributions: Contribution rates are established by IPERS following the annual actuarial valuation, which applies IPERS Contribution Rate Funding Policy and Actuarial Amortization Method. Statute limits the amount rates can increase or decrease each year to 1 percentage point. IPERS Contribution Rate Funding Policy requires that the actuarial contribution rate be determined using the “entry age normal” actuarial cost method and the actuarial assumptions and methods approved by the IPERS Investment Board. The actuarial contribution rate covers normal cost plus the unfunded actuarial liability payment based on a 30-year amortization period. The payment to amortize the unfunded actuarial liability is determined as a level percentage of payroll, based on the Actuarial Amortization Method adopted by the Investment Board. In fiscal year 2020, pursuant to the required rate, regular members contributed 6.29% of pay and the City contributed 9.44% for a total rate of 15.73%. Protection occupation members contributed 6.61% of pay and the City contributed 9.91% for a total rate of 16.52%. The City’s total contributions to IPERS for the year ended June 30, 2020 were $2,182,514. Net Pension Liabilities, Pension Expense, and Deferred Outflows of Resources and Deferred Inflows of Resources Related to Pensions: At June 30, 2020 the City reported a liability of $36,815,779 for its proportionate share of the net pension liability, of which $13,925,954 relates to IPERS. The net pension liability was measured as of June 30, 2019 and the total pension liability used to calculate the net pension liability was determined by an actuarial valuation as of that date. The City’s proportion of the net pension liability was based on the City’s share of contributions to the pension plan relative to the contributions of all IPERS participation employers. At June 30, 2019, the City’s collective proportion was 0.2404900% which was an increase of .0102458% from its proportion measured as of June 30, 2018.
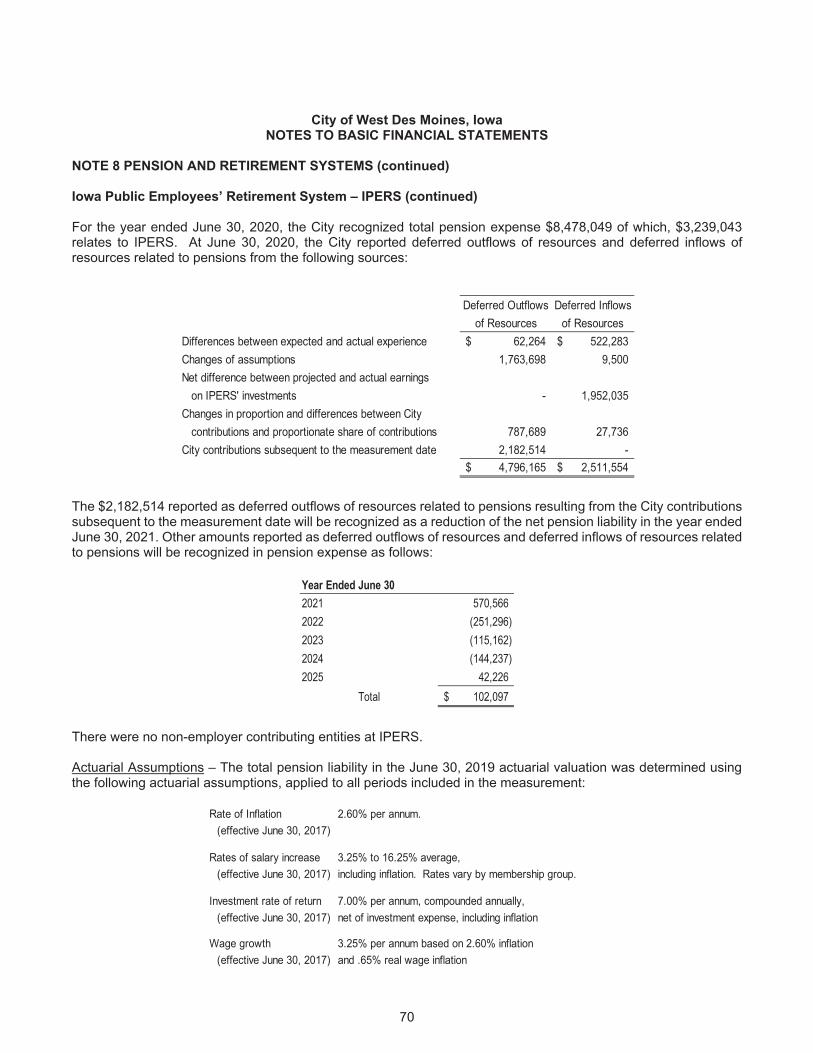
70
City of West Des Moines, Iowa NOTES TO BASIC FINANCIAL STATEMENTS
NOTE 8 PENSION AND RETIREMENT SYSTEMS (continued) Iowa Public Employees’ Retirement System – IPERS (continued) For the year ended June 30, 2020, the City recognized total pension expense $8,478,049 of which, $3,239,043 relates to IPERS. At June 30, 2020, the City reported deferred outflows of resources and deferred inflows of resources related to pensions from the following sources:
Deferred Outflows Deferred Inflowsof Resources of Resources
Differences between expected and actual experience 62,264$ 522,283$ Changes of assumptions 1,763,698 9,500 Net difference between projected and actual earnings on IPERS' investments - 1,952,035 Changes in proportion and differences between City contributions and proportionate share of contributions 787,689 27,736 City contributions subsequent to the measurement date 2,182,514 -
4,796,165$ 2,511,554$
The $2,182,514 reported as deferred outflows of resources related to pensions resulting from the City contributions subsequent to the measurement date will be recognized as a reduction of the net pension liability in the year ended June 30, 2021. Other amounts reported as deferred outflows of resources and deferred inflows of resources related to pensions will be recognized in pension expense as follows:
Year Ended June 302021 570,5662022 (251,296)2023 (115,162)2024 (144,237)2025 42,226
Total 102,097$
There were no non-employer contributing entities at IPERS. Actuarial Assumptions – The total pension liability in the June 30, 2019 actuarial valuation was determined using the following actuarial assumptions, applied to all periods included in the measurement:
Rate of Inflation 2.60% per annum.(effective June 30, 2017)
Rates of salary increase 3.25% to 16.25% average, (effective June 30, 2017) including inflation. Rates vary by membership group.
Investment rate of return 7.00% per annum, compounded annually,(effective June 30, 2017) net of investment expense, including inflation
Wage growth 3.25% per annum based on 2.60% inflation(effective June 30, 2017) and .65% real wage inflation
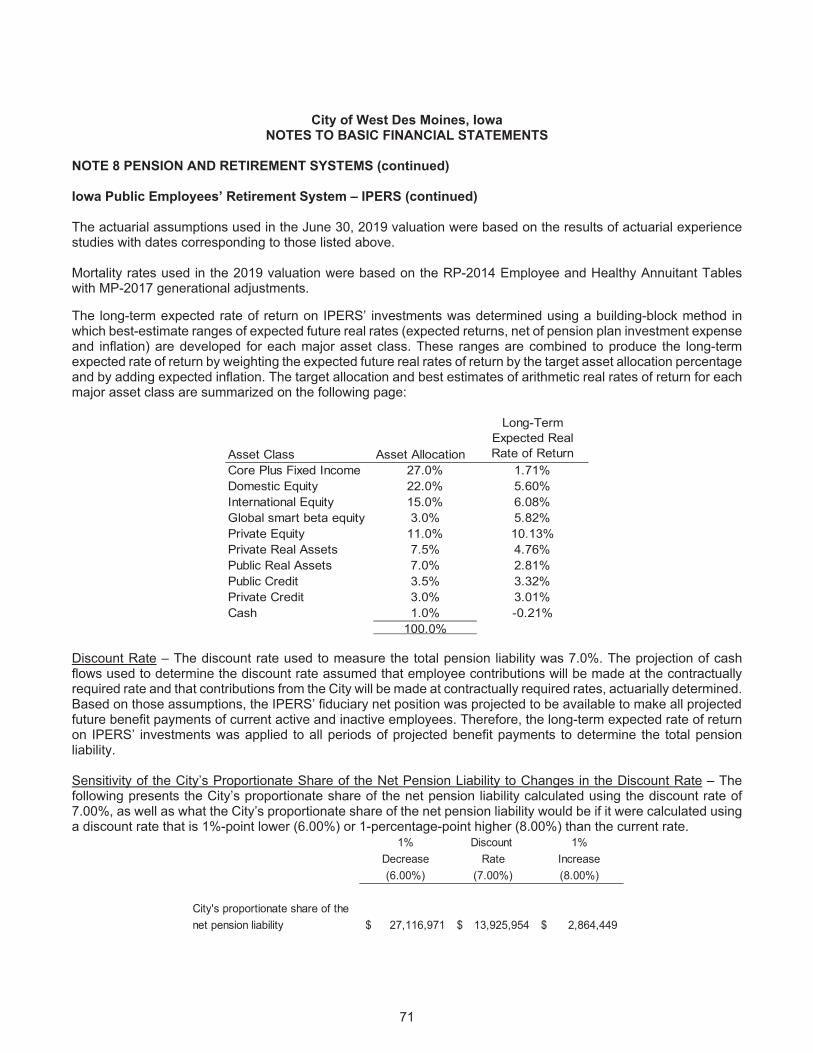
71
City of West Des Moines, Iowa NOTES TO BASIC FINANCIAL STATEMENTS
NOTE 8 PENSION AND RETIREMENT SYSTEMS (continued) Iowa Public Employees’ Retirement System – IPERS (continued)
The actuarial assumptions used in the June 30, 2019 valuation were based on the results of actuarial experience studies with dates corresponding to those listed above. Mortality rates used in the 2019 valuation were based on the RP-2014 Employee and Healthy Annuitant Tables with MP-2017 generational adjustments. The long-term expected rate of return on IPERS’ investments was determined using a building-block method in which best-estimate ranges of expected future real rates (expected returns, net of pension plan investment expense and inflation) are developed for each major asset class. These ranges are combined to produce the long-term expected rate of return by weighting the expected future real rates of return by the target asset allocation percentage and by adding expected inflation. The target allocation and best estimates of arithmetic real rates of return for each major asset class are summarized on the following page:
Asset Class Asset AllocationCore Plus Fixed Income 27.0% 1.71%Domestic Equity 22.0% 5.60%International Equity 15.0% 6.08%Global smart beta equity 3.0% 5.82%Private Equity 11.0% 10.13%Private Real Assets 7.5% 4.76%Public Real Assets 7.0% 2.81%Public Credit 3.5% 3.32%Private Credit 3.0% 3.01%Cash 1.0% -0.21%
100.0%
Long-Term Expected Real Rate of Return
Discount Rate – The discount rate used to measure the total pension liability was 7.0%. The projection of cash flows used to determine the discount rate assumed that employee contributions will be made at the contractually required rate and that contributions from the City will be made at contractually required rates, actuarially determined. Based on those assumptions, the IPERS’ fiduciary net position was projected to be available to make all projected future benefit payments of current active and inactive employees. Therefore, the long-term expected rate of return on IPERS’ investments was applied to all periods of projected benefit payments to determine the total pension liability. Sensitivity of the City’s Proportionate Share of the Net Pension Liability to Changes in the Discount Rate – The following presents the City’s proportionate share of the net pension liability calculated using the discount rate of 7.00%, as well as what the City’s proportionate share of the net pension liability would be if it were calculated using a discount rate that is 1%-point lower (6.00%) or 1-percentage-point higher (8.00%) than the current rate.
1% Discount 1%Decrease Rate Increase(6.00%) (7.00%) (8.00%)
City's proportionate share of thenet pension liability 27,116,971$ 13,925,954$ 2,864,449$
72
City of West Des Moines, Iowa NOTES TO BASIC FINANCIAL STATEMENTS
NOTE 8 PENSION AND RETIREMENT SYSTEMS (continued) Iowa Public Employees’ Retirement System – IPERS (continued) IPERS’ Plan Fiduciary Net Position – Detailed information about the pension plan’s fiduciary net position is available in the separately issued IPERS financial report which is available on IPERS’ website at www.ipers.org. Payables to IPERS’ – At June 30, 2020, the City reported payables to the defined benefit pension plan of $0 for legally required employer contributions and $0 for legally required employee contributions which had been withheld from employee wages but not yet remitted to IPERS. Municipal Fire & Police Retirement System - MFPRSI Plan Description – MFPRSI membership is mandatory for fire fighters and police officers covered by the provisions of Chapter 411 of the Code of Iowa. Employees of the City are provided with pensions through a cost-sharing multiple employer defined benefit pension plan administered by MFPRSI. MFPRSI issues a stand-alone financial report which is available to the public by mail at 7155 Lake Drive, Suite #201, West Des Moines, Iowa 50266 or at www.mfprsi.org.
MFPRSI benefits are established under Chapter 411 of the Code of Iowa and the administrative rules thereunder. Chapter 411 of the Code of Iowa and the administrative rules are the official plan documents. The following brief description is provided for general informational purposes only. Refer to the plan documents for more information. Pension Benefits - Members with 4 or more years of service are entitled to pension benefits beginning at age 55. Full service retirement benefits are granted to members with 22 years of service, while partial benefits are available to those members with 4 to 22 years of service based on the ratio of years completed to years required (i.e., 22 years). Members with less than 4 years of service are entitled to a refund of their contribution only, with interest, for the period of employment.
Benefits are calculated based upon the member’s highest 3 years of compensation. The average of these 3 years becomes the member’s average final compensation. The base benefit is 66% of the member’s average final compensation. Members who perform more than 22 years of service receive an additional 2% of the member’s average final compensation for each additional year of service up to a maximum of 8 years. Survivor benefits are available to the beneficiary of a retired member according to the provisions of the benefit option chosen plus an additional benefit for each child. Survivor benefits are subject to a minimum benefit for those members who chose the basic benefit with a 50% surviving spouse benefit.
Active members, at least 55 years of age, with 22 or more years of service have the option to participate in the Deferred Retirement Option Program (DROP). The DROP is an arrangement whereby a member who is otherwise eligible to retire and commence benefits opts to continue to work. A member can elect a 3, 4, or 5 year DROP period. By electing to participate in DROP the member is signing a contract indicating the member will retire at the end of the selected DROP period. During the DROP period, the member’s retirement benefit is frozen and a DROP benefit is credited to a DROP account established for the member. Assuming the member completes the DROP period, the DROP benefit is equal to 52% of the member’s retirement benefit at the member’s earliest date eligible and 100% if the member delays enrollment for 24 months. At the member’s actual date of retirement, the member’s DROP account will be distributed to the member in the form of a lump sum or rollover to an eligible plan.
Disability and Death Benefits – Disability benefits may be either accidental or ordinary. Accidental disability is defined as permanent disability incurred in the line of duty, with benefits equivalent to the greater of 60% of the member’s average final compensation or the member’s service retirement benefit calculation amount. Ordinary disability occurs outside the call of duty and pays benefits equivalent to the greater of 50% of the member’s average final compensation, for those with 5 or more years of service, or the member’s service retirement benefit calculation amount, and 25% of average final compensation for those with less than 5 years of service.
73
City of West Des Moines, Iowa NOTES TO BASIC FINANCIAL STATEMENTS
NOTE 8 PENSION AND RETIREMENT SYSTEMS (continued) Municipal Fire & Police Retirement System – MFPRSI (continued) Death benefits are similar to disability benefits. Benefits for accidental death are 50% of the average final compensation of the member plus an additional amount for each child, or the provisions for ordinary death. Ordinary death benefits consist of a pension equal to 40% of the average final compensation of the member plus an additional amount for each child, or a lump-sum distribution to the designated beneficiary equal to 50% of the previous year’s earnable compensation of the member or equal to the amount of the member’s total contributions plus interest.
Benefits are increased (escalated) annually in accordance with Chapter 411.6 of the Code of Iowa which provides a standard formula for the increases.
The surviving spouse or dependents of an active member who dies due to a traumatic personal injury incurred in the line of duty receives a $100,000 lump-sum payment.
Contributions - Member contribution rates are set by state statute. In accordance with Chapter 411 of the Code of Iowa, the contribution rate was 9.40% of earnable compensation for the year ended June 30, 2020.
Employer contribution rates are based upon an actuarially determined normal contribution rate and set by state statute. The required actuarially determined contributions are calculated on the basis of the entry age normal method as adopted by the Board of Trustees as permitted under Chapter 411 of the Code of Iowa. The normal contribution rate is provided by state statute to be the actuarial liabilities of the plan less current plan assets, with such total divided by 1% of the actuarially determined present value of prospective future compensation of all members, further reduced by member contributions and state appropriations. Under the Code of Iowa the employer’s contribution rate cannot be less than 17.00% of earnable compensation. The contribution rate was 24.41% for the year ended June 30, 2020.
The City’s contributions to MFPRSI for the year ended June 30, 2020 was $2,846,475.
If approved by the state legislature, state appropriation may further reduce the employer’s contribution rate, but not below the minimum statutory contribution rate of 17.00% of earnable compensation. The State of Iowa therefore is considered to be a non-employer contributing entity in accordance with the provisions of the Governmental Accounting Standards Board Statement No. 67 – Financial Reporting for Pension Plans, (GASB 67).
There were no state appropriations to MFPRSI during the fiscal year ended June 30, 2020.
Net Pension Liabilities, Pension Expense, and Deferred Outflows of Resources and Deferred Inflows of Resources Related to Pensions - At June 30, 2020, the City reported a liability of $36,815,779 for its proportionate share of the net pension liability, of which $22,889,825 relates to MFPRSI. The net pension liability was measured as of June 30, 2019, and the total pension liability used to calculate the net pension liability was determined by an actuarial valuation as of that date. The City’s proportion of the net pension liability was based on the City’s share of contributions to the pension plan relative to the contributions of all MFPRSI participating employers. At June 30, 2019, the City’s proportion was 3.489693% which was an increase of 0.200679% from its proportions measured as of June 30, 2018.
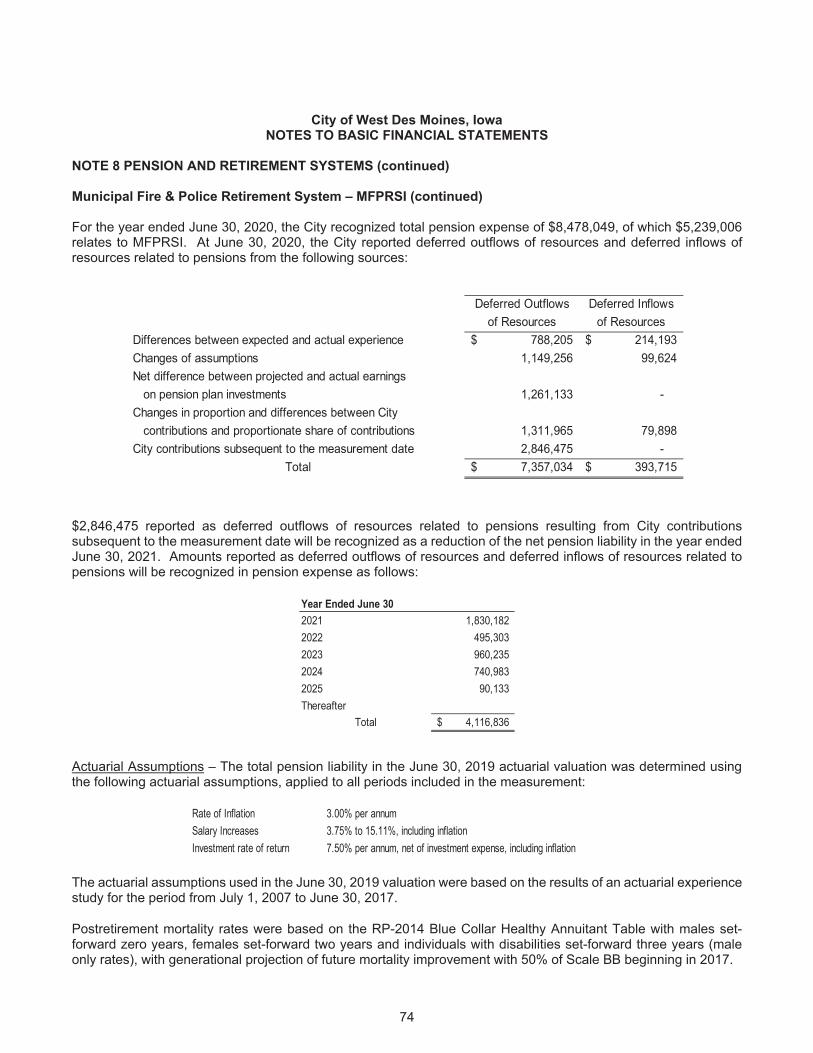
74
City of West Des Moines, Iowa NOTES TO BASIC FINANCIAL STATEMENTS
NOTE 8 PENSION AND RETIREMENT SYSTEMS (continued) Municipal Fire & Police Retirement System – MFPRSI (continued) For the year ended June 30, 2020, the City recognized total pension expense of $8,478,049, of which $5,239,006 relates to MFPRSI. At June 30, 2020, the City reported deferred outflows of resources and deferred inflows of resources related to pensions from the following sources:
Deferred Outflows Deferred Inflowsof Resources of Resources
Differences between expected and actual experience 788,205$ 214,193$ Changes of assumptions 1,149,256 99,624 Net difference between projected and actual earnings on pension plan investments 1,261,133 - Changes in proportion and differences between City contributions and proportionate share of contributions 1,311,965 79,898 City contributions subsequent to the measurement date 2,846,475 -
Total 7,357,034$ 393,715$
$2,846,475 reported as deferred outflows of resources related to pensions resulting from City contributions subsequent to the measurement date will be recognized as a reduction of the net pension liability in the year ended June 30, 2021. Amounts reported as deferred outflows of resources and deferred inflows of resources related to pensions will be recognized in pension expense as follows:
Year Ended June 302021 1,830,1822022 495,3032023 960,2352024 740,9832025 90,133Thereafter
Total 4,116,836$
Actuarial Assumptions – The total pension liability in the June 30, 2019 actuarial valuation was determined using the following actuarial assumptions, applied to all periods included in the measurement:
Rate of Inflation 3.00% per annumSalary Increases 3.75% to 15.11%, including inflationInvestment rate of return 7.50% per annum, net of investment expense, including inflation
The actuarial assumptions used in the June 30, 2019 valuation were based on the results of an actuarial experience study for the period from July 1, 2007 to June 30, 2017.
Postretirement mortality rates were based on the RP-2014 Blue Collar Healthy Annuitant Table with males set-forward zero years, females set-forward two years and individuals with disabilities set-forward three years (male only rates), with generational projection of future mortality improvement with 50% of Scale BB beginning in 2017.
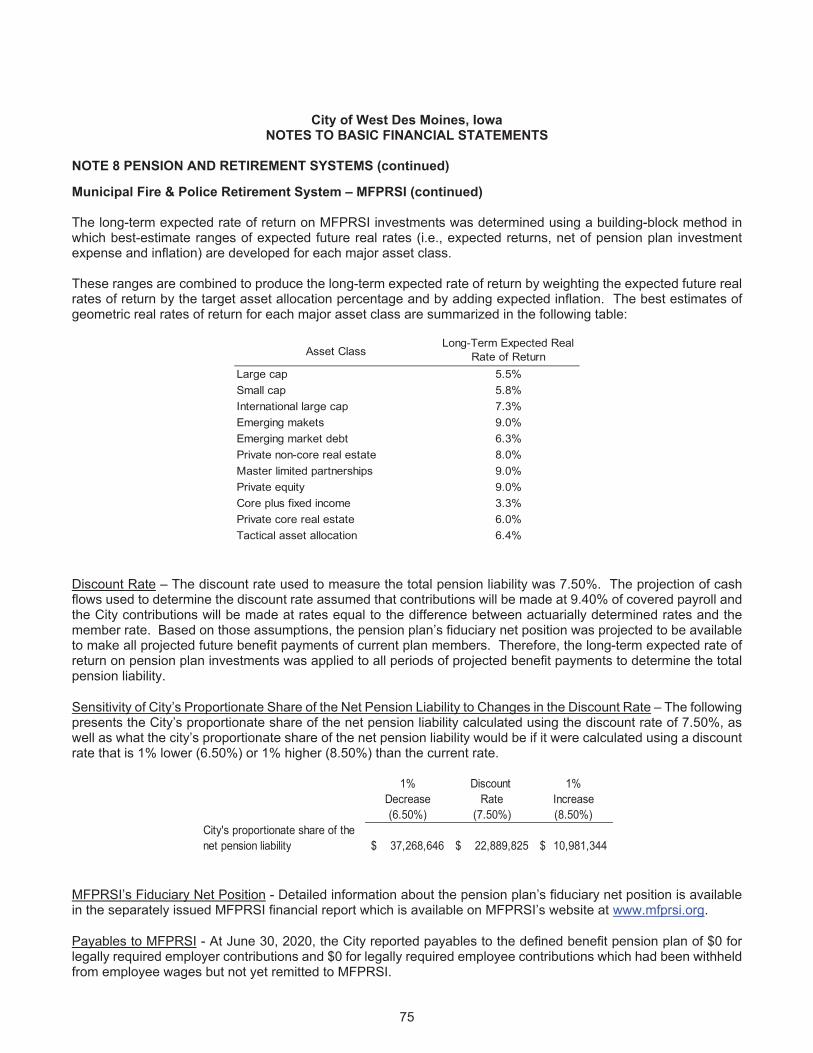
75
City of West Des Moines, Iowa NOTES TO BASIC FINANCIAL STATEMENTS
NOTE 8 PENSION AND RETIREMENT SYSTEMS (continued) Municipal Fire & Police Retirement System – MFPRSI (continued) The long-term expected rate of return on MFPRSI investments was determined using a building-block method in which best-estimate ranges of expected future real rates (i.e., expected returns, net of pension plan investment expense and inflation) are developed for each major asset class. These ranges are combined to produce the long-term expected rate of return by weighting the expected future real rates of return by the target asset allocation percentage and by adding expected inflation. The best estimates of geometric real rates of return for each major asset class are summarized in the following table:
Asset ClassLong-Term Expected Real
Rate of ReturnLarge cap 5.5%Small cap 5.8%International large cap 7.3%Emerging makets 9.0%Emerging market debt 6.3%Private non-core real estate 8.0%Master limited partnerships 9.0%Private equity 9.0%Core plus fixed income 3.3%Private core real estate 6.0%Tactical asset allocation 6.4%
Discount Rate – The discount rate used to measure the total pension liability was 7.50%. The projection of cash flows used to determine the discount rate assumed that contributions will be made at 9.40% of covered payroll and the City contributions will be made at rates equal to the difference between actuarially determined rates and the member rate. Based on those assumptions, the pension plan’s fiduciary net position was projected to be available to make all projected future benefit payments of current plan members. Therefore, the long-term expected rate of return on pension plan investments was applied to all periods of projected benefit payments to determine the total pension liability.
Sensitivity of City’s Proportionate Share of the Net Pension Liability to Changes in the Discount Rate – The following presents the City’s proportionate share of the net pension liability calculated using the discount rate of 7.50%, as well as what the city’s proportionate share of the net pension liability would be if it were calculated using a discount rate that is 1% lower (6.50%) or 1% higher (8.50%) than the current rate.
1% Discount 1%Decrease Rate Increase(6.50%) (7.50%) (8.50%)
City's proportionate share of thenet pension liability 37,268,646$ 22,889,825$ 10,981,344$
MFPRSI’s Fiduciary Net Position - Detailed information about the pension plan’s fiduciary net position is available in the separately issued MFPRSI financial report which is available on MFPRSI’s website at www.mfprsi.org.
Payables to MFPRSI - At June 30, 2020, the City reported payables to the defined benefit pension plan of $0 for legally required employer contributions and $0 for legally required employee contributions which had been withheld from employee wages but not yet remitted to MFPRSI.
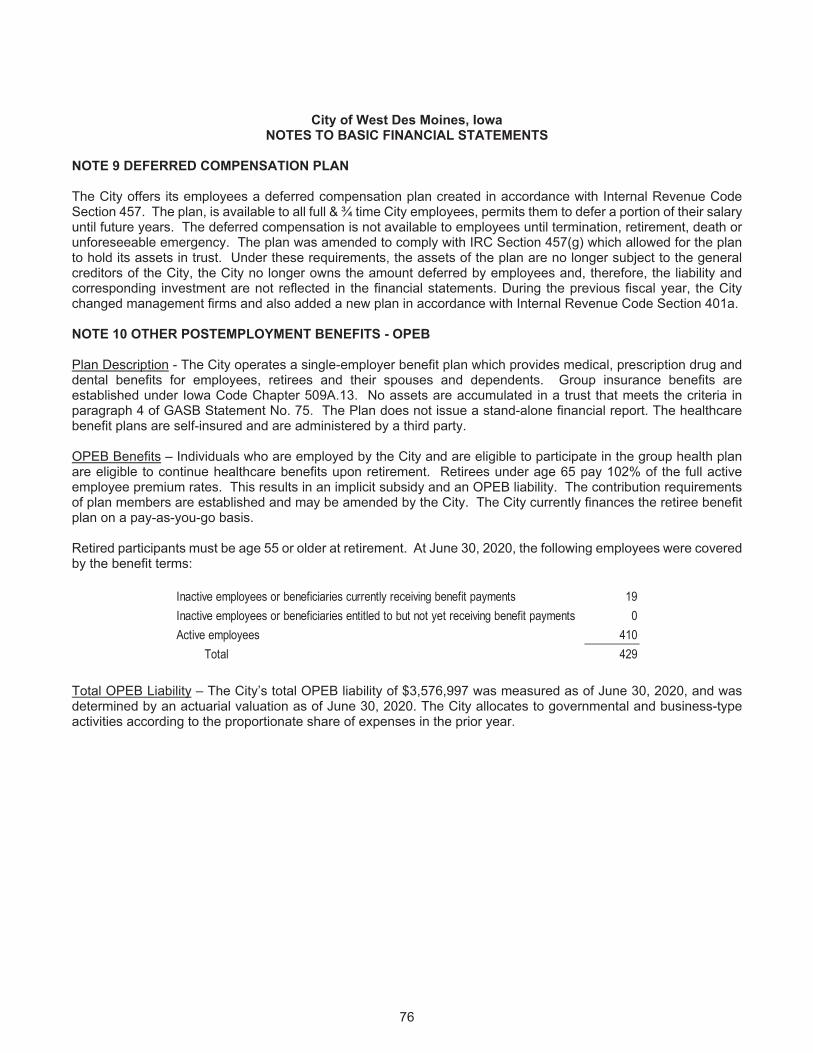
76
City of West Des Moines, Iowa NOTES TO BASIC FINANCIAL STATEMENTS
NOTE 9 DEFERRED COMPENSATION PLAN The City offers its employees a deferred compensation plan created in accordance with Internal Revenue Code Section 457. The plan, is available to all full & ¾ time City employees, permits them to defer a portion of their salary until future years. The deferred compensation is not available to employees until termination, retirement, death or unforeseeable emergency. The plan was amended to comply with IRC Section 457(g) which allowed for the plan to hold its assets in trust. Under these requirements, the assets of the plan are no longer subject to the general creditors of the City, the City no longer owns the amount deferred by employees and, therefore, the liability and corresponding investment are not reflected in the financial statements. During the previous fiscal year, the City changed management firms and also added a new plan in accordance with Internal Revenue Code Section 401a. NOTE 10 OTHER POSTEMPLOYMENT BENEFITS - OPEB Plan Description - The City operates a single-employer benefit plan which provides medical, prescription drug and dental benefits for employees, retirees and their spouses and dependents. Group insurance benefits are established under Iowa Code Chapter 509A.13. No assets are accumulated in a trust that meets the criteria in paragraph 4 of GASB Statement No. 75. The Plan does not issue a stand-alone financial report. The healthcare benefit plans are self-insured and are administered by a third party. OPEB Benefits – Individuals who are employed by the City and are eligible to participate in the group health plan are eligible to continue healthcare benefits upon retirement. Retirees under age 65 pay 102% of the full active employee premium rates. This results in an implicit subsidy and an OPEB liability. The contribution requirements of plan members are established and may be amended by the City. The City currently finances the retiree benefit plan on a pay-as-you-go basis. Retired participants must be age 55 or older at retirement. At June 30, 2020, the following employees were covered by the benefit terms:
Inactive employees or beneficiaries currently receiving benefit payments 19Inactive employees or beneficiaries entitled to but not yet receiving benefit payments 0Active employees 410
Total 429
Total OPEB Liability – The City’s total OPEB liability of $3,576,997 was measured as of June 30, 2020, and was determined by an actuarial valuation as of June 30, 2020. The City allocates to governmental and business-type activities according to the proportionate share of expenses in the prior year.
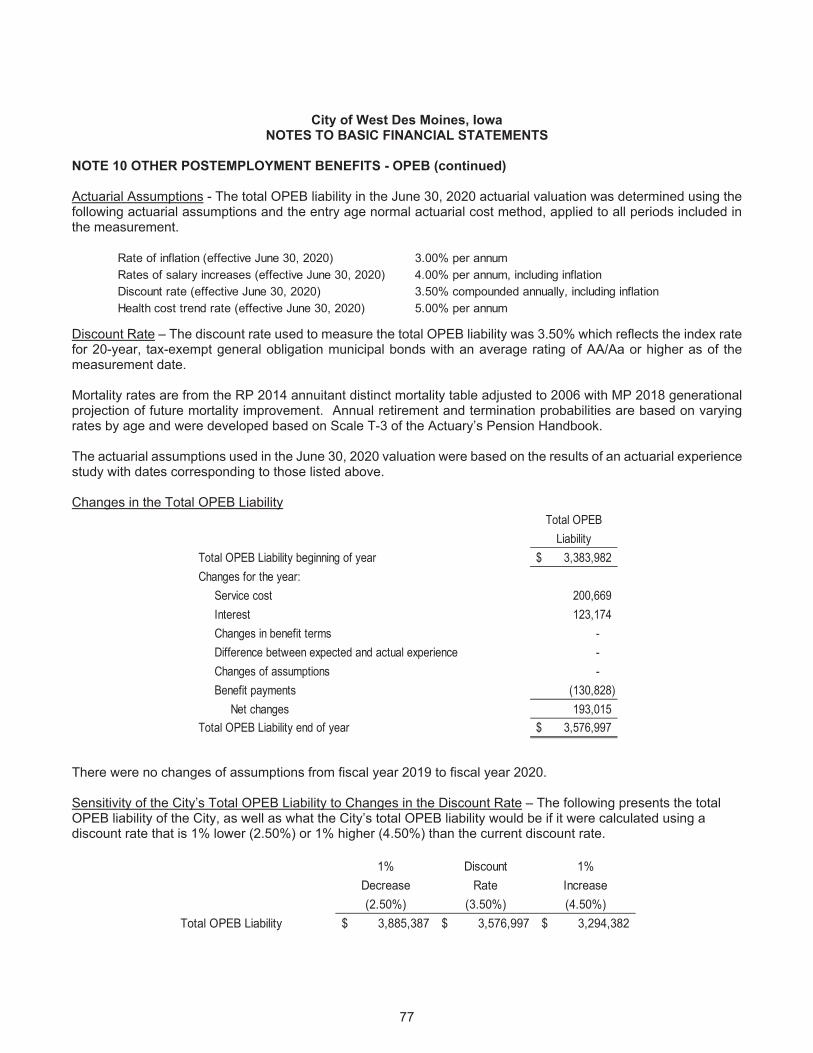
77
City of West Des Moines, Iowa NOTES TO BASIC FINANCIAL STATEMENTS
NOTE 10 OTHER POSTEMPLOYMENT BENEFITS - OPEB (continued) Actuarial Assumptions - The total OPEB liability in the June 30, 2020 actuarial valuation was determined using the following actuarial assumptions and the entry age normal actuarial cost method, applied to all periods included in the measurement.
Rate of inflation (effective June 30, 2020) 3.00% per annumRates of salary increases (effective June 30, 2020) 4.00% per annum, including inflationDiscount rate (effective June 30, 2020) 3.50% compounded annually, including inflationHealth cost trend rate (effective June 30, 2020) 5.00% per annum
Discount Rate – The discount rate used to measure the total OPEB liability was 3.50% which reflects the index rate for 20-year, tax-exempt general obligation municipal bonds with an average rating of AA/Aa or higher as of the measurement date. Mortality rates are from the RP 2014 annuitant distinct mortality table adjusted to 2006 with MP 2018 generational projection of future mortality improvement. Annual retirement and termination probabilities are based on varying rates by age and were developed based on Scale T-3 of the Actuary’s Pension Handbook. The actuarial assumptions used in the June 30, 2020 valuation were based on the results of an actuarial experience study with dates corresponding to those listed above. Changes in the Total OPEB Liability
Total OPEBLiability
Total OPEB Liability beginning of year 3,383,982$ Changes for the year:
Service cost 200,669 Interest 123,174 Changes in benefit terms - Difference between expected and actual experience - Changes of assumptions - Benefit payments (130,828)
Net changes 193,015 Total OPEB Liability end of year 3,576,997$
There were no changes of assumptions from fiscal year 2019 to fiscal year 2020. Sensitivity of the City’s Total OPEB Liability to Changes in the Discount Rate – The following presents the total OPEB liability of the City, as well as what the City’s total OPEB liability would be if it were calculated using a discount rate that is 1% lower (2.50%) or 1% higher (4.50%) than the current discount rate.
1% Discount 1%Decrease Rate Increase(2.50%) (3.50%) (4.50%)
Total OPEB Liability 3,885,387$ 3,576,997$ 3,294,382$
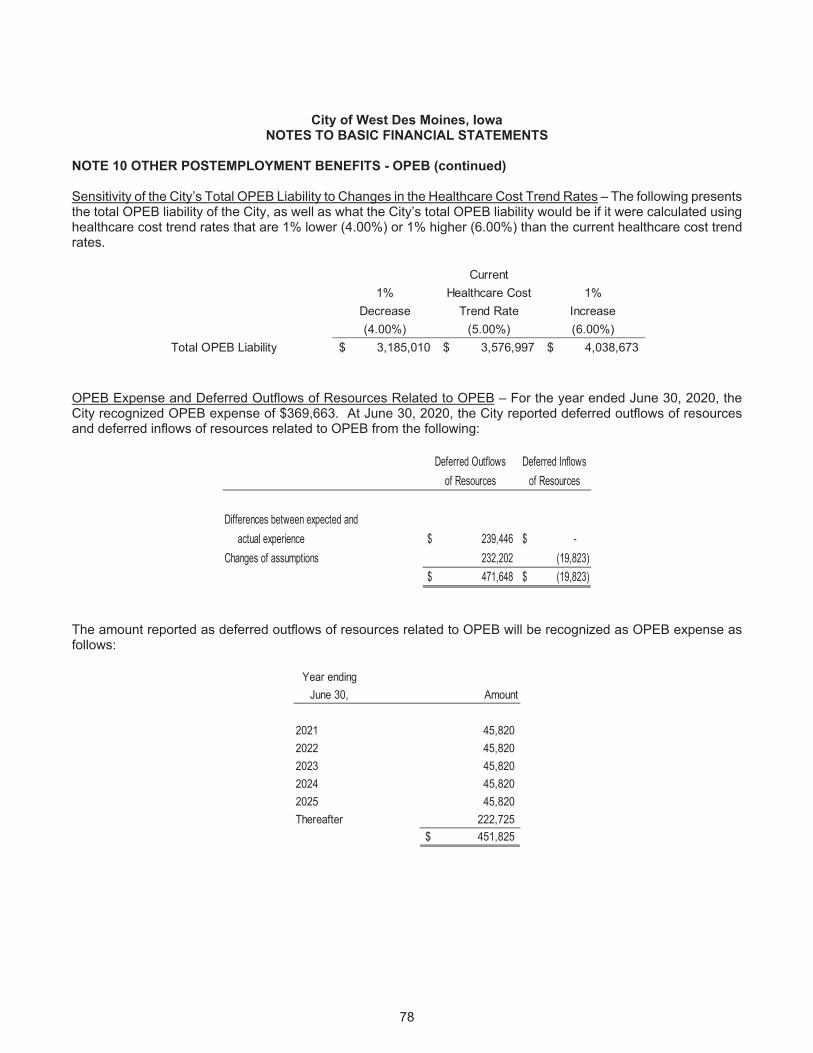
78
City of West Des Moines, Iowa NOTES TO BASIC FINANCIAL STATEMENTS
NOTE 10 OTHER POSTEMPLOYMENT BENEFITS - OPEB (continued) Sensitivity of the City’s Total OPEB Liability to Changes in the Healthcare Cost Trend Rates – The following presents the total OPEB liability of the City, as well as what the City’s total OPEB liability would be if it were calculated using healthcare cost trend rates that are 1% lower (4.00%) or 1% higher (6.00%) than the current healthcare cost trend rates.
Current1% Healthcare Cost 1%
Decrease Trend Rate Increase(4.00%) (5.00%) (6.00%)
Total OPEB Liability 3,185,010$ 3,576,997$ 4,038,673$
OPEB Expense and Deferred Outflows of Resources Related to OPEB – For the year ended June 30, 2020, the City recognized OPEB expense of $369,663. At June 30, 2020, the City reported deferred outflows of resources and deferred inflows of resources related to OPEB from the following:
Deferred Outflows Deferred Inflowsof Resources of Resources
Differences between expected andactual experience 239,446$ -$
Changes of assumptions 232,202 (19,823) 471,648$ (19,823)$
The amount reported as deferred outflows of resources related to OPEB will be recognized as OPEB expense as follows:
Year endingJune 30, Amount
2021 45,820 2022 45,820 2023 45,820 2024 45,820 2025 45,820 Thereafter 222,725
451,825$
79
City of West Des Moines, Iowa NOTES TO BASIC FINANCIAL STATEMENTS
NOTE 11 JOINT VENTURE The City is a participating community in the Des Moines Metropolitan Wastewater Reclamation Authority joint venture. This joint venture provides primary and secondary treatment of the sewer flows of the participating communities. The Amended and Restated Agreement for the Des Moines Metropolitan Wastewater Reclamation Authority (WRA) was effective on July 1, 2004. This agreement amended and restated the previous Integrated Community Area (I.C.A.) Agreement to provide continued operation, improvements and expansion. The WRA Agreement establishes the WRA as a separate legal entity with its own Board. The WRA Agreement creates an independent governance structure, establishes an independent bonding authority for the WRA and provides a framework for additional communities to participate. Annually, the WRA establishes an allocation to all participating communities based on operations, maintenance, debt service, and reserve requirements. Allocations are based on wastewater reclamation facility flows and adjusted prospectively for differences in budgeted flows and actual flows. The City retains an ongoing financial responsibility to the WRA since it is obligated in some manner for the debts of the joint venture through the annual allocation. Although the debt of the WRA is to be paid solely and only from WRA revenues, the participating communities in the joint venture cannot withdraw from the joint venture while any bonds issued during the time the entity was a participating community are still outstanding. The City does not anticipate the need to contribute additional financial resources beyond the existing agreement. In May of 2015, the WRA issued Sewer Revenue Bonds Series 2015E for the purpose of refunding Series 2006A. The WRA Agreement requires the debt service on these bonds to be allocated to the participating communities based on the WRA flows of the core communities and expansion communities of each calendar year. As of June 30, 2020, the Series 2015E bonds had a balance of $27,235,000 and the City of West Des Moines’ estimated future allocation based on the WRA flows is currently $4,901,035. In May of 2013, the WRA issued Sewer Revenue Bonds Series 2013B for the purpose of refunding Series 2004B. The WRA Agreement requires the debt service on these bonds to be allocated to the participating communities based on the WRA flows of the core communities and expansion communities of each calendar year. As of June 30, 2020, the Series 2013B bonds had a balance of $44,540,000 and the City of West Des Moines’ estimated future allocation based on the WRA flows is currently $7,716,364. The WRA Agreement requires the debt service on all State Revolving Loans issued after July 1, 2004 to be allocated to the participating communities based on the WRA flows of the core communities and expansion communities of each calendar year. As of June 30, 2020, the WRA had $307,791,149 of such State Revolving Loans of which $46,530,198 future principal debt service is a commitment to the City of West Des Moines. The State Revolving Loans assumed by the WRA in 2004 are to be paid by the participating communities based on the existing allocations under the prior I.C.A. agreement. As of June 30, 2020, the WRA had $3,127,533 in these State Revolving Loans of which $76,166 future principal debt service is a commitment to the City of West Des Moines. The WRA Agreement does not provide for the determination of an equity interest for the participating communities. Withdrawing from the joint venture is a forfeit of all reversionary interest and no compensation will be paid. Since there is no specific and measurable equity interest in the WRA Agreement, no investment in the joint venture has been reported by the City. The WRA issues separate financial statements that may be obtained at 3000 Vandalia Road, Des Moines, Iowa 50317-1346.
80
City of West Des Moines, Iowa NOTES TO BASIC FINANCIAL STATEMENTS
NOTE 12 RELATED ORGANIZATIONS AND JOINTLY GOVERNED ORGANIZATIONS Related organization: The West Des Moines Water Works Utility is governed by a five-member board which is appointed by the Mayor and approved by the City Council. The West Des Moines Water Works Utility is legally a separate entity and is not financially accountable to the City. The City provides various services to the Water Works, including reimbursable expenses and the availability to participate in the City's health insurance plan. The Water Works provides billing and collection services to the City in connection with the City's Sewer, Solid Waste, and Storm Water Enterprise Funds. The following is a summary of the related party transactions for the year ended June 30, 2020:
Received from West Des Moines Water WorksHealth insurance reimbursements 477,753 Gasoline reimbursements 33,475 Telephone reimbursements 2,182 Share of general insurance 102,402 Delinquent reimbursements 527 Donation reimbursements 8,705 Miscellaneous reimbursements 11,504
Payments to West Des Moines Water WorksCollection fees for sewer, solid waste, and storm water 186,055 Miscellaneous fees 1,062,010
Amounts receivable from West Des Moines Water Works as of June 30, 2020 for sewer, storm, solid waste charges, and capital projects totaled $2,646,067, $859,994, $543,648, and $6,779,646 respectively. Jointly governed organizations: The City participates in several jointly governed organizations for which the City is not financially accountable or that the nature and significance of the relationship with the City are such that exclusion does not cause the City's financial statements to be misleading or incomplete. City officials are members of the following boards and commissions: Polk, Dallas and Warren County Assessor's Conference Boards; Metropolitan Planning Organization; Greater Des Moines Convention and Visitors Bureau. In July 2008, the City entered into a jointly governed organization with Central Iowa Health System for the provision of emergency medical services. The agreement between the participating organizations is commonly referred to as the “Iowa EMS Alliance”. The Iowa EMS Alliance was established as an undivided interest ownership arrangement, whereby the title to Alliance assets is held individually by the City and Iowa Health. The City’s portion of current year costs of operation for the Iowa EMS Alliance was $3,434,037 and there were no capital costs. NOTE 13 COMMITMENTS The City has entered into contracts totaling approximately $271 million for various projects that were not complete at year-end. As of June 30, 2020, approximately $193 million has been incurred on these contracts. In order to encourage development within designated Urban Renewal Areas, the City Council has approved development rebate agreements related to several different projects. Rebates are to be paid only after certain conditions have been met by each project developer, and are to be paid over many years in the form of a rebate of a predetermined percentage of future property taxes generated by the property. It is estimated that outstanding commitments of approximately $33.85 million exist, of which $2.17 million is likely to be eligible to be paid in the next fiscal year. The payments will be expensed in the period in which they are paid. No liability for these obligations is recognized due to the fact that the agreements are conditional and the payments are to be funded by future property taxes received on the project.
81
City of West Des Moines, Iowa NOTES TO BASIC FINANCIAL STATEMENTS
NOTE 13 COMMITMENTS (continued) The City, in equal partnership with a neighboring city, has entered into an agreement with the Iowa Department of Transportation (IDOT) where the cities have agreed to reimburse in equal shares the IDOT’s construction cost for a new interstate interchange which straddles the shared border of the two cities. The construction project was nearly complete but not finalized at June 30, 2020. As a result, final repayment amounts and terms have not yet been formalized. However, the cities and IDOT have agreed that payments will be made in ten annual equal principal-only installments most likely beginning in the fiscal year ending June 30, 2021. It is currently estimated that each city’s share of the total project cost will be approximately $9 million contingent on project completion and final negotiation. No liability for this obligation has been recognized. NOTE 14 RISK MANAGEMENT The City is a member in the Iowa Communities Assurance Pool (the Pool), as allowed by Chapter 670.7 of the Code of Iowa. The Pool is a local government risk-sharing pool whose 800 members include various governmental entities throughout the state of Iowa. The Pool was formed in August 1986 for the purpose of managing and funding third-party liability claims against its members. The Pool provides coverage and protection in the following categories: general liability, automobile liability, automobile physical damage, public officials’ liability, police professional liability, property, inland marine, and boiler/machinery. There have been no reductions in insurance coverage from prior years. Each member's annual casualty contributions to the Pool fund current operations and provide capital. Annual operating contributions are those amounts necessary to fund, on a cash basis, the Pool's general and administrative expenses, claims, claims expenses and reinsurance expenses due and payable in the current year, plus all or any portion of any deficiency in capital. Capital contributions are made during the first six years of membership and are maintained to equal 150% of the total current members' basis rates or to comply with the requirements of any applicable regulatory authority having jurisdiction over the Pool. The Pool also provides property coverage. Members who elect such coverage make annual operating contributions which are necessary to fund, on a cash basis, the Pool's general and administrative expenses and reinsurance premiums, all of which are due and payable in the current year, plus all or any portion of any deficiency in capital. Any year-end operating surplus is transferred to capital. Deficiencies in operations are offset by transfers from capital and, if insufficient, by the subsequent year's member contributions. The City's property and casualty contributions to the risk pool are recorded as expenditures from its operating funds at the time of payment to the risk pool. The City's contributions to the Pool for the year ended June 30, 2020 were approximately $502,720. The Pool uses reinsurance and excess risk-sharing agreements to reduce its exposure to large losses. The Pool retains general, automobile, police professional and public officials' liability risks up to $500,000 per claim. Claims exceeding $500,000 are reinsured in an amount not to exceed $2,500,000 per claim, with no aggregate. For members requiring specific coverage from $2,000,000 to $10,000,000, such excess coverage is also reinsured. The City of West Des Moines has elected $10,000,000 in coverage. Property and automobile physical damage risks are retained by the Pool up to $250,000 each occurrence, each location, with excess coverage reinsured through reinsurance and risk-sharing agreements with various providers. The Pool's intergovernmental contract with its members provides that in the event a casualty claim or series of claims exceeds the amount of risk-sharing protection provided by the member's risk-sharing certificate, or in the event that a series of casualty claims exhaust total members' equity plus any reinsurance and any excess risk-sharing recoveries, then payment of such claims shall be the obligation of the respective individual member. The City does not report a liability for losses in excess of reinsurance or excess risk-sharing recoveries unless it is deemed probable such losses have occurred and the amount of such losses can be reasonably estimated. Accordingly, as of June 30, 2020, no liability has been recorded in the City's financial statements. As of June 30, 2020, settled claims have not exceeded the risk pool or reinsurance company coverage since the Pool's inception.
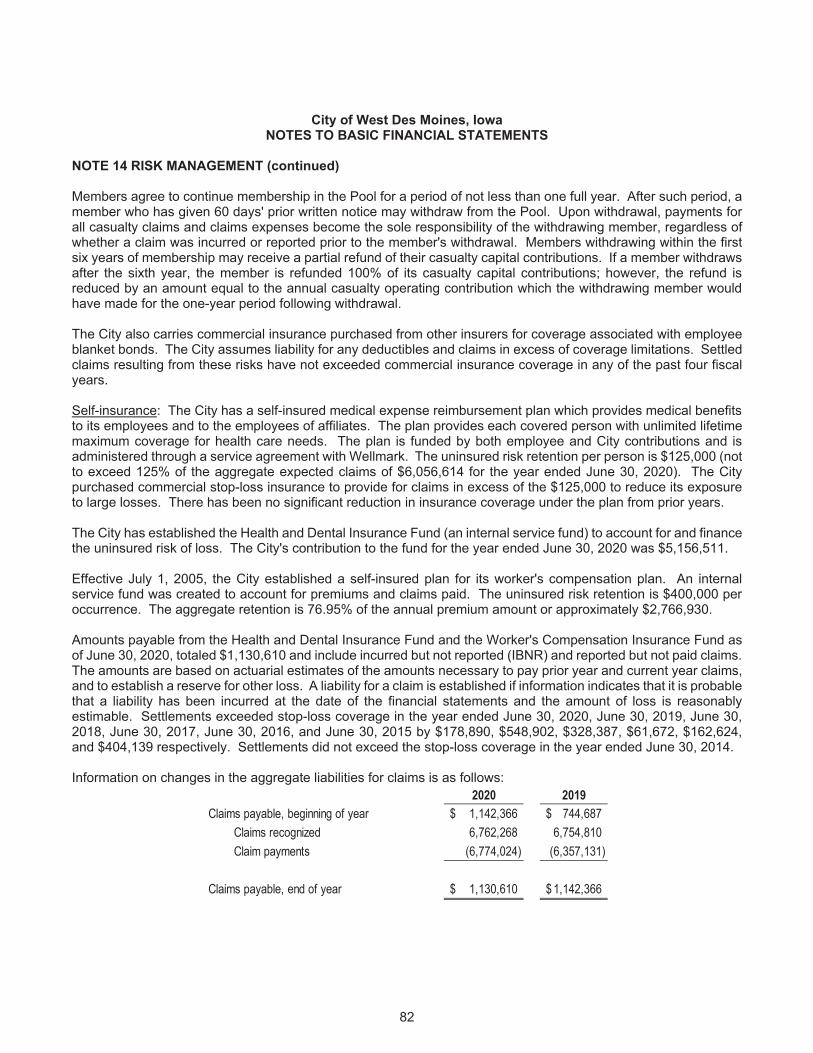
82
City of West Des Moines, Iowa NOTES TO BASIC FINANCIAL STATEMENTS
NOTE 14 RISK MANAGEMENT (continued) Members agree to continue membership in the Pool for a period of not less than one full year. After such period, a member who has given 60 days' prior written notice may withdraw from the Pool. Upon withdrawal, payments for all casualty claims and claims expenses become the sole responsibility of the withdrawing member, regardless of whether a claim was incurred or reported prior to the member's withdrawal. Members withdrawing within the first six years of membership may receive a partial refund of their casualty capital contributions. If a member withdraws after the sixth year, the member is refunded 100% of its casualty capital contributions; however, the refund is reduced by an amount equal to the annual casualty operating contribution which the withdrawing member would have made for the one-year period following withdrawal. The City also carries commercial insurance purchased from other insurers for coverage associated with employee blanket bonds. The City assumes liability for any deductibles and claims in excess of coverage limitations. Settled claims resulting from these risks have not exceeded commercial insurance coverage in any of the past four fiscal years. Self-insurance: The City has a self-insured medical expense reimbursement plan which provides medical benefits to its employees and to the employees of affiliates. The plan provides each covered person with unlimited lifetime maximum coverage for health care needs. The plan is funded by both employee and City contributions and is administered through a service agreement with Wellmark. The uninsured risk retention per person is $125,000 (not to exceed 125% of the aggregate expected claims of $6,056,614 for the year ended June 30, 2020). The City purchased commercial stop-loss insurance to provide for claims in excess of the $125,000 to reduce its exposure to large losses. There has been no significant reduction in insurance coverage under the plan from prior years. The City has established the Health and Dental Insurance Fund (an internal service fund) to account for and finance the uninsured risk of loss. The City's contribution to the fund for the year ended June 30, 2020 was $5,156,511. Effective July 1, 2005, the City established a self-insured plan for its worker's compensation plan. An internal service fund was created to account for premiums and claims paid. The uninsured risk retention is $400,000 per occurrence. The aggregate retention is 76.95% of the annual premium amount or approximately $2,766,930. Amounts payable from the Health and Dental Insurance Fund and the Worker's Compensation Insurance Fund as of June 30, 2020, totaled $1,130,610 and include incurred but not reported (IBNR) and reported but not paid claims. The amounts are based on actuarial estimates of the amounts necessary to pay prior year and current year claims, and to establish a reserve for other loss. A liability for a claim is established if information indicates that it is probable that a liability has been incurred at the date of the financial statements and the amount of loss is reasonably estimable. Settlements exceeded stop-loss coverage in the year ended June 30, 2020, June 30, 2019, June 30, 2018, June 30, 2017, June 30, 2016, and June 30, 2015 by $178,890, $548,902, $328,387, $61,672, $162,624, and $404,139 respectively. Settlements did not exceed the stop-loss coverage in the year ended June 30, 2014. Information on changes in the aggregate liabilities for claims is as follows:
2020 2019Claims payable, beginning of year 1,142,366$ 744,687$
Claims recognized 6,762,268 6,754,810 Claim payments (6,774,024) (6,357,131)
Claims payable, end of year 1,130,610$ 1,142,366$
83
City of West Des Moines, Iowa NOTES TO BASIC FINANCIAL STATEMENTS
NOTE 15 CONDUIT DEBT OBLIGATIONS From time to time, the City has issued Industrial Development Revenue Bonds, under the provisions of Chapter 419 of the Code of Iowa, to provide financial info assistance to private sector entities for the acquisition and construction of industrial and commercial facilities deemed to be in the public interest. The bonds are secured by the property financed and are payable solely from payments received on the underlying mortgage loans. Upon prepayment of the bonds, ownership of the acquired facilities transfers to the private-sector entity served by the bond issuance. The City is not obligated in any manner for repayment of the bonds. Accordingly, the bonds are not reported as liabilities in the accompanying financial statements. As of June 30, 2020, there was one series of industrial development revenue bonds outstanding, with an aggregated principal amount payable of $2,708,333. NOTE 16 LITIGATION Claims have been asserted against the City in the ordinary course of business with a maximum exposure of $230,000. Management is unable to estimate the cost of these claims or determine a range of loss and, accordingly, no accrual has been made for them. NOTE 17 TAX ABATEMENTS Governmental Accounting Standards Board Statement No. 77 defines tax abatements as a reduction in tax revenues that results from an agreement between one or more governments and an individual or entity in which (a) one or more governments promise to forgo tax revenues to which they are otherwise entitled and (b) the individual or entity promises to take a specific action after the agreement has been entered into that contributes to economic development or otherwise benefits the governments or the citizens of those governments. The City provides tax abatements for urban renewal and economic development projects with tax increment financing as provided for in Chapters 15A and 403 of the Code of Iowa. For these types of projects, the City enters into agreements with developers which require the City, after developers meet the terms of the agreements, to rebate a portion of the property tax paid by the developers, to pay the developers an economic development grant or to pay the developers a predetermined dollar amount. No other commitments were made by the City as part of these agreements. For the year ended June 30, 2020, the City rebated $1,222,212 of property tax under the urban renewal and economic development projects. Property tax revenues of the City were reduced by $0 for the year ended June 30, 2020 under agreements entered into by other entities. NOTE 18 CONTINGENCY The COVID-19 outbreak is disrupting business across a range of industries in the United States and financial markets have experiences a significant decline. As a result, local, regional and national economies, including that of the City, may be adversely impacted. The extent of the financial impact of COVID-19 will depend on future developments, including the duration and spread, which are uncertain and cannot be predicted. Due to the uncertainties surrounding the outbreak, management cannot presently estimate the potential impact of the City’s operation and finances. NOTE 19 SUBSEQUENT EVENTS The City was awarded additional funding through the Federal CARES Act in response to the COVID-19 pandemic. Although additional expenses were incurred during the current fiscal year, grant agreements were not fully executed until after June 30, 2020. As a result, the financial statements do not reflect the additional revenue totaling approximately $2,600,000. The grant agreements were executed during the fiscal year ended June 30, 2021, so the associated revenue will be recognized at that time.
84
City of West Des Moines, Iowa NOTES TO BASIC FINANCIAL STATEMENTS
NOTE 19 SUBSEQUENT EVENTS (continued) On July 1, 2020, the City announced a comprehensive plan to construct a Citywide conduit network to expand access to high-speed Internet. As a result, the City established a new Enterprise Fund for the new operation. On July 1, 2020, the City divested itself of shared maintenance and operation of the regional Metropolitan Salt Storage Facility as result of an amendment to a 28E agreement. This is primarily due to the construction of the City’s Public Service facility and the new ability to store salt on-site. On July 9, 2020, the City purchased property in the amount of approximately $4,350,000 with the intention to develop the location for a new fire station and public safety training facility. On July 10, 2020, the City withdrew funds in the amount of $2,500,000 related to the $6,000,000 revolving line of credit to fund construction of the MidAmerican Energy RecPlex. On September 3, 2020, the City issued General Obligation bonds totaling $13,805,000, of which $10,650,000 was to fund infrastructure and other capital projects, and $3,155,000 was to refund Series 2012D General Obligation bonds. On that same date, the City also issued General Obligation Urban Renewal bonds totaling $5,100,000 to fund infrastructure and General Obligation Urban Renewal Taxable bonds totaling $13,565,000 to fund the construction of the new Citywide conduit network. On October 19, 2020, the City entered into an internal advance agreement. A surplus of approximately $5,100,000 in the Sewer Enterprise Fund was identified and transferred to the MidAmerican Energy RecPlex Fund. Repayments including 1.5% interest will occur over a 15 year term ending June 1, 2035. On January 5, 2021, the City issued General Obligation Urban Renewal Taxable bonds totaling $16,240,000 to fund the construction of the MidAmerican Energy RecPlex. NOTE 20 PROSPECTIVE ACCOUNTING CHANGE The Governmental Accounting Standards Board has issued Statement No. 84, Fiduciary Activities. This statement will be implemented for the fiscal year ending June 30, 2021. The revised requirements of this statement will enhance the consistency and comparability of fiduciary activity reporting by state and local governments by establishing specific criteria for identifying fiduciary activities and clarifying whether and how business-type activities should report their fiduciary activities. The Governmental Accounting Standards Board has issued Statement No. 87, Leases. This statement will be implemented for the fiscal year ending June 30, 2022. The revised requirements of this statement will require reporting of certain potentially significant lease liabilities that are not currently reported.
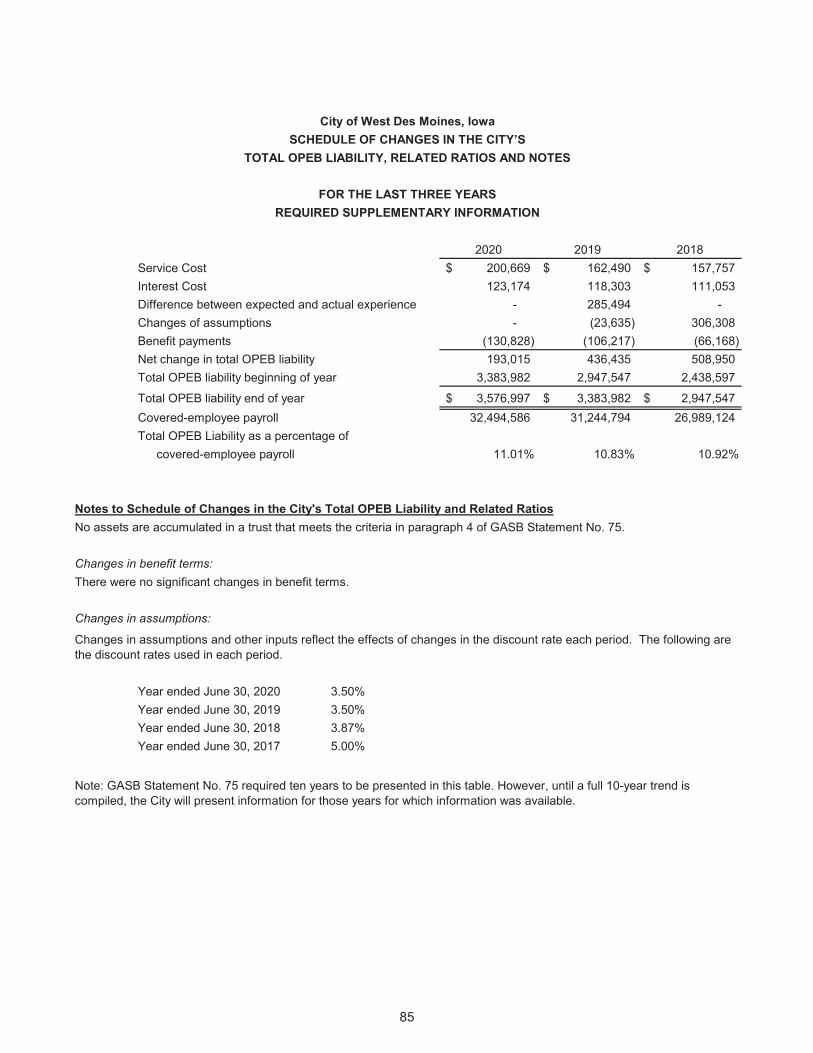
85
2020 2019 2018Service Cost 200,669$ 162,490$ 157,757$ Interest Cost 123,174 118,303 111,053 Difference between expected and actual experience - 285,494 - Changes of assumptions - (23,635) 306,308 Benefit payments (130,828) (106,217) (66,168) Net change in total OPEB liability 193,015 436,435 508,950 Total OPEB liability beginning of year 3,383,982 2,947,547 2,438,597
Total OPEB liability end of year 3,576,997$ 3,383,982$ 2,947,547$ Covered-employee payroll 32,494,586 31,244,794 26,989,124 Total OPEB Liability as a percentage of
covered-employee payroll 11.01% 10.83% 10.92%
Notes to Schedule of Changes in the City's Total OPEB Liability and Related RatiosNo assets are accumulated in a trust that meets the criteria in paragraph 4 of GASB Statement No. 75.
Changes in benefit terms:There were no significant changes in benefit terms.
Changes in assumptions:
Year ended June 30, 2020 3.50%Year ended June 30, 2019 3.50%Year ended June 30, 2018 3.87%Year ended June 30, 2017 5.00%
Changes in assumptions and other inputs reflect the effects of changes in the discount rate each period. The following are the discount rates used in each period.
Note: GASB Statement No. 75 required ten years to be presented in this table. However, until a full 10-year trend is compiled, the City will present information for those years for which information was available.
City of West Des Moines, IowaSCHEDULE OF CHANGES IN THE CITY’S
TOTAL OPEB LIABILITY, RELATED RATIOS AND NOTES
FOR THE LAST THREE YEARSREQUIRED SUPPLEMENTARY INFORMATION
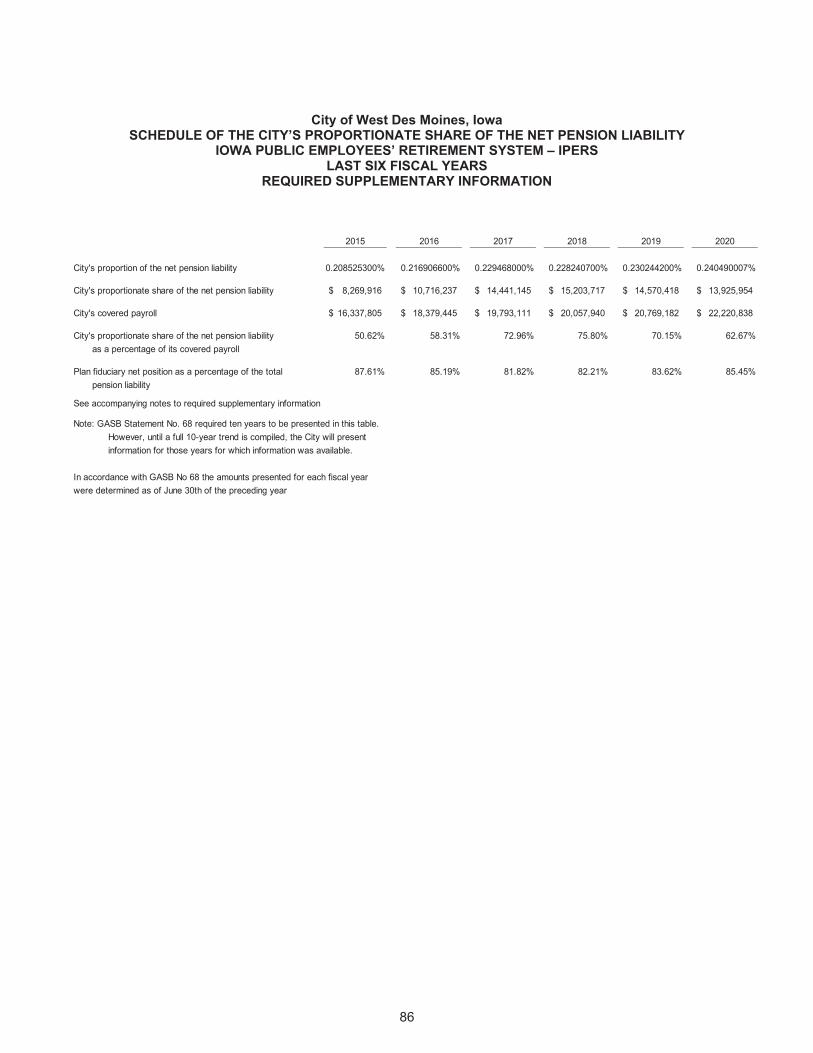
86
City of West Des Moines, Iowa SCHEDULE OF THE CITY’S PROPORTIONATE SHARE OF THE NET PENSION LIABILITY
IOWA PUBLIC EMPLOYEES’ RETIREMENT SYSTEM – IPERS LAST SIX FISCAL YEARS
REQUIRED SUPPLEMENTARY INFORMATION
2015 2016 2017 2018 2019 2020
City's proportion of the net pension liability 0.208525300% 0.216906600% 0.229468000% 0.228240700% 0.230244200% 0.240490007%
City's proportionate share of the net pension liability 8,269,916$ 10,716,237$ 14,441,145$ 15,203,717$ 14,570,418$ 13,925,954$
City's covered payroll 16,337,805$ 18,379,445$ 19,793,111$ 20,057,940$ 20,769,182$ 22,220,838$
City's proportionate share of the net pension liability 50.62% 58.31% 72.96% 75.80% 70.15% 62.67% as a percentage of its covered payroll
Plan fiduciary net position as a percentage of the total 87.61% 85.19% 81.82% 82.21% 83.62% 85.45% pension liability
See accompanying notes to required supplementary information
Note: GASB Statement No. 68 required ten years to be presented in this table. However, until a full 10-year trend is compiled, the City will present information for those years for which information was available.
In accordance with GASB No 68 the amounts presented for each fiscal yearwere determined as of June 30th of the preceding year
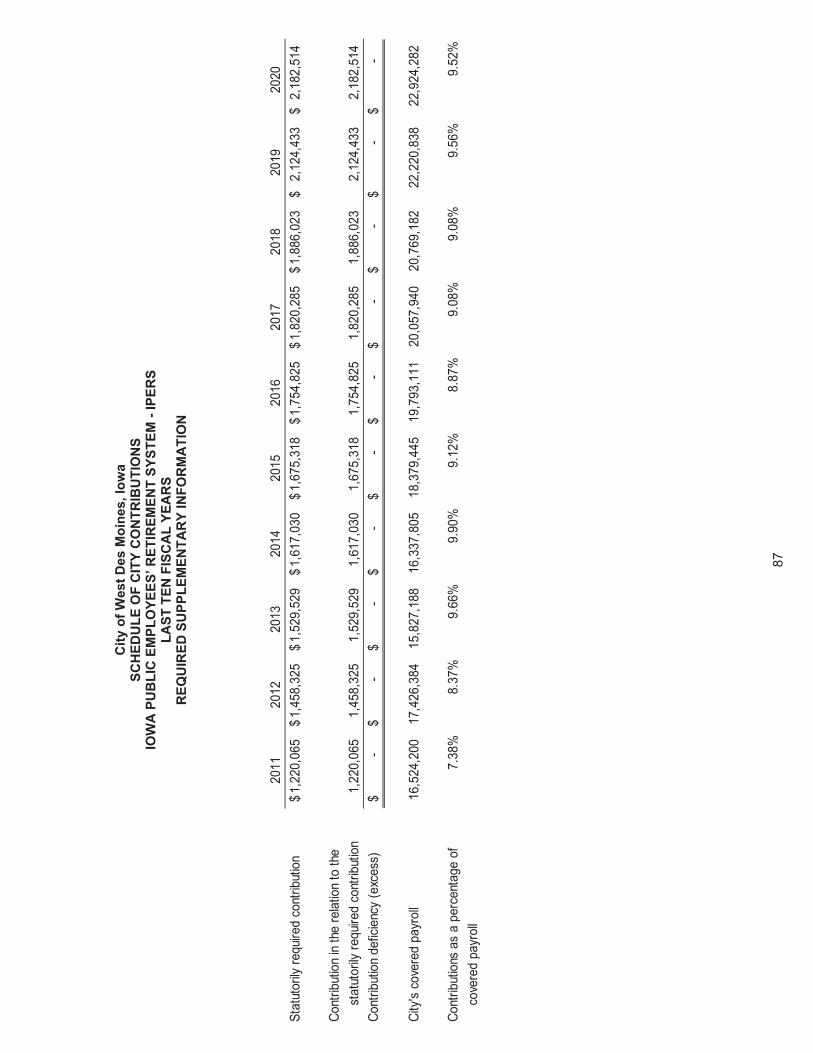
87
City
of W
est D
es M
oine
s, Io
wa
SCH
EDU
LE O
F C
ITY
CO
NTR
IBU
TIO
NS
IOW
A P
UB
LIC
EM
PLO
YEES
’ RET
IREM
ENT
SYST
EM -
IPER
S LA
ST T
EN F
ISC
AL
YEA
RS
REQ
UIR
ED S
UPP
LEM
ENTA
RY
INFO
RM
ATI
ON
2011
2012
2013
2014
2015
2016
2017
2018
2019
2020
Stat
utor
ily re
quire
d co
ntrib
ution
1,22
0,06
5$
1,45
8,32
5$
1,52
9,52
9$
1,61
7,03
0$
1,67
5,31
8$
1,75
4,82
5$
1,82
0,28
5$
1,88
6,02
3$
2,12
4,43
3$
2,
182,
514
$
Cont
ribut
ion in
the
relat
ion to
the
st
atut
orily
requ
ired
cont
ribut
ion1,
220,
065
1,
458,
325
1,
529,
529
1,
617,
030
1,
675,
318
1,
754,
825
1,
820,
285
1,
886,
023
2,
124,
433
2,18
2,51
4
Co
ntrib
ution
def
icien
cy (e
xces
s)-
$
-
$
-
$
-
$
-
$
-
$
-
$
-
$
-
$
-
$
City
's co
vere
d pa
yroll
16,5
24,2
00
17,4
26,3
84
15,8
27,1
88
16,3
37,8
05
18,3
79,4
45
19,7
93,1
11
20,0
57,9
40
20,7
69,1
82
22,2
20,8
38
22,9
24,2
82
Cont
ribut
ions
as a
per
cent
age
of
7.38
%8.
37%
9.66
%9.
90%
9.12
%8.
87%
9.08
%9.
08%
9.56
%9.
52%
cove
red
payr
oll
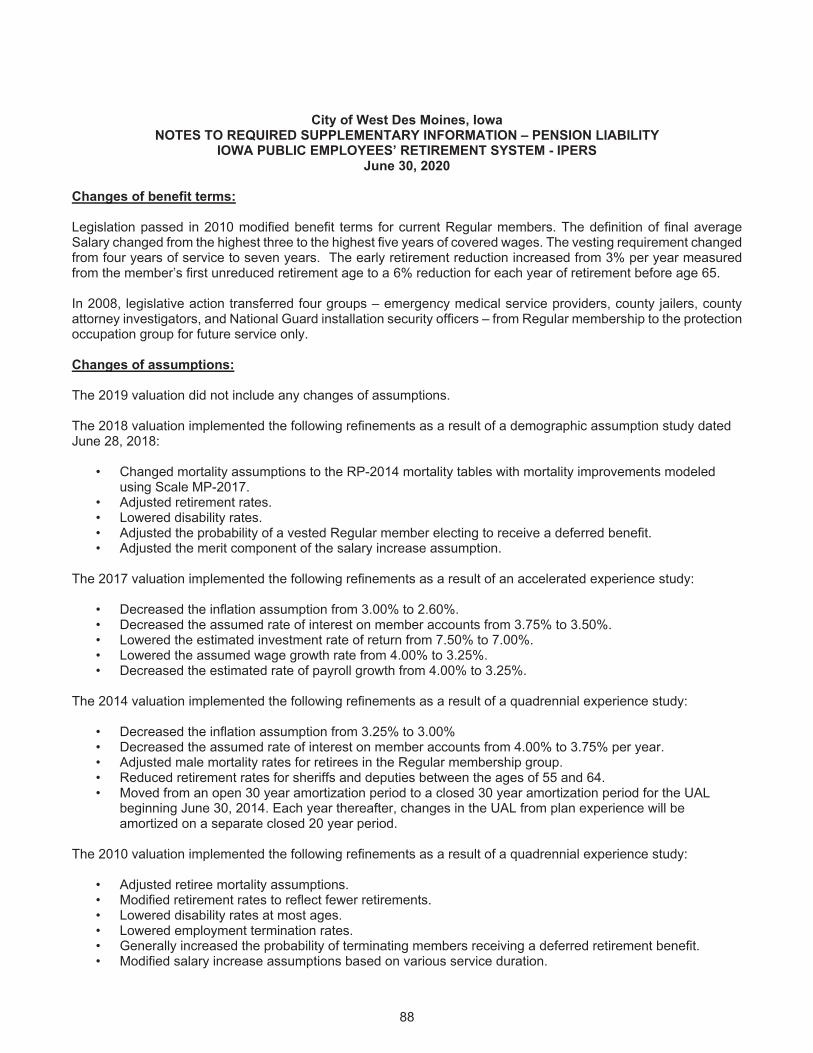
88
City of West Des Moines, Iowa NOTES TO REQUIRED SUPPLEMENTARY INFORMATION – PENSION LIABILITY
IOWA PUBLIC EMPLOYEES’ RETIREMENT SYSTEM - IPERS June 30, 2020
Changes of benefit terms: Legislation passed in 2010 modified benefit terms for current Regular members. The definition of final average Salary changed from the highest three to the highest five years of covered wages. The vesting requirement changed from four years of service to seven years. The early retirement reduction increased from 3% per year measured from the member’s first unreduced retirement age to a 6% reduction for each year of retirement before age 65. In 2008, legislative action transferred four groups – emergency medical service providers, county jailers, county attorney investigators, and National Guard installation security officers – from Regular membership to the protection occupation group for future service only. Changes of assumptions: The 2019 valuation did not include any changes of assumptions. The 2018 valuation implemented the following refinements as a result of a demographic assumption study dated June 28, 2018:
• Changed mortality assumptions to the RP-2014 mortality tables with mortality improvements modeled using Scale MP-2017.
• Adjusted retirement rates. • Lowered disability rates. • Adjusted the probability of a vested Regular member electing to receive a deferred benefit. • Adjusted the merit component of the salary increase assumption.
The 2017 valuation implemented the following refinements as a result of an accelerated experience study:
• Decreased the inflation assumption from 3.00% to 2.60%. • Decreased the assumed rate of interest on member accounts from 3.75% to 3.50%. • Lowered the estimated investment rate of return from 7.50% to 7.00%. • Lowered the assumed wage growth rate from 4.00% to 3.25%. • Decreased the estimated rate of payroll growth from 4.00% to 3.25%.
The 2014 valuation implemented the following refinements as a result of a quadrennial experience study:
• Decreased the inflation assumption from 3.25% to 3.00% • Decreased the assumed rate of interest on member accounts from 4.00% to 3.75% per year. • Adjusted male mortality rates for retirees in the Regular membership group. • Reduced retirement rates for sheriffs and deputies between the ages of 55 and 64. • Moved from an open 30 year amortization period to a closed 30 year amortization period for the UAL
beginning June 30, 2014. Each year thereafter, changes in the UAL from plan experience will be amortized on a separate closed 20 year period.
The 2010 valuation implemented the following refinements as a result of a quadrennial experience study:
• Adjusted retiree mortality assumptions. • Modified retirement rates to reflect fewer retirements. • Lowered disability rates at most ages. • Lowered employment termination rates. • Generally increased the probability of terminating members receiving a deferred retirement benefit. • Modified salary increase assumptions based on various service duration.
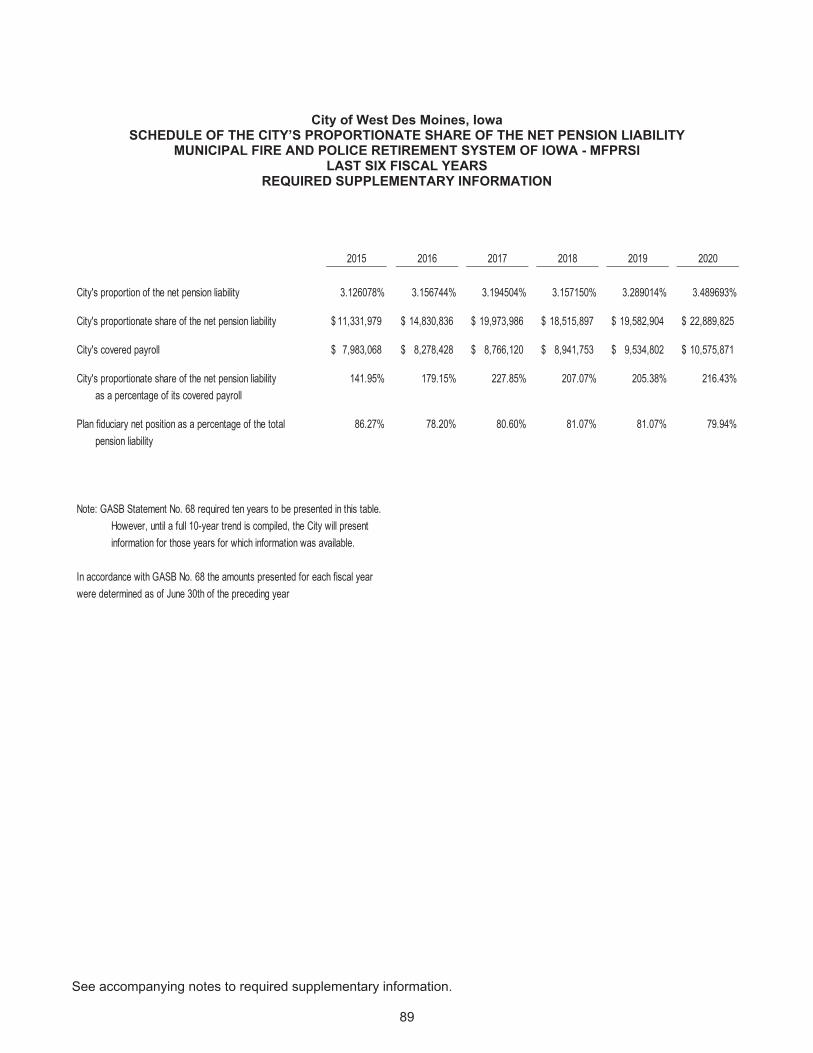
See accompanying notes to required supplementary information.
89
City of West Des Moines, Iowa SCHEDULE OF THE CITY’S PROPORTIONATE SHARE OF THE NET PENSION LIABILITY
MUNICIPAL FIRE AND POLICE RETIREMENT SYSTEM OF IOWA - MFPRSI LAST SIX FISCAL YEARS
REQUIRED SUPPLEMENTARY INFORMATION
2015 2016 2017 2018 2019 2020
City's proportion of the net pension liability 3.126078% 3.156744% 3.194504% 3.157150% 3.289014% 3.489693%
City's proportionate share of the net pension liability 11,331,979$ 14,830,836$ 19,973,986$ 18,515,897$ 19,582,904$ 22,889,825$
City's covered payroll 7,983,068$ 8,278,428$ 8,766,120$ 8,941,753$ 9,534,802$ 10,575,871$
City's proportionate share of the net pension liability 141.95% 179.15% 227.85% 207.07% 205.38% 216.43% as a percentage of its covered payroll
Plan fiduciary net position as a percentage of the total 86.27% 78.20% 80.60% 81.07% 81.07% 79.94% pension liability
Note: GASB Statement No. 68 required ten years to be presented in this table. However, until a full 10-year trend is compiled, the City will present information for those years for which information was available.
In accordance with GASB No. 68 the amounts presented for each fiscal yearwere determined as of June 30th of the preceding year
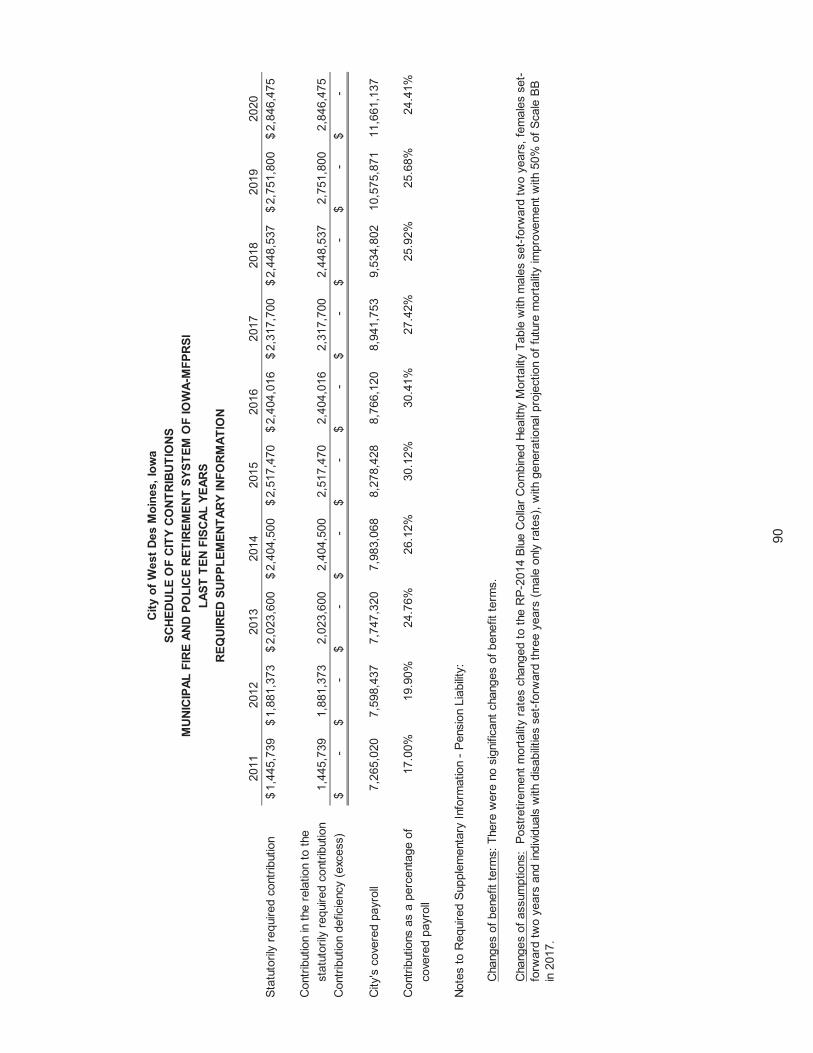
90
2011
2012
2013
2014
2015
2016
2017
2018
2019
2020
Stat
utor
ily re
quire
d co
ntrib
utio
n1,
445,
739
$ 1,
881,
373
$ 2,
023,
600
$ 2,
404,
500
$ 2,
517,
470
$ 2,
404,
016
$ 2,
317,
700
$ 2,
448,
537
$ 2,
751,
800
$ 2,
846,
475
$
Con
tribu
tion
in th
e re
latio
n to
the
st
atut
orily
requ
ired
cont
ribut
ion
1,44
5,73
9
1,88
1,37
3
2,02
3,60
0
2,40
4,50
0
2,51
7,47
0
2,40
4,01
6
2,31
7,70
0
2,44
8,53
7
2,75
1,80
0
2,84
6,47
5
Con
tribu
tion
defic
ienc
y (e
xces
s)-
$
-
$
-
$
-
$
-
$
-
$
-
$
-
$
-
$
-
$
City
's c
over
ed p
ayro
ll7,
265,
020
7,
598,
437
7,
747,
320
7,
983,
068
8,
278,
428
8,
766,
120
8,
941,
753
9,
534,
802
10
,575
,871
11
,661
,137
Con
tribu
tions
as
a pe
rcen
tage
of
17.0
0%19
.90%
24.7
6%26
.12%
30.1
2%30
.41%
27.4
2%25
.92%
25.6
8%24
.41%
cove
red
payr
oll
Note
s to
Req
uire
d Su
pple
men
tary
Info
rmat
ion
- Pen
sion
Lia
bilit
y:
Cha
nges
of b
enef
it te
rms:
The
re w
ere
no s
igni
fican
t cha
nges
of b
enef
it te
rms.
City
of W
est D
es M
oine
s, Io
wa
SCHE
DULE
OF
CITY
CO
NTRI
BUTI
ONS
MUN
ICIP
AL F
IRE
AND
POLI
CE R
ETIR
EMEN
T SY
STEM
OF
IOW
A-M
FPRS
ILA
ST T
EN F
ISCA
L YE
ARS
REQ
UIRE
D SU
PPLE
MEN
TARY
INFO
RMAT
ION
Cha
nges
of a
ssum
ptio
ns:
Post
retir
emen
t mor
talit
y ra
tes
chan
ged
to th
e R
P-20
14 B
lue
Col
lar C
ombi
ned
Heal
thy
Mor
talit
y Ta
ble
with
mal
es s
et-fo
rwar
d tw
o ye
ars,
fem
ales
set
-fo
rwar
d tw
o ye
ars
and
indi
vidua
ls w
ith d
isab
ilitie
s se
t-for
war
d th
ree
year
s (m
ale
only
rate
s), w
ith g
ener
atio
nal p
roje
ctio
n of
futu
re m
orta
lity
impr
ovem
ent w
ith 5
0% o
f Sca
le B
B in
201
7.
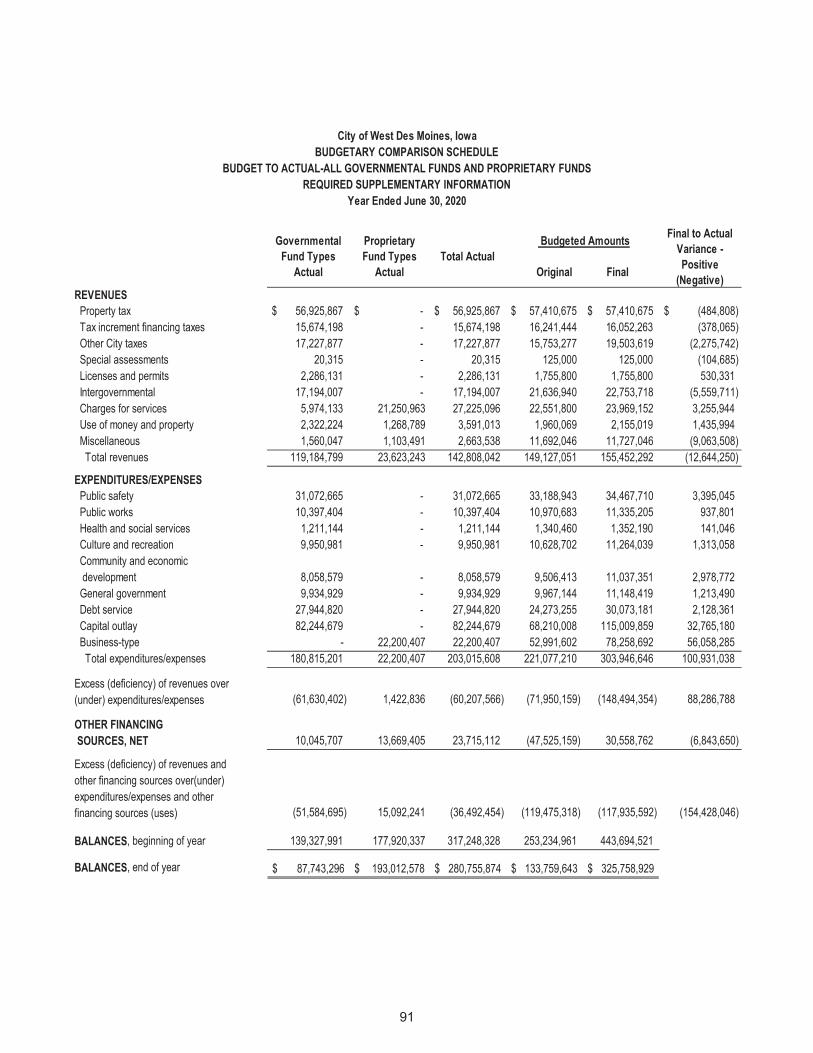
91
Governmental Fund Types
Actual
Proprietary Fund Types
ActualTotal Actual
Final to Actual Variance - Positive
(Negative)REVENUES Property tax $ 56,925,867 $ - $ 56,925,867 $ 57,410,675 $ 57,410,675 $ (484,808) Tax increment financing taxes 15,674,198 - 15,674,198 16,241,444 16,052,263 (378,065) Other City taxes 17,227,877 - 17,227,877 15,753,277 19,503,619 (2,275,742) Special assessments 20,315 - 20,315 125,000 125,000 (104,685) Licenses and permits 2,286,131 - 2,286,131 1,755,800 1,755,800 530,331 Intergovernmental 17,194,007 - 17,194,007 21,636,940 22,753,718 (5,559,711) Charges for services 5,974,133 21,250,963 27,225,096 22,551,800 23,969,152 3,255,944 Use of money and property 2,322,224 1,268,789 3,591,013 1,960,069 2,155,019 1,435,994 Miscellaneous 1,560,047 1,103,491 2,663,538 11,692,046 11,727,046 (9,063,508) Total revenues 119,184,799 23,623,243 142,808,042 149,127,051 155,452,292 (12,644,250)
EXPENDITURES/EXPENSES Public safety 31,072,665 - 31,072,665 33,188,943 34,467,710 3,395,045 Public works 10,397,404 - 10,397,404 10,970,683 11,335,205 937,801 Health and social services 1,211,144 - 1,211,144 1,340,460 1,352,190 141,046 Culture and recreation 9,950,981 - 9,950,981 10,628,702 11,264,039 1,313,058 Community and economic development 8,058,579 - 8,058,579 9,506,413 11,037,351 2,978,772 General government 9,934,929 - 9,934,929 9,967,144 11,148,419 1,213,490 Debt service 27,944,820 - 27,944,820 24,273,255 30,073,181 2,128,361 Capital outlay 82,244,679 - 82,244,679 68,210,008 115,009,859 32,765,180 Business-type - 22,200,407 22,200,407 52,991,602 78,258,692 56,058,285 Total expenditures/expenses 180,815,201 22,200,407 203,015,608 221,077,210 303,946,646 100,931,038
Excess (deficiency) of revenues over (under) expenditures/expenses (61,630,402) 1,422,836 (60,207,566) (71,950,159) (148,494,354) 88,286,788
OTHER FINANCING SOURCES, NET 10,045,707 13,669,405 23,715,112 (47,525,159) 30,558,762 (6,843,650)
Excess (deficiency) of revenues and other financing sources over(under)expenditures/expenses and otherfinancing sources (uses) (51,584,695) 15,092,241 (36,492,454) (119,475,318) (117,935,592) (154,428,046)
BALANCES, beginning of year 139,327,991 177,920,337 317,248,328 253,234,961 443,694,521
BALANCES, end of year 87,743,296$ 193,012,578$ 280,755,874$ 133,759,643$ 325,758,929$
City of West Des Moines, Iowa
Budgeted Amounts
Original Final
Year Ended June 30, 2020REQUIRED SUPPLEMENTARY INFORMATION
BUDGET TO ACTUAL-ALL GOVERNMENTAL FUNDS AND PROPRIETARY FUNDSBUDGETARY COMPARISON SCHEDULE
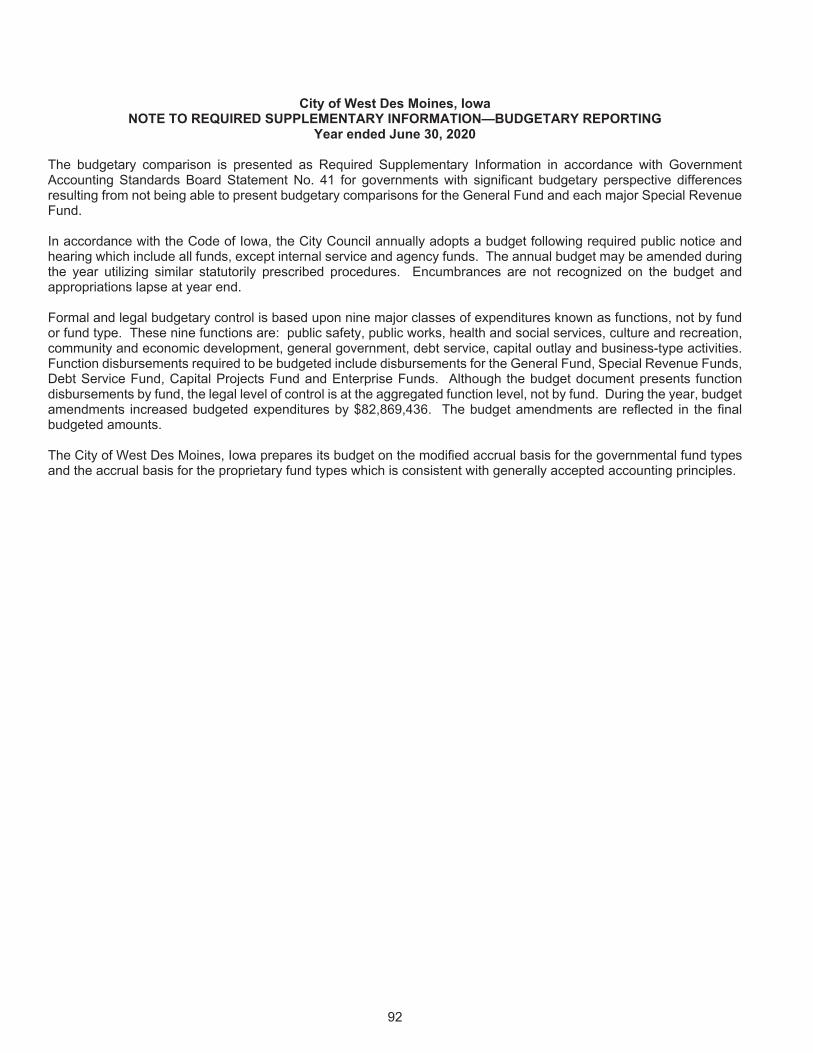
92
City of West Des Moines, Iowa NOTE TO REQUIRED SUPPLEMENTARY INFORMATION—BUDGETARY REPORTING
Year ended June 30, 2020 The budgetary comparison is presented as Required Supplementary Information in accordance with Government Accounting Standards Board Statement No. 41 for governments with significant budgetary perspective differences resulting from not being able to present budgetary comparisons for the General Fund and each major Special Revenue Fund. In accordance with the Code of Iowa, the City Council annually adopts a budget following required public notice and hearing which include all funds, except internal service and agency funds. The annual budget may be amended during the year utilizing similar statutorily prescribed procedures. Encumbrances are not recognized on the budget and appropriations lapse at year end. Formal and legal budgetary control is based upon nine major classes of expenditures known as functions, not by fund or fund type. These nine functions are: public safety, public works, health and social services, culture and recreation, community and economic development, general government, debt service, capital outlay and business-type activities. Function disbursements required to be budgeted include disbursements for the General Fund, Special Revenue Funds, Debt Service Fund, Capital Projects Fund and Enterprise Funds. Although the budget document presents function disbursements by fund, the legal level of control is at the aggregated function level, not by fund. During the year, budget amendments increased budgeted expenditures by $82,869,436. The budget amendments are reflected in the final budgeted amounts. The City of West Des Moines, Iowa prepares its budget on the modified accrual basis for the governmental fund types and the accrual basis for the proprietary fund types which is consistent with generally accepted accounting principles.
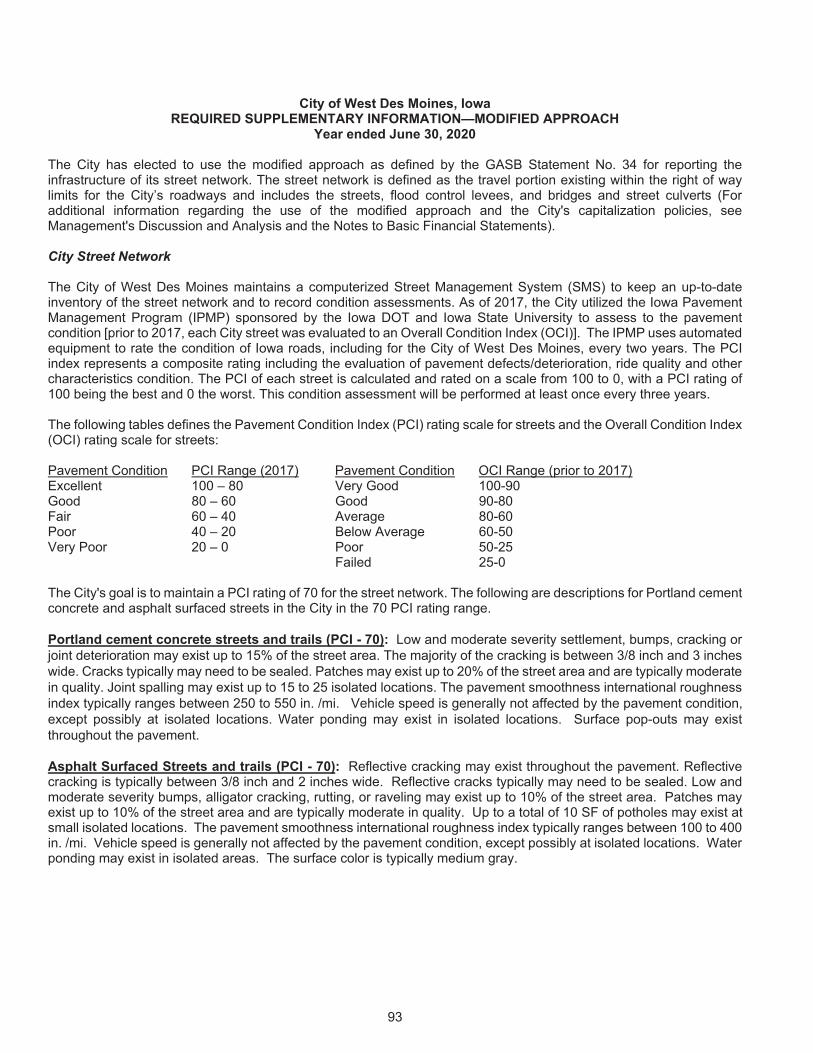
93
City of West Des Moines, Iowa REQUIRED SUPPLEMENTARY INFORMATION—MODIFIED APPROACH
Year ended June 30, 2020 The City has elected to use the modified approach as defined by the GASB Statement No. 34 for reporting the infrastructure of its street network. The street network is defined as the travel portion existing within the right of way limits for the City’s roadways and includes the streets, flood control levees, and bridges and street culverts (For additional information regarding the use of the modified approach and the City's capitalization policies, see Management's Discussion and Analysis and the Notes to Basic Financial Statements). City Street Network The City of West Des Moines maintains a computerized Street Management System (SMS) to keep an up-to-date inventory of the street network and to record condition assessments. As of 2017, the City utilized the Iowa Pavement Management Program (IPMP) sponsored by the Iowa DOT and Iowa State University to assess to the pavement condition [prior to 2017, each City street was evaluated to an Overall Condition Index (OCI)]. The IPMP uses automated equipment to rate the condition of Iowa roads, including for the City of West Des Moines, every two years. The PCI index represents a composite rating including the evaluation of pavement defects/deterioration, ride quality and other characteristics condition. The PCI of each street is calculated and rated on a scale from 100 to 0, with a PCI rating of 100 being the best and 0 the worst. This condition assessment will be performed at least once every three years. The following tables defines the Pavement Condition Index (PCI) rating scale for streets and the Overall Condition Index (OCI) rating scale for streets: Pavement Condition PCI Range (2017) Pavement Condition OCI Range (prior to 2017) Excellent 100 – 80 Very Good 100-90 Good 80 – 60 Good 90-80 Fair 60 – 40 Average 80-60 Poor 40 – 20 Below Average 60-50 Very Poor 20 – 0 Poor 50-25 Failed 25-0 The City's goal is to maintain a PCI rating of 70 for the street network. The following are descriptions for Portland cement concrete and asphalt surfaced streets in the City in the 70 PCI rating range. Portland cement concrete streets and trails (PCI - 70): Low and moderate severity settlement, bumps, cracking or joint deterioration may exist up to 15% of the street area. The majority of the cracking is between 3/8 inch and 3 inches wide. Cracks typically may need to be sealed. Patches may exist up to 20% of the street area and are typically moderate in quality. Joint spalling may exist up to 15 to 25 isolated locations. The pavement smoothness international roughness index typically ranges between 250 to 550 in. /mi. Vehicle speed is generally not affected by the pavement condition, except possibly at isolated locations. Water ponding may exist in isolated locations. Surface pop-outs may exist throughout the pavement. Asphalt Surfaced Streets and trails (PCI - 70): Reflective cracking may exist throughout the pavement. Reflective cracking is typically between 3/8 inch and 2 inches wide. Reflective cracks typically may need to be sealed. Low and moderate severity bumps, alligator cracking, rutting, or raveling may exist up to 10% of the street area. Patches may exist up to 10% of the street area and are typically moderate in quality. Up to a total of 10 SF of potholes may exist at small isolated locations. The pavement smoothness international roughness index typically ranges between 100 to 400 in. /mi. Vehicle speed is generally not affected by the pavement condition, except possibly at isolated locations. Water ponding may exist in isolated areas. The surface color is typically medium gray.
94
City of West Des Moines, Iowa REQUIRED SUPPLEMENTARY INFORMATION—MODIFIED APPROACH (continued)
Year ended June 30, 2020 City Flood Control Levee System The City’s federal levees and associated flood control elements are inspected and maintained per the U.S. Army Corp of Engineers criteria. The Army Corp inspects the flood control levee system in the City every two years. The Army Corps rating criteria for the flood control levee system is Acceptable, Minimally Acceptable and Unacceptable. The City's goal is to maintain as least a minimally acceptable rating for the levee system. The following is the description for minimally acceptable rating. Levees and Associated Flood Control Elements (Army Corp. Rating – Minimally Acceptable): One or more items are rated as Minimally Acceptable or one or more items are rated as unacceptable and an engineering determination concludes that unacceptable items would not prevent the segment / system from performing as intended during the next flood event. City Bridges and Large Street Culverts The City’s vehicle bridges, large drainage and box culverts and pedestrian underpasses under streets greater than 20 ft. in span are inspected every two years using the Iowa DOT / FHWA National Bridge Inspection System (NBIS). The NBIS evaluates each structure for drainage, scour/erosion, debris, surface and structural deficiencies. The NBIS gives each structure a Sufficiency Rating (SR). The SR is composite score of the evaluation items. The SR of each structure is calculated and rated on a scale from 100 to 0, with a SR of 100 being the best and 0 the worst. The City's goal is to maintain a SR of 80 or better for each bridge or culvert structure. The following are descriptions for an 80 Sufficiency Rating. Bridge and Large Street Culverts (FHWA & Iowa DOT Sufficiency Rating – 81 or Greater): The item is structurally sound and there appears to be no immediate safety hazards. Minor cracking, scaling, leaching, channel silting and vegetation, or other minor problems may exist in isolated locations. Minor problems, if any exist, do not appear to have an immediate impact on structural integrity or safety.
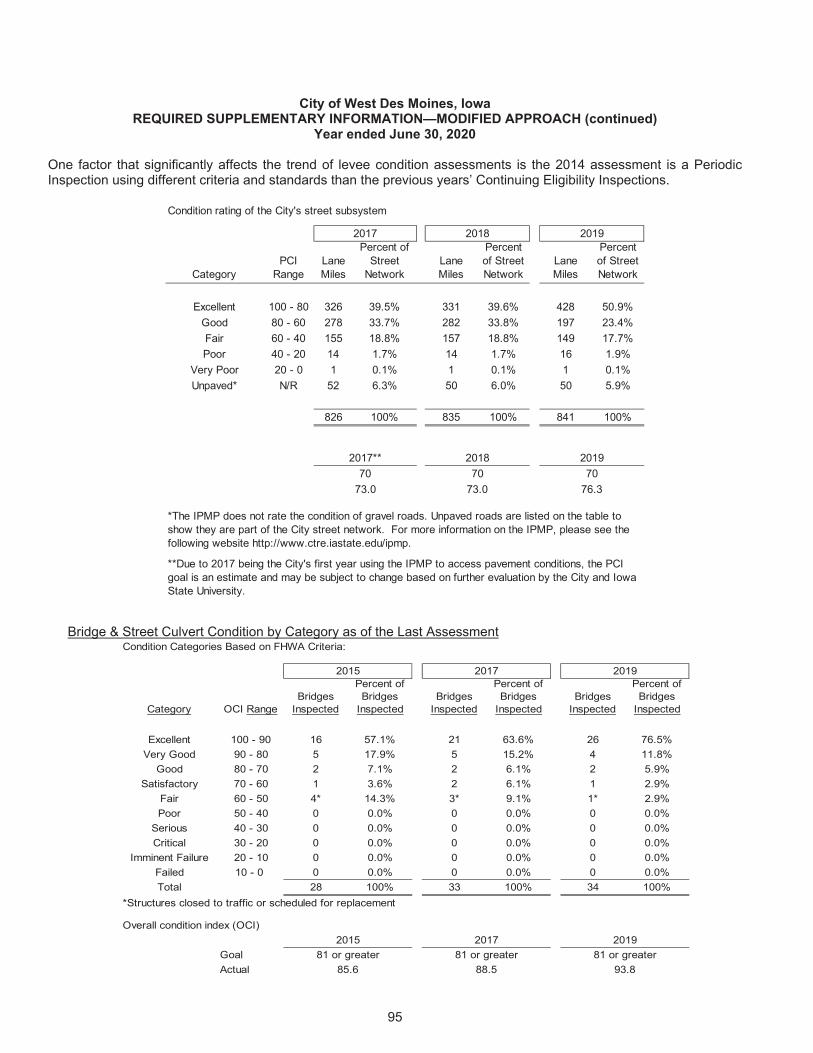
95
City of West Des Moines, Iowa REQUIRED SUPPLEMENTARY INFORMATION—MODIFIED APPROACH (continued)
Year ended June 30, 2020 One factor that significantly affects the trend of levee condition assessments is the 2014 assessment is a Periodic Inspection using different criteria and standards than the previous years’ Continuing Eligibility Inspections.
Condition rating of the City's street subsystem
CategoryPCI
RangeLane Miles
Percent of Street
NetworkLane Miles
Percent of Street Network
Lane Miles
Percent of Street Network
Excellent 100 - 80 326 39.5% 331 39.6% 428 50.9%Good 80 - 60 278 33.7% 282 33.8% 197 23.4%Fair 60 - 40 155 18.8% 157 18.8% 149 17.7%Poor 40 - 20 14 1.7% 14 1.7% 16 1.9%
Very Poor 20 - 0 1 0.1% 1 0.1% 1 0.1%Unpaved* N/R 52 6.3% 50 6.0% 50 5.9%
826 100% 835 100% 841 100%
2019
201970
76.3
*The IPMP does not rate the condition of gravel roads. Unpaved roads are listed on the table to show they are part of the City street network. For more information on the IPMP, please see the following website http://www.ctre.iastate.edu/ipmp.
2017 2018
2017** 2018
**Due to 2017 being the City's first year using the IPMP to access pavement conditions, the PCI goal is an estimate and may be subject to change based on further evaluation by the City and Iowa State University.
70 7073.0 73.0
Bridge & Street Culvert Condition by Category as of the Last Assessment Condition Categories Based on FHWA Criteria:
Category OCI RangeBridges
Inspected
Percent of Bridges
InspectedBridges
Inspected
Percent of Bridges
InspectedBridges
Inspected
Percent of Bridges
Inspected
Excellent 100 - 90 16 57.1% 21 63.6% 26 76.5%Very Good 90 - 80 5 17.9% 5 15.2% 4 11.8%
Good 80 - 70 2 7.1% 2 6.1% 2 5.9%Satisfactory 70 - 60 1 3.6% 2 6.1% 1 2.9%
Fair 60 - 50 4* 14.3% 3* 9.1% 1* 2.9%Poor 50 - 40 0 0.0% 0 0.0% 0 0.0%
Serious 40 - 30 0 0.0% 0 0.0% 0 0.0%Critical 30 - 20 0 0.0% 0 0.0% 0 0.0%
Imminent Failure 20 - 10 0 0.0% 0 0.0% 0 0.0%Failed 10 - 0 0 0.0% 0 0.0% 0 0.0%Total 28 100% 33 100% 34 100%
*Structures closed to traffic or scheduled for replacement
Overall condition index (OCI)
GoalActual
2015 2017 2019
2015 2017 201981 or greater
85.681 or greater
88.581 or greater
93.8
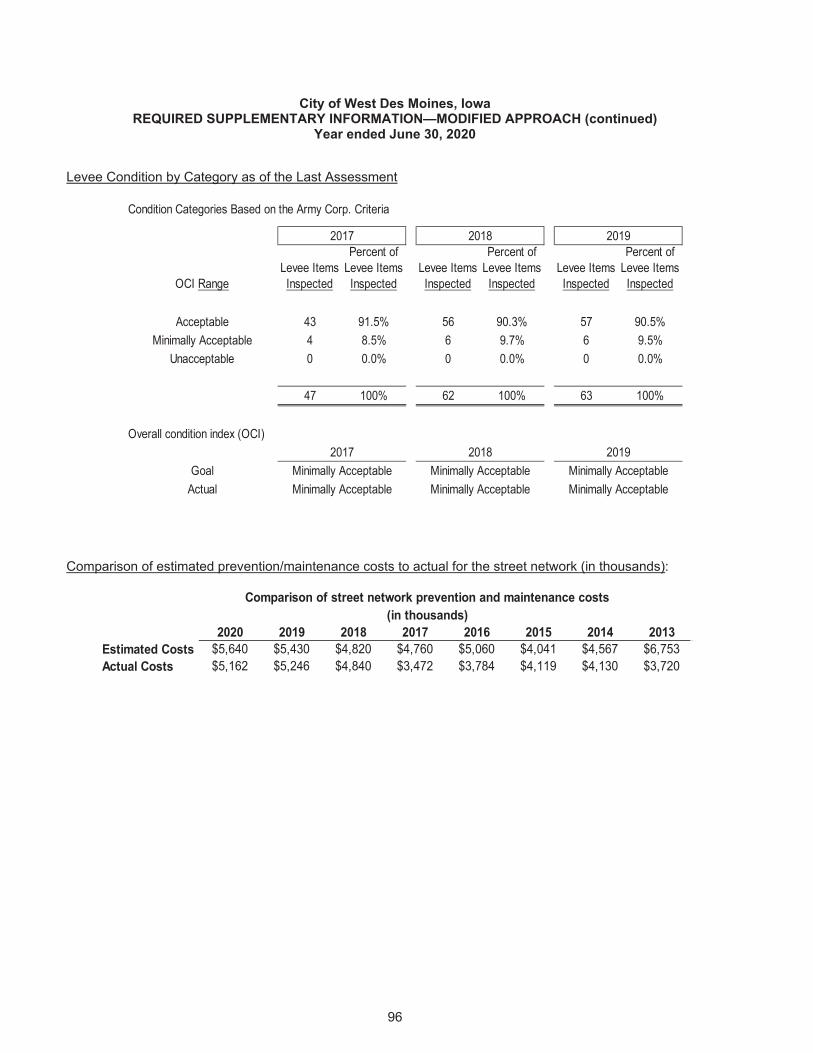
96
City of West Des Moines, Iowa REQUIRED SUPPLEMENTARY INFORMATION—MODIFIED APPROACH (continued)
Year ended June 30, 2020 Levee Condition by Category as of the Last Assessment
Condition Categories Based on the Army Corp. Criteria
OCI RangeLevee Items Inspected
Percent of Levee Items Inspected
Levee Items Inspected
Percent of Levee Items Inspected
Levee Items Inspected
Percent of Levee Items Inspected
Acceptable 43 91.5% 56 90.3% 57 90.5%Minimally Acceptable 4 8.5% 6 9.7% 6 9.5%
Unacceptable 0 0.0% 0 0.0% 0 0.0%
47 100% 62 100% 63 100%
Overall condition index (OCI)
GoalActual
2017
2017Minimally AcceptableMinimally Acceptable
Minimally AcceptableMinimally Acceptable
Minimally AcceptableMinimally Acceptable
2018 2019
2018 2019
Comparison of estimated prevention/maintenance costs to actual for the street network (in thousands):
2020 2019 2018 2017 2016 2015 2014 2013Estimated Costs $5,640 $5,430 $4,820 $4,760 $5,060 $4,041 $4,567 $6,753Actual Costs $5,162 $5,246 $4,840 $3,472 $3,784 $4,119 $4,130 $3,720
Comparison of street network prevention and maintenance costs(in thousands)

97
This page is intentionally blank
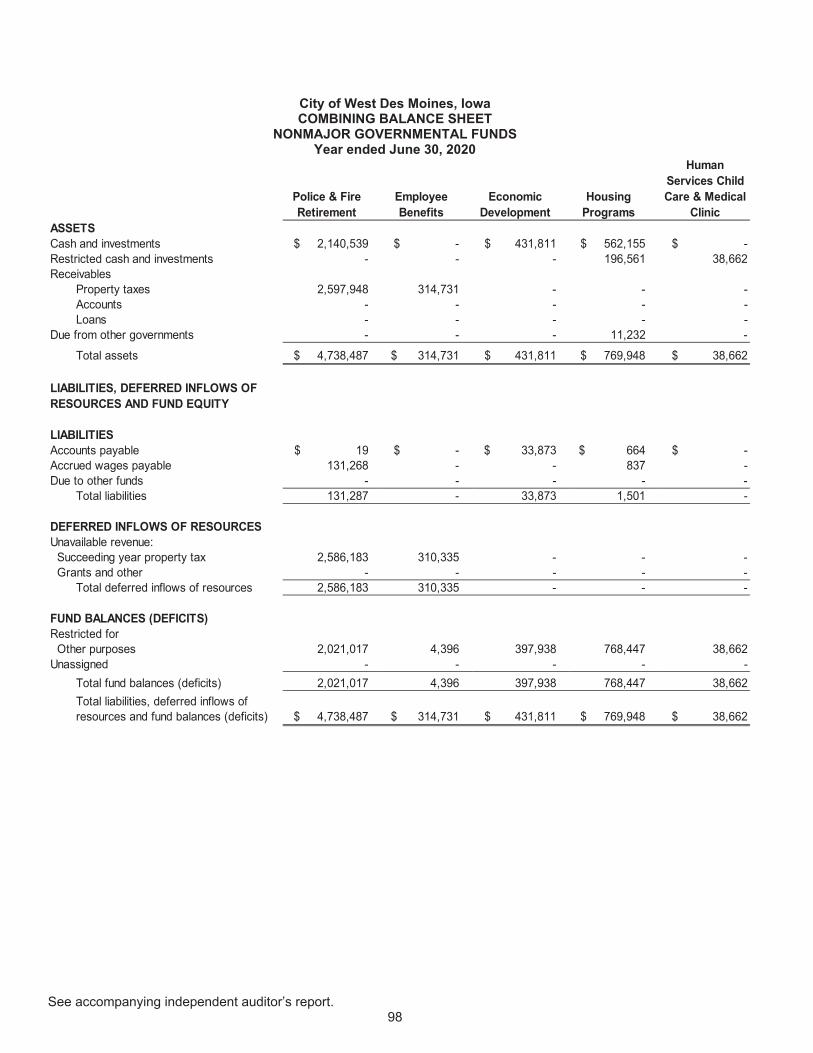
See accompanying independent auditor’s report. 98
City of West Des Moines, Iowa COMBINING BALANCE SHEET
NONMAJOR GOVERNMENTAL FUNDS Year ended June 30, 2020
Police & Fire Retirement
Employee Benefits
Economic Development
Housing Programs
Human Services Child Care & Medical
ClinicASSETSCash and investments $ 2,140,539 $ - $ 431,811 $ 562,155 $ - Restricted cash and investments - - - 196,561 38,662 Receivables
Property taxes 2,597,948 314,731 - - - Accounts - - - - - Loans - - - - -
Due from other governments - - - 11,232 - Total assets $ 4,738,487 $ 314,731 $ 431,811 $ 769,948 $ 38,662
LIABILITIES, DEFERRED INFLOWS OF RESOURCES AND FUND EQUITY
LIABILITIESAccounts payable $ 19 $ - $ 33,873 $ 664 $ - Accrued wages payable 131,268 - - 837 - Due to other funds - - - - -
Total liabilities 131,287 - 33,873 1,501 -
DEFERRED INFLOWS OF RESOURCESUnavailable revenue: Succeeding year property tax 2,586,183 310,335 - - - Grants and other - - - - -
Total deferred inflows of resources 2,586,183 310,335 - - -
FUND BALANCES (DEFICITS)Restricted for Other purposes 2,021,017 4,396 397,938 768,447 38,662 Unassigned - - - - -
Total fund balances (deficits) 2,021,017 4,396 397,938 768,447 38,662 Total liabilities, deferred inflows of resources and fund balances (deficits) $ 4,738,487 $ 314,731 $ 431,811 $ 769,948 $ 38,662
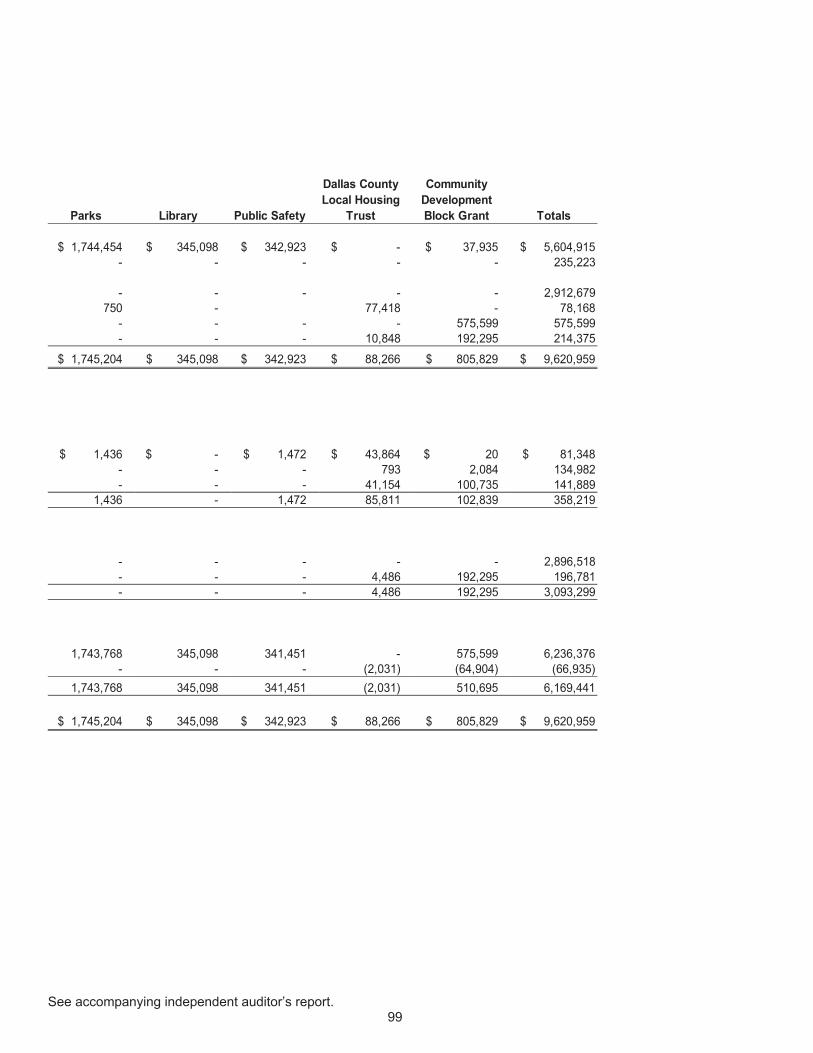
See accompanying independent auditor’s report. 99
Parks Library Public Safety
Dallas County Local Housing
Trust
Community Development Block Grant Totals
$ 1,744,454 $ 345,098 $ 342,923 $ - $ 37,935 $ 5,604,915 - - - - - 235,223
- - - - - 2,912,679 750 - 77,418 - 78,168 - - - - 575,599 575,599 - - - 10,848 192,295 214,375 $ 1,745,204 $ 345,098 $ 342,923 $ 88,266 $ 805,829 $ 9,620,959
$ 1,436 $ - $ 1,472 $ 43,864 $ 20 $ 81,348 - - - 793 2,084 134,982 - - - 41,154 100,735 141,889 1,436 - 1,472 85,811 102,839 358,219
- - - - - 2,896,518 - - - 4,486 192,295 196,781 - - - 4,486 192,295 3,093,299
1,743,768 345,098 341,451 - 575,599 6,236,376 - - - (2,031) (64,904) (66,935) 1,743,768 345,098 341,451 (2,031) 510,695 6,169,441
$ 1,745,204 $ 345,098 $ 342,923 $ 88,266 $ 805,829 $ 9,620,959
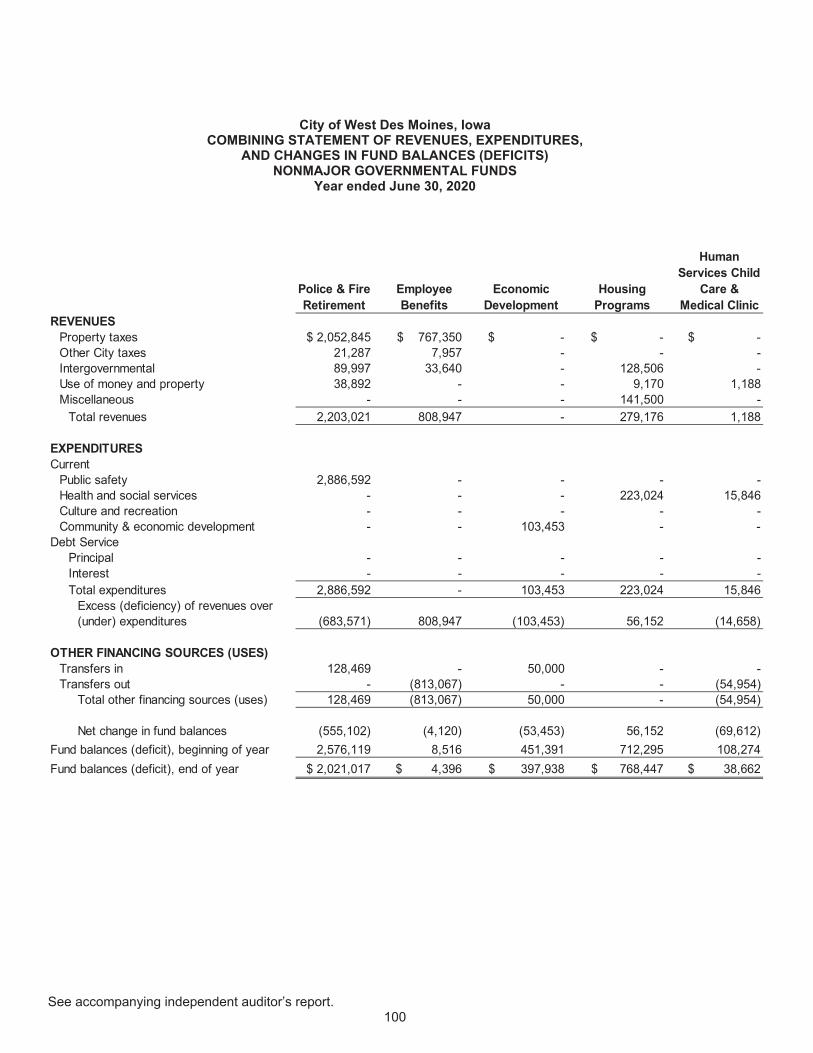
See accompanying independent auditor’s report. 100
City of West Des Moines, Iowa
COMBINING STATEMENT OF REVENUES, EXPENDITURES, AND CHANGES IN FUND BALANCES (DEFICITS)
NONMAJOR GOVERNMENTAL FUNDS Year ended June 30, 2020
Police & Fire Retirement
Employee Benefits
Economic Development
Housing Programs
Human Services Child
Care & Medical Clinic
REVENUESProperty taxes $ 2,052,845 $ 767,350 $ - $ - $ - Other City taxes 21,287 7,957 - - - Intergovernmental 89,997 33,640 - 128,506 - Use of money and property 38,892 - - 9,170 1,188 Miscellaneous - - - 141,500 -
Total revenues 2,203,021 808,947 - 279,176 1,188
EXPENDITURESCurrent
Public safety 2,886,592 - - - - Health and social services - - - 223,024 15,846 Culture and recreation - - - - - Community & economic development - - 103,453 - -
Debt ServicePrincipal - - - - - Interest - - - - - Total expenditures 2,886,592 - 103,453 223,024 15,846
Excess (deficiency) of revenues over (under) expenditures (683,571) 808,947 (103,453) 56,152 (14,658)
OTHER FINANCING SOURCES (USES)Transfers in 128,469 - 50,000 - - Transfers out - (813,067) - - (54,954)
Total other financing sources (uses) 128,469 (813,067) 50,000 - (54,954)
Net change in fund balances (555,102) (4,120) (53,453) 56,152 (69,612)Fund balances (deficit), beginning of year 2,576,119 8,516 451,391 712,295 108,274 Fund balances (deficit), end of year $ 2,021,017 $ 4,396 $ 397,938 $ 768,447 $ 38,662
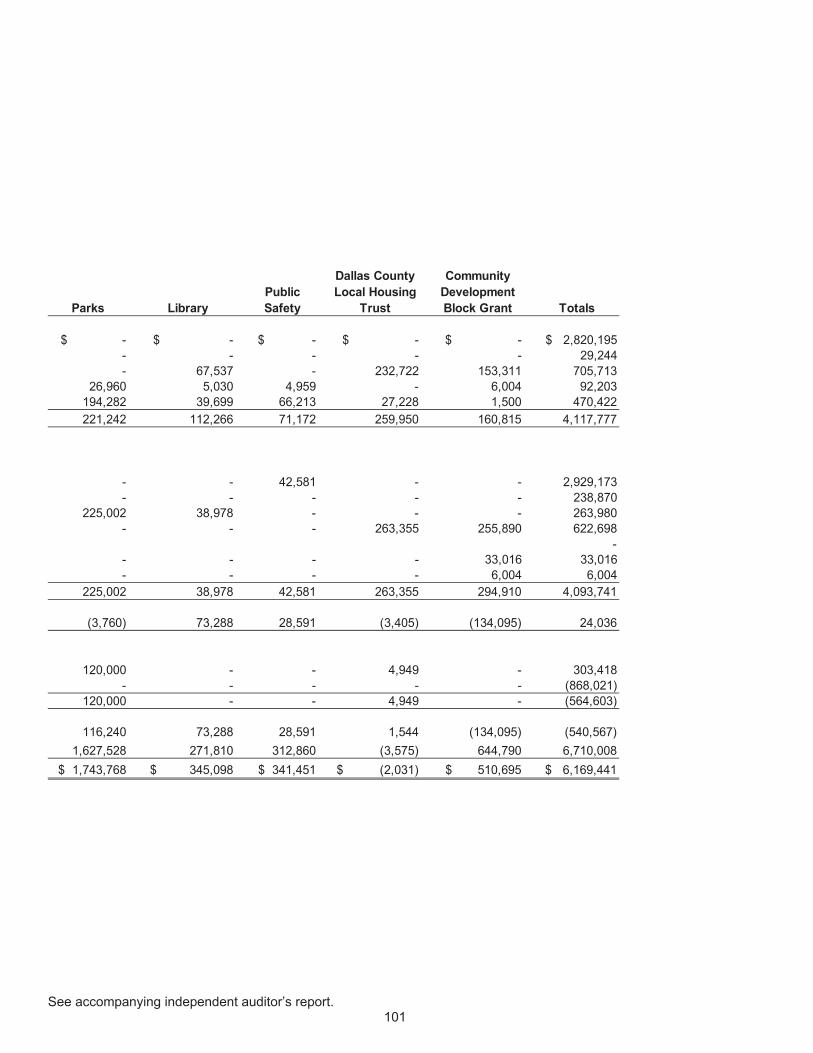
See accompanying independent auditor’s report. 101
Parks LibraryPublic Safety
Dallas County Local Housing
Trust
Community Development Block Grant Totals
$ - $ - $ - $ - $ - $ 2,820,195 - - - - - 29,244 - 67,537 - 232,722 153,311 705,713 26,960 5,030 4,959 - 6,004 92,203 194,282 39,699 66,213 27,228 1,500 470,422 221,242 112,266 71,172 259,950 160,815 4,117,777
- - 42,581 - - 2,929,173 - - - - - 238,870 225,002 38,978 - - - 263,980 - - - 263,355 255,890 622,698
- - - - - 33,016 33,016 - - - - 6,004 6,004 225,002 38,978 42,581 263,355 294,910 4,093,741
(3,760) 73,288 28,591 (3,405) (134,095) 24,036
120,000 - - 4,949 - 303,418 - - - - - (868,021) 120,000 - - 4,949 - (564,603)
116,240 73,288 28,591 1,544 (134,095) (540,567) 1,627,528 271,810 312,860 (3,575) 644,790 6,710,008 $ 1,743,768 $ 345,098 $ 341,451 $ (2,031) $ 510,695 $ 6,169,441
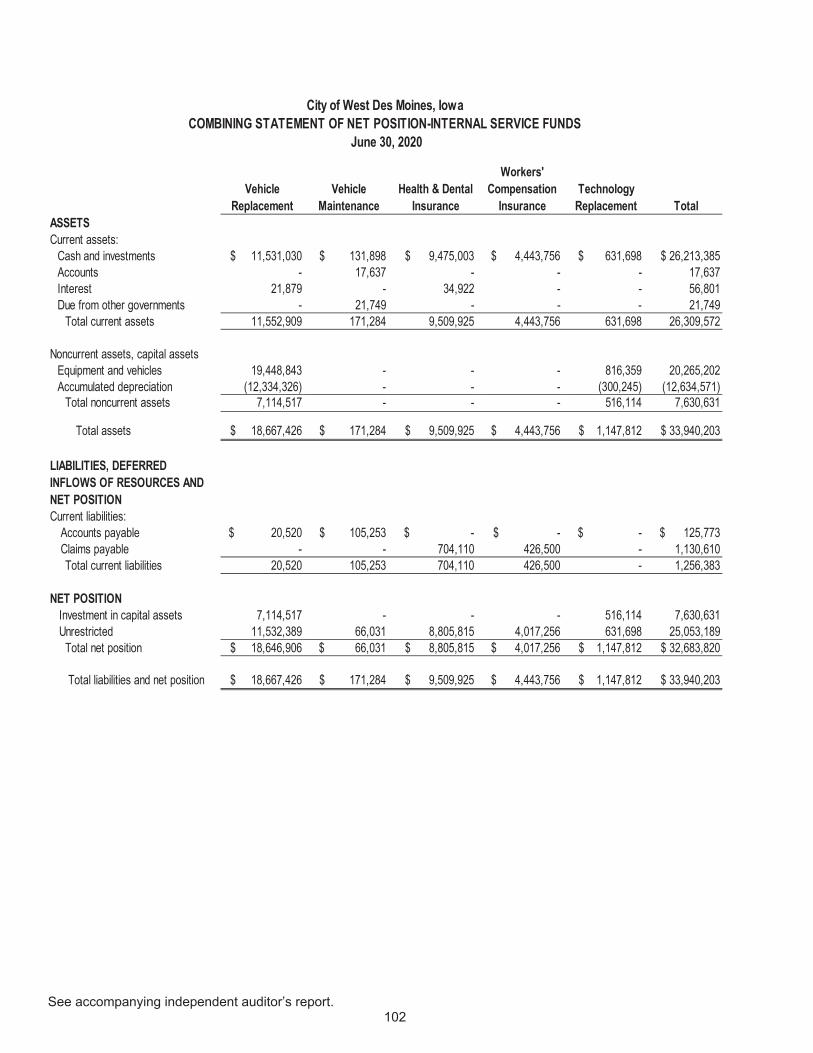
See accompanying independent auditor’s report. 102
Vehicle Replacement
Vehicle Maintenance
Health & Dental Insurance
Workers' Compensation
InsuranceTechnology
Replacement TotalASSETSCurrent assets:
Cash and investments $ 11,531,030 $ 131,898 $ 9,475,003 $ 4,443,756 $ 631,698 $ 26,213,385 Accounts - 17,637 - - - 17,637 Interest 21,879 - 34,922 - - 56,801 Due from other governments - 21,749 - - - 21,749
Total current assets 11,552,909 171,284 9,509,925 4,443,756 631,698 26,309,572
Noncurrent assets, capital assetsEquipment and vehicles 19,448,843 - - - 816,359 20,265,202 Accumulated depreciation (12,334,326) - - - (300,245) (12,634,571)
Total noncurrent assets 7,114,517 - - - 516,114 7,630,631
Total assets $ 18,667,426 $ 171,284 $ 9,509,925 $ 4,443,756 $ 1,147,812 $ 33,940,203
LIABILITIES, DEFERRED INFLOWS OF RESOURCES AND NET POSITIONCurrent liabilities:
Accounts payable $ 20,520 $ 105,253 $ - $ - $ - $ 125,773 Claims payable - - 704,110 426,500 - 1,130,610
Total current liabilities 20,520 105,253 704,110 426,500 - 1,256,383
NET POSITION Investment in capital assets 7,114,517 - - - 516,114 7,630,631 Unrestricted 11,532,389 66,031 8,805,815 4,017,256 631,698 25,053,189
Total net position $ 18,646,906 $ 66,031 $ 8,805,815 $ 4,017,256 $ 1,147,812 $ 32,683,820
Total liabilities and net position $ 18,667,426 $ 171,284 $ 9,509,925 $ 4,443,756 $ 1,147,812 $ 33,940,203
City of West Des Moines, IowaCOMBINING STATEMENT OF NET POSITION-INTERNAL SERVICE FUNDS
June 30, 2020
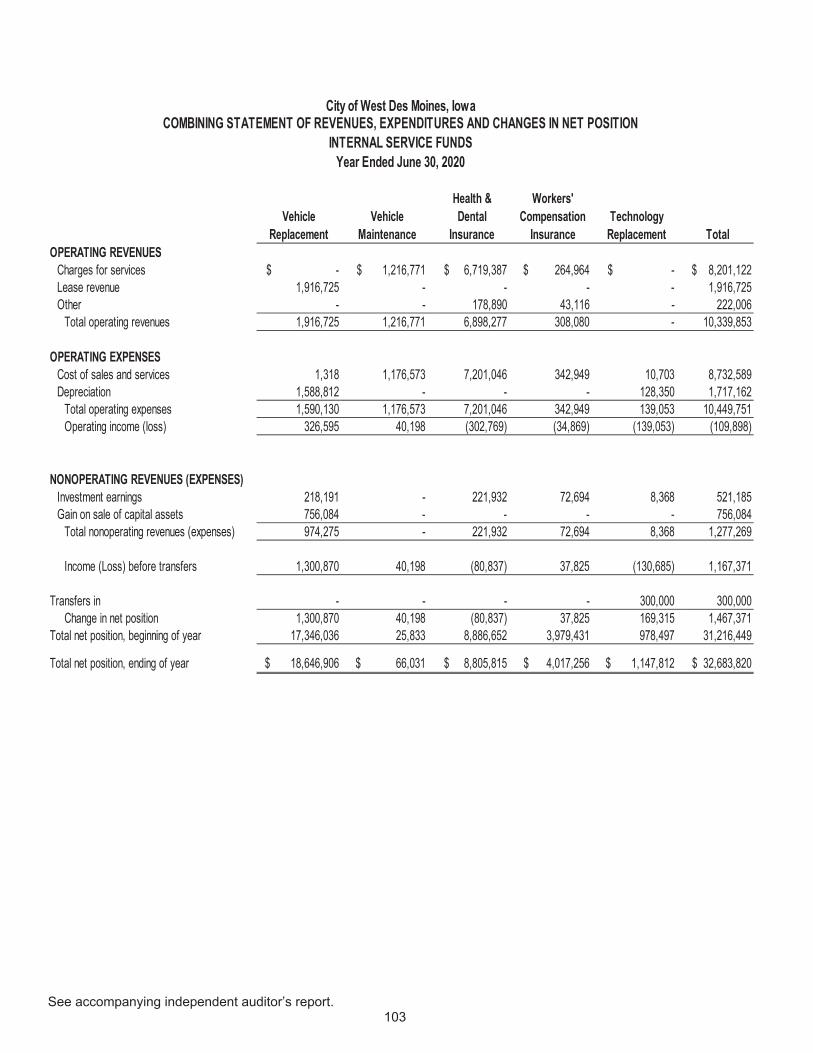
See accompanying independent auditor’s report. 103
Vehicle Replacement
Vehicle Maintenance
Health & Dental
Insurance
Workers' Compensation
InsuranceTechnology
Replacement TotalOPERATING REVENUES
Charges for services $ - $ 1,216,771 $ 6,719,387 $ 264,964 $ - $ 8,201,122 Lease revenue 1,916,725 - - - - 1,916,725 Other - - 178,890 43,116 - 222,006
Total operating revenues 1,916,725 1,216,771 6,898,277 308,080 - 10,339,853
OPERATING EXPENSESCost of sales and services 1,318 1,176,573 7,201,046 342,949 10,703 8,732,589 Depreciation 1,588,812 - - - 128,350 1,717,162
Total operating expenses 1,590,130 1,176,573 7,201,046 342,949 139,053 10,449,751 Operating income (loss) 326,595 40,198 (302,769) (34,869) (139,053) (109,898)
NONOPERATING REVENUES (EXPENSES)Investment earnings 218,191 - 221,932 72,694 8,368 521,185 Gain on sale of capital assets 756,084 - - - - 756,084
Total nonoperating revenues (expenses) 974,275 - 221,932 72,694 8,368 1,277,269
Income (Loss) before transfers 1,300,870 40,198 (80,837) 37,825 (130,685) 1,167,371
Transfers in - - - - 300,000 300,000 Change in net position 1,300,870 40,198 (80,837) 37,825 169,315 1,467,371
Total net position, beginning of year 17,346,036 25,833 8,886,652 3,979,431 978,497 31,216,449
Total net position, ending of year $ 18,646,906 $ 66,031 $ 8,805,815 $ 4,017,256 $ 1,147,812 $ 32,683,820
City of West Des Moines, IowaCOMBINING STATEMENT OF REVENUES, EXPENDITURES AND CHANGES IN NET POSITION
INTERNAL SERVICE FUNDSYear Ended June 30, 2020
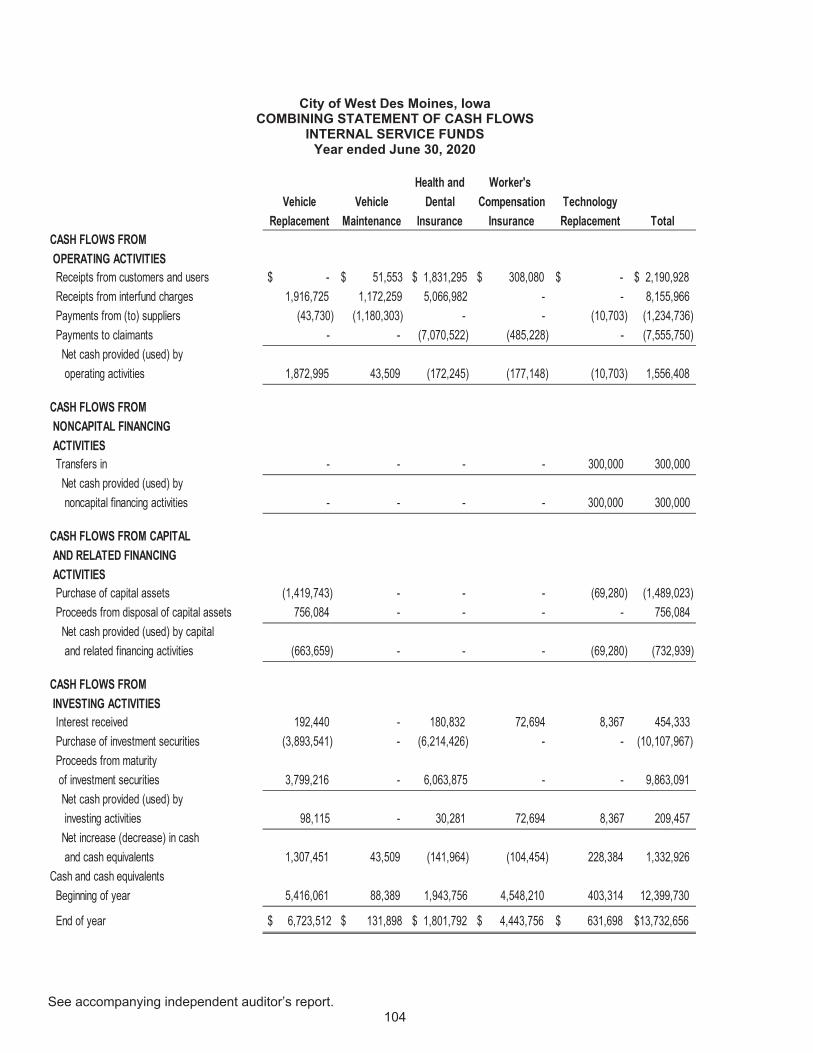
See accompanying independent auditor’s report. 104
City of West Des Moines, Iowa COMBINING STATEMENT OF CASH FLOWS
INTERNAL SERVICE FUNDS Year ended June 30, 2020
Health and Worker's
Vehicle Vehicle Dental Compensation TechnologyReplacement Maintenance Insurance Insurance Replacement Total
CASH FLOWS FROM OPERATING ACTIVITIES Receipts from customers and users $ - $ 51,553 $ 1,831,295 $ 308,080 $ - $ 2,190,928 Receipts from interfund charges 1,916,725 1,172,259 5,066,982 - - 8,155,966 Payments from (to) suppliers (43,730) (1,180,303) - - (10,703) (1,234,736) Payments to claimants - - (7,070,522) (485,228) - (7,555,750) Net cash provided (used) by operating activities 1,872,995 43,509 (172,245) (177,148) (10,703) 1,556,408
CASH FLOWS FROM NONCAPITAL FINANCING ACTIVITIES Transfers in - - - - 300,000 300,000 Net cash provided (used) by noncapital financing activities - - - - 300,000 300,000
CASH FLOWS FROM CAPITAL AND RELATED FINANCING ACTIVITIES Purchase of capital assets (1,419,743) - - - (69,280) (1,489,023) Proceeds from disposal of capital assets 756,084 - - - - 756,084 Net cash provided (used) by capital and related financing activities (663,659) - - - (69,280) (732,939)
CASH FLOWS FROM INVESTING ACTIVITIES Interest received 192,440 - 180,832 72,694 8,367 454,333 Purchase of investment securities (3,893,541) - (6,214,426) - - (10,107,967) Proceeds from maturity of investment securities 3,799,216 - 6,063,875 - - 9,863,091 Net cash provided (used) by investing activities 98,115 - 30,281 72,694 8,367 209,457 Net increase (decrease) in cash and cash equivalents 1,307,451 43,509 (141,964) (104,454) 228,384 1,332,926 Cash and cash equivalents Beginning of year 5,416,061 88,389 1,943,756 4,548,210 403,314 12,399,730
End of year $ 6,723,512 $ 131,898 $ 1,801,792 $ 4,443,756 $ 631,698 $13,732,656
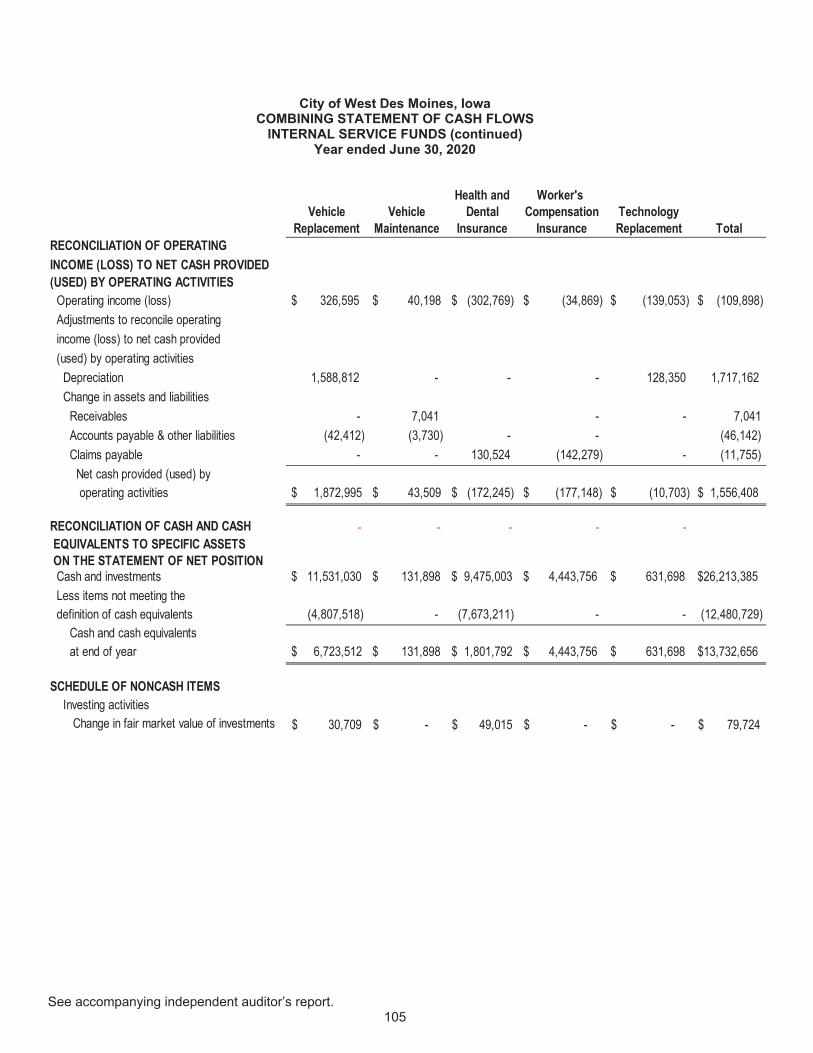
See accompanying independent auditor’s report. 105
City of West Des Moines, Iowa COMBINING STATEMENT OF CASH FLOWS
INTERNAL SERVICE FUNDS (continued) Year ended June 30, 2020
Health and Worker's Vehicle Vehicle Dental Compensation Technology
Replacement Maintenance Insurance Insurance Replacement TotalRECONCILIATION OF OPERATINGINCOME (LOSS) TO NET CASH PROVIDED (USED) BY OPERATING ACTIVITIES Operating income (loss) $ 326,595 $ 40,198 $ (302,769) $ (34,869) $ (139,053) $ (109,898) Adjustments to reconcile operating income (loss) to net cash provided (used) by operating activities Depreciation 1,588,812 - - - 128,350 1,717,162 Change in assets and liabilities Receivables - 7,041 - - 7,041 Accounts payable & other liabilities (42,412) (3,730) - - (46,142) Claims payable - - 130,524 (142,279) - (11,755) Net cash provided (used) by operating activities $ 1,872,995 $ 43,509 $ (172,245) $ (177,148) $ (10,703) $ 1,556,408
RECONCILIATION OF CASH AND CASH EQUIVALENTS TO SPECIFIC ASSETS ON THE STATEMENT OF NET POSITION Cash and investments $ 11,531,030 $ 131,898 $ 9,475,003 $ 4,443,756 $ 631,698 $26,213,385 Less items not meeting the definition of cash equivalents (4,807,518) - (7,673,211) - - (12,480,729) Cash and cash equivalents at end of year $ 6,723,512 $ 131,898 $ 1,801,792 $ 4,443,756 $ 631,698 $13,732,656
SCHEDULE OF NONCASH ITEMS Investing activities Change in fair market value of investments 30,709$ -$ 49,015$ -$ -$ 79,724$
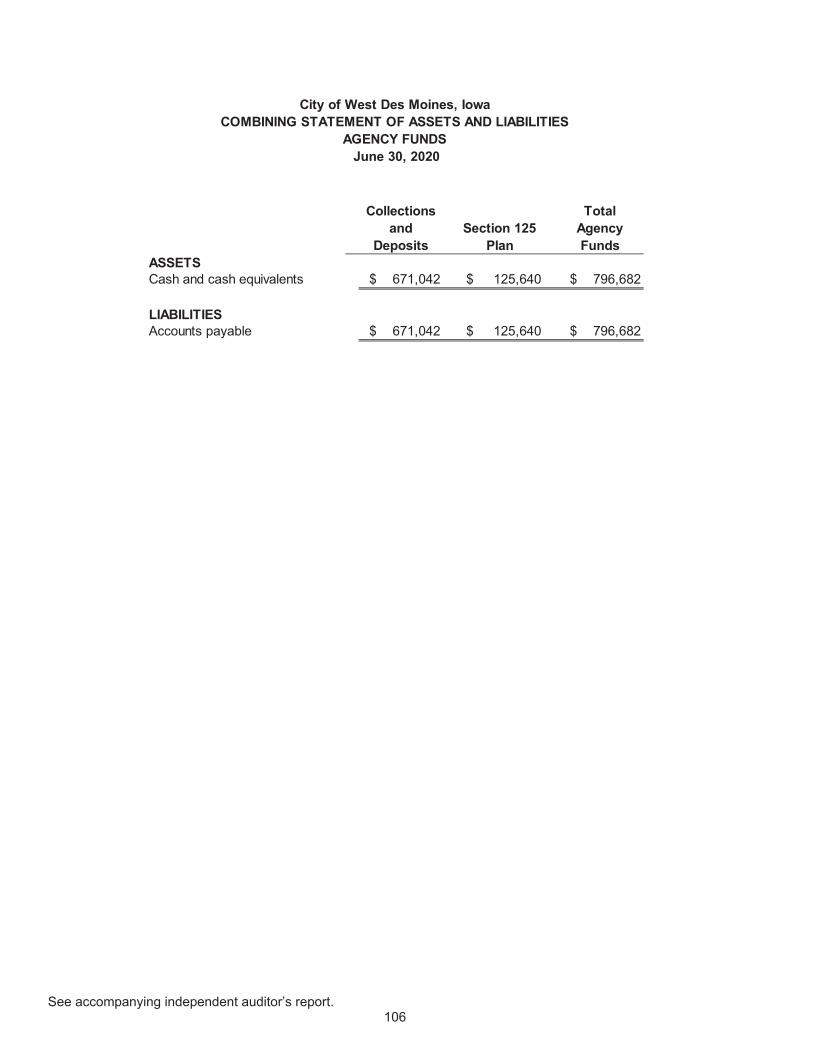
See accompanying independent auditor’s report. 106
Collections and
DepositsSection 125
Plan
Total Agency Funds
ASSETSCash and cash equivalents $ 671,042 $ 125,640 $ 796,682
LIABILITIESAccounts payable $ 671,042 $ 125,640 $ 796,682
City of West Des Moines, IowaCOMBINING STATEMENT OF ASSETS AND LIABILITIES
AGENCY FUNDS June 30, 2020
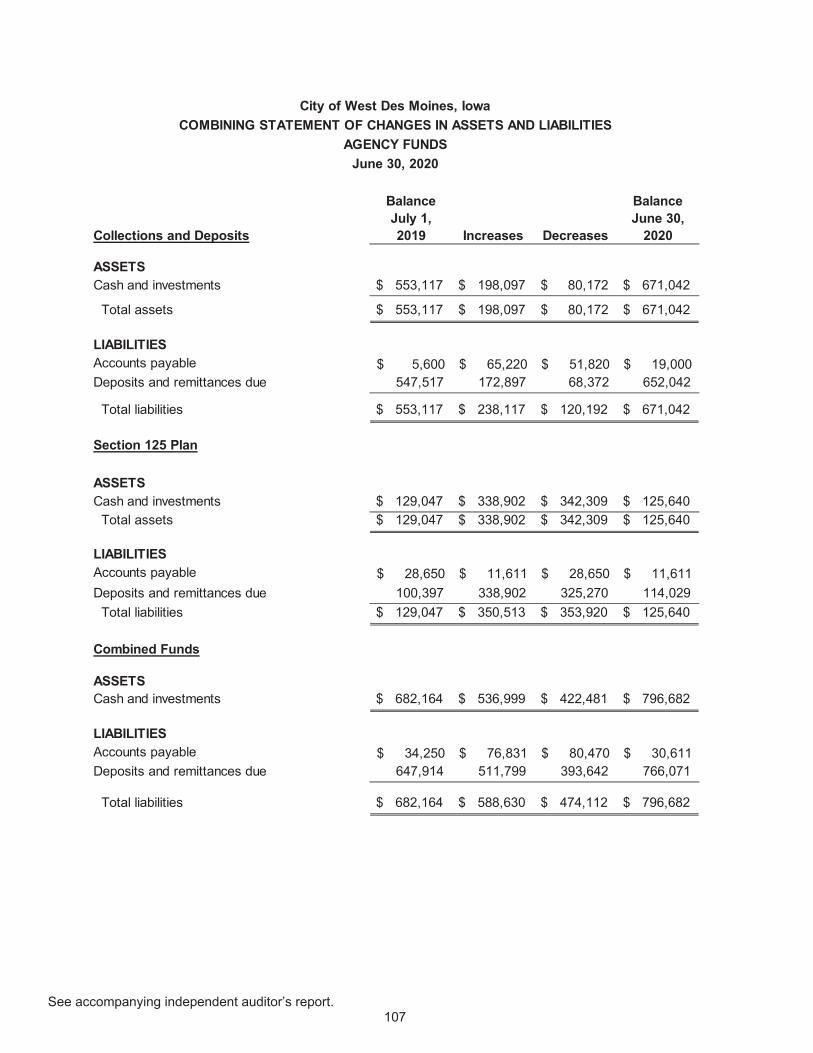
See accompanying independent auditor’s report. 107
Balance BalanceJuly 1, June 30,
Collections and Deposits 2019 Increases Decreases 2020
ASSETSCash and investments $ 553,117 $ 198,097 $ 80,172 $ 671,042
Total assets $ 553,117 $ 198,097 $ 80,172 $ 671,042
LIABILITIESAccounts payable 5,600$ 65,220$ 51,820$ 19,000$ Deposits and remittances due 547,517 172,897 68,372 652,042
Total liabilities $ 553,117 $ 238,117 $ 120,192 $ 671,042
Section 125 Plan
ASSETSCash and investments $ 129,047 $ 338,902 $ 342,309 $ 125,640 Total assets $ 129,047 $ 338,902 $ 342,309 $ 125,640
LIABILITIESAccounts payable 28,650$ 11,611$ 28,650$ 11,611$ Deposits and remittances due 100,397 338,902 325,270 114,029 Total liabilities $ 129,047 $ 350,513 $ 353,920 $ 125,640
Combined Funds
ASSETSCash and investments $ 682,164 $ 536,999 $ 422,481 $ 796,682
LIABILITIESAccounts payable 34,250$ 76,831$ 80,470$ 30,611$ Deposits and remittances due 647,914 511,799 393,642 766,071
Total liabilities $ 682,164 $ 588,630 $ 474,112 $ 796,682
City of West Des Moines, IowaCOMBINING STATEMENT OF CHANGES IN ASSETS AND LIABILITIES
June 30, 2020AGENCY FUNDS

108
This page is intentionally blank.