Embed Size (px)
DESCRIPTION
Cracking the Coding Interview, 5th Edition
Citation preview
Outline
• What?
• Why?
• Who?
• How?
Outline
• What?
• Why?
• Who?
• How?
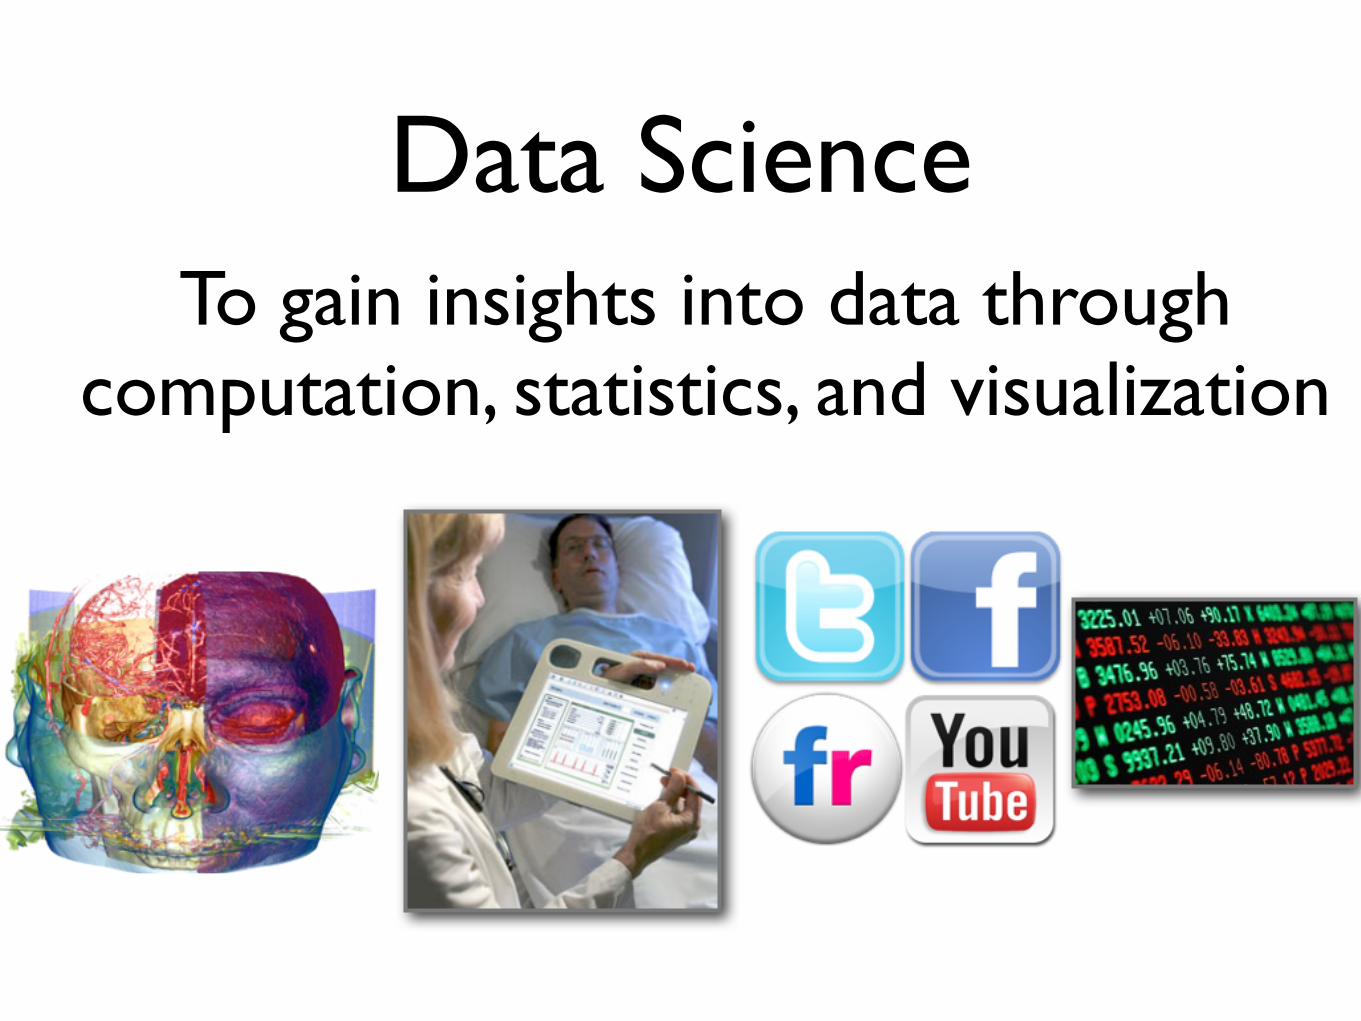
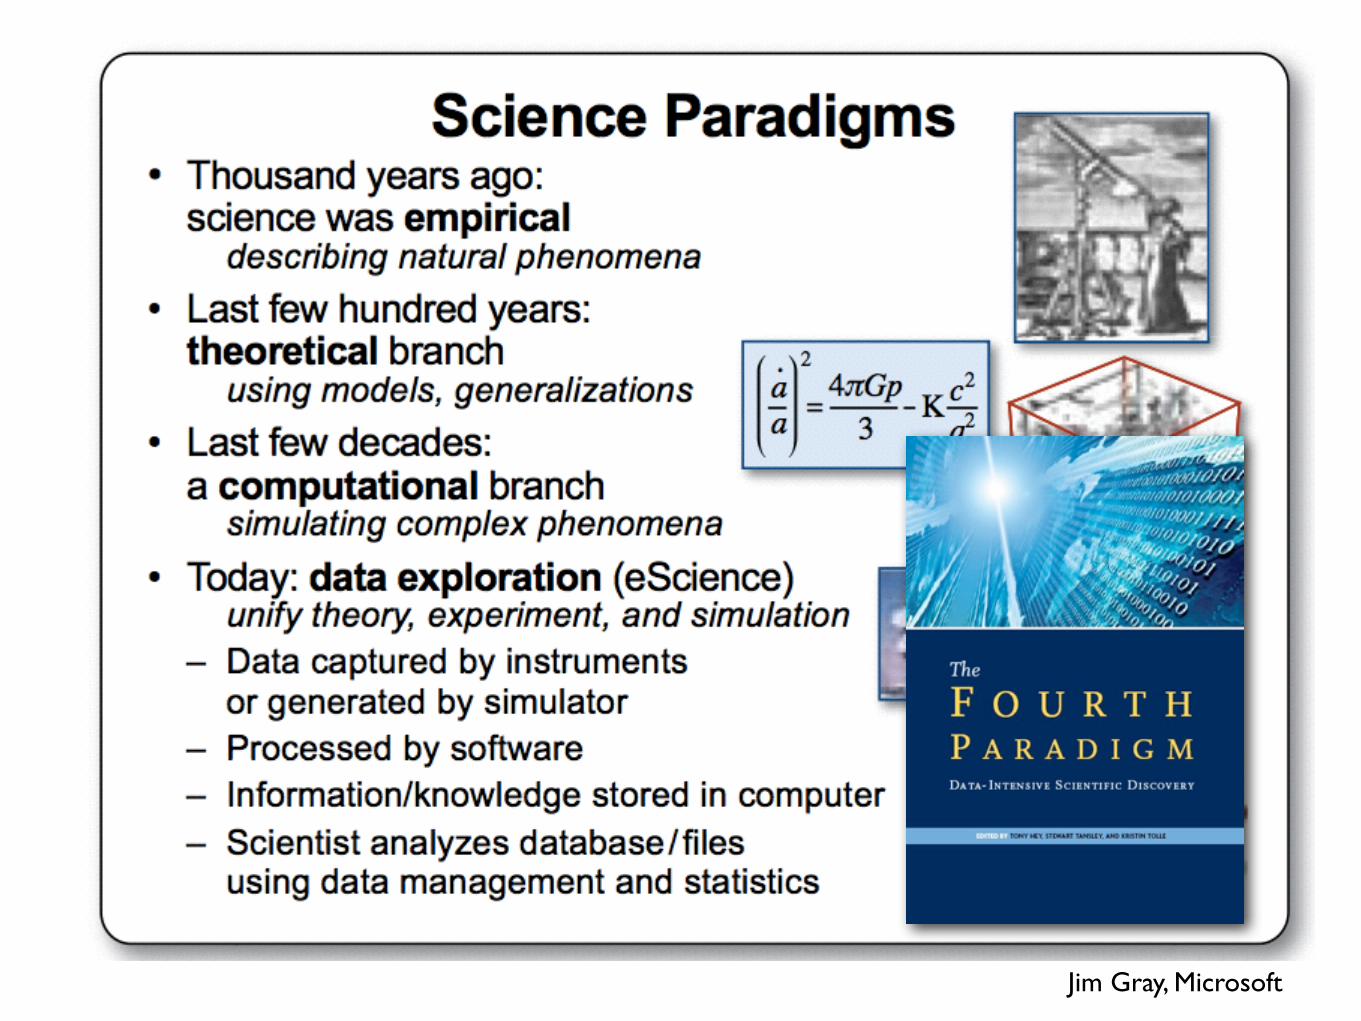
Data ScienceTo gain insights into data through
computation, statistics, and visualization
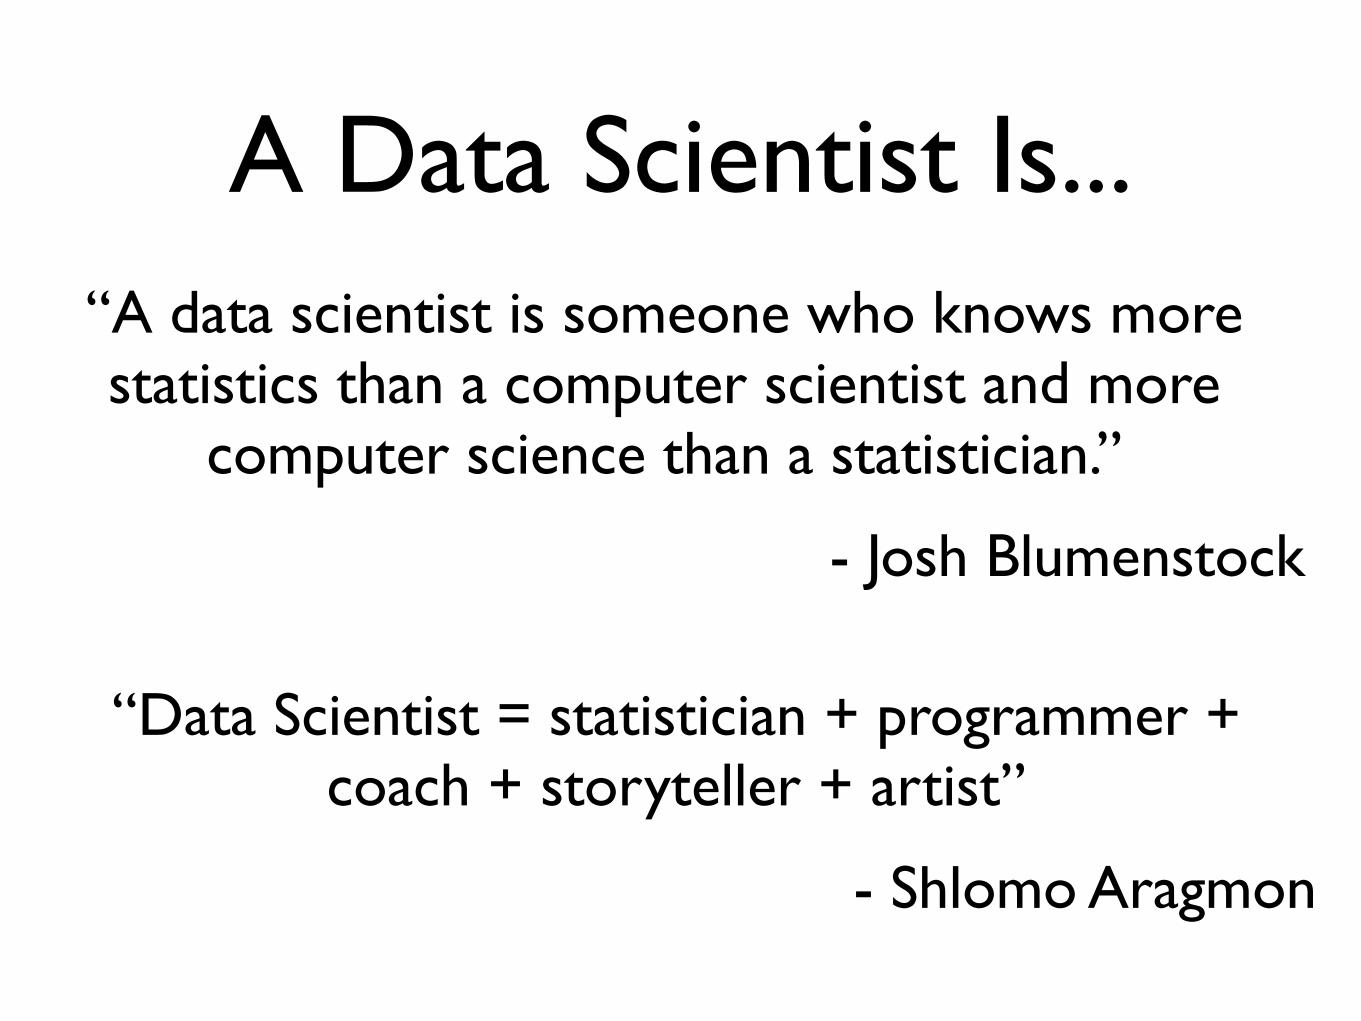
A Data Scientist Is...“A data scientist is someone who knows more statistics than a computer scientist and more
computer science than a statistician.”
- Josh Blumenstock
“Data Scientist = statistician + programmer + coach + storyteller + artist”
- Shlomo Aragmon
Nate Silver
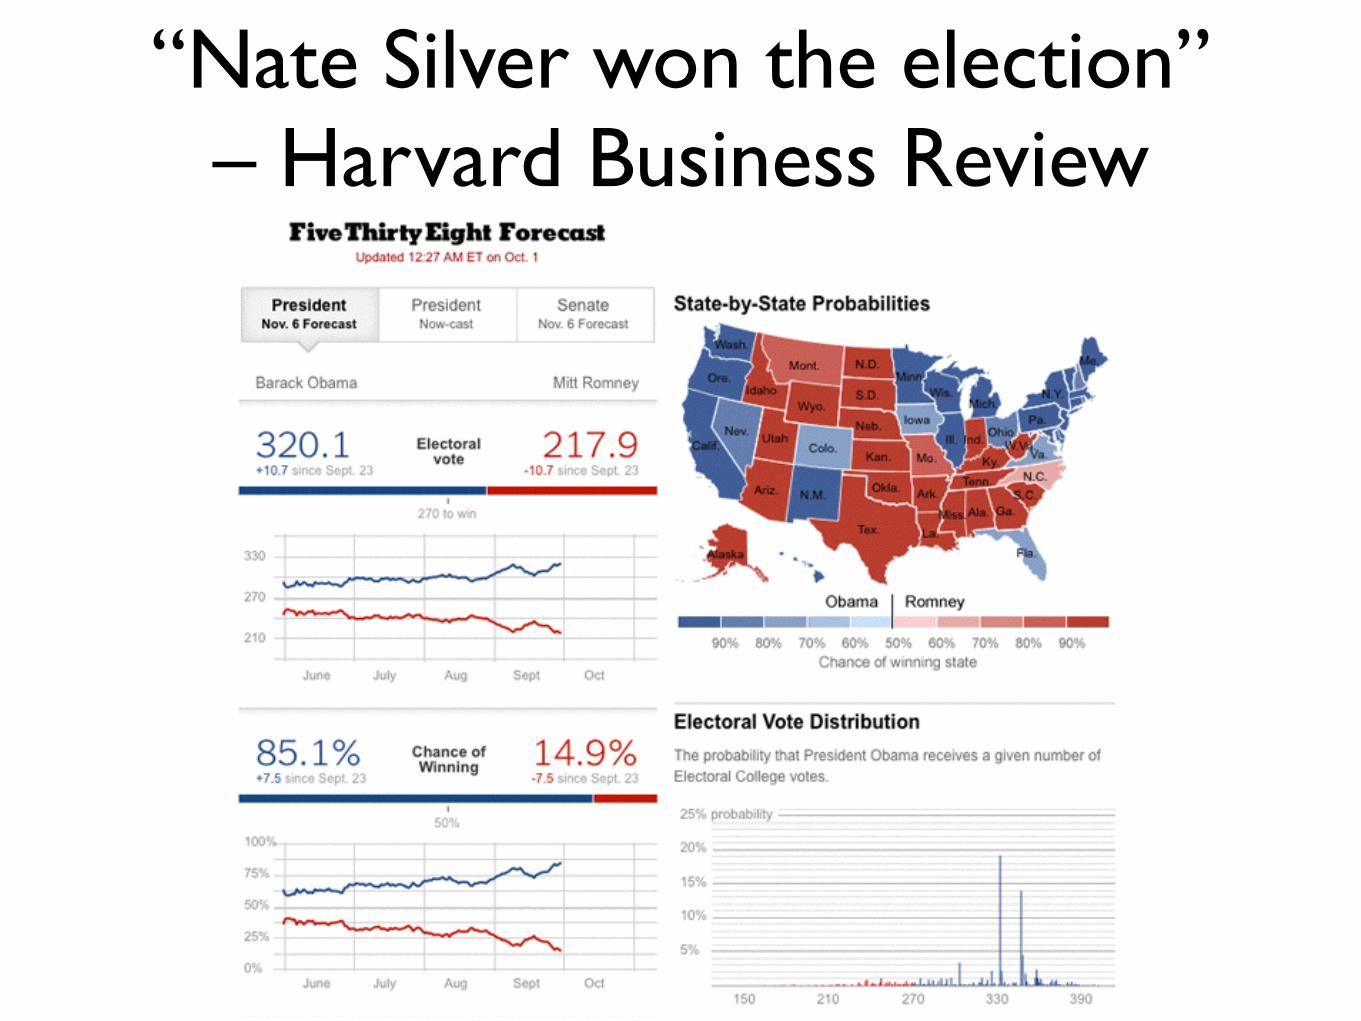
“Nate Silver won the election” – Harvard Business Review
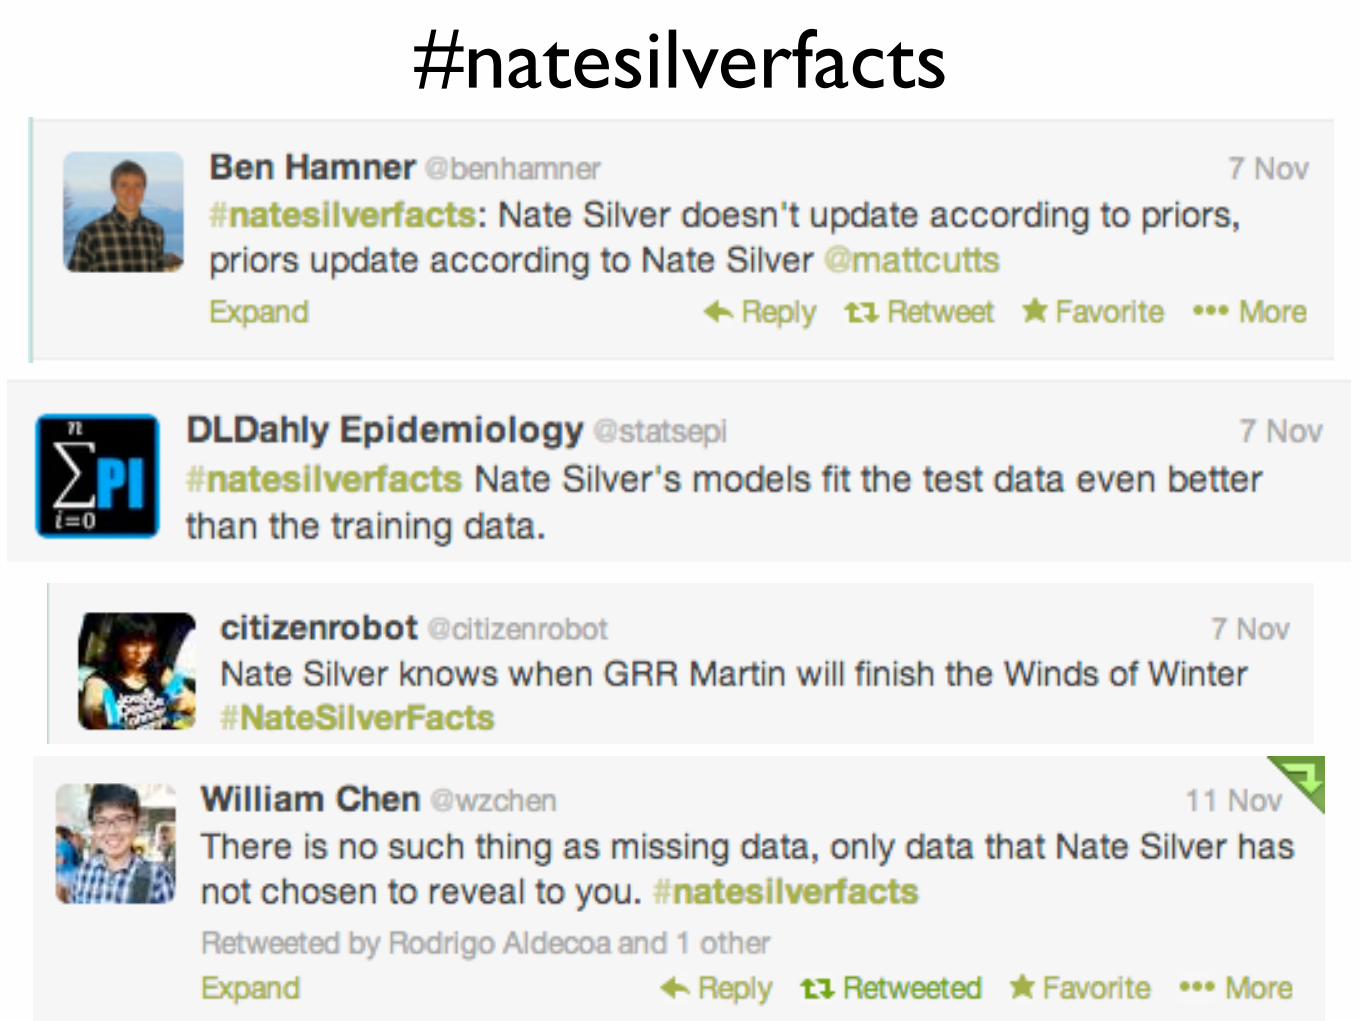
#natesilverfacts
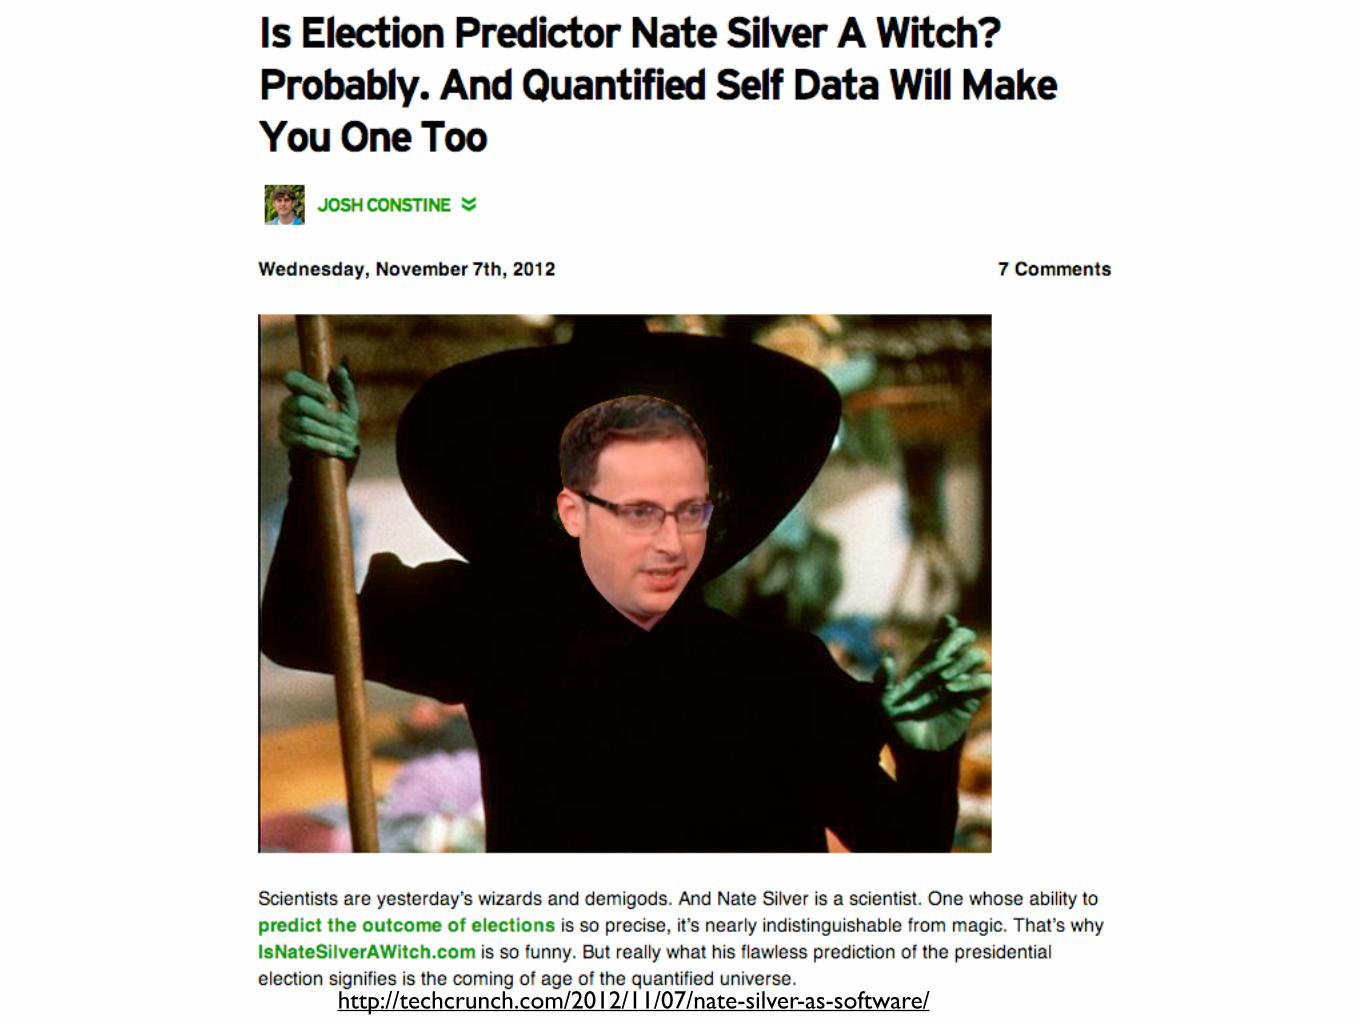
http://techcrunch.com/2012/11/07/nate-silver-as-software/

Nate Silver on Pundits
http://www.thedailyshow.com/watch/wed-october-17-2012/nate-silver
Stewart: “Do you foresee a coin getting its own show?
The coin toss show?”
Silver: “Pundits are no better than a coin toss.”
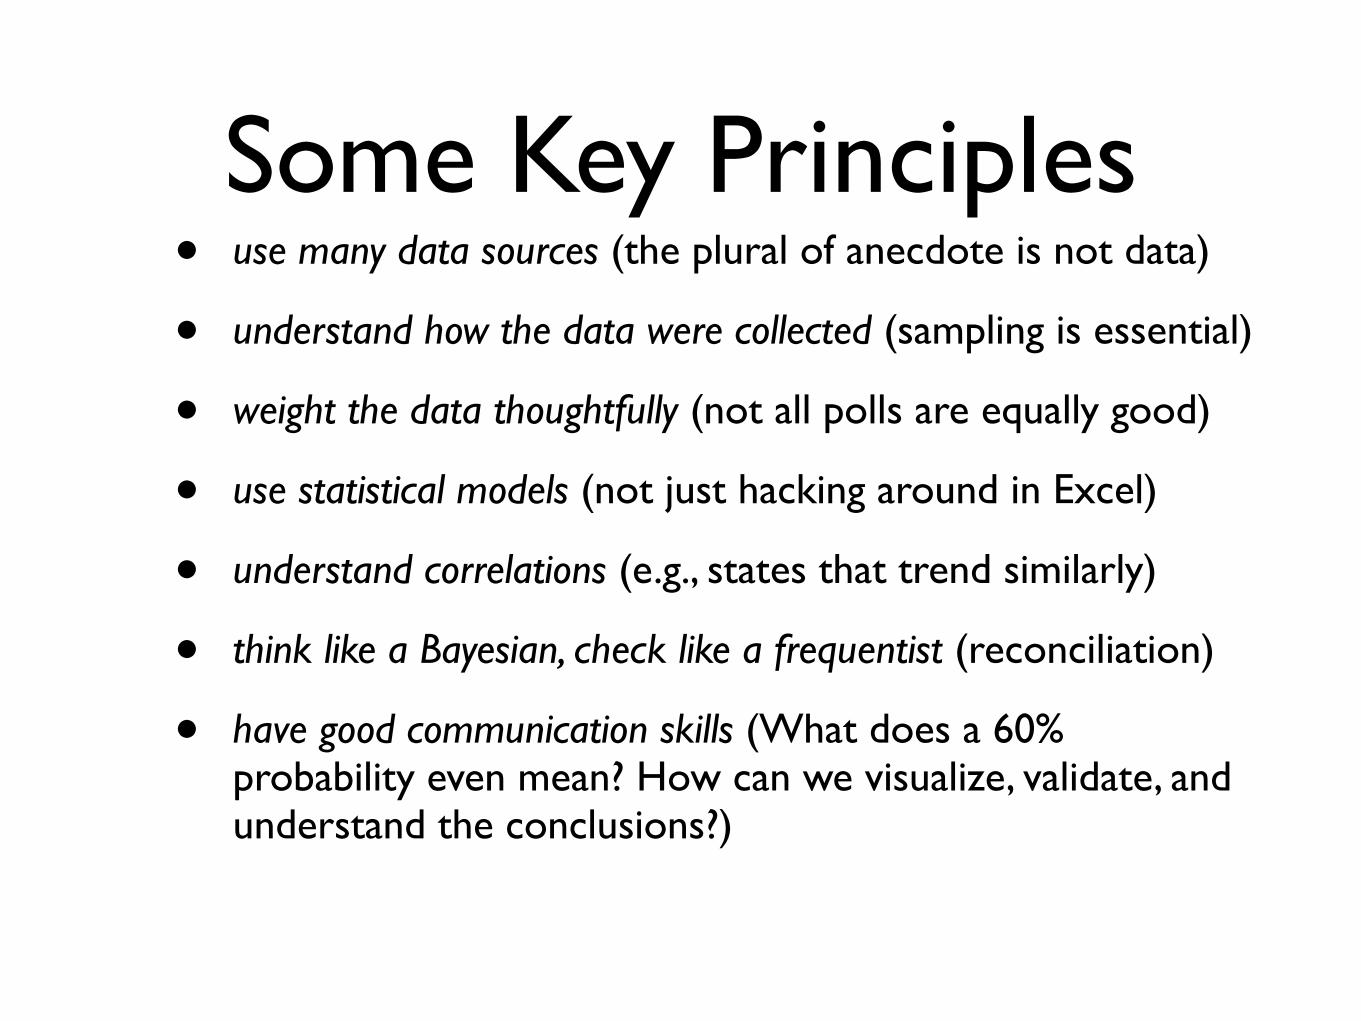
Some Key Principles• use many data sources (the plural of anecdote is not data)
• understand how the data were collected (sampling is essential)
• weight the data thoughtfully (not all polls are equally good)
• use statistical models (not just hacking around in Excel)
• understand correlations (e.g., states that trend similarly)
• think like a Bayesian, check like a frequentist (reconciliation)
• have good communication skills (What does a 60% probability even mean? How can we visualize, validate, and understand the conclusions?)
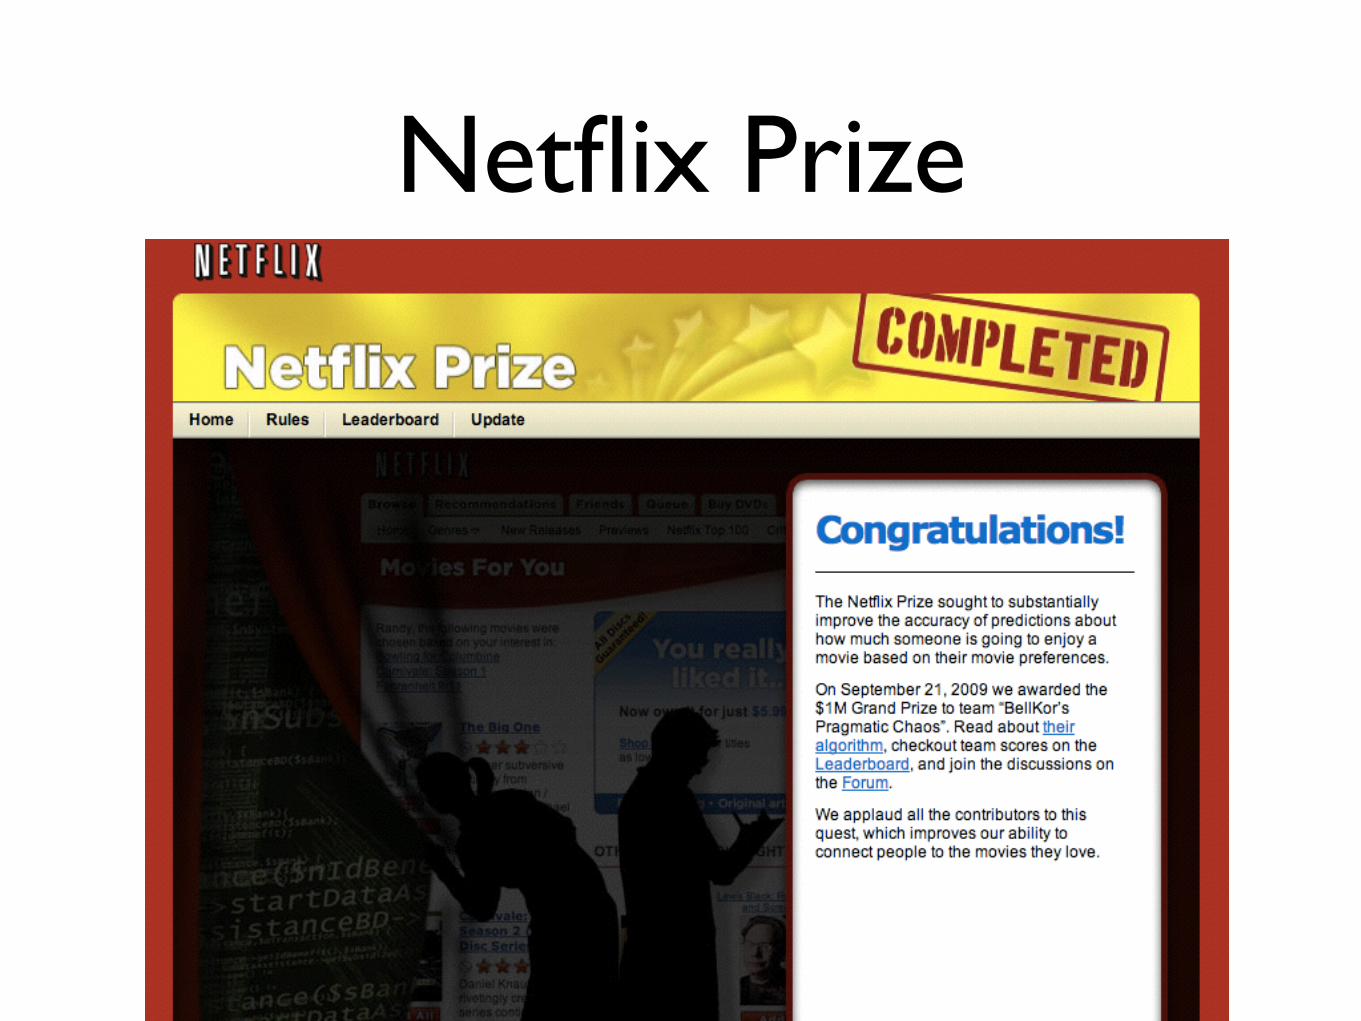
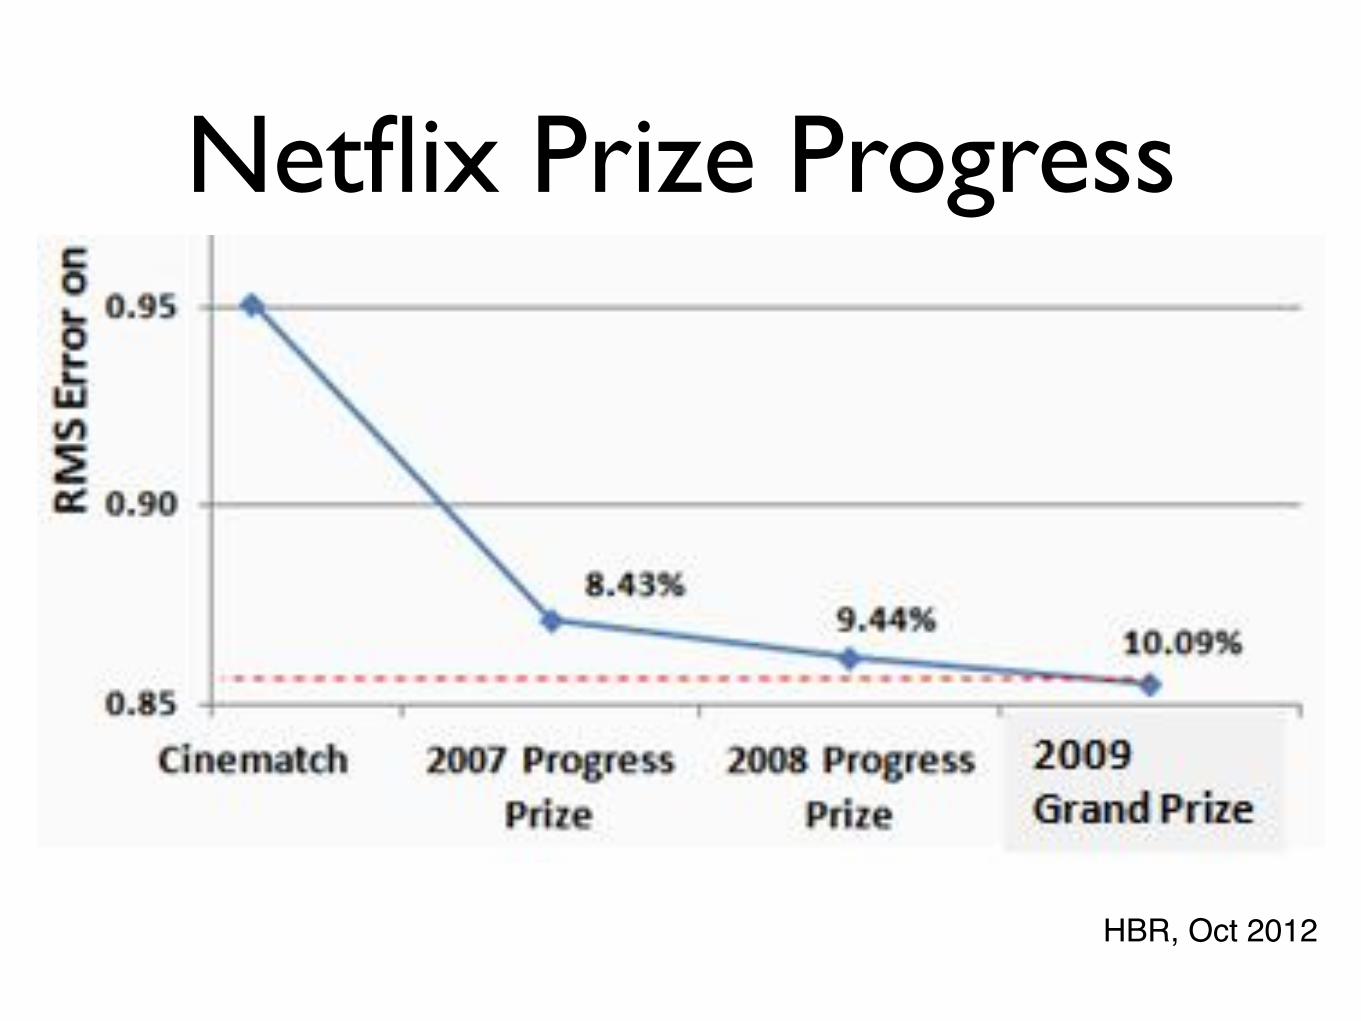
Netflix Prize
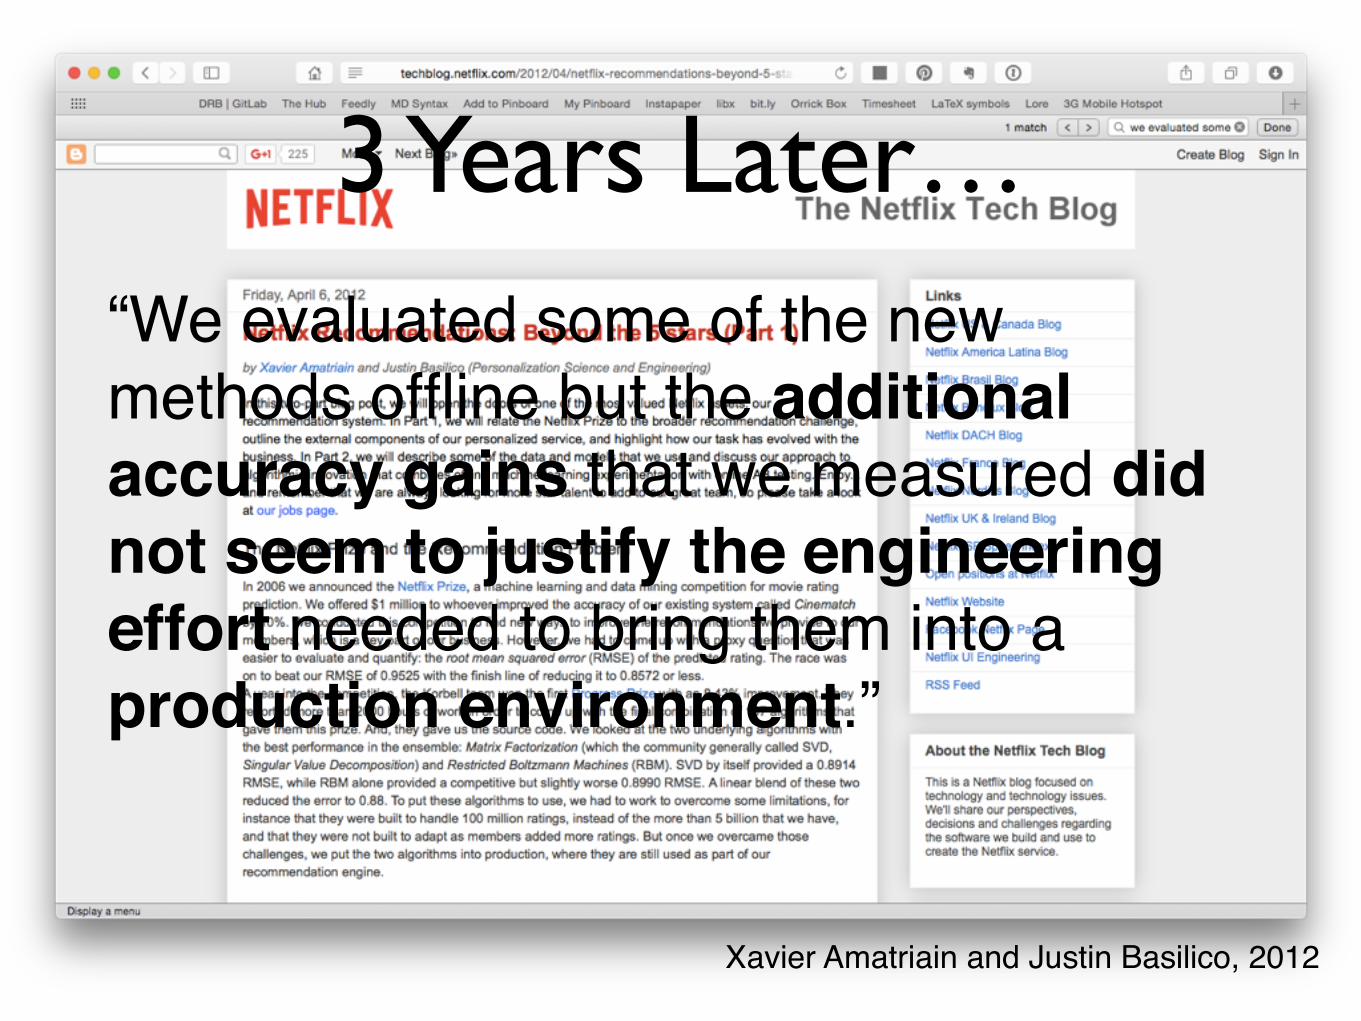
3 Years Later…“We evaluated some of the new methods offline but the additional accuracy gains that we measured did not seem to justify the engineering effort needed to bring them into a production environment.”
Xavier Amatriain and Justin Basilico, 2012
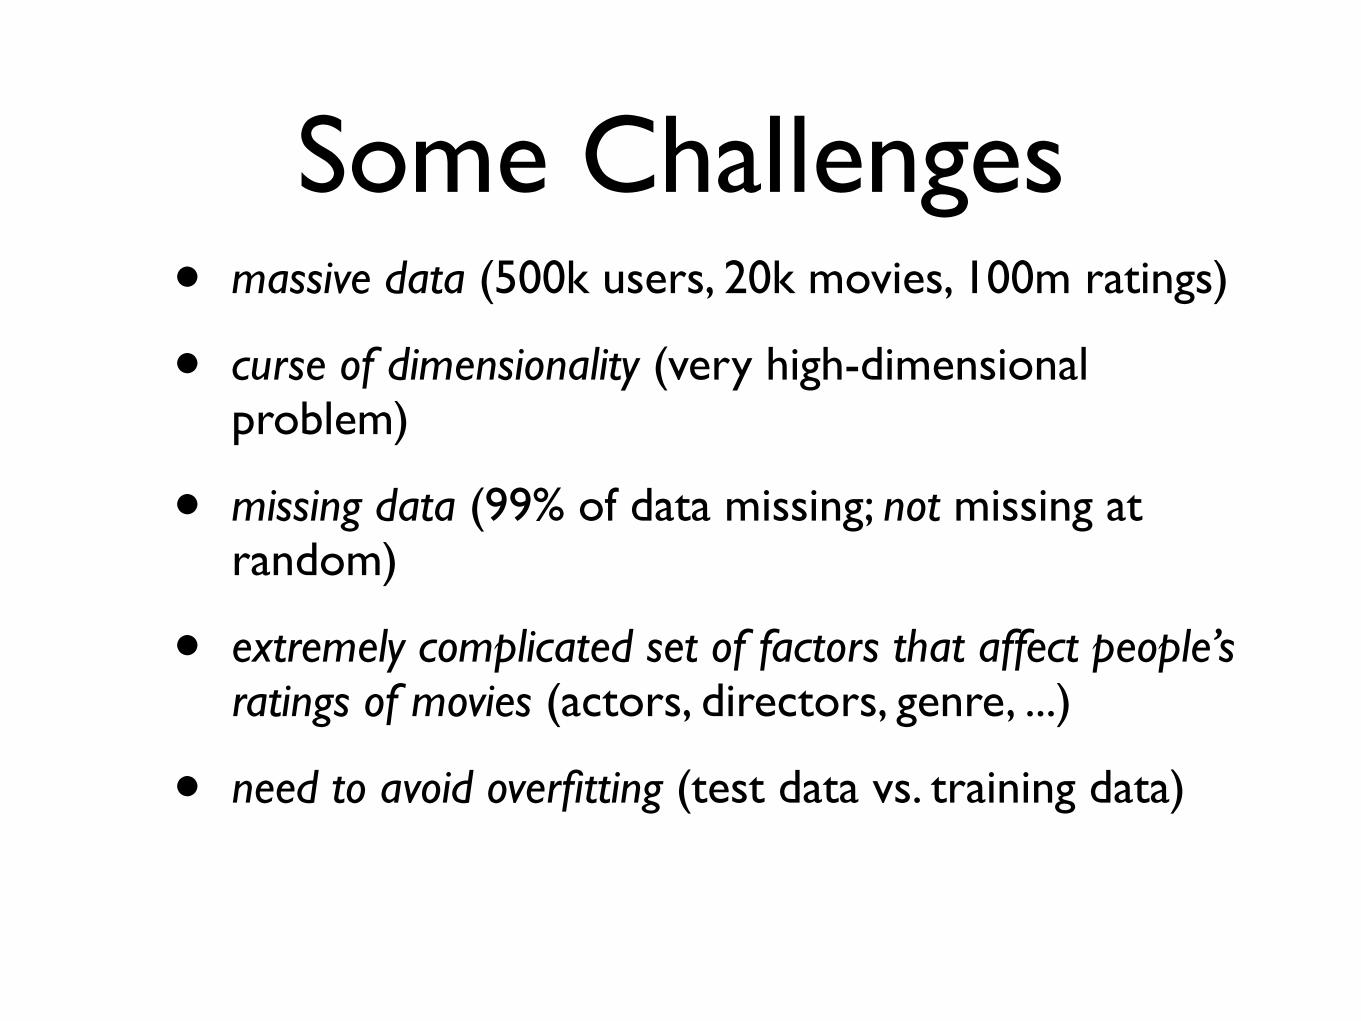
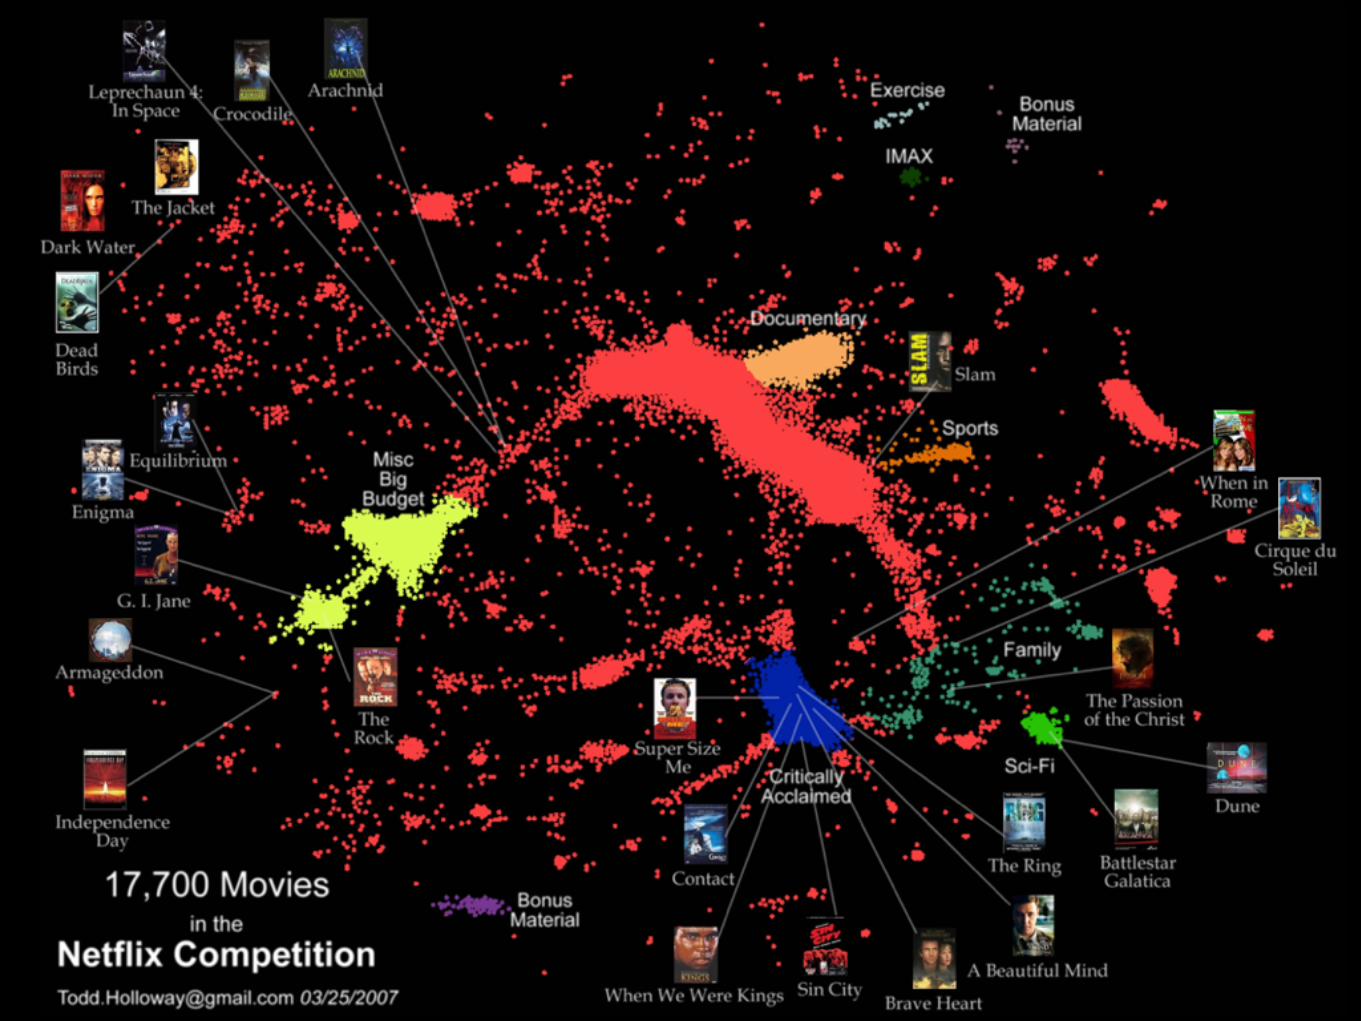
Some Challenges• massive data (500k users, 20k movies, 100m ratings)
• curse of dimensionality (very high-dimensional problem)
• missing data (99% of data missing; not missing at random)
• extremely complicated set of factors that affect people’s ratings of movies (actors, directors, genre, ...)
• need to avoid overfitting (test data vs. training data)
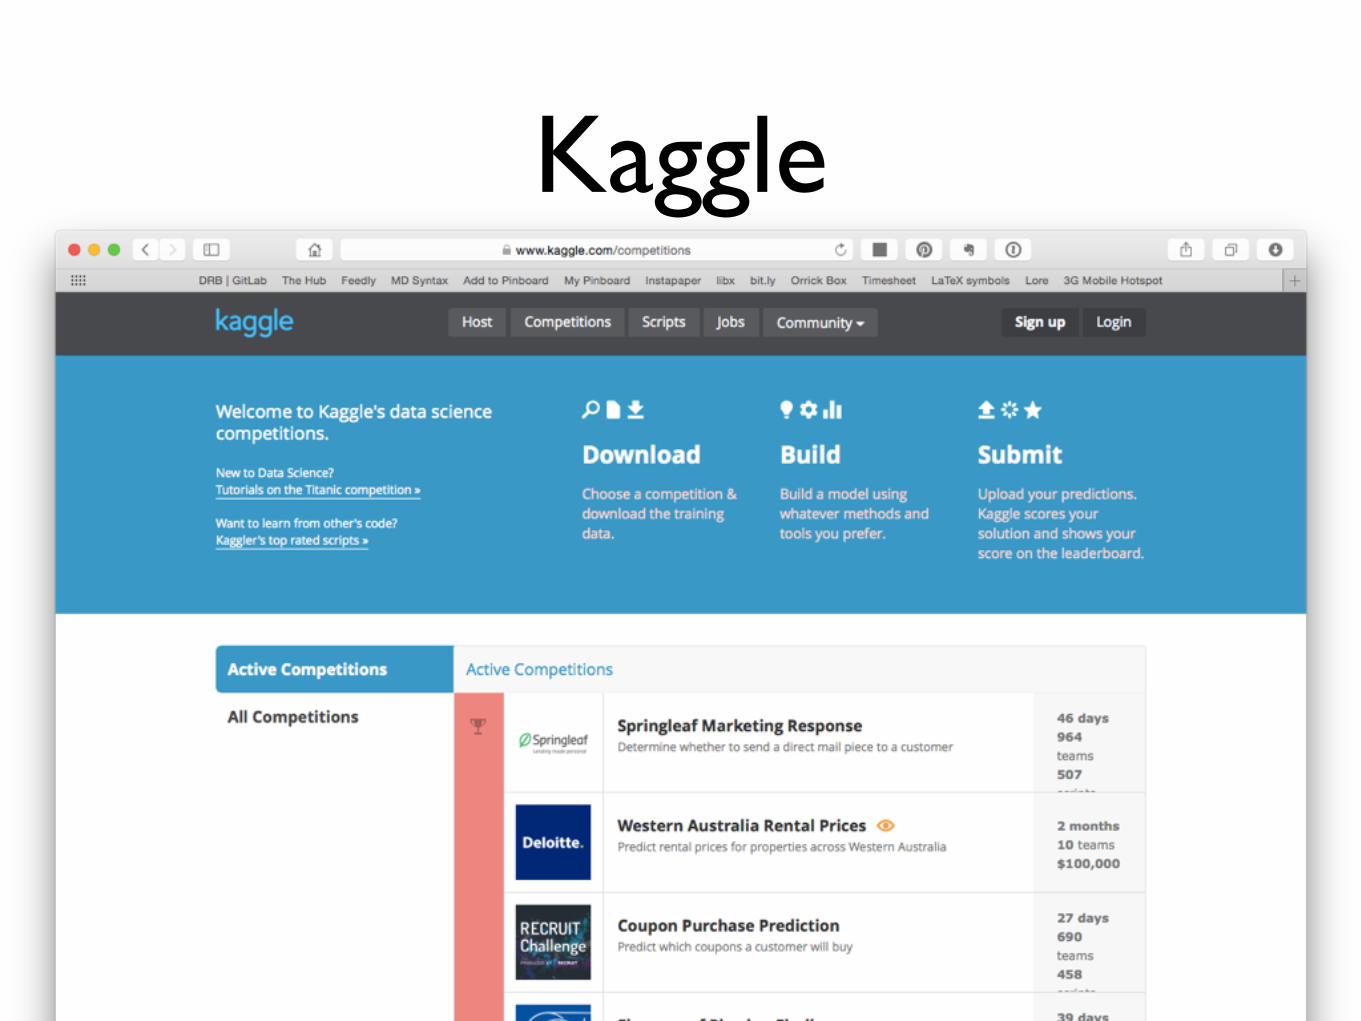
Kaggle
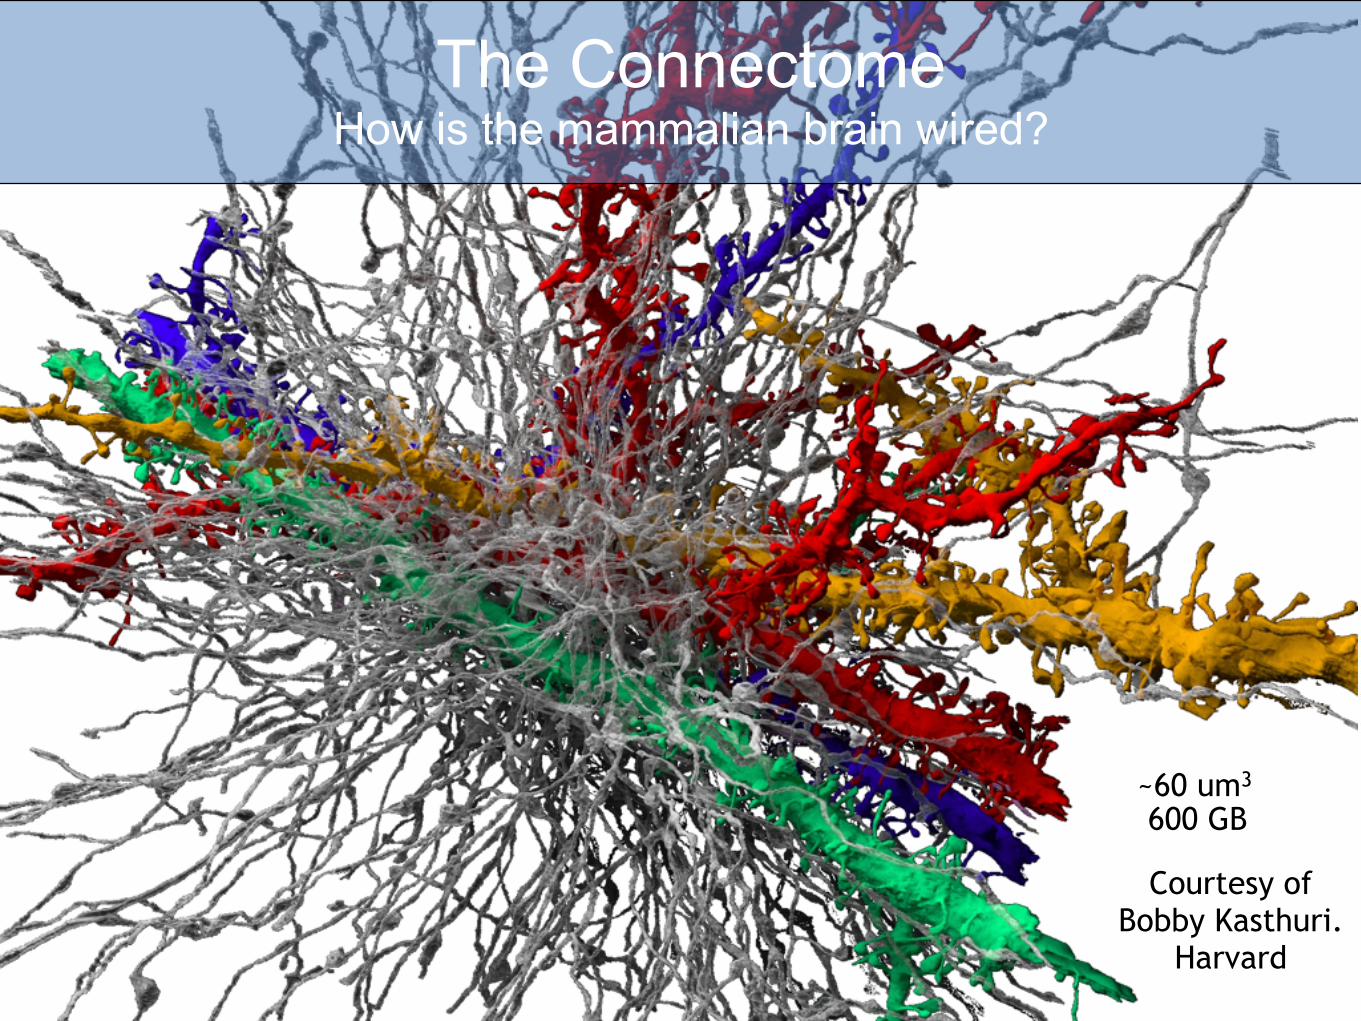
Courtesy of Bobby Kasthuri.
Harvard
~60 um3
600 GB
The Connectome How is the mammalian brain wired?
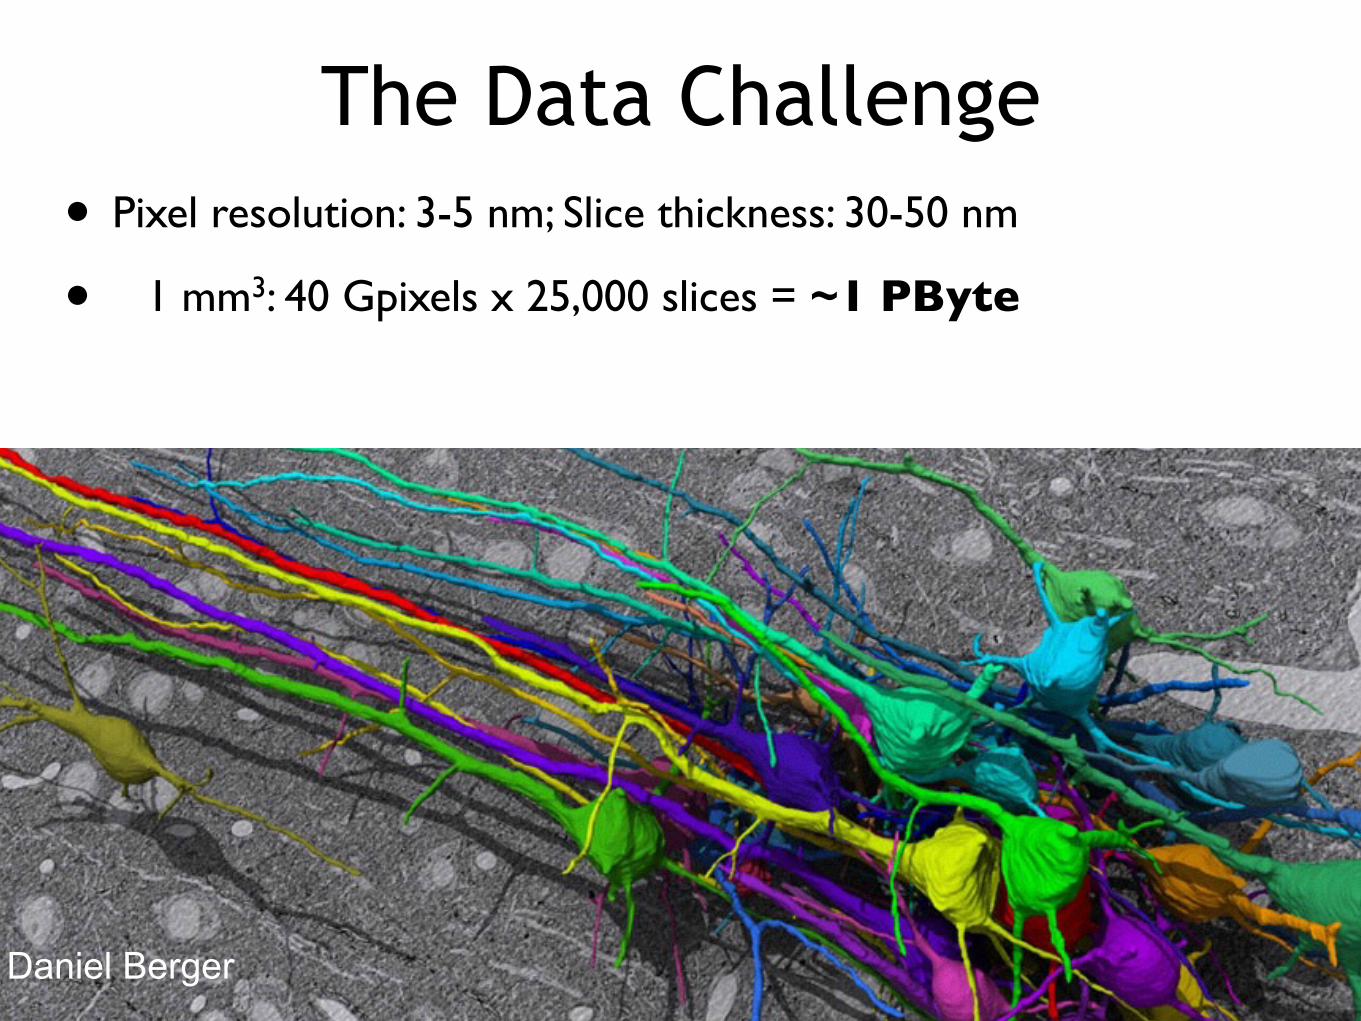
The Data Challenge• Pixel resolution: 3-5 nm; Slice thickness: 30-50 nm
• 1 mm3: 40 Gpixels x 25,000 slices = ~1 PByte
Daniel Berger
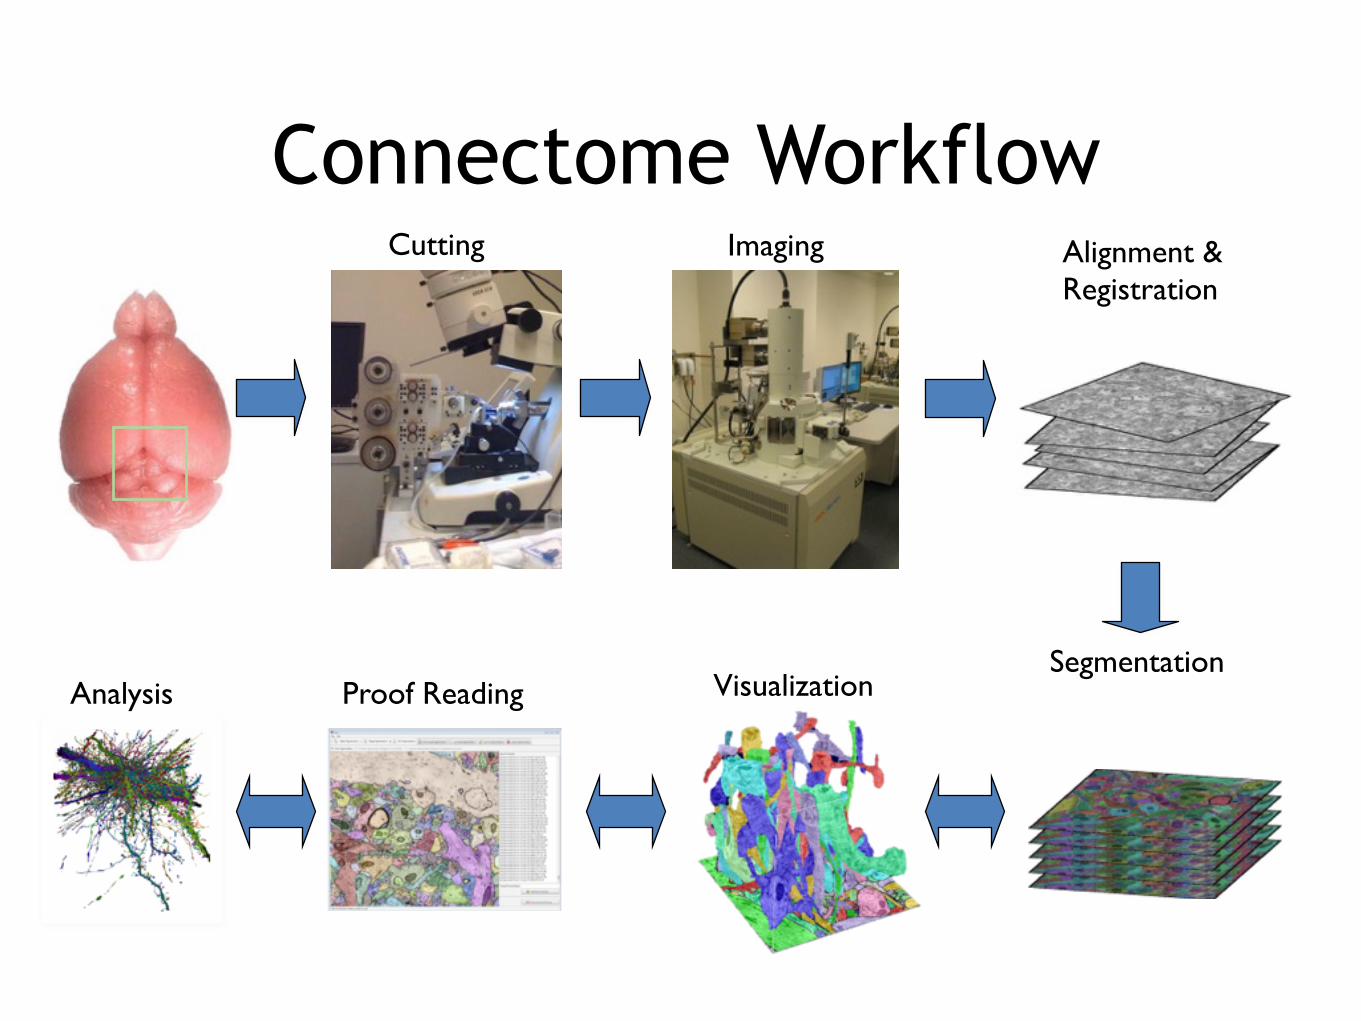
Connectome WorkflowCutting Imaging
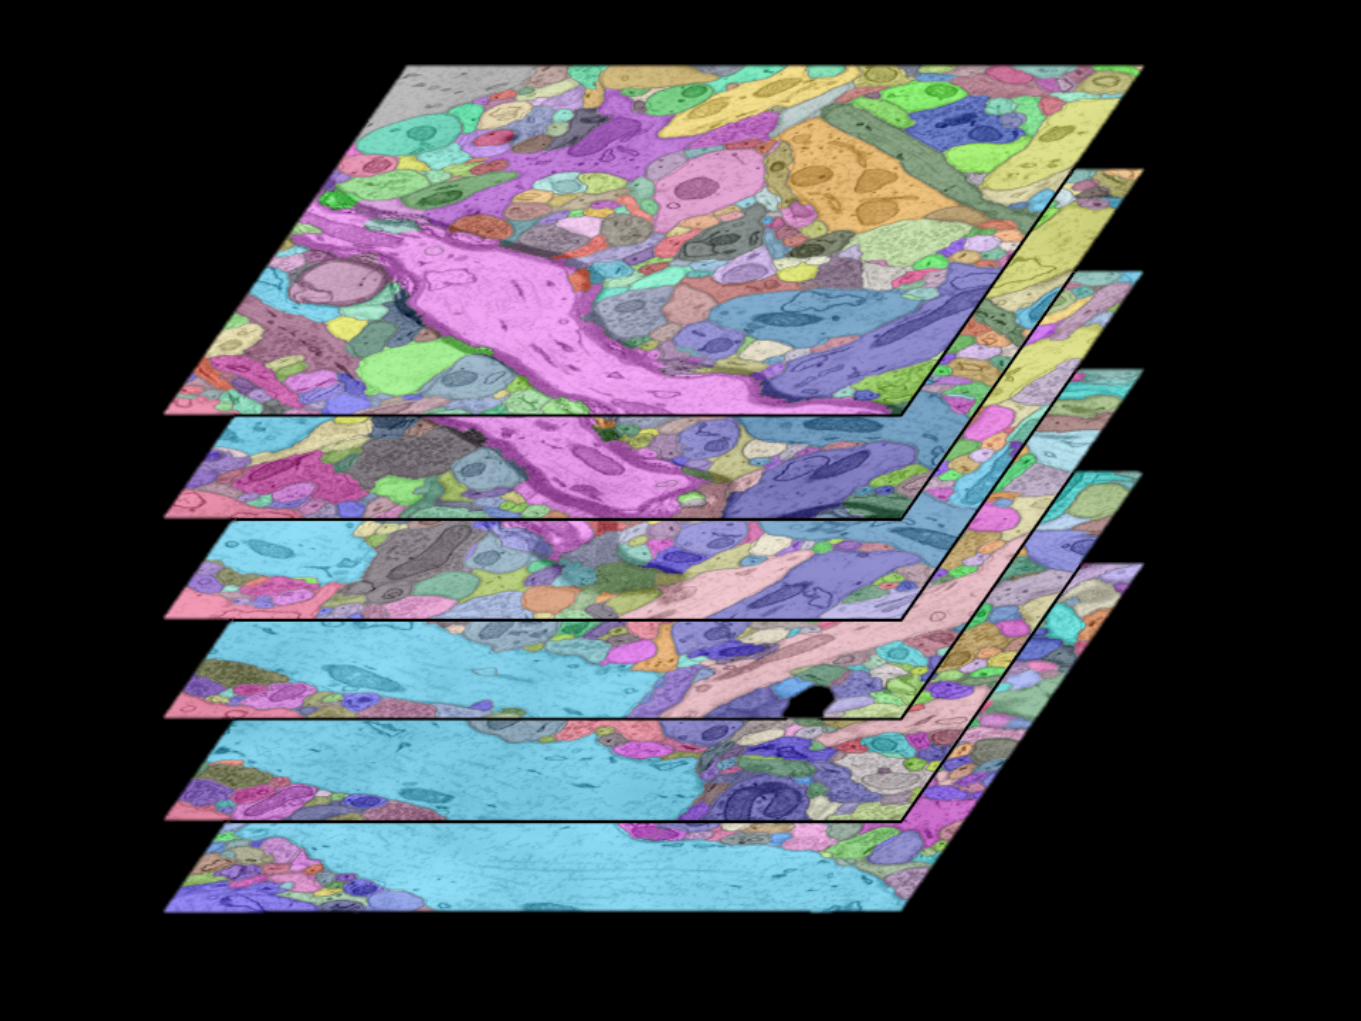
Segmentation
Alignment &Registration
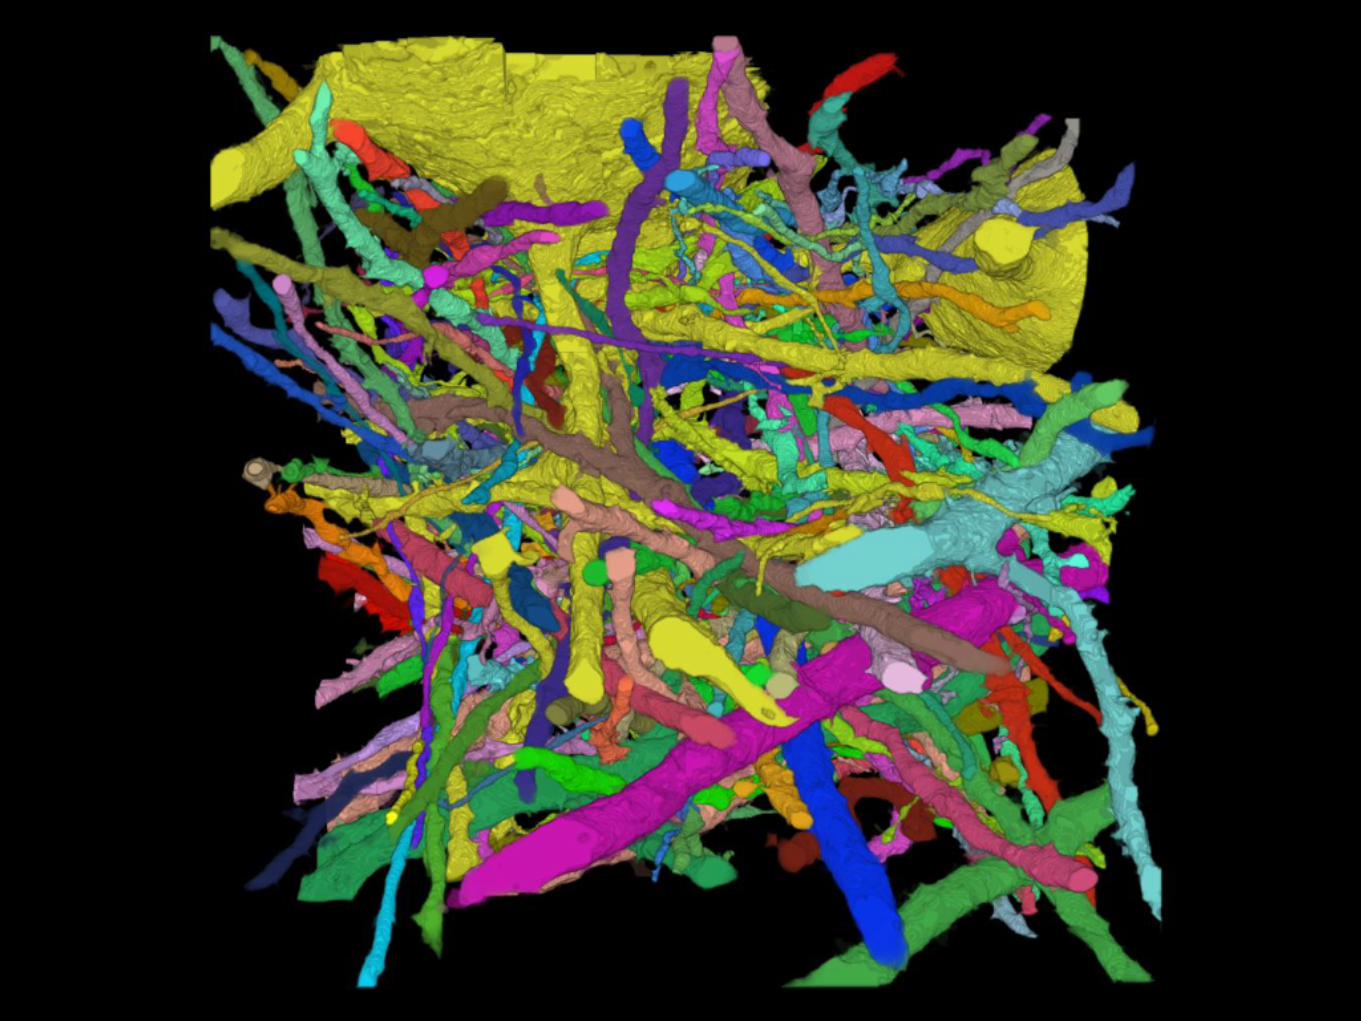
Analysis Proof Reading Visualization

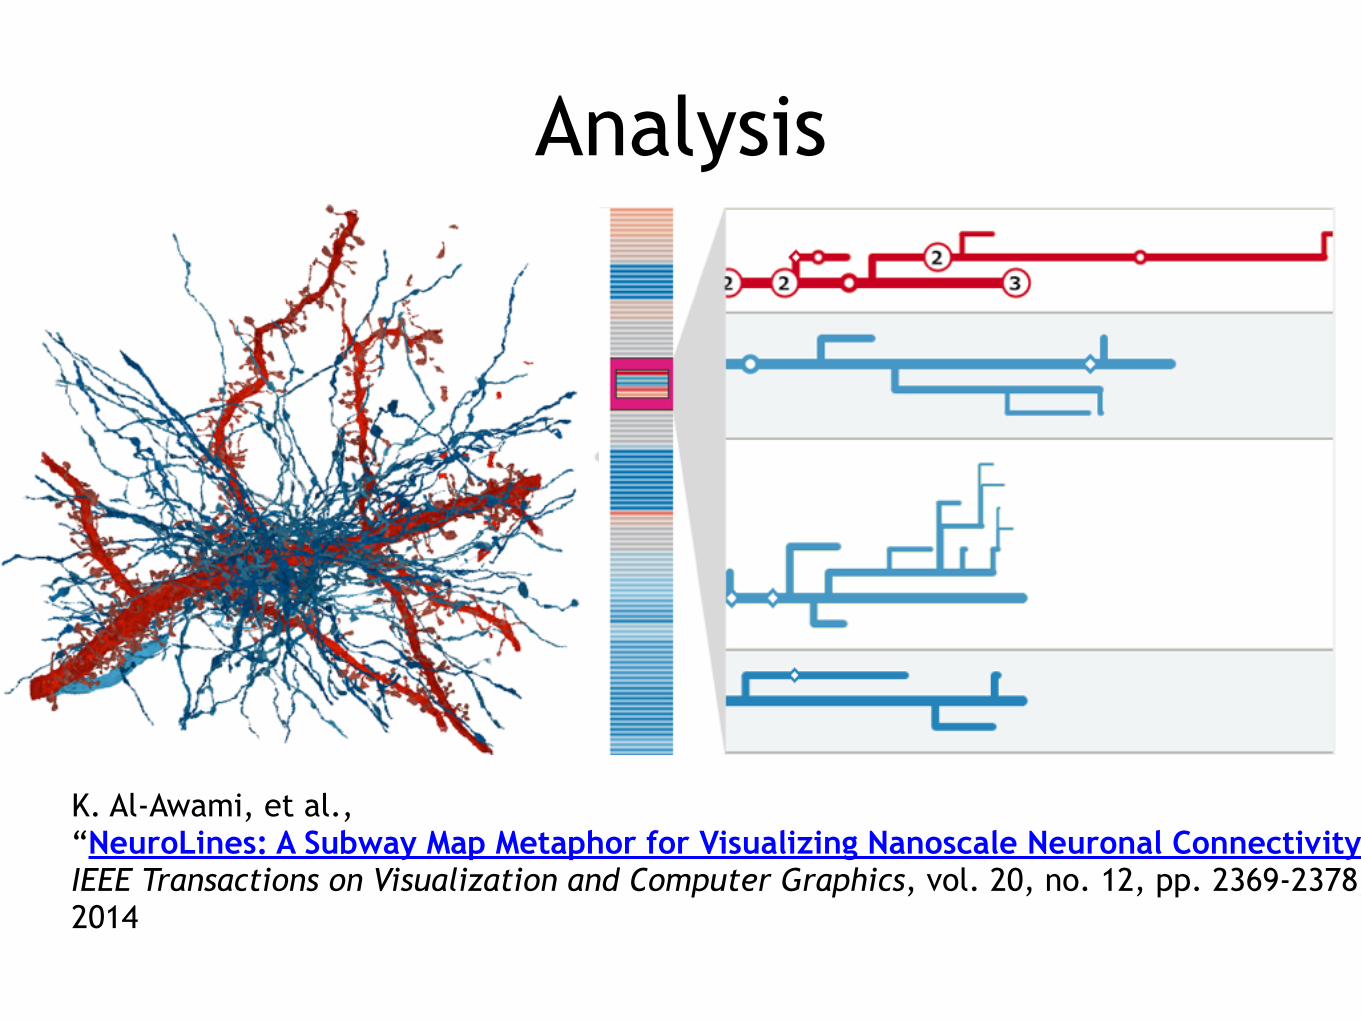
Analysis
K. Al-Awami, et al., “NeuroLines: A Subway Map Metaphor for Visualizing Nanoscale Neuronal Connectivity,” IEEE Transactions on Visualization and Computer Graphics, vol. 20, no. 12, pp. 2369-2378, 2014
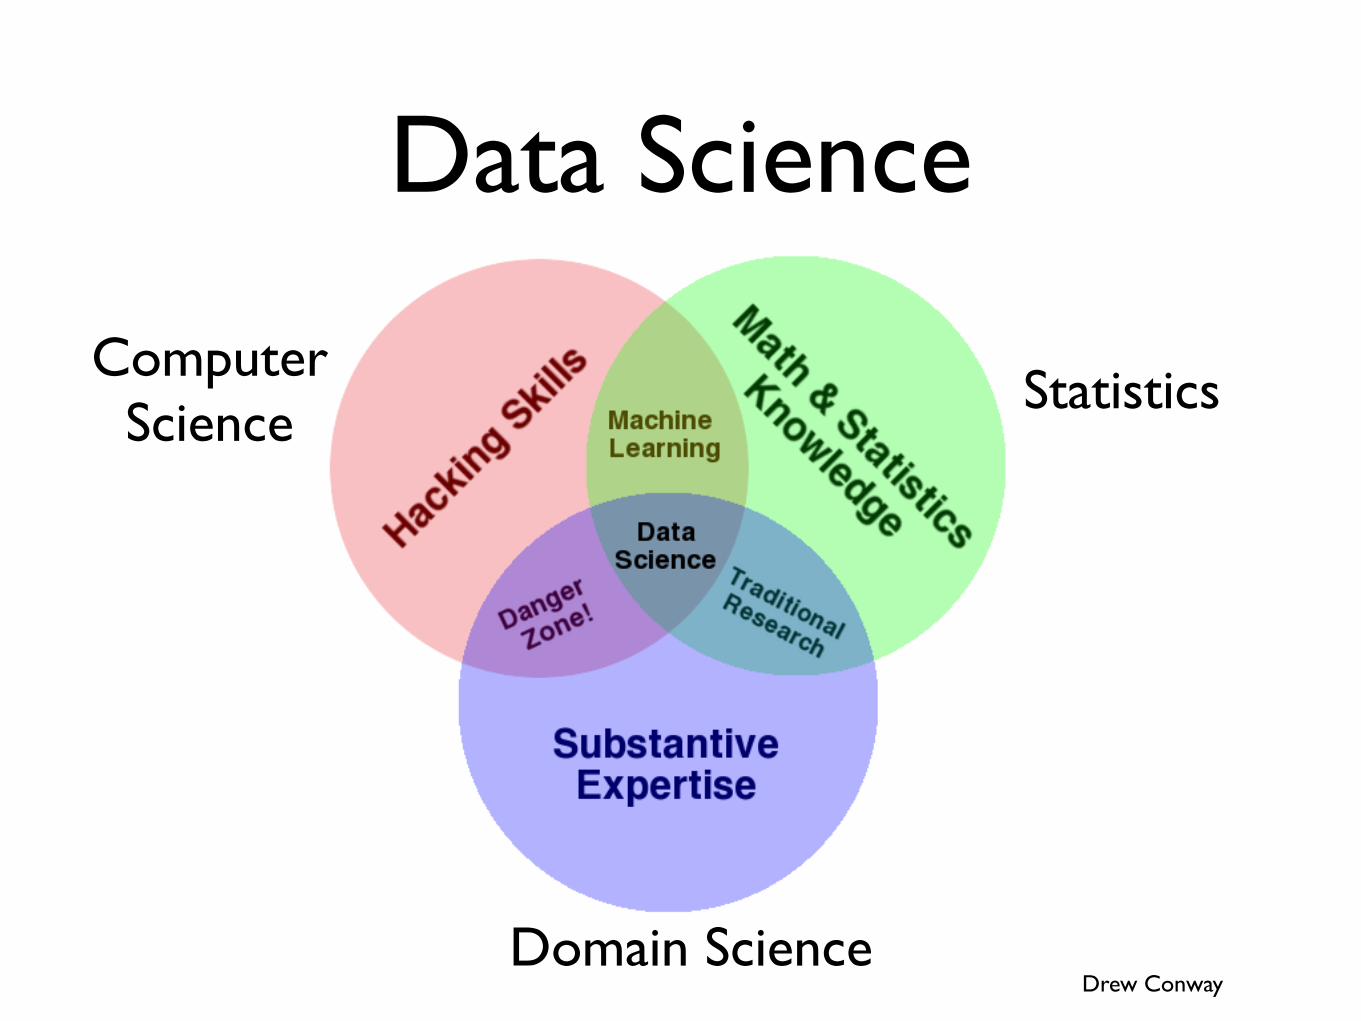
Data Science
Drew Conway
StatisticsComputer
Science
Domain Science
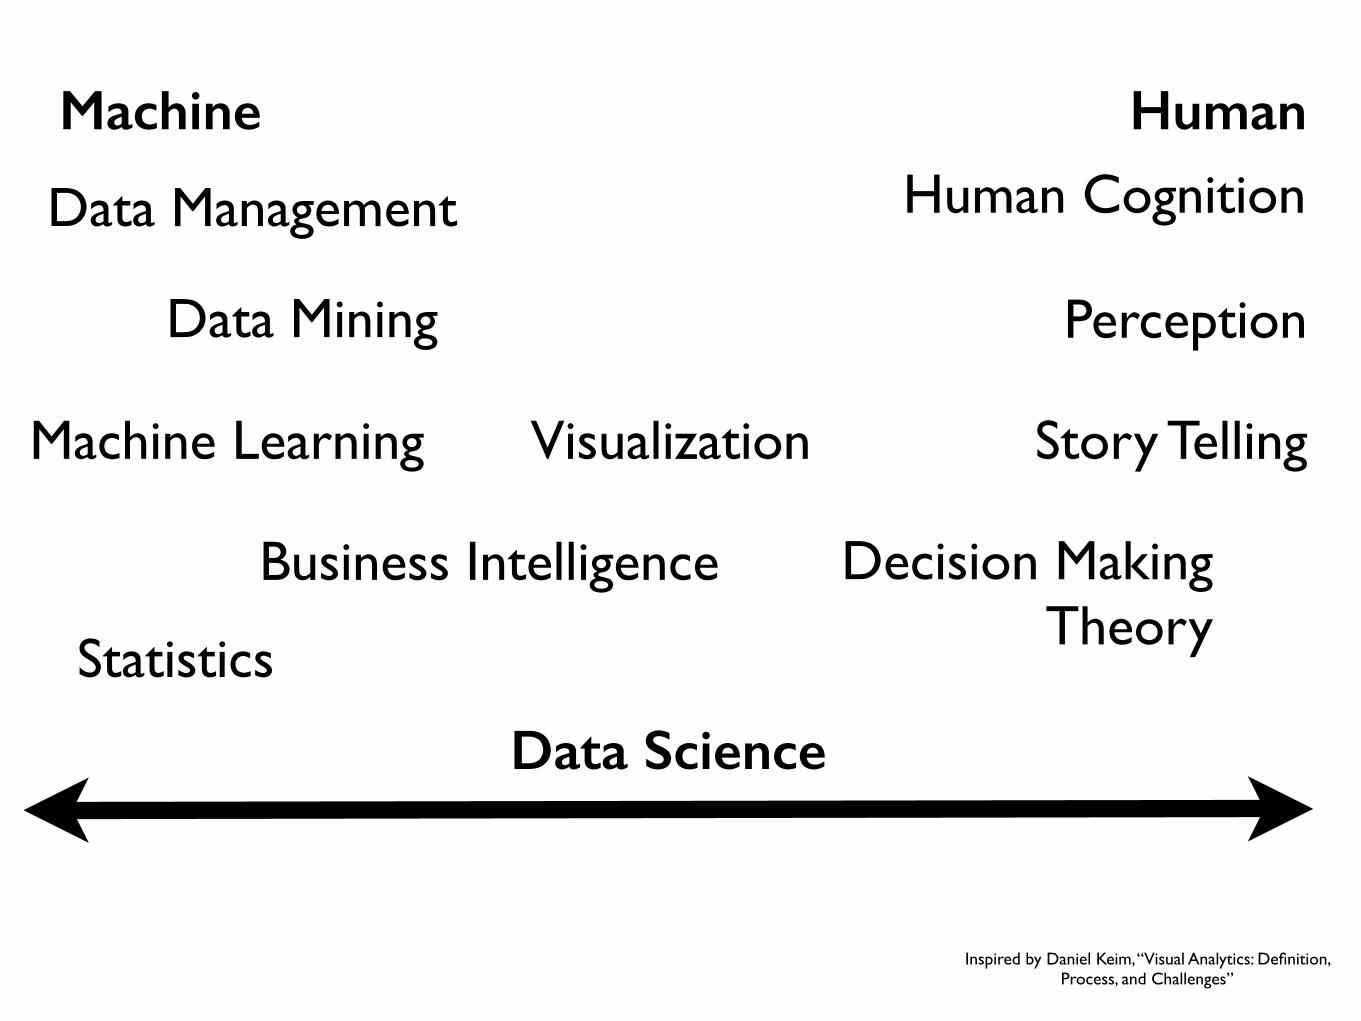
Machine Human
Machine Learning
Data Management
Data Mining
Visualization
Human Cognition
Decision MakingTheory
Perception
Business Intelligence
Data Science
Story Telling
Inspired by Daniel Keim, “Visual Analytics: Definition, Process, and Challenges”
Statistics
Outline
• What?
• Why?
• Who?
• How?
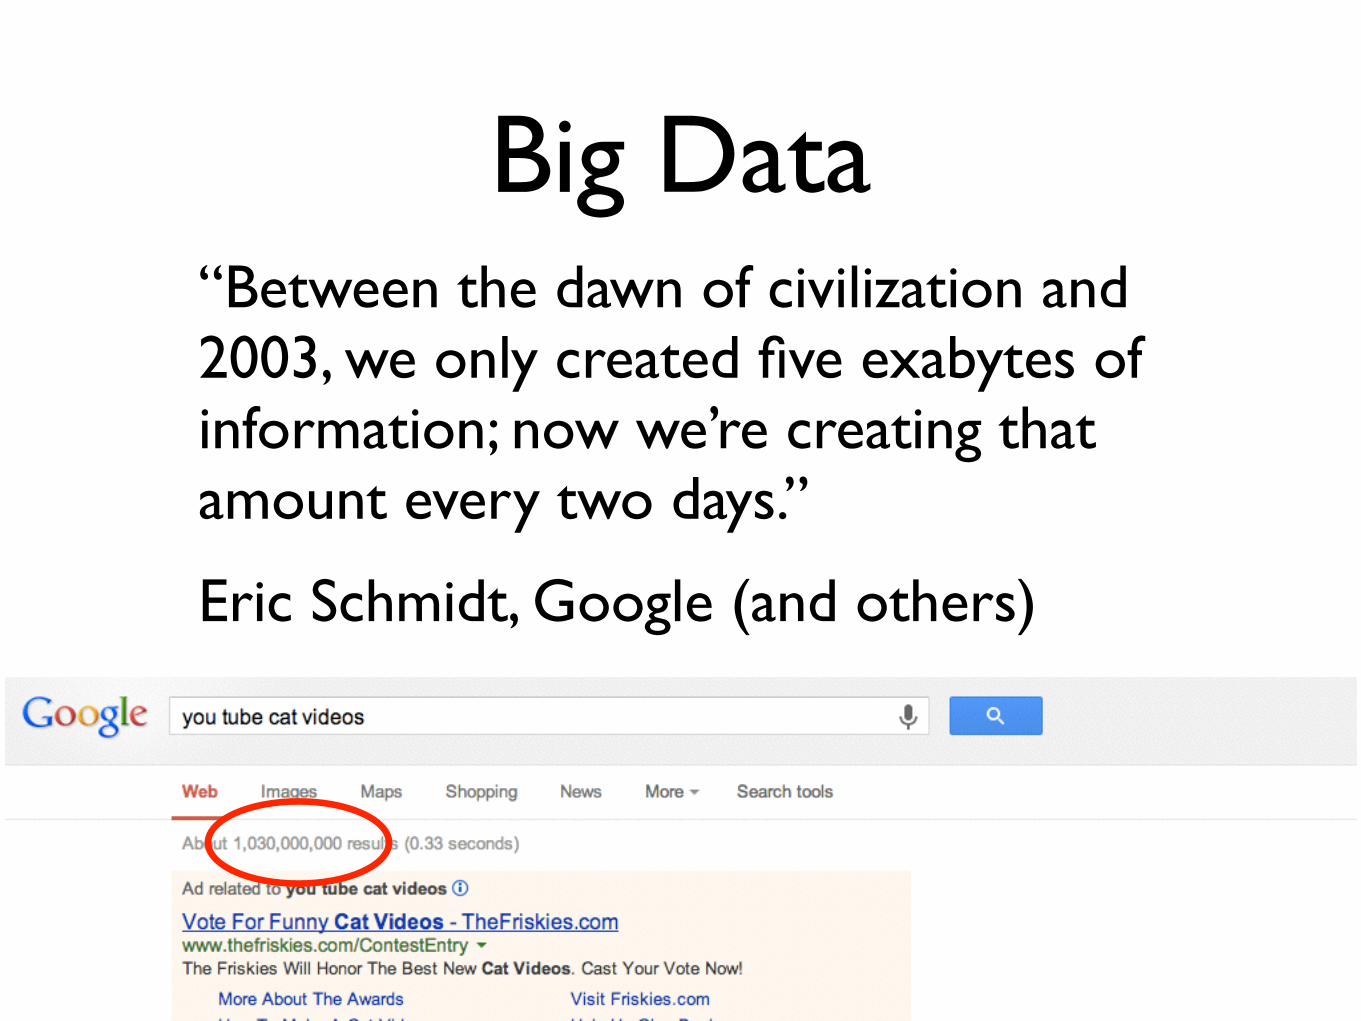
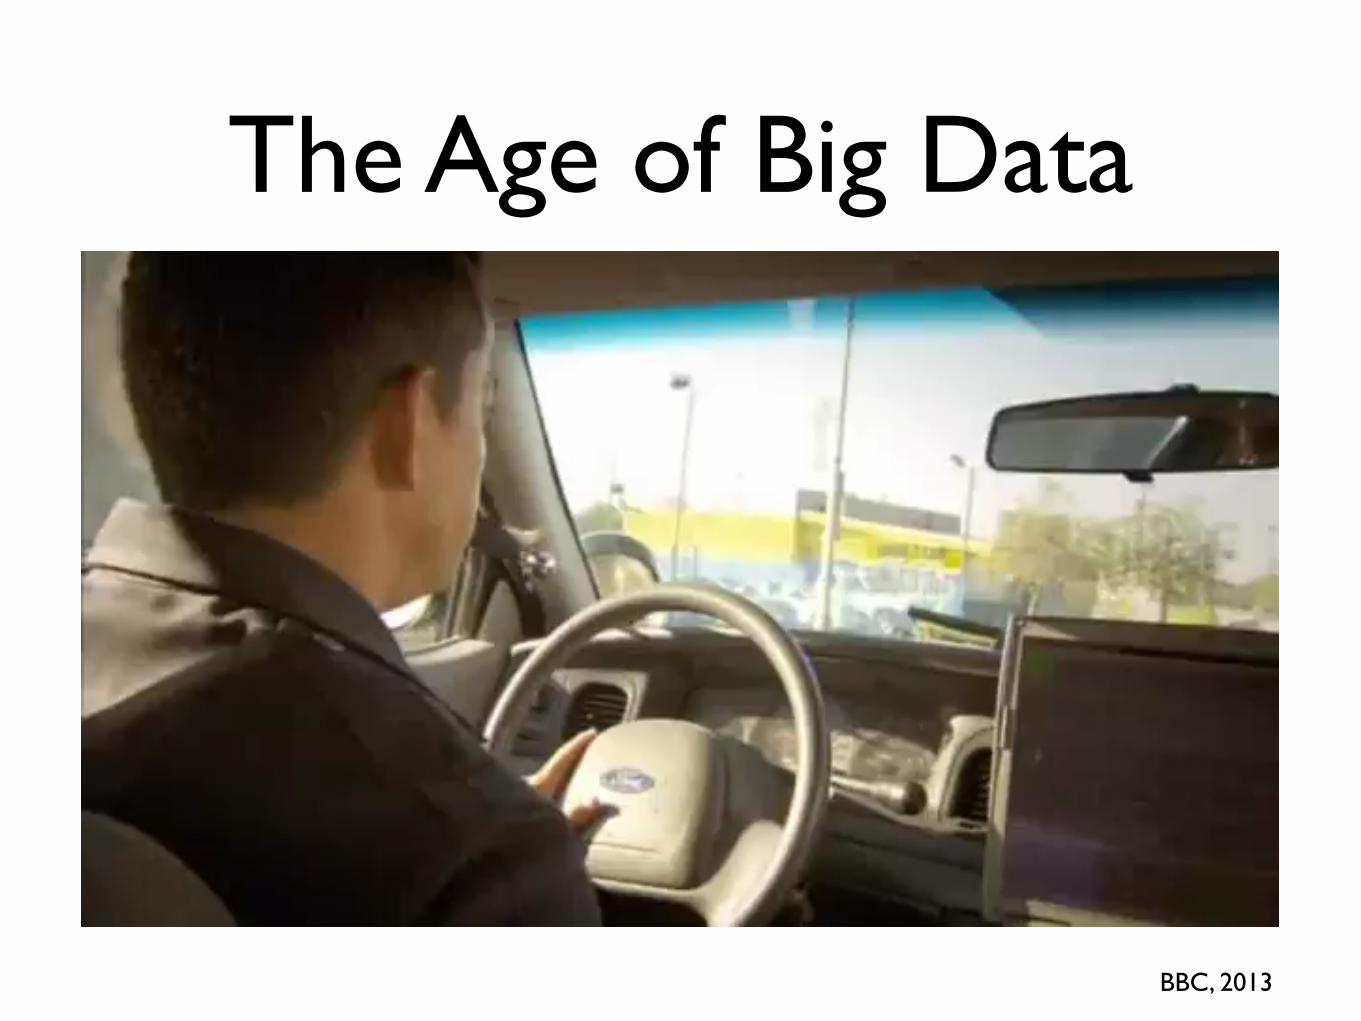
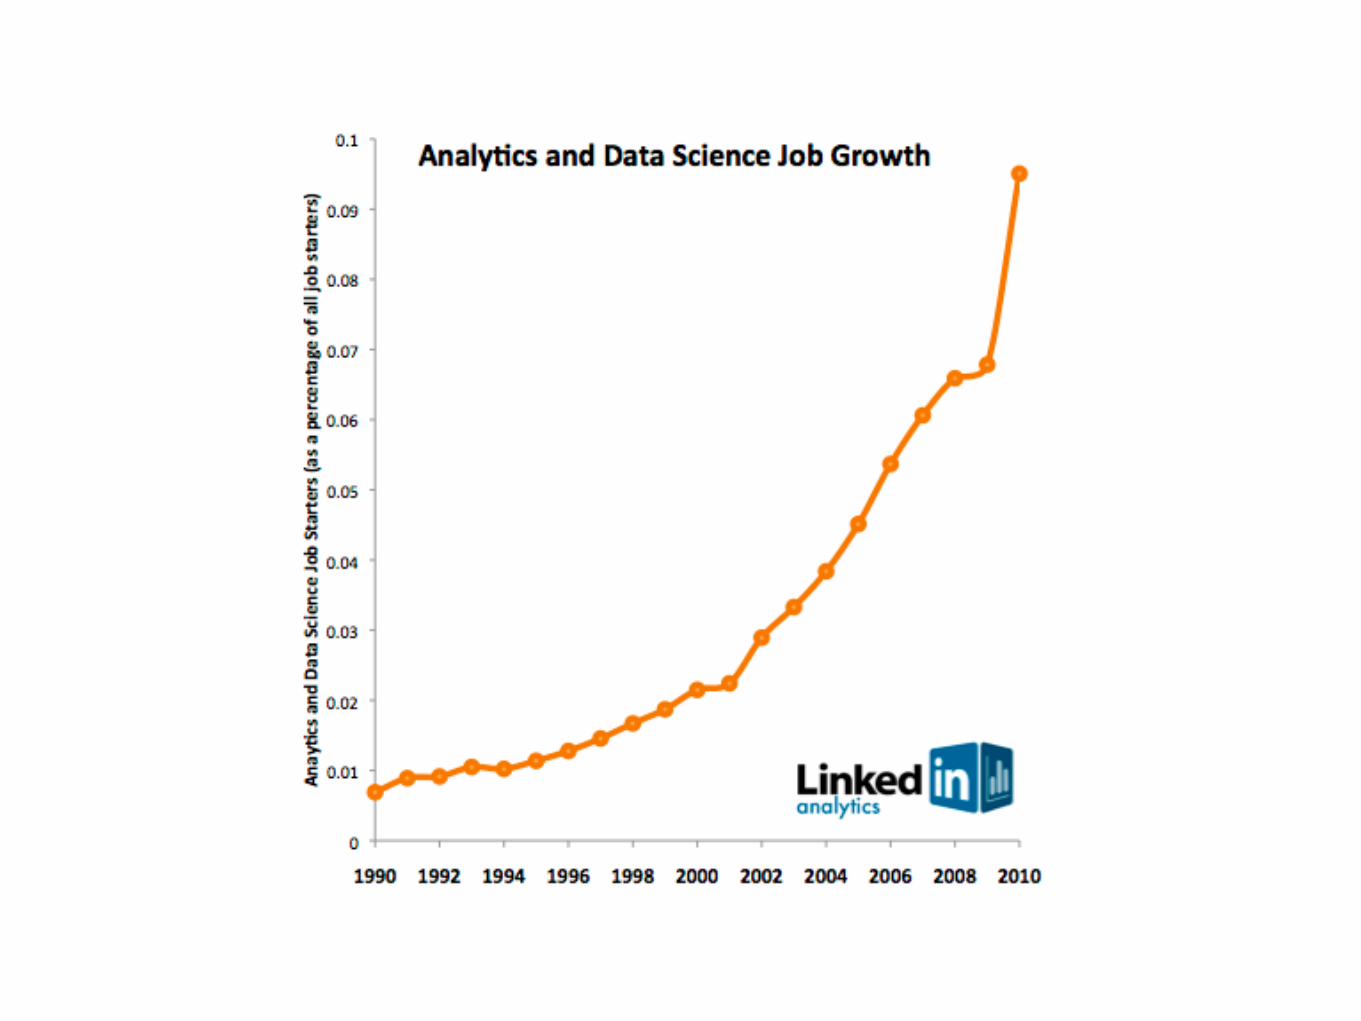
Big Data“Between the dawn of civilization and 2003, we only created five exabytes of information; now we’re creating that amount every two days.”
Eric Schmidt, Google (and others)
travers808, Visual.ly
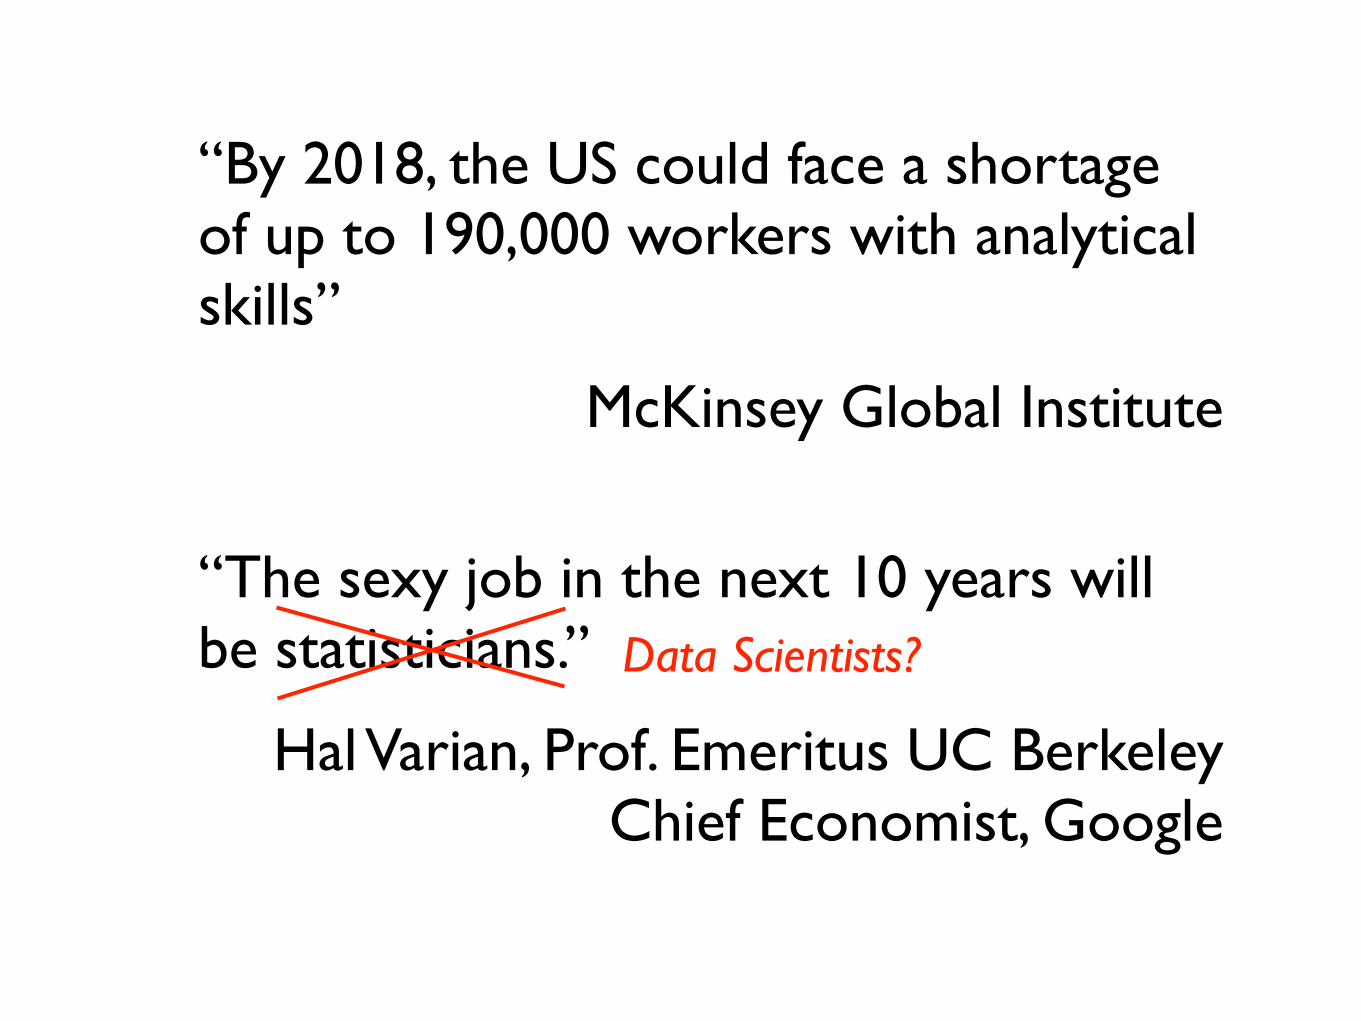
“The sexy job in the next 10 years will be statisticians.”
Hal Varian, Prof. Emeritus UC Berkeley Chief Economist, Google
Data Scientists?
“By 2018, the US could face a shortage of up to 190,000 workers with analytical skills”
McKinsey Global Institute
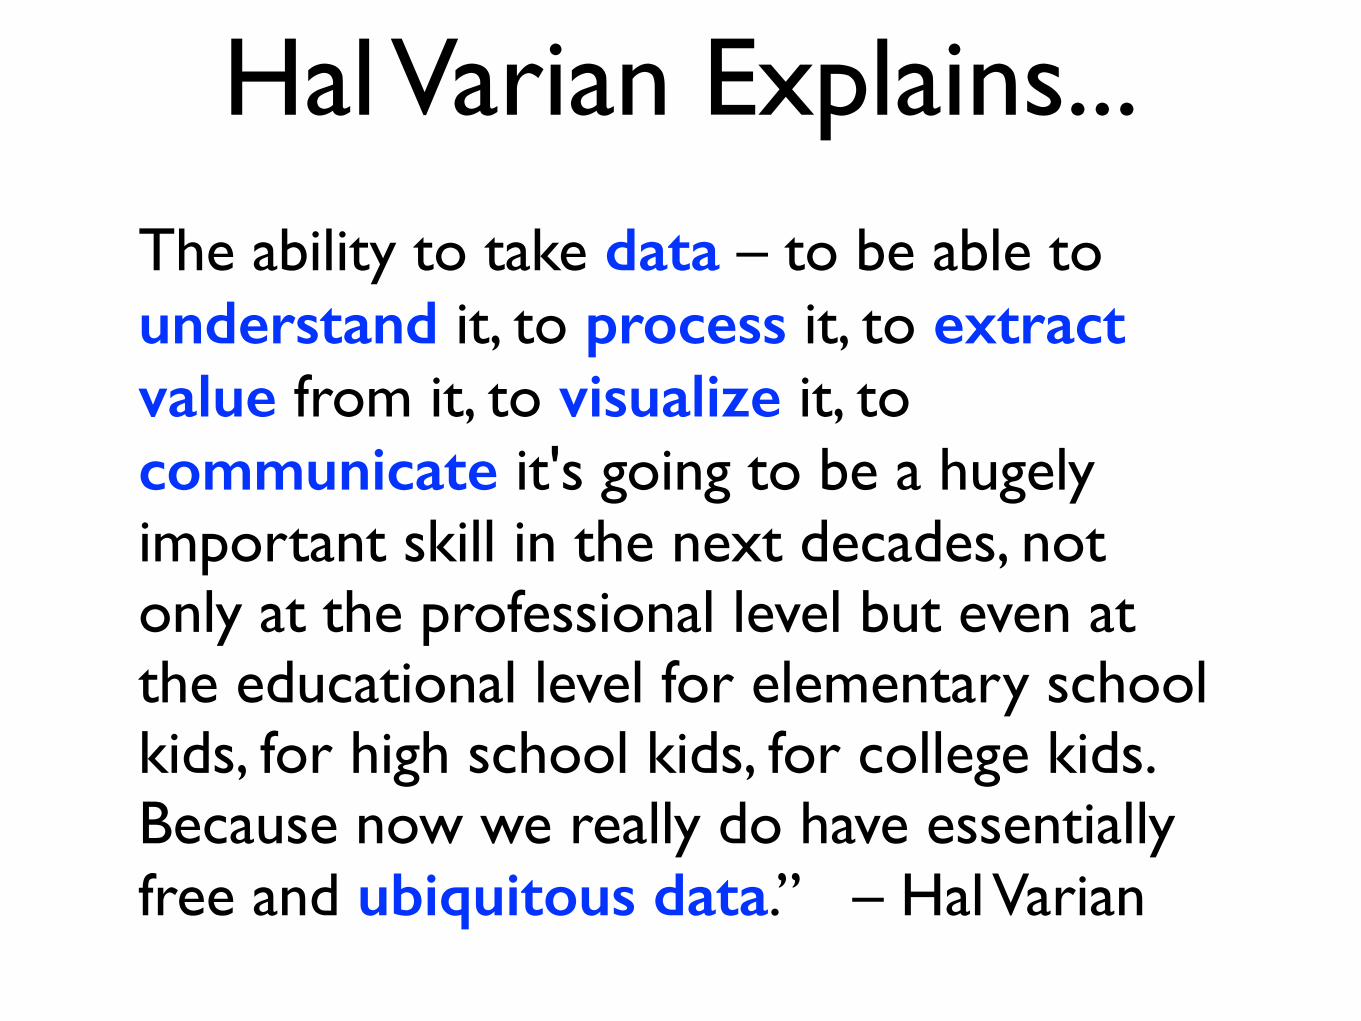
The ability to take data – to be able to understand it, to process it, to extract value from it, to visualize it, to communicate it's going to be a hugely important skill in the next decades, not only at the professional level but even at the educational level for elementary school kids, for high school kids, for college kids. Because now we really do have essentially free and ubiquitous data.” – Hal Varian
Hal Varian Explains...
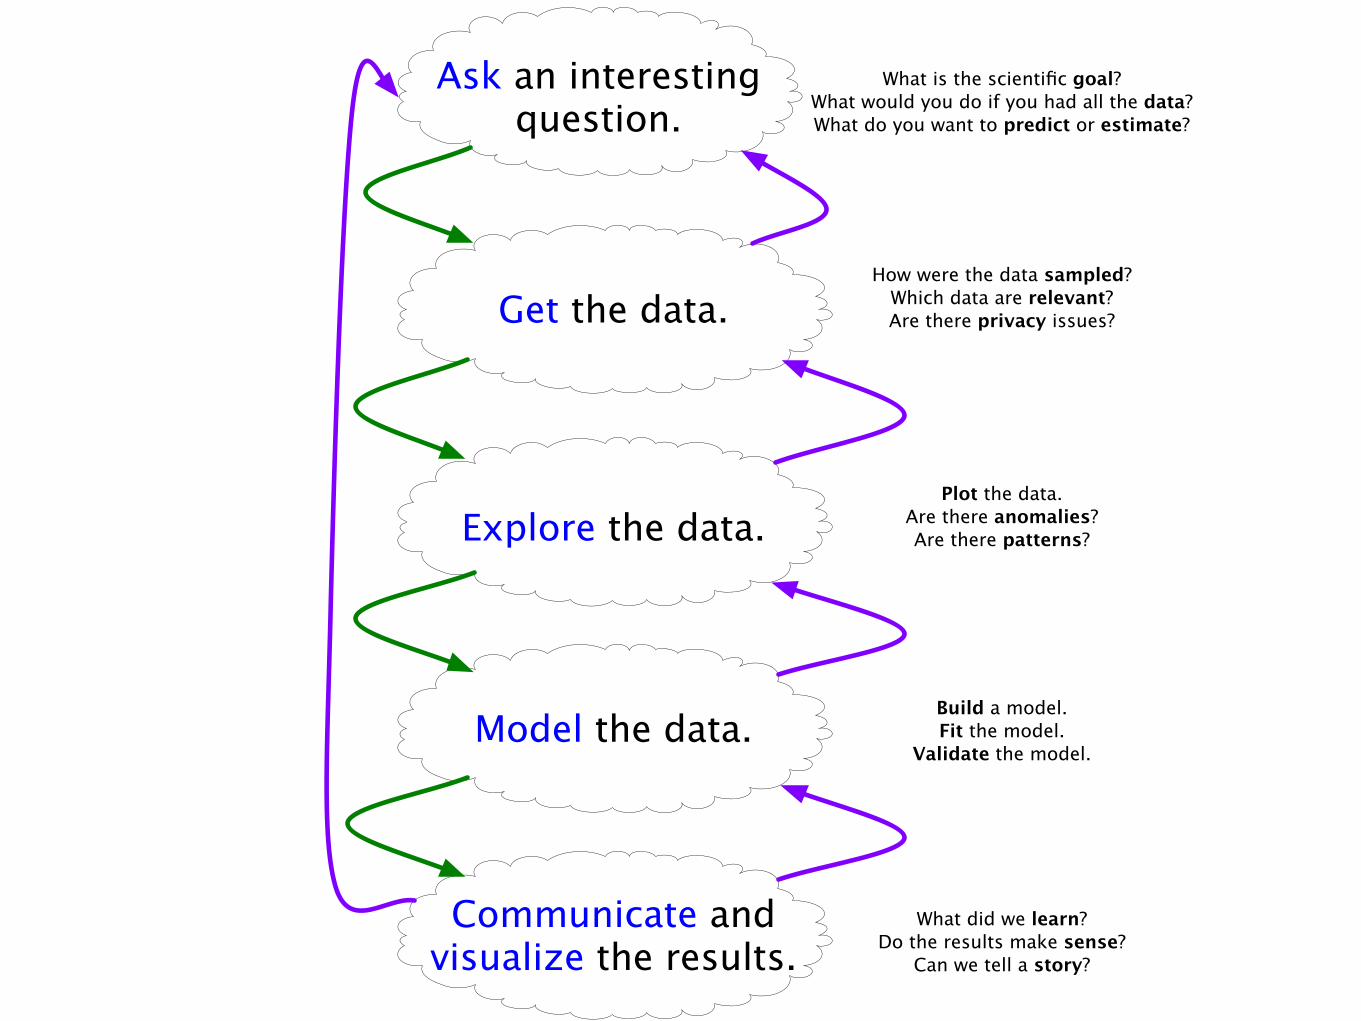
Ask an interesting question.
Get the data.
Explore the data.
Model the data.
Communicate and visualize the results.
What is the scientific goal?What would you do if you had all the data?What do you want to predict or estimate?
How were the data sampled?Which data are relevant?Are there privacy issues?
Plot the data.Are there anomalies?Are there patterns?
Build a model.Fit the model.
Validate the model.
What did we learn?Do the results make sense?
Can we tell a story?
Outline
• What?
• Why?
• Who?
• How?
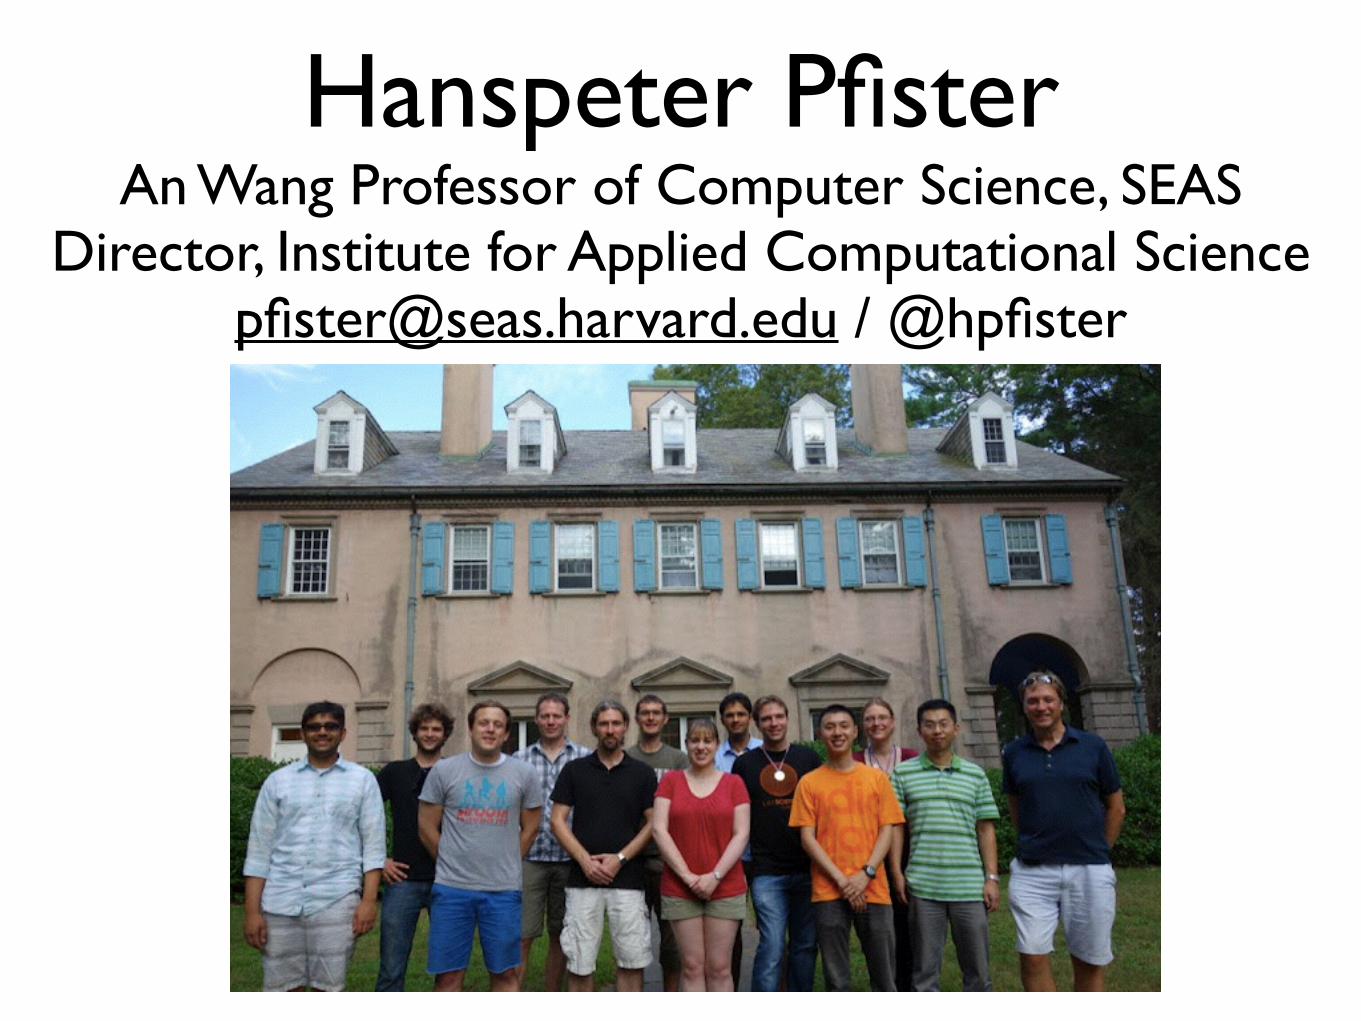
Hanspeter Pfister An Wang Professor of Computer Science, SEAS
Director, Institute for Applied Computational Science [email protected] / @hpfister
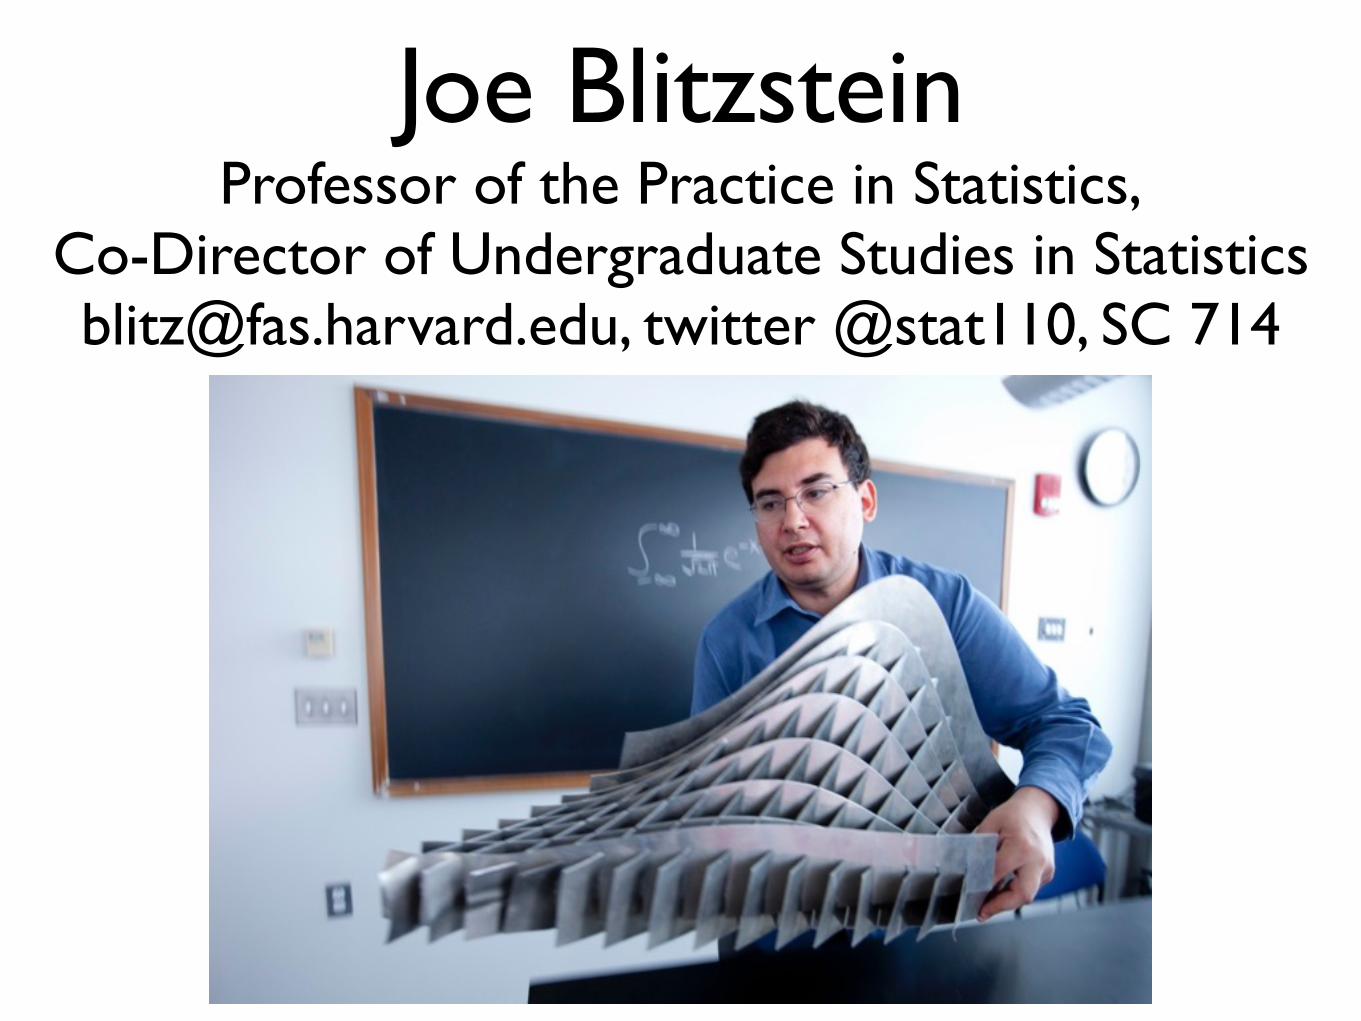
Joe Blitzstein Professor of the Practice in Statistics,
Co-Director of Undergraduate Studies in Statistics [email protected], twitter @stat110, SC 714
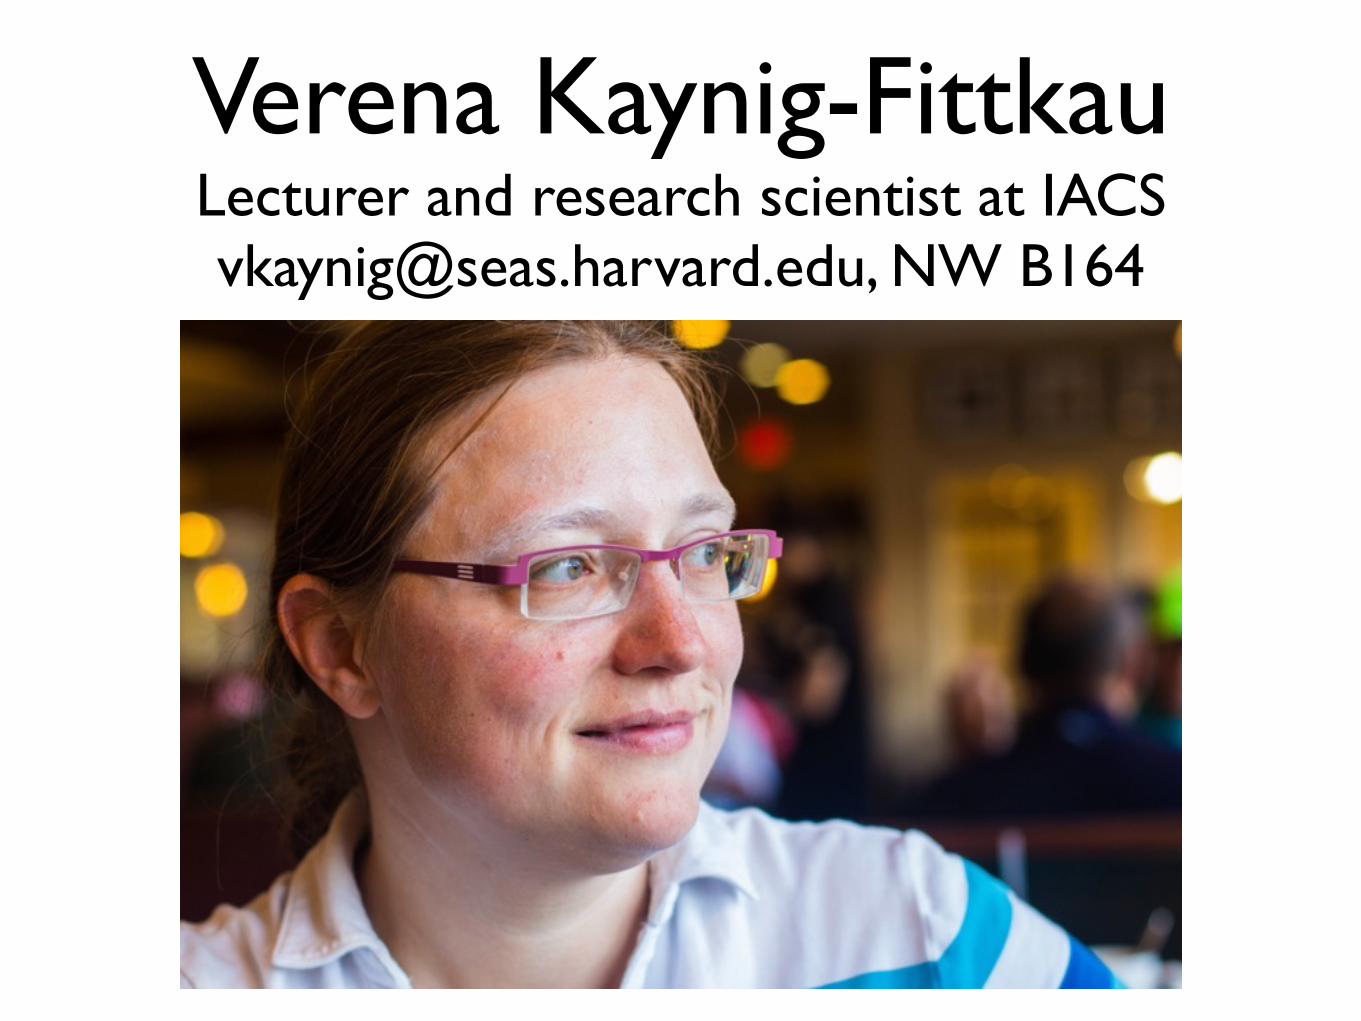
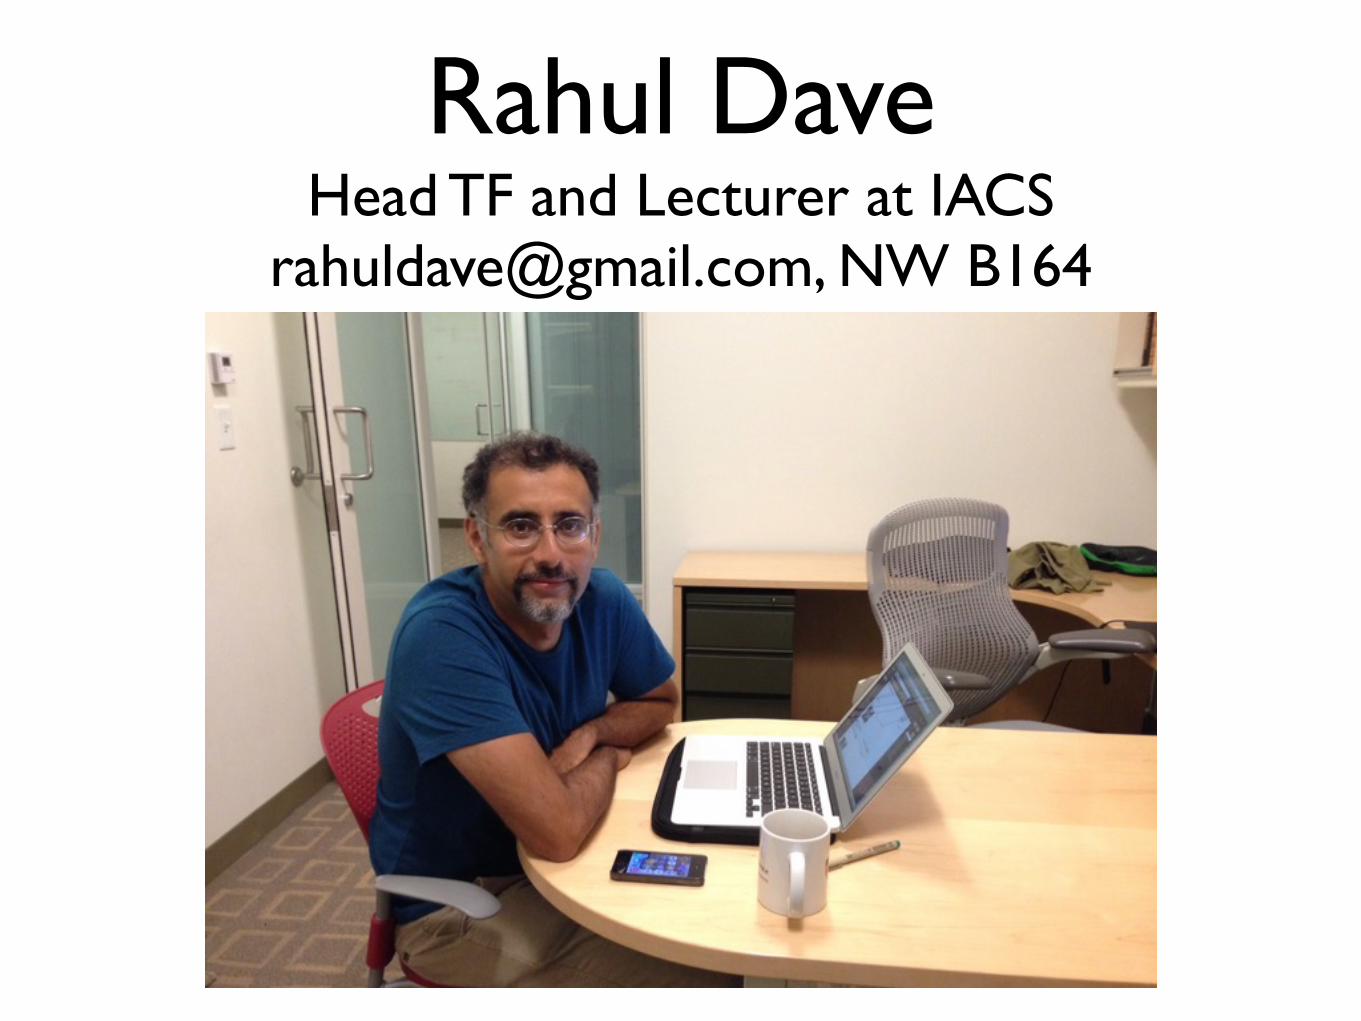
Verena Kaynig-Fittkau Lecturer and research scientist at IACS [email protected], NW B164
CS 109 StaffAndrew ReeceAntonio CoppolaAusten NovisBrian FeenyDana KatzenelsonGiri GopalanIrma NomaniJacob DorabialskiJoseph SongKathy LiLawrence KimLeandra King
Luis CamposMarcus WayMichael MaMichael PackerNelson SantosRichard KimRick Wei-Jong LeeSail WuStephen KlostermanXintao QiuYingzhuo (Diana) ZhangYuhao Zhu

About You
Outline
• What?
• Why?
• Who?
• How?
CS109 Key Facets• data munging/scraping/sampling/cleaning in order to get an
informative, manageable data set;
• data storage and management in order to be able to access data quickly and reliably during subsequent analysis;
• exploratory data analysis to generate hypotheses and intuition about the data;
• prediction based on statistical tools such as regression, classification, and clustering; and
• communication of results through visualization, stories, and interpretable summaries.
Act I: Predictions
• Data Collection, “Munging”, and Storage
• Exploratory Data Analysis (EDA)
• Classification & Regression
• Cross Validation
• Dimensionality Reduction
• Effective Communication & Writing
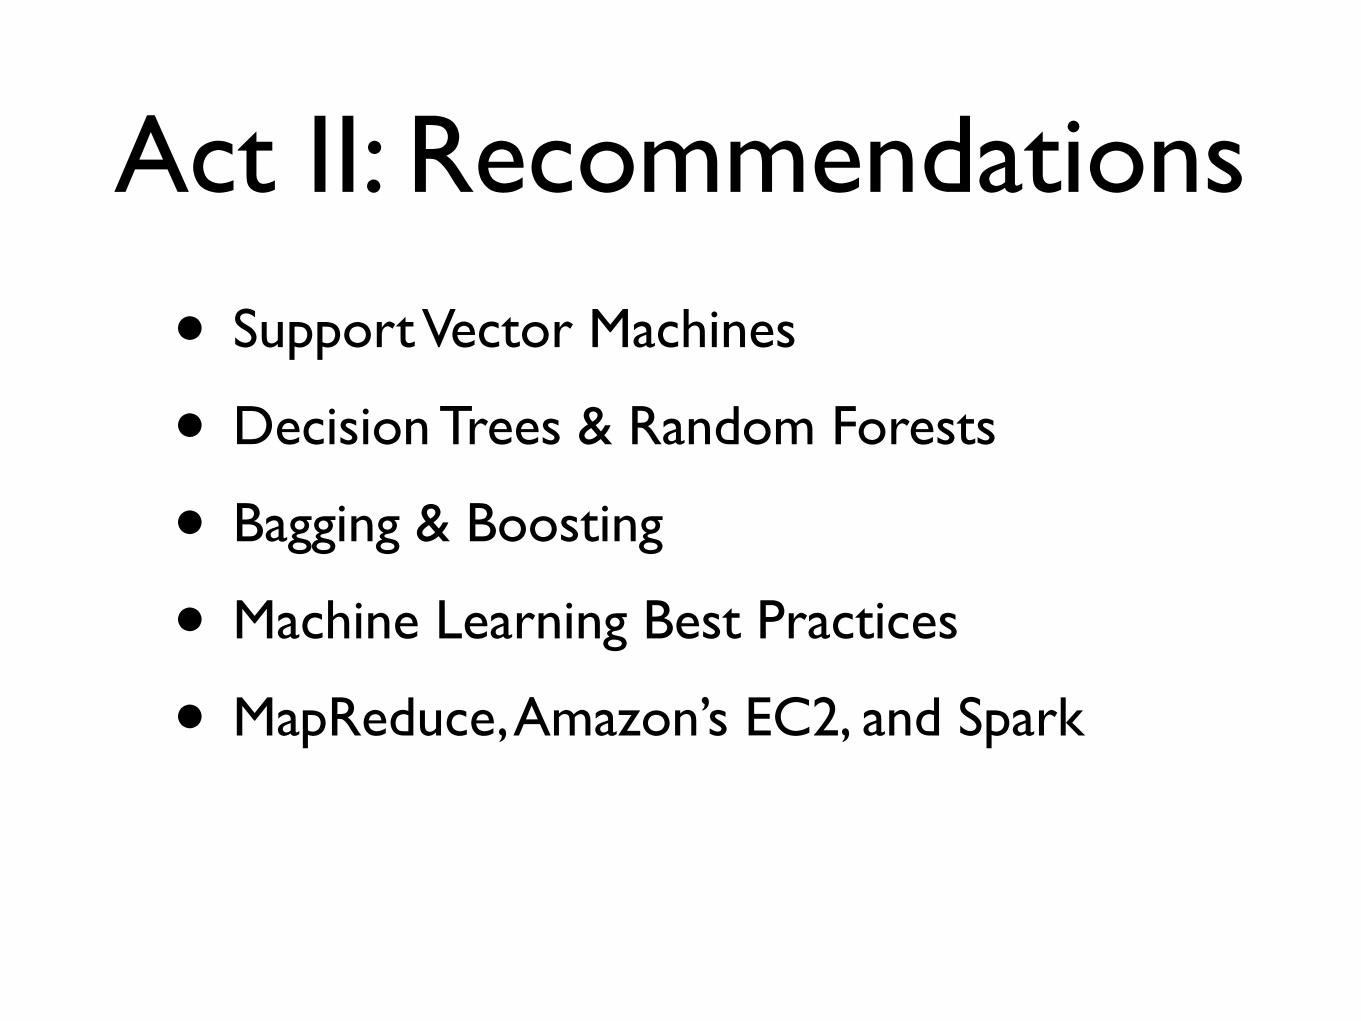
Act II: Recommendations
• Support Vector Machines
• Decision Trees & Random Forests
• Bagging & Boosting
• Machine Learning Best Practices
• MapReduce, Amazon’s EC2, and Spark
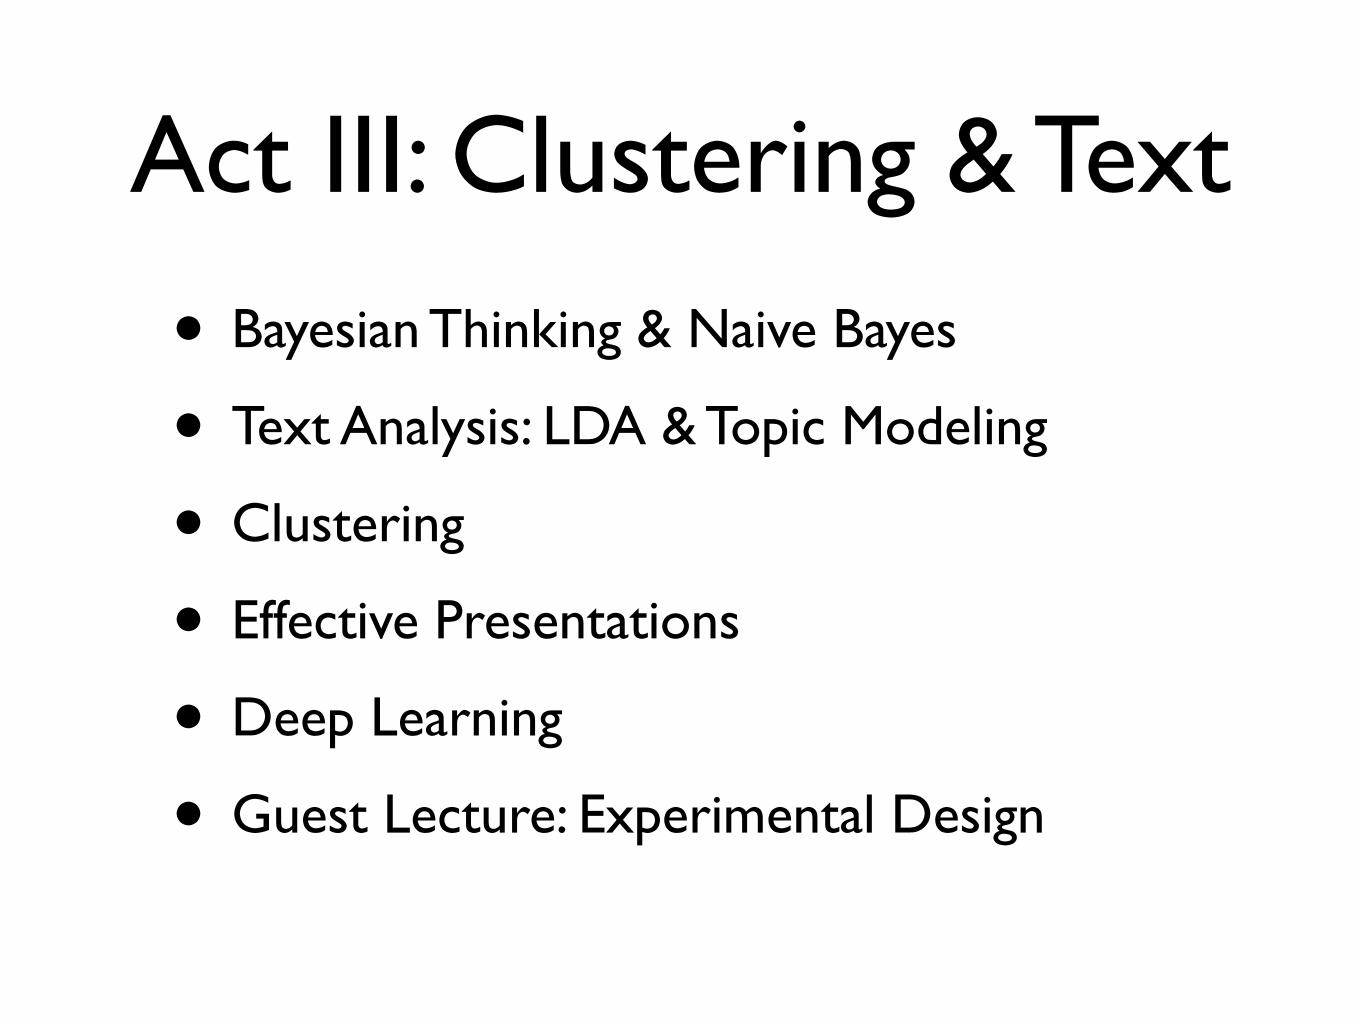
Act III: Clustering & Text
• Bayesian Thinking & Naive Bayes
• Text Analysis: LDA & Topic Modeling
• Clustering
• Effective Presentations
• Deep Learning
• Guest Lecture: Experimental Design

Concepts...
Lectures

...and Skills
Sections
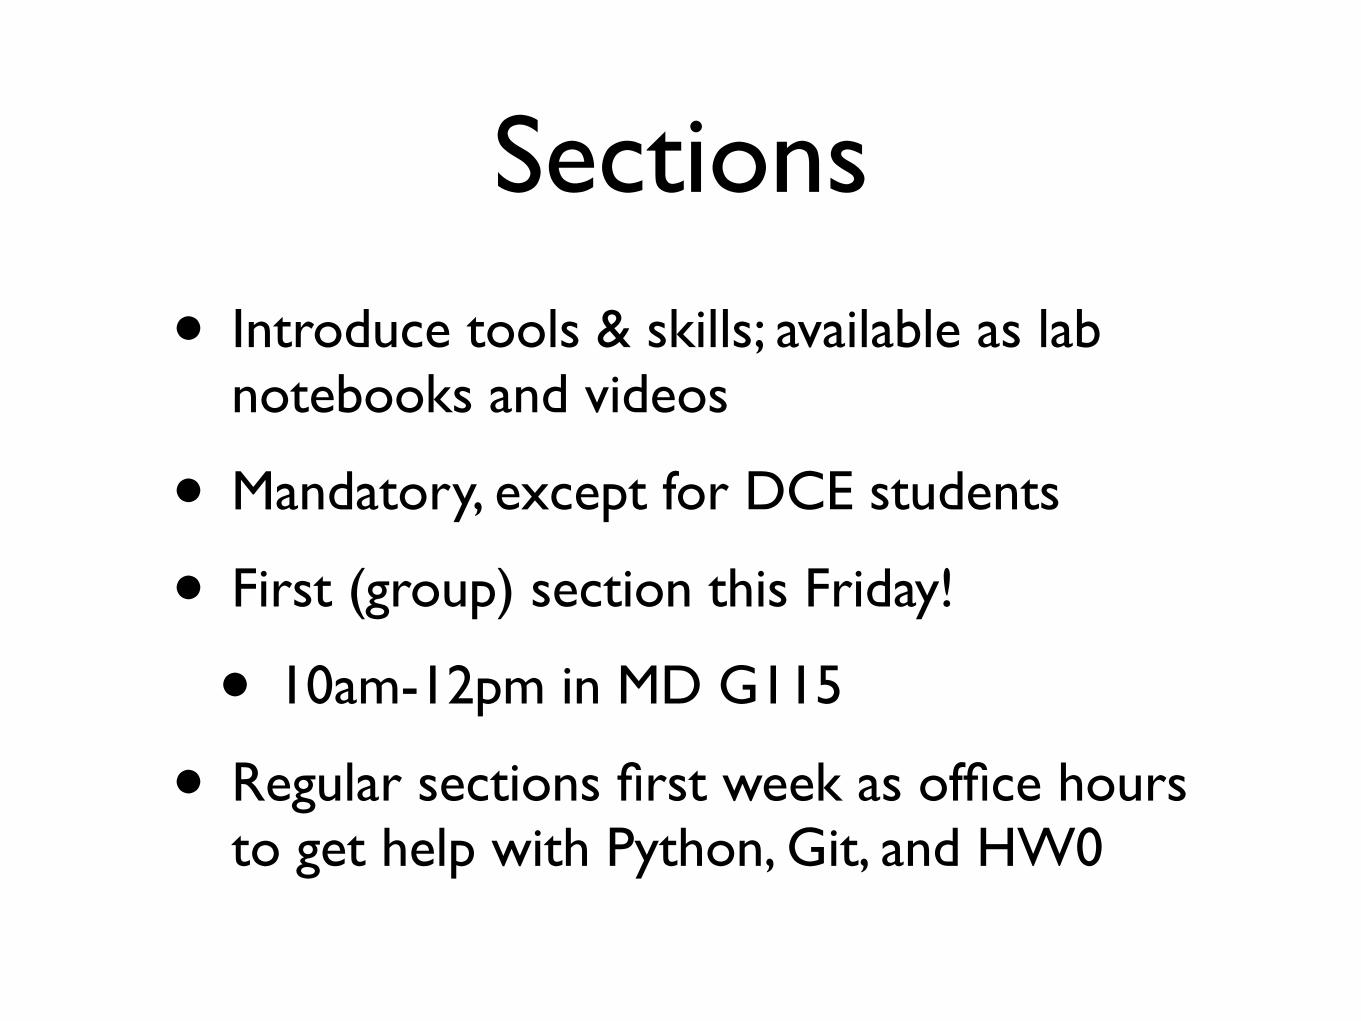
Sections
• Introduce tools & skills; available as lab notebooks and videos
• Mandatory, except for DCE students
• First (group) section this Friday!
• 10am-12pm in MD G115
• Regular sections first week as office hours to get help with Python, Git, and HW0
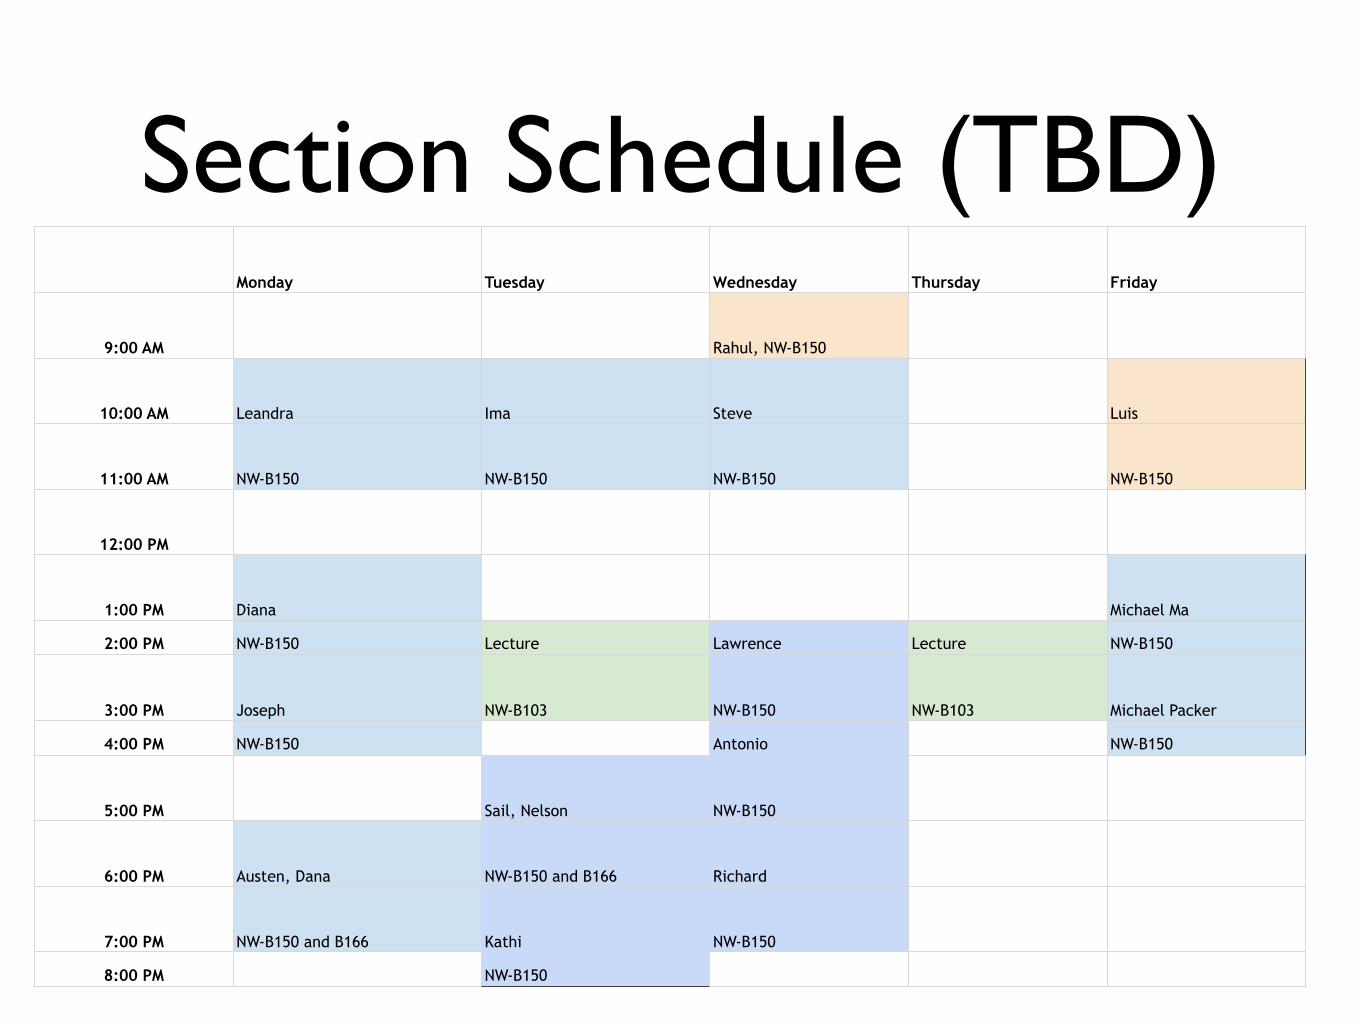
Section Schedule (TBD)Monday Tuesday Wednesday Thursday Friday
9:00 AM Rahul, NW-B150
10:00 AM Leandra Ima Steve Luis
11:00 AM NW-B150 NW-B150 NW-B150 NW-B150
12:00 PM
1:00 PM Diana Michael Ma
2:00 PM NW-B150 Lecture Lawrence Lecture NW-B150
3:00 PM Joseph NW-B103 NW-B150 NW-B103 Michael Packer
4:00 PM NW-B150 Antonio NW-B150
5:00 PM Sail, Nelson NW-B150
6:00 PM Austen, Dana NW-B150 and B166 Richard
7:00 PM NW-B150 and B166 Kathi NW-B150
8:00 PM NW-B150
Homework
• Real-World focus
• Scrape and wrangle messy data
• Apply sophisticated statistical analysis
• Visualize and communicate results
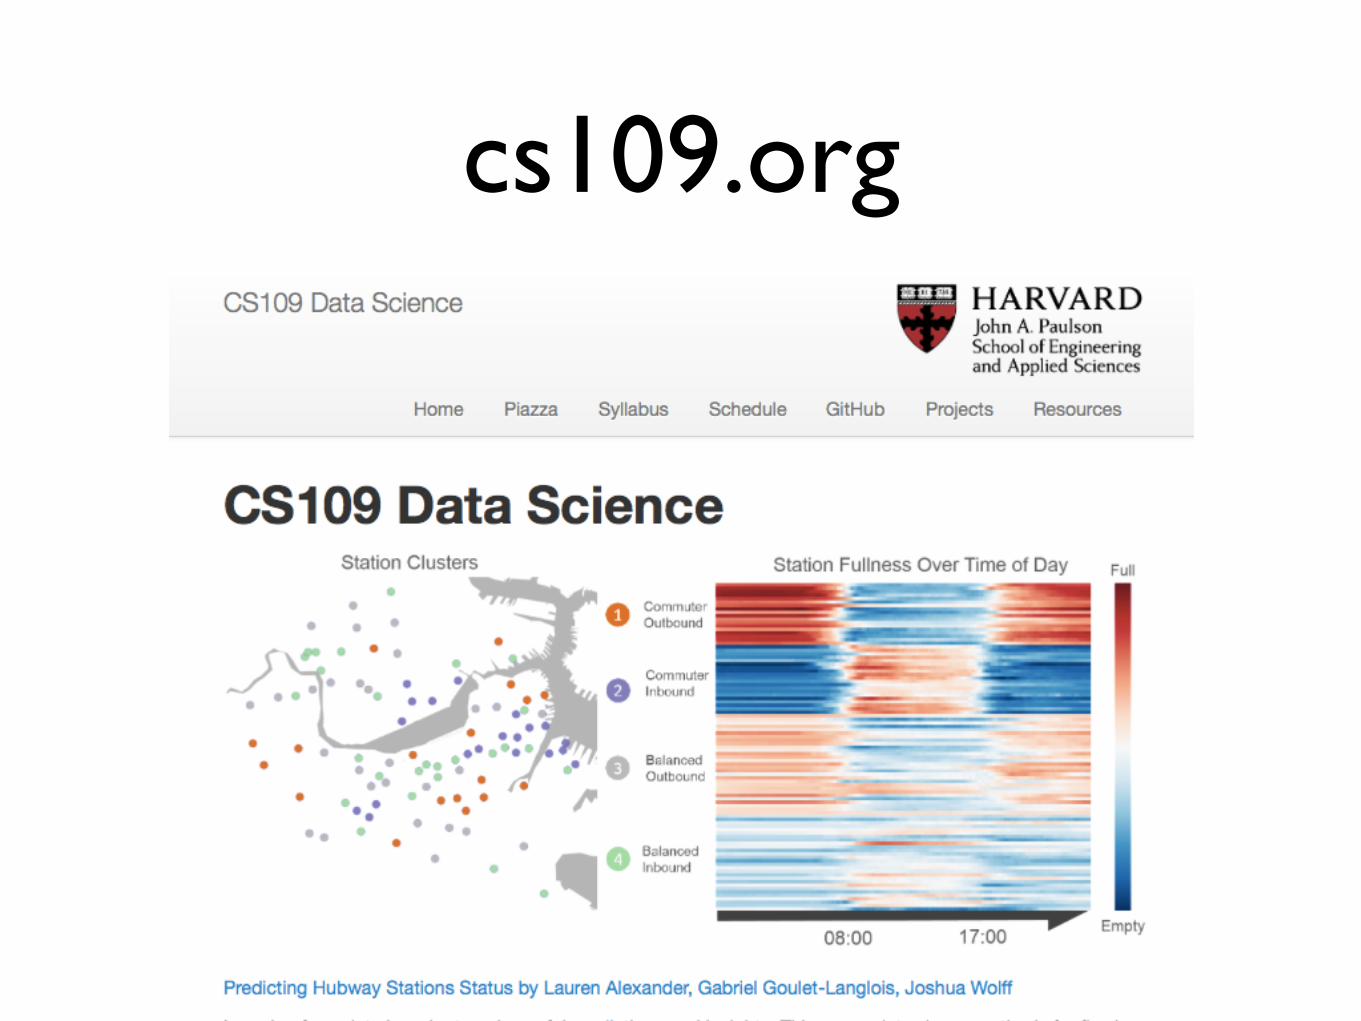
• Election data, music charts, recommendations, etc.
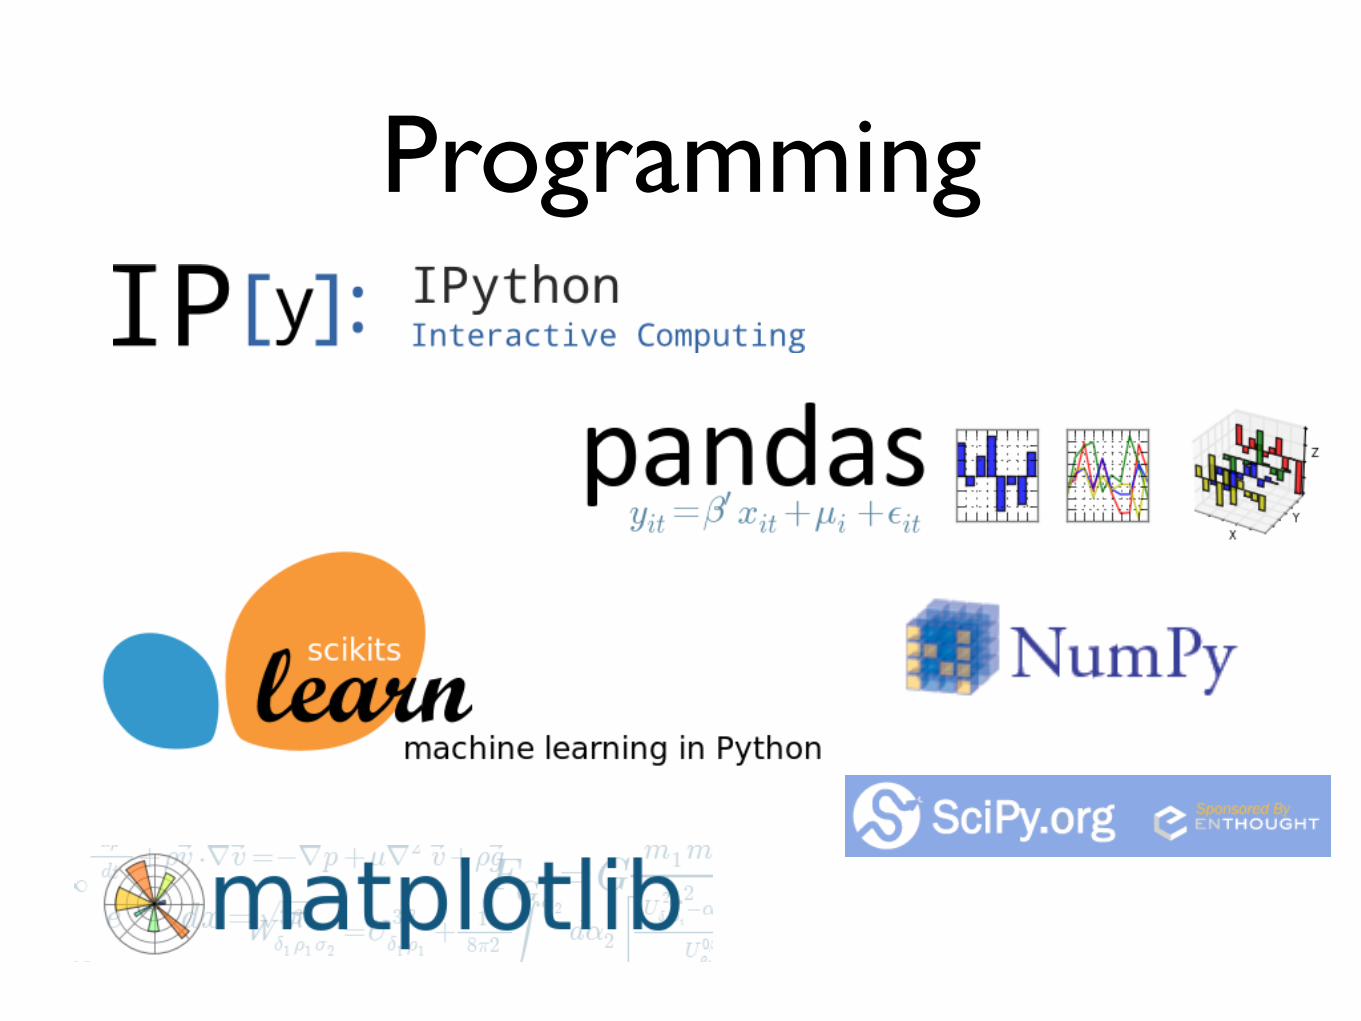
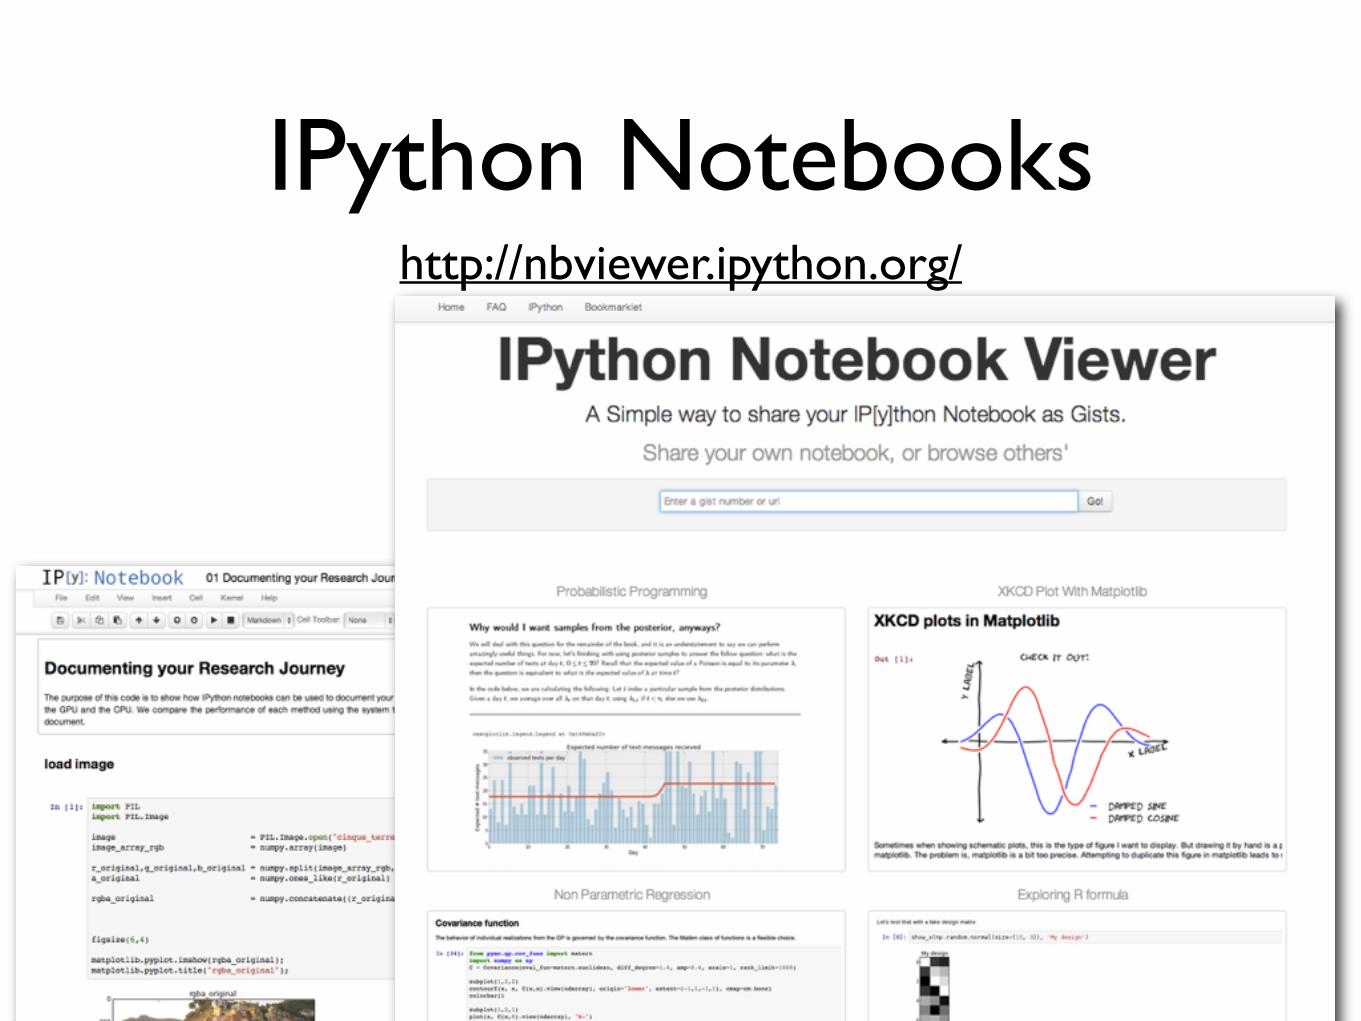
Programming
xkcd
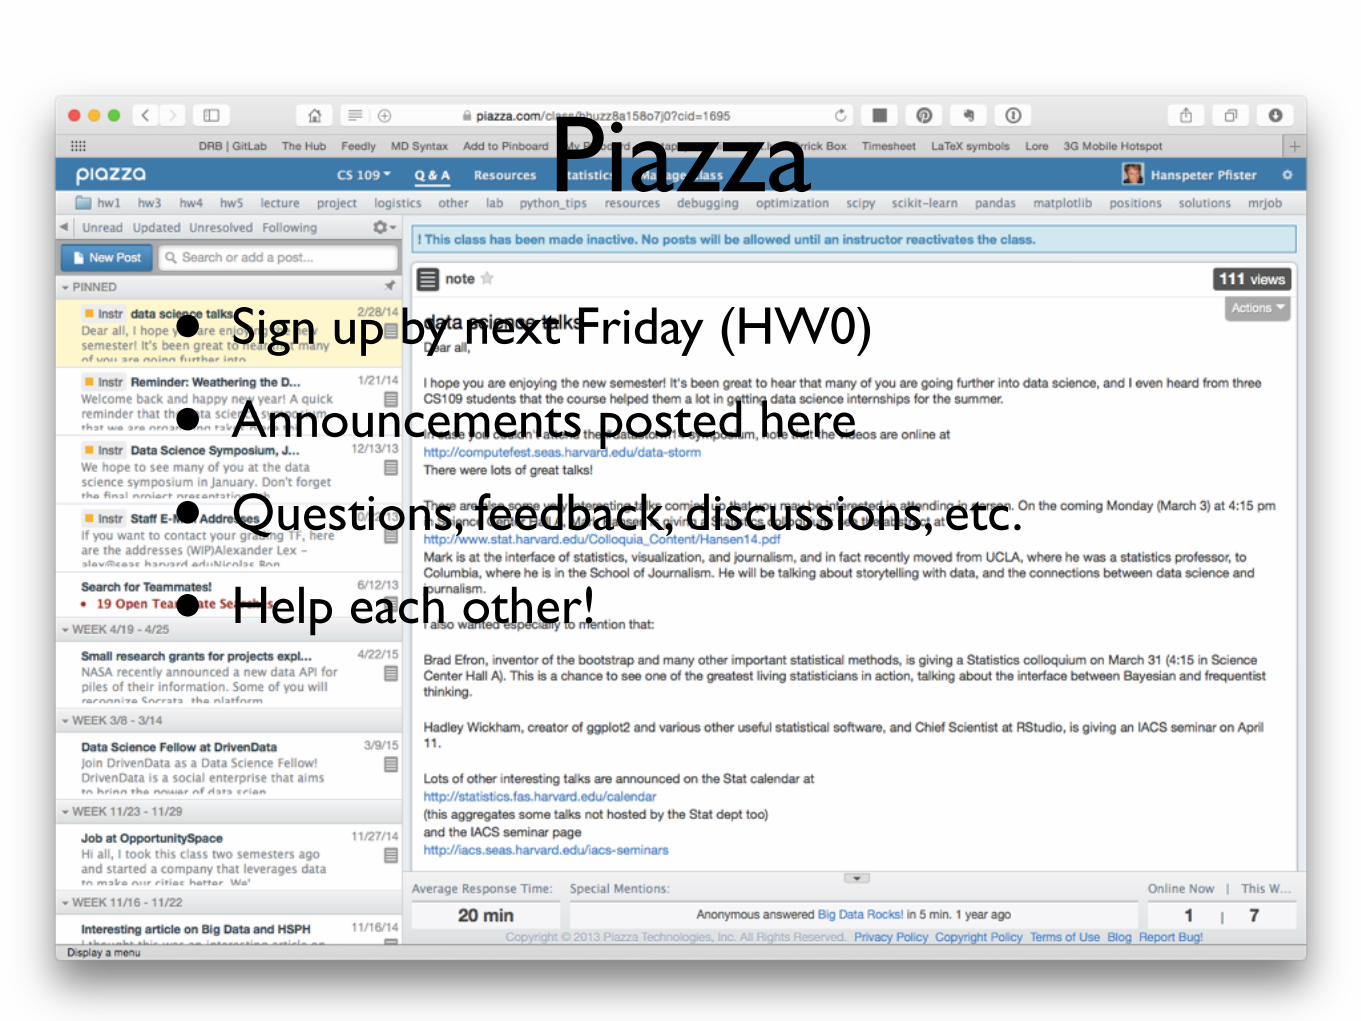
Piazza
• Sign up by next Friday (HW0)
• Announcements posted here
• Questions, feedback, discussions, etc.
• Help each other!
Grades
• No exams!
• 50% Homework
• 40% Projects (3-4 person teams)
• 10% Participation (Piazza & Sections)
• 10 point scale, holistic grading
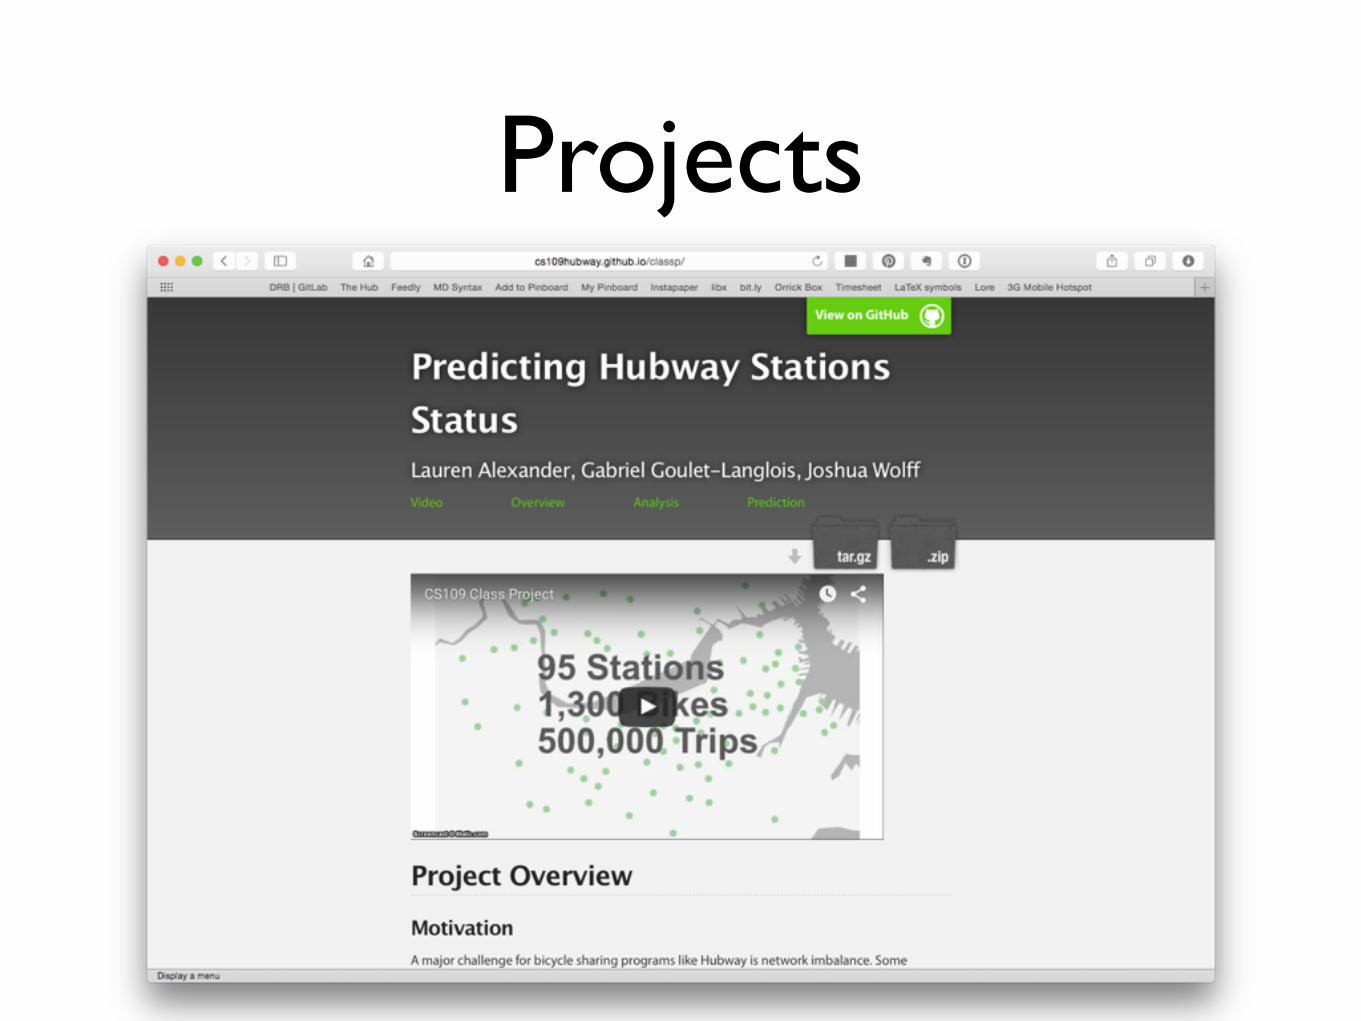
Projects
Policies
• HWs due on Thursdays, 11:59 pm EST
• 6 late days for HW (no questions asked)
• Cannot submit HW later than 2 days
• Regrading requests within 7 days in writing
• Grade may improve or go down
Collaboration Policy
• Work you turn in must be your own
• Projects are a 3-4 person team effort
• With project group peer assessment
• Acknowledge all help and code you used
• Harvard Honor Code

Is this course for me ???
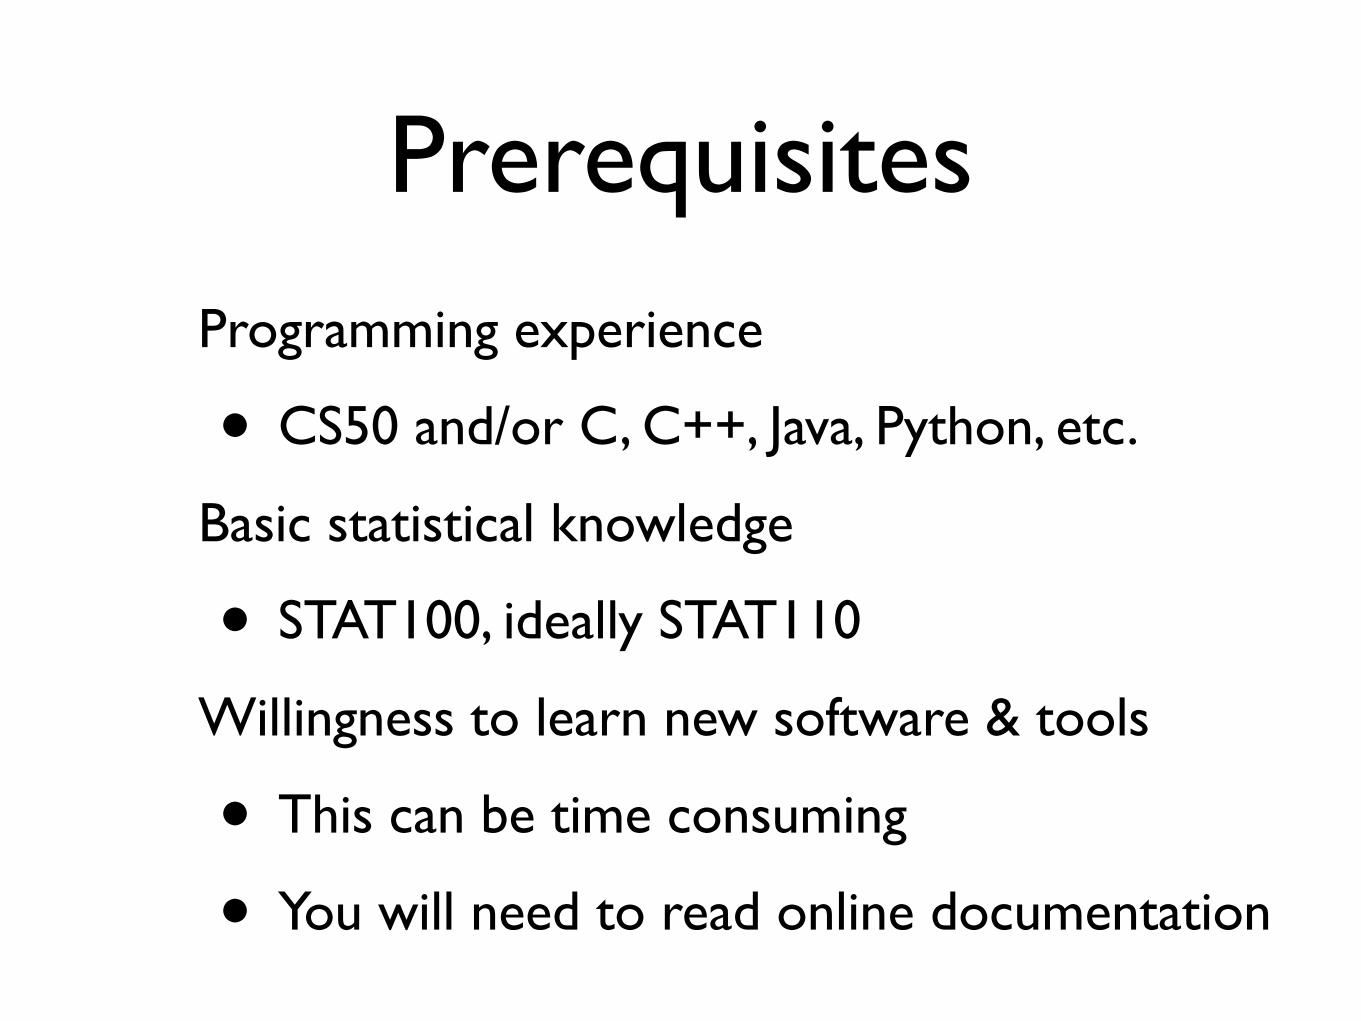
PrerequisitesProgramming experience
• CS50 and/or C, C++, Java, Python, etc.
Basic statistical knowledge
• STAT100, ideally STAT110
Willingness to learn new software & tools
• This can be time consuming
• You will need to read online documentation
http://davidzinger.wordpress.com/2007/05/page/2/
Be Patient
Be Flexible
Be Constructive
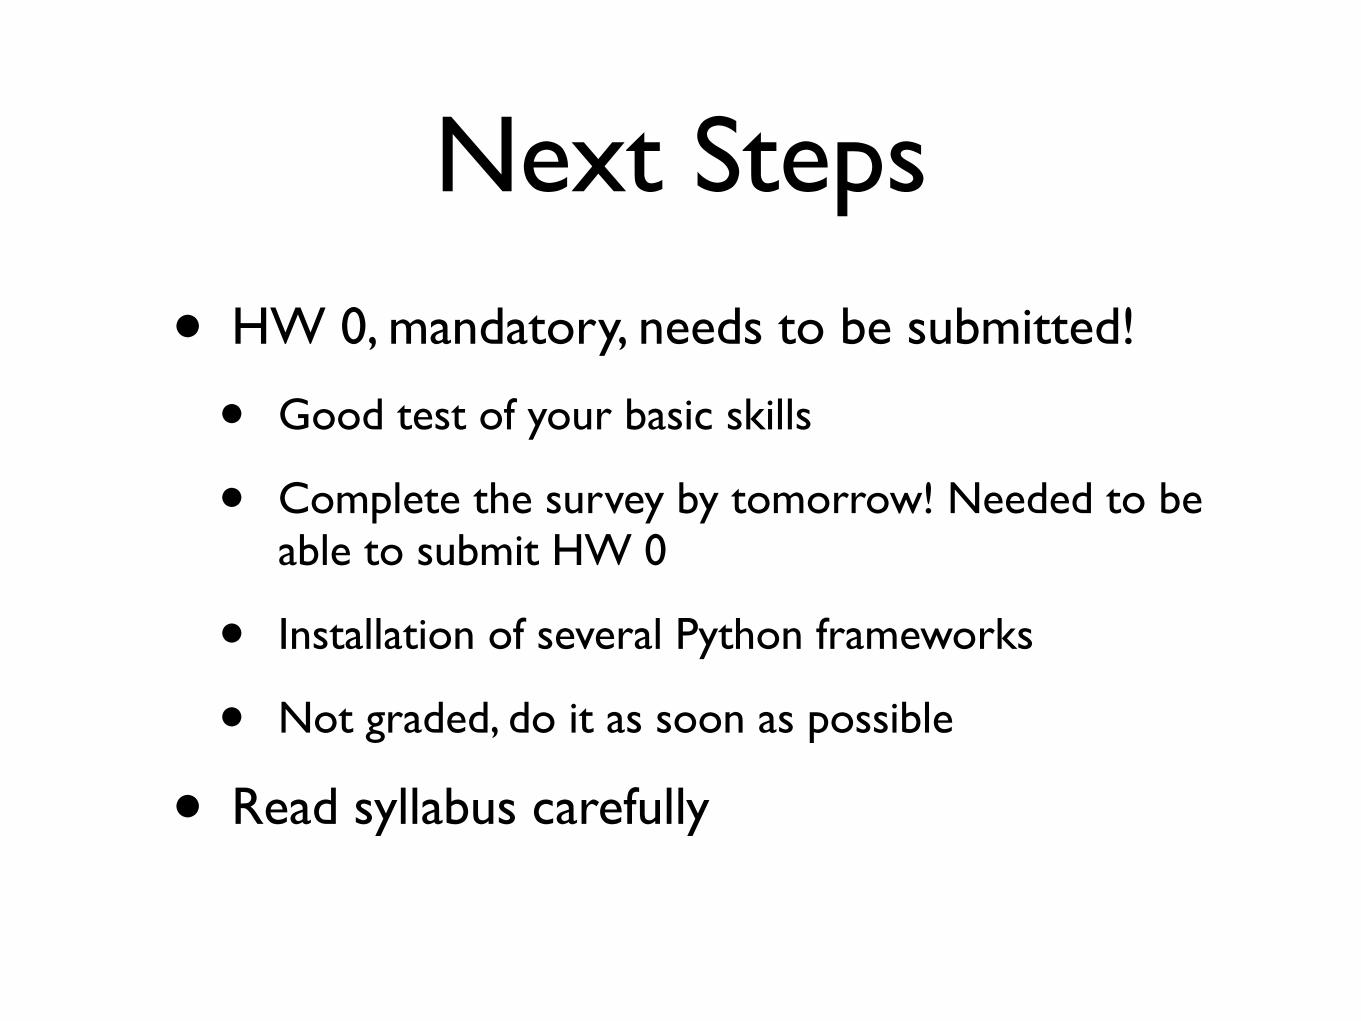
Next Steps
• HW 0, mandatory, needs to be submitted!
• Good test of your basic skills
• Complete the survey by tomorrow! Needed to be able to submit HW 0
• Installation of several Python frameworks
• Not graded, do it as soon as possible
• Read syllabus carefully
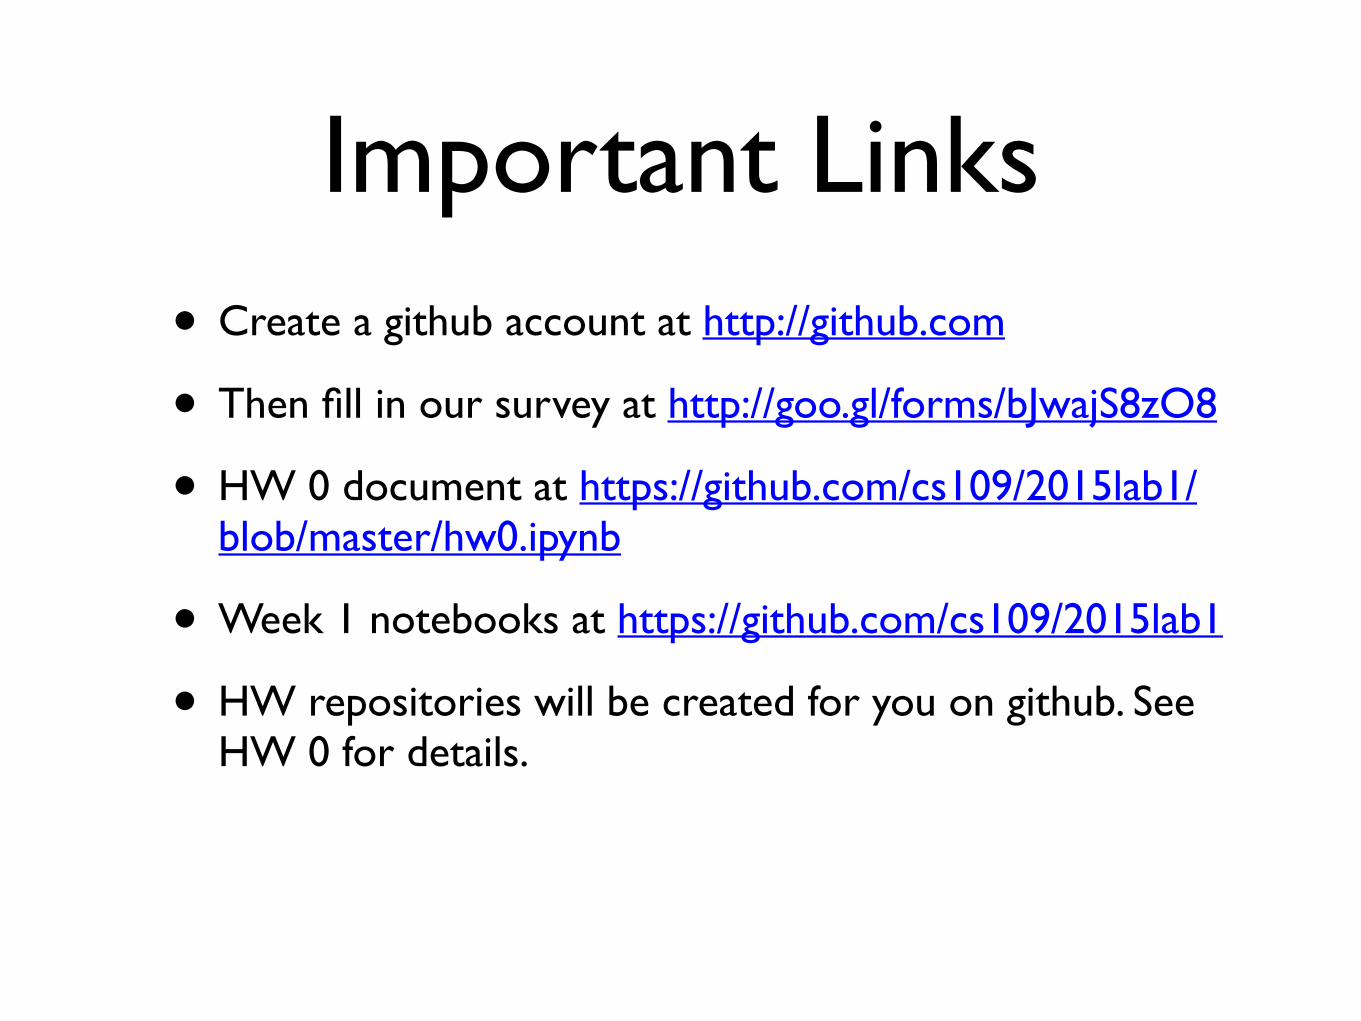
Important Links• Create a github account at http://github.com
• Then fill in our survey at http://goo.gl/forms/bJwajS8zO8
• HW 0 document at https://github.com/cs109/2015lab1/blob/master/hw0.ipynb
• Week 1 notebooks at https://github.com/cs109/2015lab1
• HW repositories will be created for you on github. See HW 0 for details.