Embed Size (px)
Citation preview

document.xlssGMS Revision Record
Printed: 04/17/2023
Date Name Worksheet Name Update Description
01/20/06 Joe Koss Fast Response Sign-in SheetMoved to Fast Response Template file
document.xlsVS_Revision Record
Printed: 04/17/2023
Date Name Worksheet Name Update Description
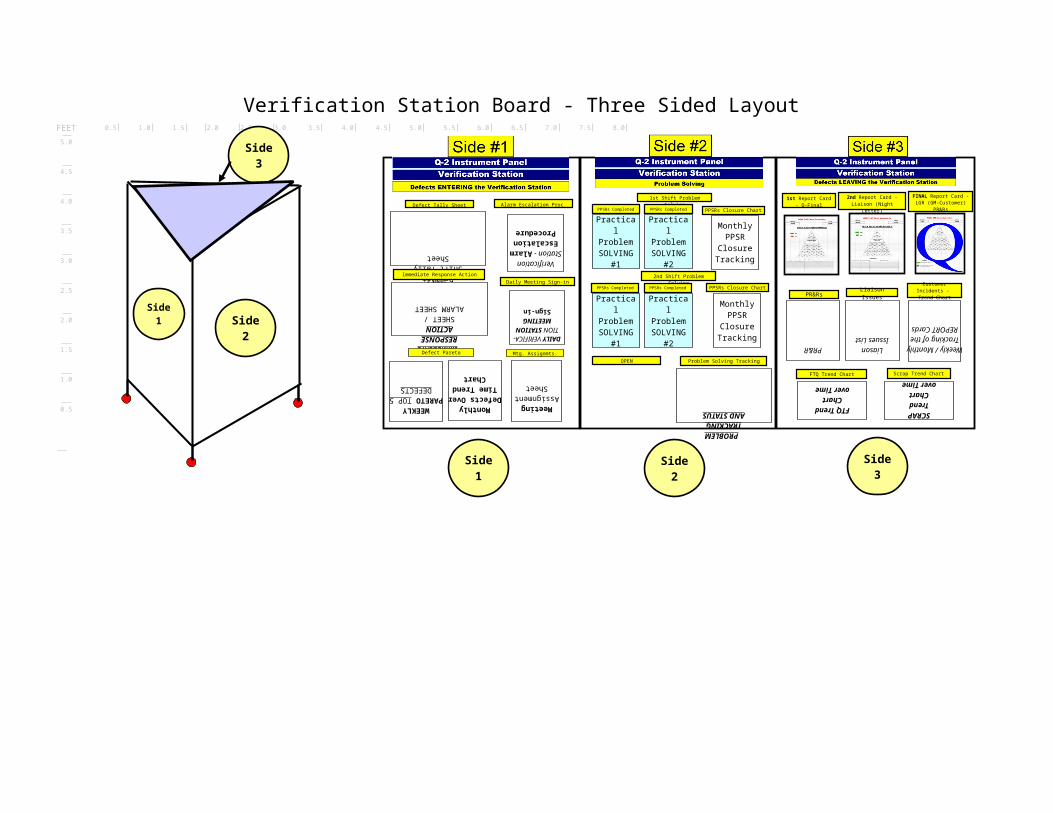
Verification Station Board - Three Sided LayoutFEET 0.5 1.0 1.5 2.0 2.5 3.0 3.5 4.0 4.5 5.0 5.5 6.0 6.5 7.0 7.5 8.0
5.0
4.5
4.0
3.5
3.0
2.5
2.0
1.5
1.0
0.5 WEEKLY PARETO TOP 5
DEFECTS
DAILY VERIFICA-TION
STATION MEETING
Sign-in
IMMEDIATE RESPONSE
ACTION SHEET / ALARM SHEET
Day/Aft Shift Tally Sheet
Meeting Assignment
Sheet
Verification Station - Alarm
Escalation Procedure
FTQ Trend Chart
Monthly PPSR
Closure Tracking
PROBLEM TRACKING
AND STATUS
Side1 Side
2
Side3
Side2
Side1
Side3
Defect Pareto
Scrap Trend Chart
Monthly Defects Over Time Trend
Chart
PR&R Weekly / Monthly Tracking of the
REPORT Cards
LiasonIssues List
SCRAP Trend Chart over Time
Mtg. Assignmts.
Practical Problem
SOLVING#1
Practical Problem
SOLVING#2
1st Shift Problem Solving
Monthly PPSR
Closure Tracking
Practical Problem
SOLVING#2
Practical Problem
SOLVING#1
2nd Shift Problem Solving
Problem Solving Tracking
Defect Tally Sheet
Immediate Response Action Sheet
Alarm Escalation Proc.
Daily Meeting Sign-in
1st Report Card - Q-Final
2nd Report Card - Liaison (Night Letter)
FINAL Report Card - LGR (GM-Customer)
PR&Rs
Customer Incidents - Trend ChartPR&Rs
PPSRs Completed
OPEN
FTQ Trend Chart over Time
PPSRs Closure Chart
PPSRs Closure ChartPPSRs Completed
PPSRs Completed PPSRs Completed
Liaison Issues

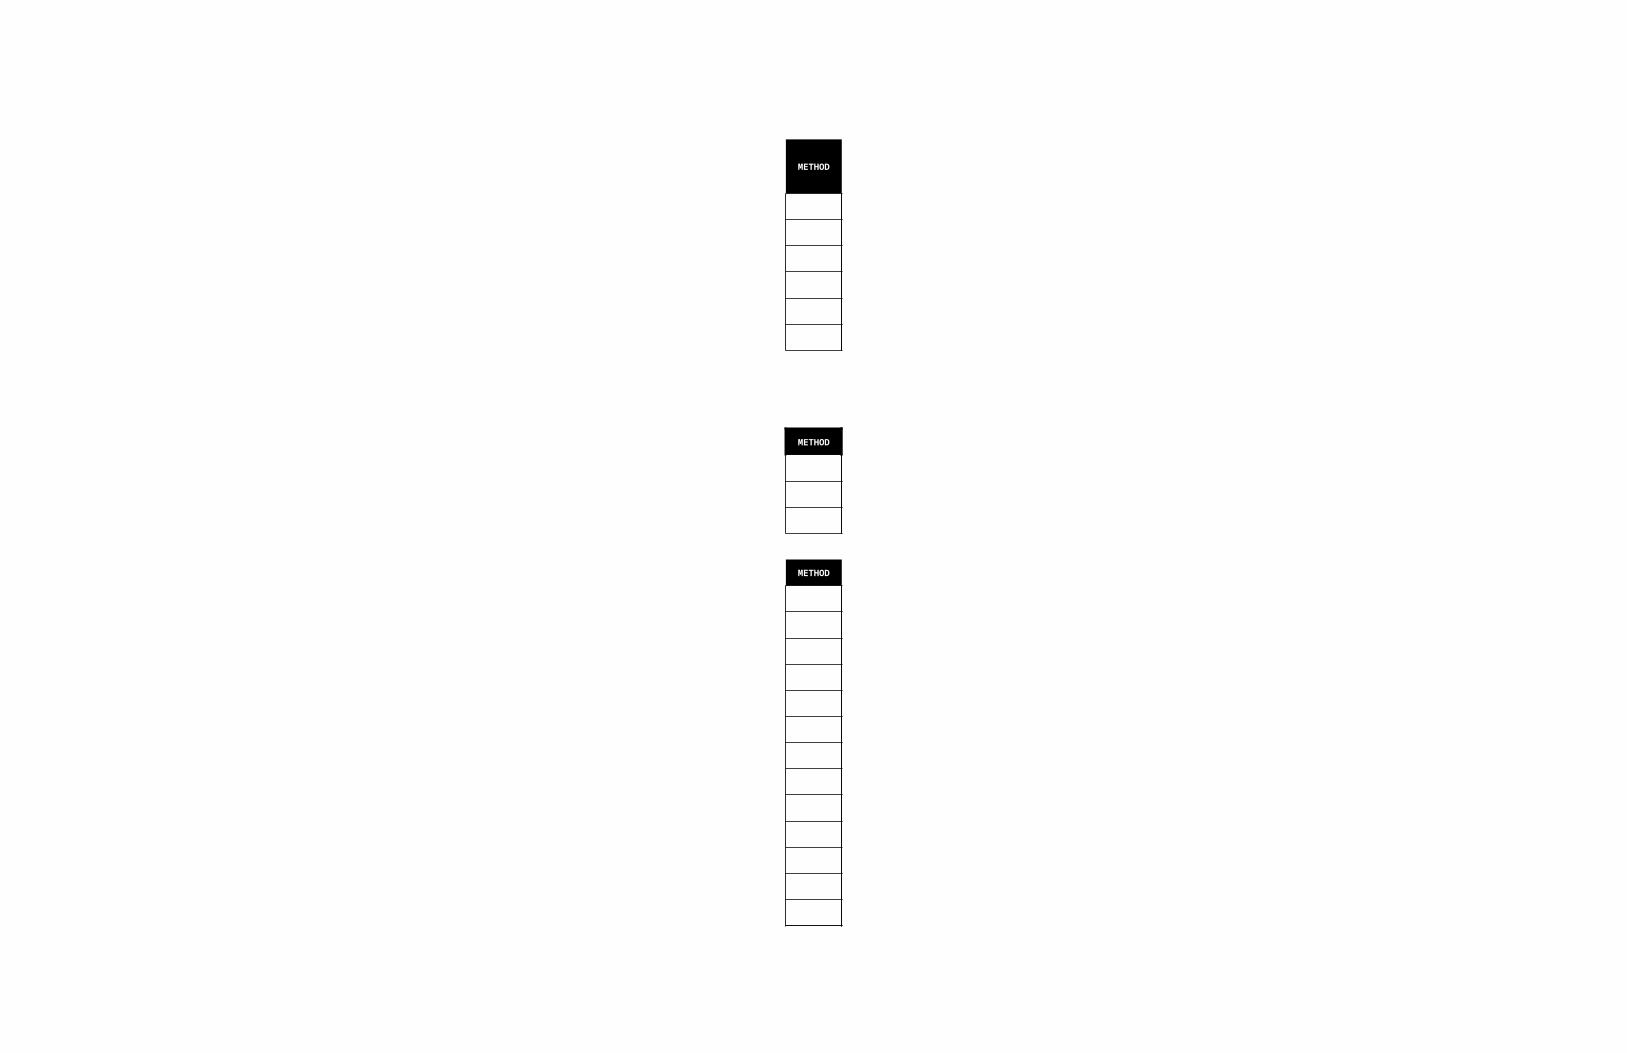
Common Inspection Criteria METHOD
METHOD
1
2 50
3 51
4 52
5 53
6 54
7 55
8
9
10
11 Honda Specific Inspection Criteria METHOD
12 70
13 71
14 72
15
16 METHOD
17 80
18 81
19 82
32 83
84
85
196
86
87
88
89
95
95
General MotorsSpecific Inspection Criteria
Toyota Specific Inspection Criteria
Defect Tally SheetVerification Station:Shift: 1st / 2nd
Date:(circle one) Revised: 5/31/2007
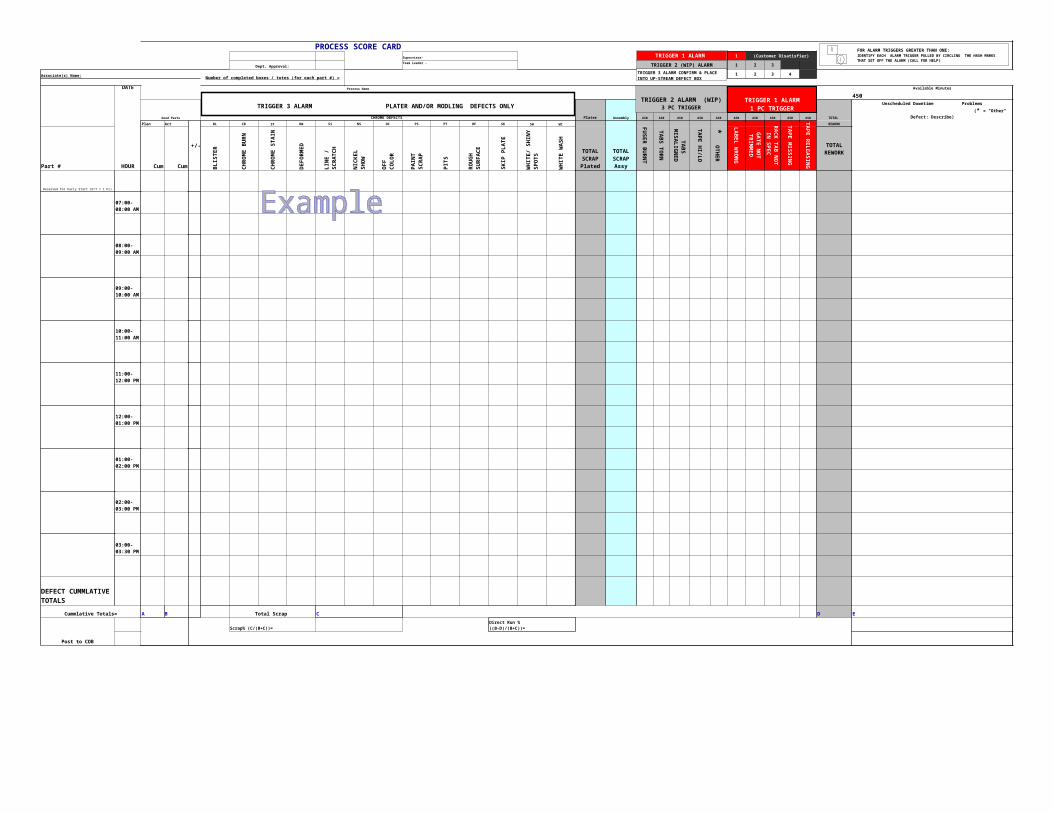
PROCESS SCORE CARDSupervisor-
1 (Customer Disatisfier)
Dept. Approval:Team Leader -
1 2 3
Associate(s) Name: Number of completed boxes / totes (for each part #) =1 2 3 4
DATE Process Name Available Minutes
450
Good Parts CHROME DEFECTS Plater Assembly ASB ASB ASB ASB ASB ASB ASB ASB ASB ASB TOTAL
Plan Act
+/-
BL CB ST DW S1 NS OC PS PT RF SK SH WC FU
SE
R B
UR
NT
TA
BS
TO
RN
TA
PE
HI/L
O
LA
BE
L W
RO
NG
TA
PE
MIS
SIN
G
TA
PE
RE
LE
AS
ING
REWORK
Part # HOUR Cum Cum BL
IST
ER
CH
RO
ME
BU
RN
DE
FO
RM
ED
PA
INT
SC
RA
P
PIT
S
SK
IP P
LA
TE
WH
ITE
WA
SH
Reserved for Early Start (O/T = 1 hr)
Cummlative Totals= A B Total Scrap C D E
Post to COB
Scrap% (C/(B+C))=
Unscheduled Downtime Problems (* = "Other" Defect: Describe)
TA
BS
M
ISA
LIG
NE
D
* OT
HE
R
GA
TE
NO
T
TR
IMM
ED
RA
CK
TA
B N
OT
IN
SP
EC
CH
RO
ME
S
TA
IN
LIN
E /
SC
RA
TC
H
NIC
KE
L
S
HO
W
OF
F
CO
LO
R
RO
UG
H
SU
RF
AC
E
WH
ITE
/ SH
INY
S
PO
TS TOTAL
SCRAP Plated
TOTAL SCRAP
Assy
TOTAL REWORK
07:00-08:00 AM
08:00-09:00 AM
09:00-10:00 AM
10:00-11:00 AM
11:00-12:00 PM
12:00-01:00 PM
01:00-02:00 PM
02:00-03:00 PM
03:00-03:30 PM
DEFECT CUMMLATIVE TOTALS
Direct Run % ((B-D)/(B+C))=
TRIGGER 1 ALARM1 PC TRIGGERTRIGGER 3 ALARM PLATER AND/OR MODLING DEFECTS ONLY
TRIGGER 2 ALARM (WIP)3 PC TRIGGER
TRIGGER 1 ALARM
TRIGGER 2 (WIP) ALARM
TRIGGER 3 ALARM CONFIRM & PLACE INTO UP-STREAM DEFECT BOX
FOR ALARM TRIGGERS GREATER THAN ONE:IDENTIFY EACH ALARM TRIGGER PULLED BY CIRCLING THE HASH MARKS THAT SET OFF THE ALARM (CALL FOR HELP)
IMMEDIATE RESPONSE ACTION SHEET / ALARM SHEET
VERIFICATION STATION: Y / N = Yes /No (circle one for each question, #2 - #5) *S=Supplier, A=Assembly/Build issue
# Serial# Defect Description / Number Time Time
1 6:
2 6:
3 6:
4 6:
5 6:
6 6:
7 6:
8 6:
9 6:
1
0 6:
1
1 6:
1
2 6:
VERIFICATION STATIONS RESPOND(Completed by the Verification Operator)
PRODUCTION RESPONDS(Completed by the responder)
Date/Shift
Product Line
Who Was Called
Escalation Level 1-5
Immediate FixWhat was done with the defective Part?
Corrective Action:1-Identify Point of Cause Station # ?2-Standardized work followed?3-Correct Tools / Fixtures / Error Proofing?4-Correct Parts?5-Parts in spec?6-What did you do to STOP a REPEAT defect from occurring?
*S A
Who Answered
BreakpointCSN #
1-Stat #_________ 2- Y / N 3- Y / N 4- Y / N 5- Y / N
1-Stat #_________ 2- Y / N 3- Y / N 4- Y / N 5- Y / N
1-Stat #_________ 2- Y / N 3- Y / N 4- Y / N 5- Y / N
1-Stat #_________ 2- Y / N 3- Y / N 4- Y / N 5- Y / N
1-Stat #_________ 2- Y / N 3- Y / N 4- Y / N 5- Y / N
1-Stat #_________ 2- Y / N 3- Y / N 4- Y / N 5- Y / N
1-Stat #_________ 2- Y / N 3- Y / N 4- Y / N 5- Y / N
1-Stat #_________ 2- Y / N 3- Y / N 4- Y / N 5- Y / N
1-Stat #_________ 2- Y / N 3- Y / N 4- Y / N 5- Y / N
1-Stat #_________ 2- Y / N 3- Y / N 4- Y / N 5- Y / N
1-Stat #_________ 2- Y / N 3- Y / N 4- Y / N 5- Y / N
1-Stat #_________ 2- Y / N 3- Y / N 4- Y / N 5- Y / N

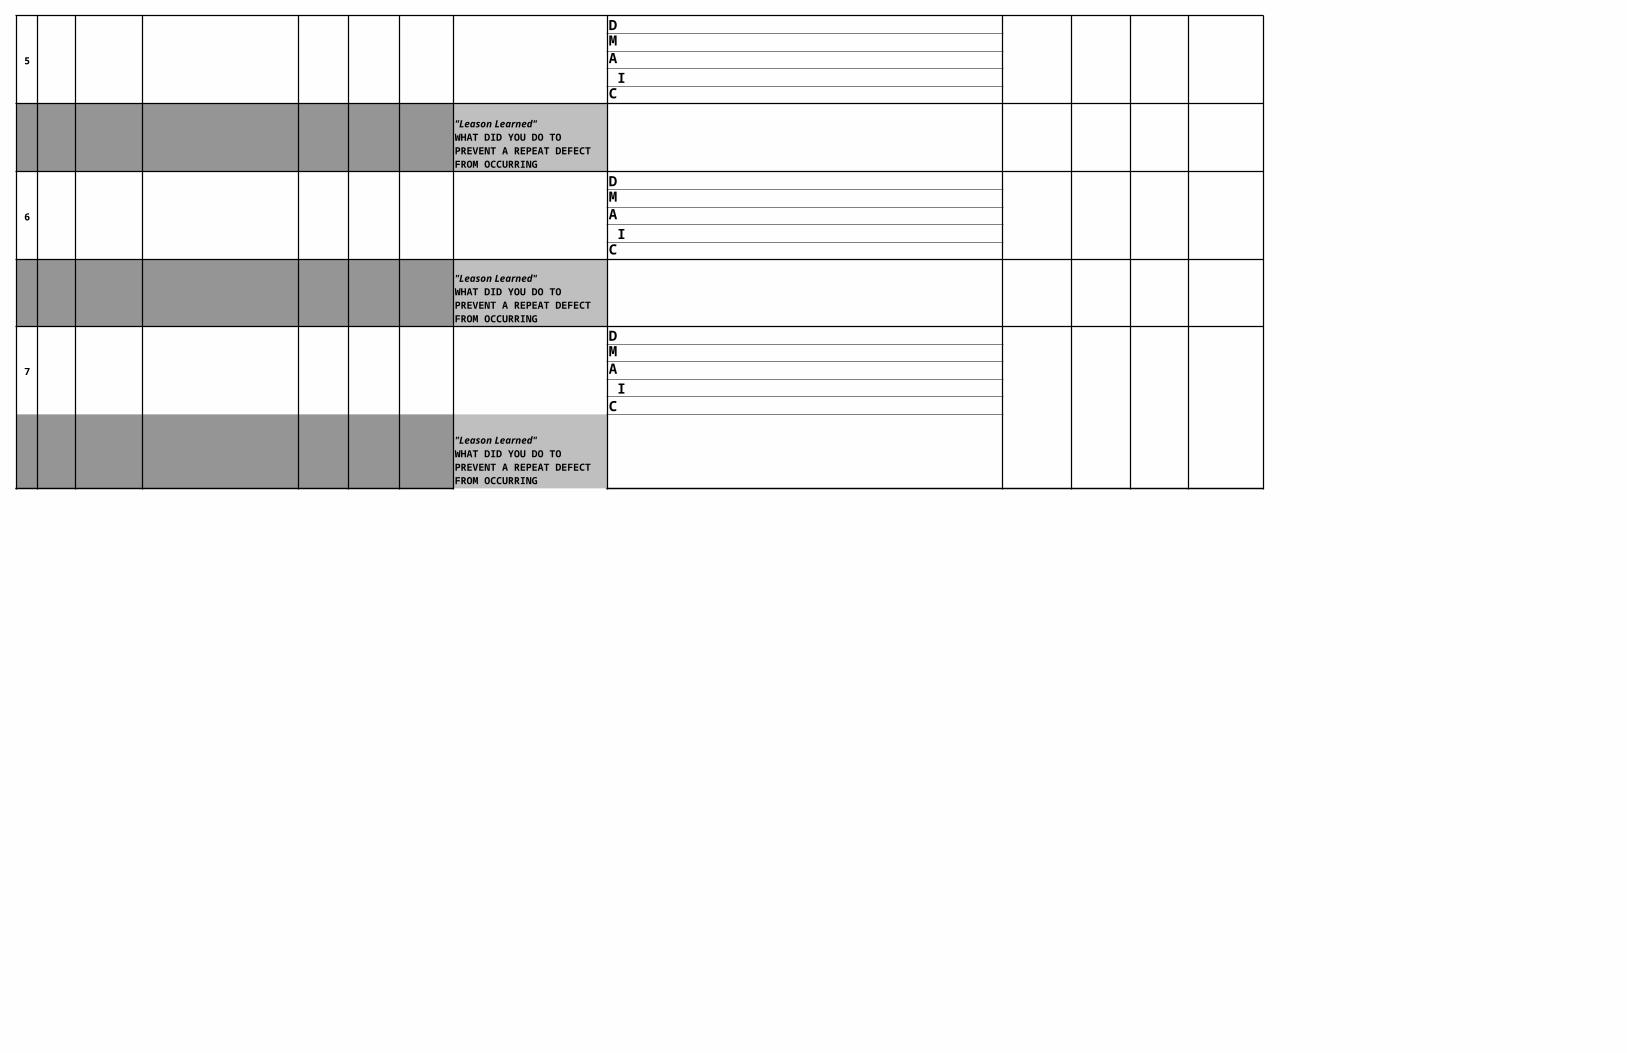
IMMEDIATE RESPONSE ACTION SHEET / ALARM SHEETVerification Station:
# Product Defect Description / Number Time Time
DM
1 A IC
DM
2 A IC
DM
3 A IC
DM
4 A IC
VERIFICATION STATIONS RESPOND(Completed by the Verification Operator)
PRODUCTION RESPONDERS(Completed by the responder)
Date/Shift
Who Was Called
Escalation
Level1-5
Intermediate Action(Containment)
What did you do to contain the defective Part?
Corrective Action:1. Define (What is the problem?)2. Measure (How Many Defects for this Occurrence)3. Analyze (Why did this problem occur?)4. Improve (What are you going to do to fix it?)5. Control (Is the part back into Spec?)
Point of Cause
SupplierMoldPlateAssembly/Build Issue
Who Answered
Breakpoint
When did defect free
material flow begin again
"Lesson Learned"WHAT DID YOU DO TO PREVENT A REPEAT DEFECT FROM OCCURRING
"Lesson Learned"WHAT DID YOU DO TO PREVENT A REPEAT DEFECT FROM OCCURRING
"Lesson Learned"WHAT DID YOU DO TO PREVENT A REPEAT DEFECT FROM OCCURRING
"Lesson Learned"WHAT DID YOU DO TO PREVENT A REPEAT DEFECT FROM OCCURRING
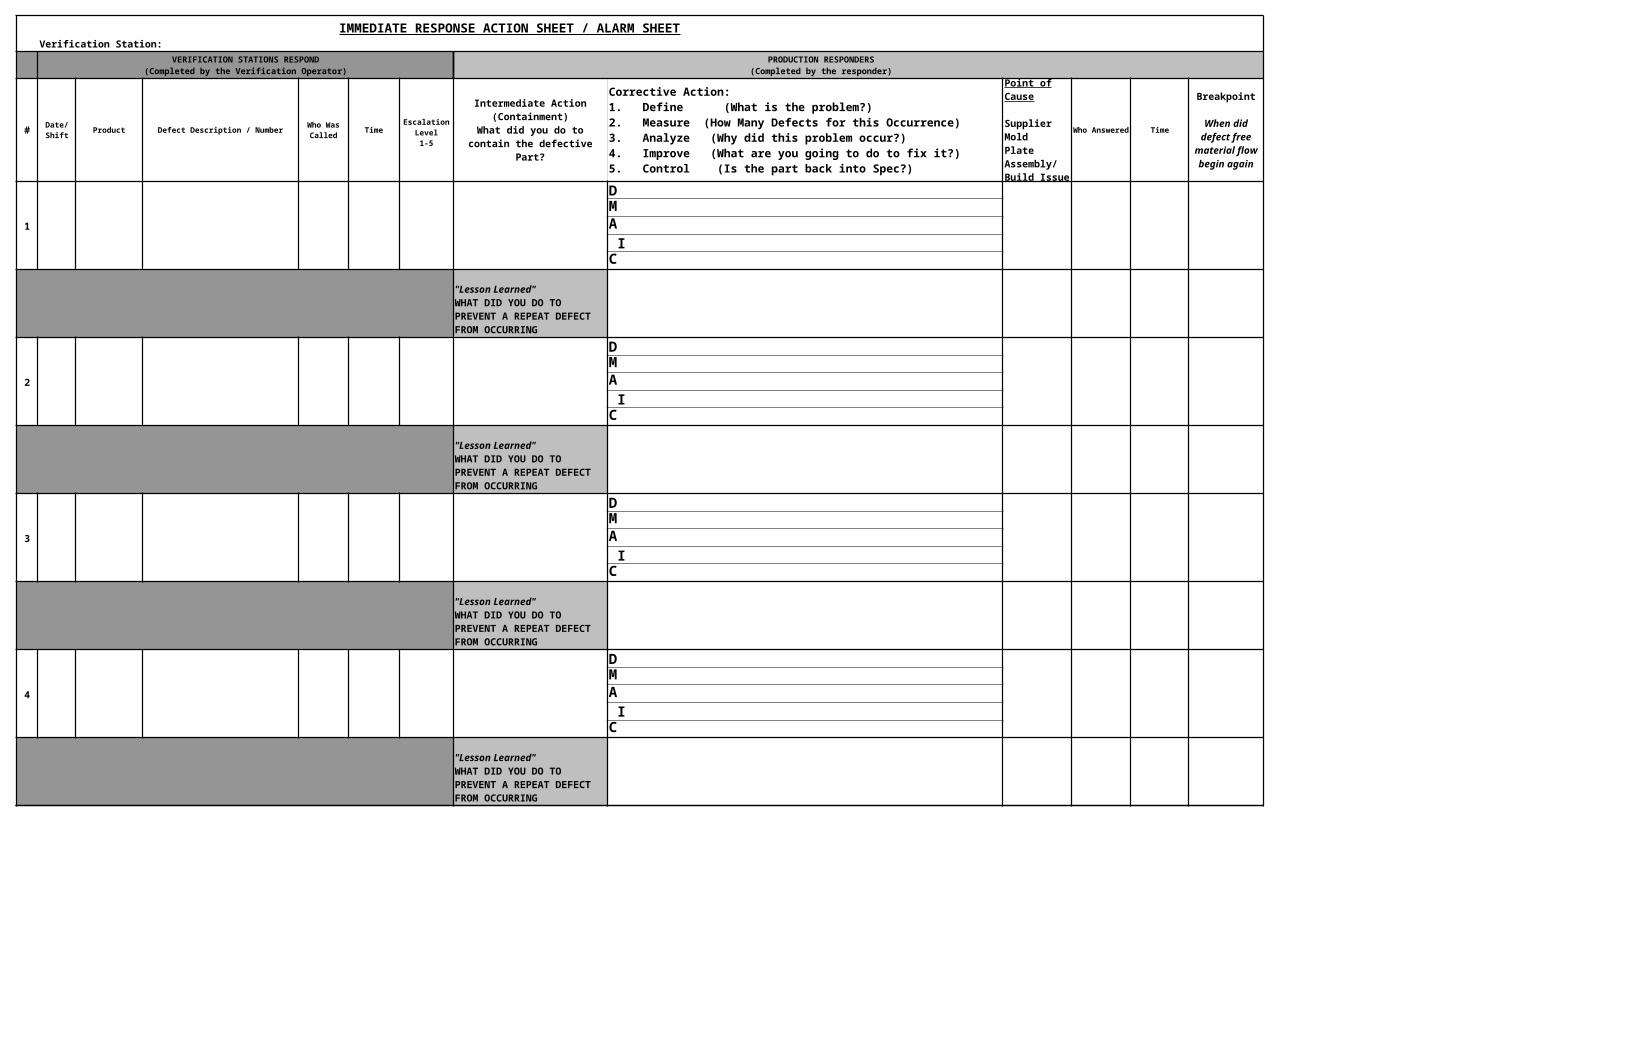
DM
5 A IC
DM
6 A IC
DM
7 A IC
"Leason Learned"WHAT DID YOU DO TO PREVENT A REPEAT DEFECT FROM OCCURRING
"Leason Learned"WHAT DID YOU DO TO PREVENT A REPEAT DEFECT FROM OCCURRING
"Leason Learned"WHAT DID YOU DO TO PREVENT A REPEAT DEFECT FROM OCCURRING
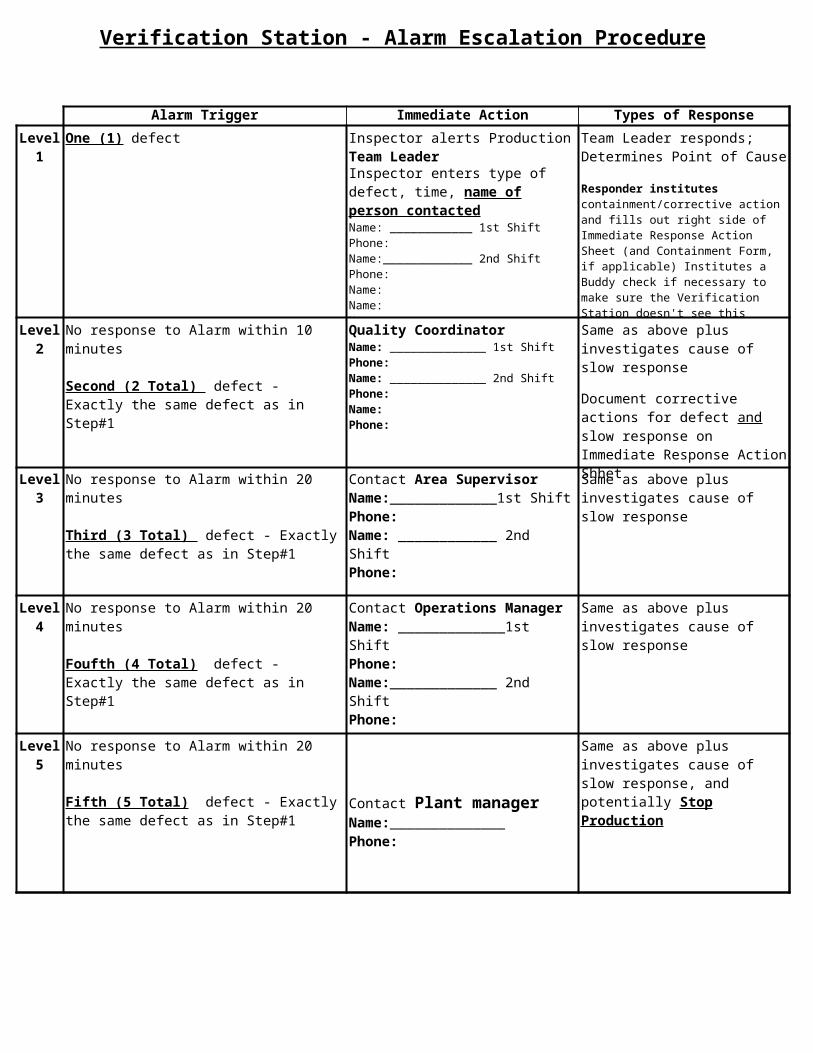
Verification Station - Alarm Escalation Procedure
Alarm Trigger Immediate Action Types of Response
Level 1
One (1) defect Inspector alerts Production Team Leader
Team Leader responds; Determines Point of Cause
Inspector enters type of defect, time, name of person contactedName: ____________ 1st ShiftPhone:Name:_____________ 2nd ShiftPhone: Name:Name: Name:
Responder institutes containment/corrective action and fills out right side of Immediate Response Action Sheet (and Containment Form, if applicable) Institutes a Buddy check if necessary to make sure the Verification Station doesn't see this defect again this shift.
Level 2
No response to Alarm within 10 minutes
Second (2 Total) defect - Exactly the same defect as in Step#1
Quality CoordinatorName: ______________ 1st ShiftPhone:Name: ______________ 2nd ShiftPhone: Name:Phone:
Same as above plus investigates cause of slow response
Document corrective actions for defect and slow response on Immediate Response Action Shhet
Level 3
No response to Alarm within 20 minutes
Third (3 Total) defect - Exactly the same defect as in Step#1
Contact Area SupervisorName:_____________1st ShiftPhone:Name: ____________ 2nd ShiftPhone:
Same as above plus investigates cause of slow response
Level 4
No response to Alarm within 20 minutes
Foufth (4 Total) defect - Exactly the same defect as in Step#1
Contact Operations ManagerName: _____________1st ShiftPhone: Name:_____________ 2nd ShiftPhone:
Same as above plus investigates cause of slow response
Level 5
No response to Alarm within 20 minutes
Fifth (5 Total) defect - Exactly the same defect as in Step#1
Same as above plus investigates cause of slow response, and potentially Stop Production
Contact Plant managerName:______________Phone:
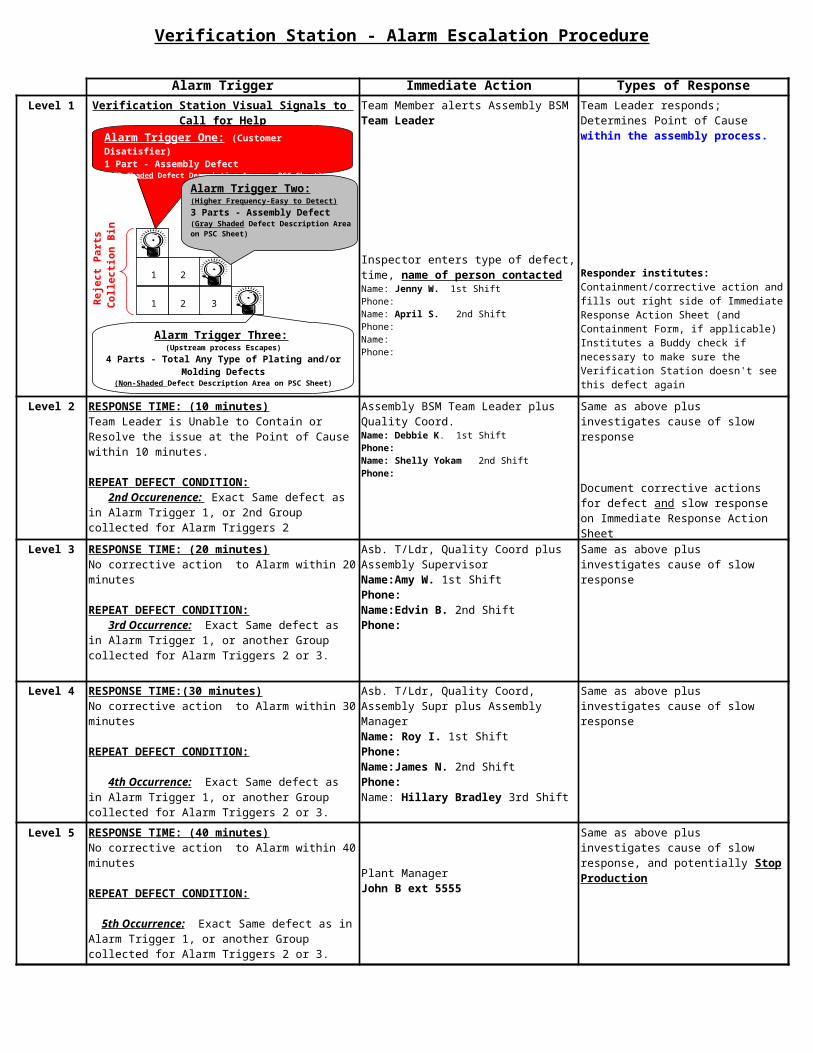
Verification Station - Alarm Escalation Procedure
Alarm Trigger Immediate Action Types of ResponseLevel 1
Level 2
Level 3
Level 4
Level 5
Verification Station Visual Signals to Call for Help
Team Member alerts Assembly BSM Team Leader
Team Leader responds; Determines Point of Cause within the assembly process.
Inspector enters type of defect, time, name of person contactedName: Jenny W. 1st ShiftPhone:Name: April S. 2nd ShiftPhone: Name:Phone:
Responder institutes: Containment/corrective action and fills out right side of Immediate Response Action Sheet (and Containment Form, if applicable) Institutes a Buddy check if necessary to make sure the Verification Station doesn't see this defect again
RESPONSE TIME: (10 minutes)Team Leader is Unable to Contain or Resolve the issue at the Point of Cause within 10 minutes.
REPEAT DEFECT CONDITION: 2nd Occurenence: Exact Same defect as in Alarm Trigger 1, or 2nd Group collected for Alarm Triggers 2
Assembly BSM Team Leader plusQuality Coord.Name: Debbie K. 1st ShiftPhone: Name: Shelly Yokam 2nd ShiftPhone:
Same as above plus investigates cause of slow response
Document corrective actions for defect and slow response on Immediate Response Action Sheet
RESPONSE TIME: (20 minutes)No corrective action to Alarm within 20 minutes
REPEAT DEFECT CONDITION: 3rd Occurrence: Exact Same defect as in Alarm Trigger 1, or another Group collected for Alarm Triggers 2 or 3.
Asb. T/Ldr, Quality Coord plus Assembly SupervisorName:Amy W. 1st ShiftPhone:Name:Edvin B. 2nd ShiftPhone:
Same as above plus investigates cause of slow response
RESPONSE TIME:(30 minutes)No corrective action to Alarm within 30 minutes
REPEAT DEFECT CONDITION:
4th Occurrence: Exact Same defect as in Alarm Trigger 1, or another Group collected for Alarm Triggers 2 or 3.
Asb. T/Ldr, Quality Coord, Assembly Supr plus Assembly ManagerName: Roy I. 1st ShiftPhone: Name:James N. 2nd ShiftPhone: Name: Hillary Bradley 3rd Shift
Same as above plus investigates cause of slow response
RESPONSE TIME: (40 minutes)No corrective action to Alarm within 40 minutes
REPEAT DEFECT CONDITION:
5th Occurrence: Exact Same defect as in Alarm Trigger 1, or another Group collected for Alarm Triggers 2 or 3.
Same as above plus investigates cause of slow response, and potentially Stop Production
Plant ManagerJohn B ext 5555
Alarm Trigger One: (Customer Disatisfier)1 Part - Assembly Defect(RED Shaded Defect Description Area on PSC Sheet)
Re
ject
Pa
rts
C
oll
ect
ion
Bin
1 2 3
1 2
Alarm Trigger Two:(Higher Frequency-Easy to Detect)3 Parts - Assembly Defect(Gray Shaded Defect Description Area on PSC Sheet)
Alarm Trigger Three: (Upstream process Escapes)
4 Parts - Total Any Type of Plating and/or Molding Defects
(Non-Shaded Defect Description Area on PSC Sheet)
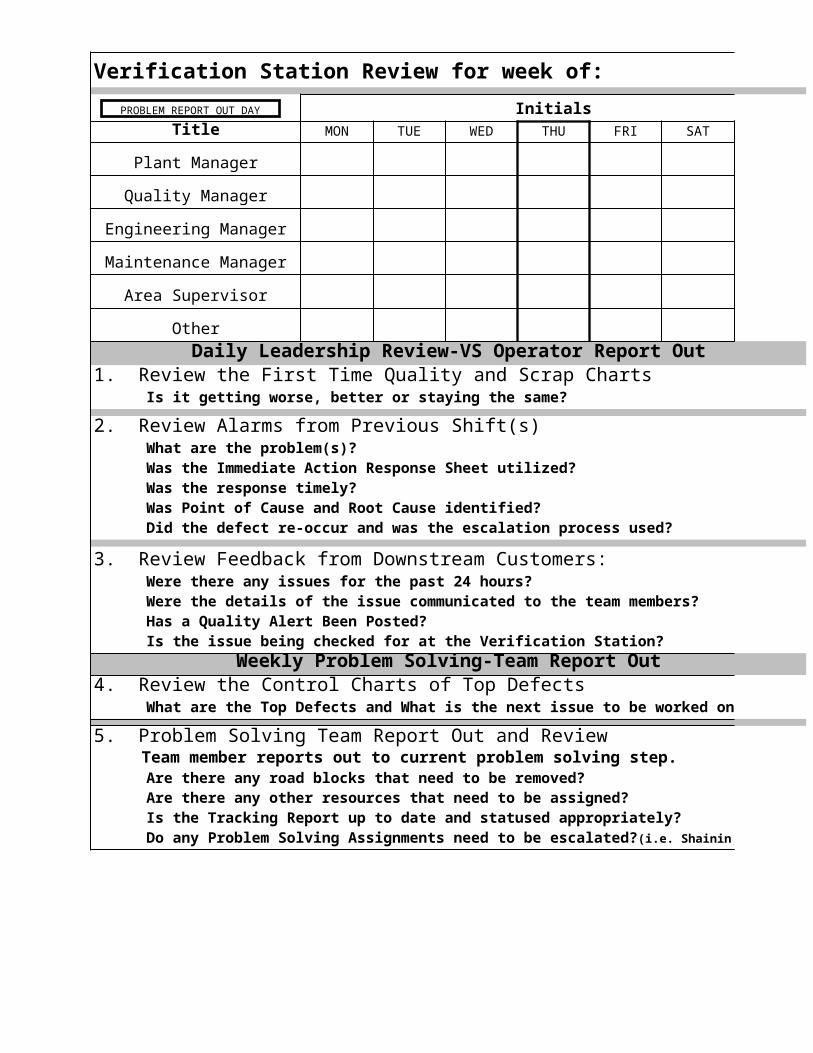
Verification Station Review for week of: Shift:
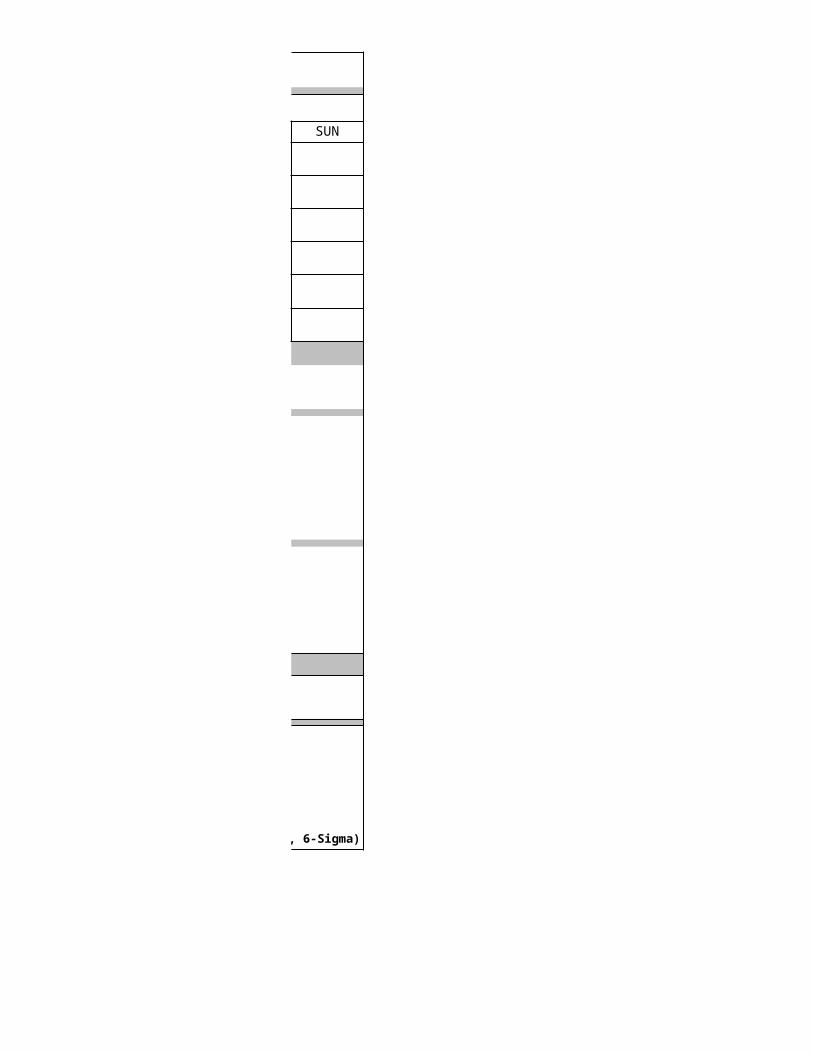
InitialsTitle MON TUE WED THU FRI SAT SUN
Plant Manager
Quality Manager
Engineering Manager
Maintenance Manager
Area Supervisor
Other Daily Leadership Review-VS Operator Report Out
1. Review the First Time Quality and Scrap Charts Is it getting worse, better or staying the same?
2. Review Alarms from Previous Shift(s) What are the problem(s)? Was the Immediate Action Response Sheet utilized? Was the response timely? Was Point of Cause and Root Cause identified? Did the defect re-occur and was the escalation process used?
3. Review Feedback from Downstream Customers: Were there any issues for the past 24 hours? Were the details of the issue communicated to the team members? Has a Quality Alert Been Posted? Is the issue being checked for at the Verification Station?
Weekly Problem Solving-Team Report Out4. Review the Control Charts of Top Defects What are the Top Defects and What is the next issue to be worked on?
5. Problem Solving Team Report Out and Review Team member reports out to current problem solving step. Are there any road blocks that need to be removed? Are there any other resources that need to be assigned? Is the Tracking Report up to date and statused appropriately? Do any Problem Solving Assignments need to be escalated?(i.e. Shainin, 6-Sigma)
PROBLEM REPORT OUT DAY
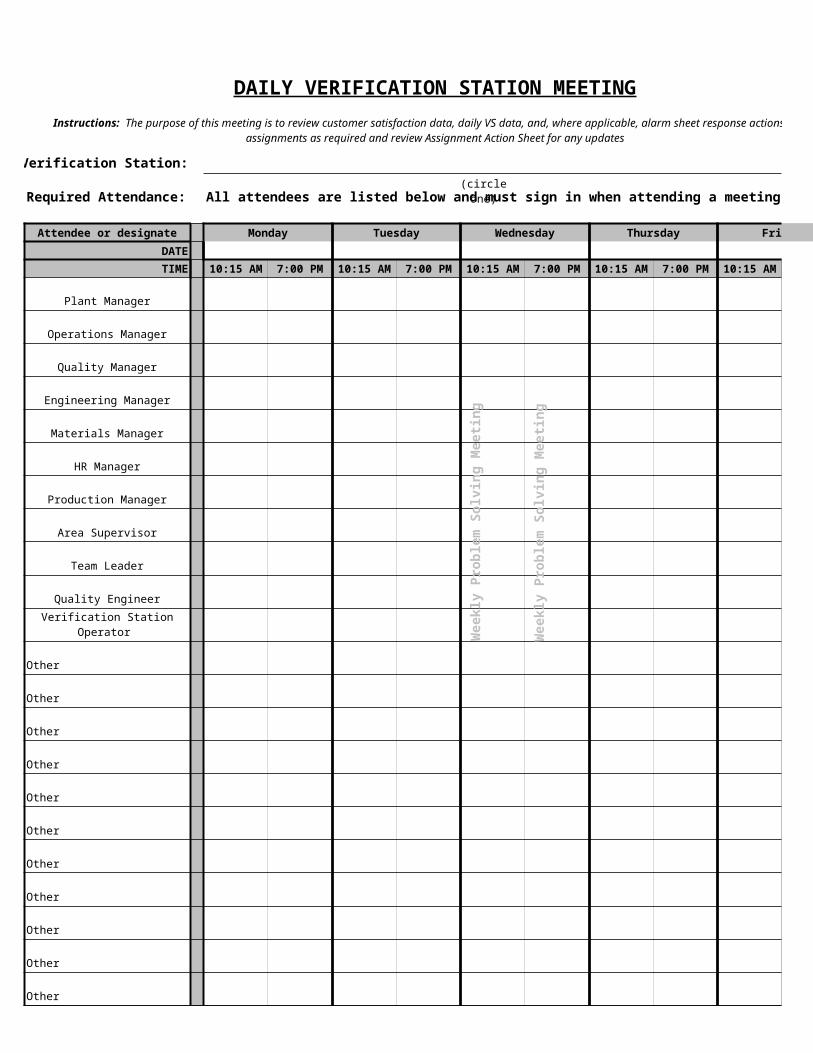
DAILY VERIFICATION STATION MEETING
Verification Station:
Required Attendance: All attendees are listed below and must sign in when attending a meeting
Attendee or designate Monday Tuesday Wednesday Thursday Friday
DATE
TIME 10:15 AM 7:00 PM 10:15 AM 7:00 PM 10:15 AM 7:00 PM 10:15 AM 7:00 PM 10:15 AM 7:00 PM
Plant Manager
Operations Manager
Quality Manager
Engineering Manager
Materials Manager
HR Manager
Production Manager
Area Supervisor
Team Leader
Quality Engineer
Verification Station Operator
Other
Other
Other
Other
Other
Other
Other
Other
Other
Other
Other
Instructions: The purpose of this meeting is to review customer satisfaction data, daily VS data, and, where applicable, alarm sheet response actions. Make assignments as required and review Assignment Action Sheet for any updates
Wee
kly
Pro
ble
m S
olv
ing
Mee
tin
g
Wee
kly
Pro
ble
m S
olv
ing
Mee
tin
g
(circle one)
Other
Shift Assign to Task Name Start Date
Assignment Action Sheet (from daily and /or weekly review)
Expected Completion
Date
Actual Completion
Date

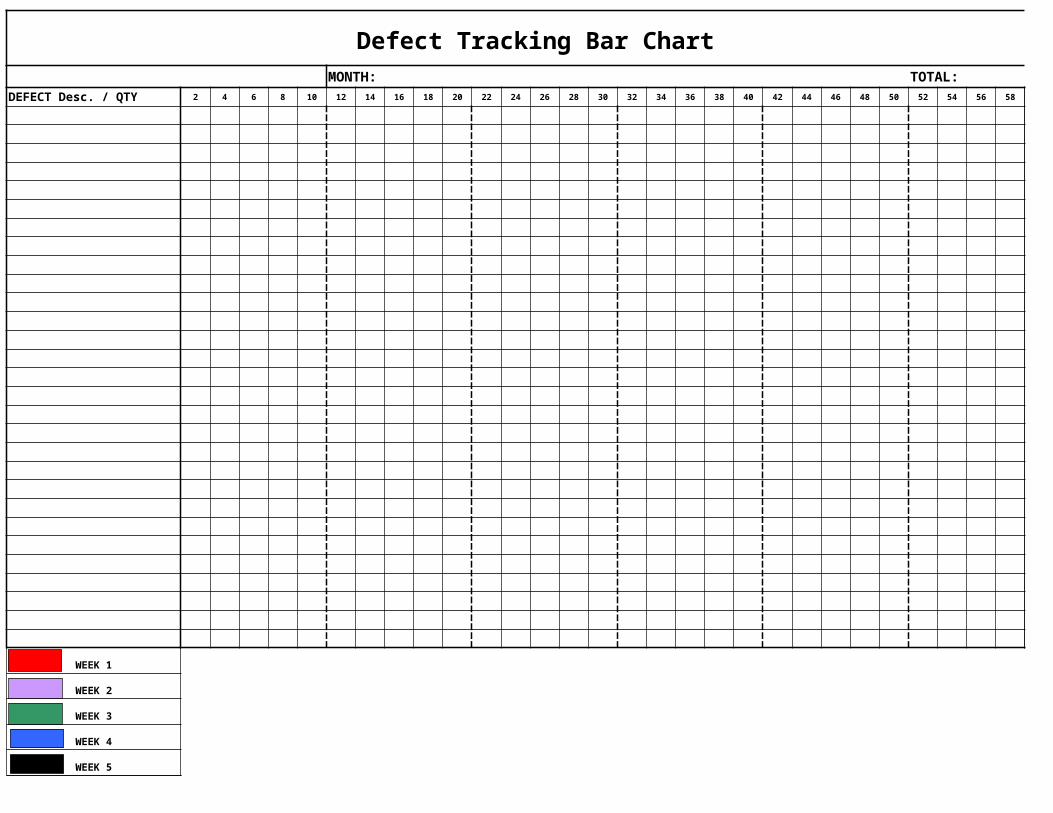
MONTH: TOTAL:
DEFECT Desc. / QTY 2 4 6 8 10 12 14 16 18 20 22 24 26 28 30 32 34 36 38 40 42 44 46 48 50 52 54 56 58 60 62
WEEK 1
WEEK 2
WEEK 3
WEEK 4
WEEK 5
Defect Tracking Bar Chart
This chart is generated on Mondays from data entered for the prior week.
This chart is to be used in conjunction with the weekly problem solving meeting.

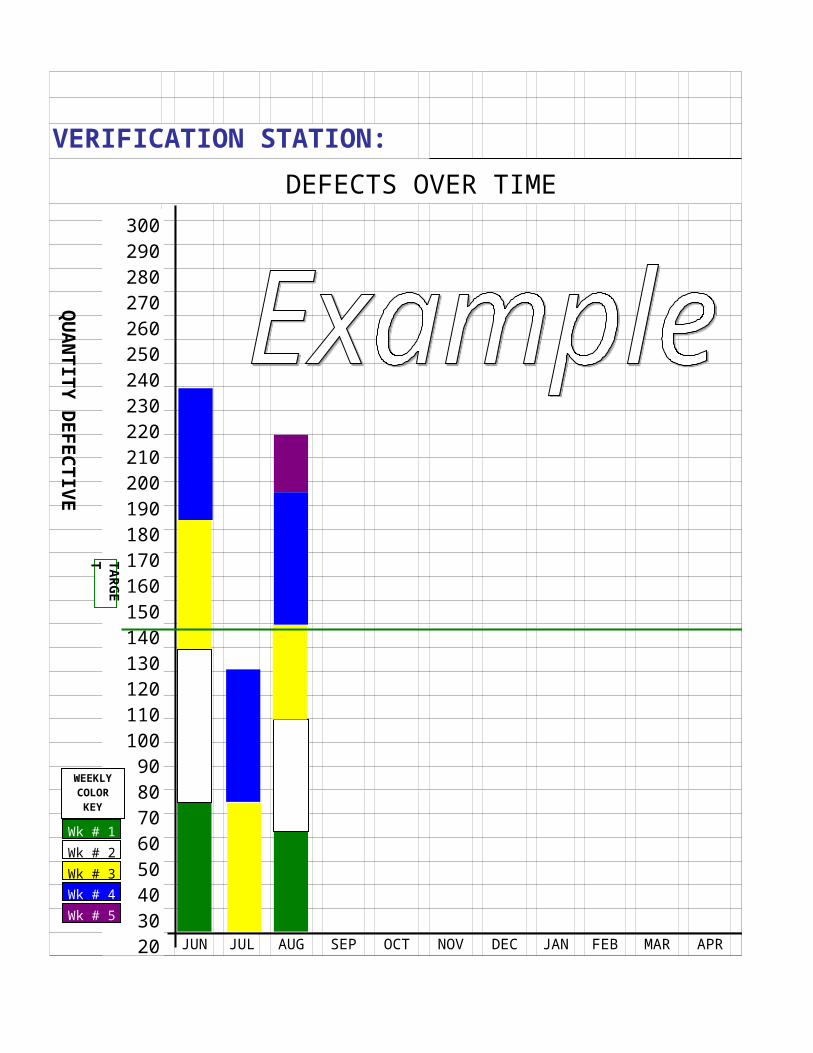
VERIFICATION STATION:
DEFECTS OVER TIME
JUN JUL AUG SEP OCT NOV DEC JAN FEB MAR APR MAY
300290280270260250240230220210200190180170160150140130120110100
908070605040302010
0
QU
AN
TIT
Y D
EF
EC
TIV
E
WEEKLY COLOR
KEY
Wk # 3
Wk # 4
Wk # 1
Wk # 2
Wk # 5
TAR
GE
T

WEEKLY and MONTHLY
300290280270260250240230220210200190180170160150140130120110100
908070605040302010
0
VERIFICATION STATION
DEFECTS OVER TIME
JUN JUL AUG SEP OCT NOV DEC JAN FEB MAR APR MAY
WEEKLY and MONTHLY
300290280270260250240230220210200190180170160150140130120110100
908070605040302010
0
QU
AN
TIT
Y D
EF
EC
TIV
E
WEEKLY COLOR
KEY
Wk # 3
Wk # 4
Wk # 1
Wk # 2
Wk # 5

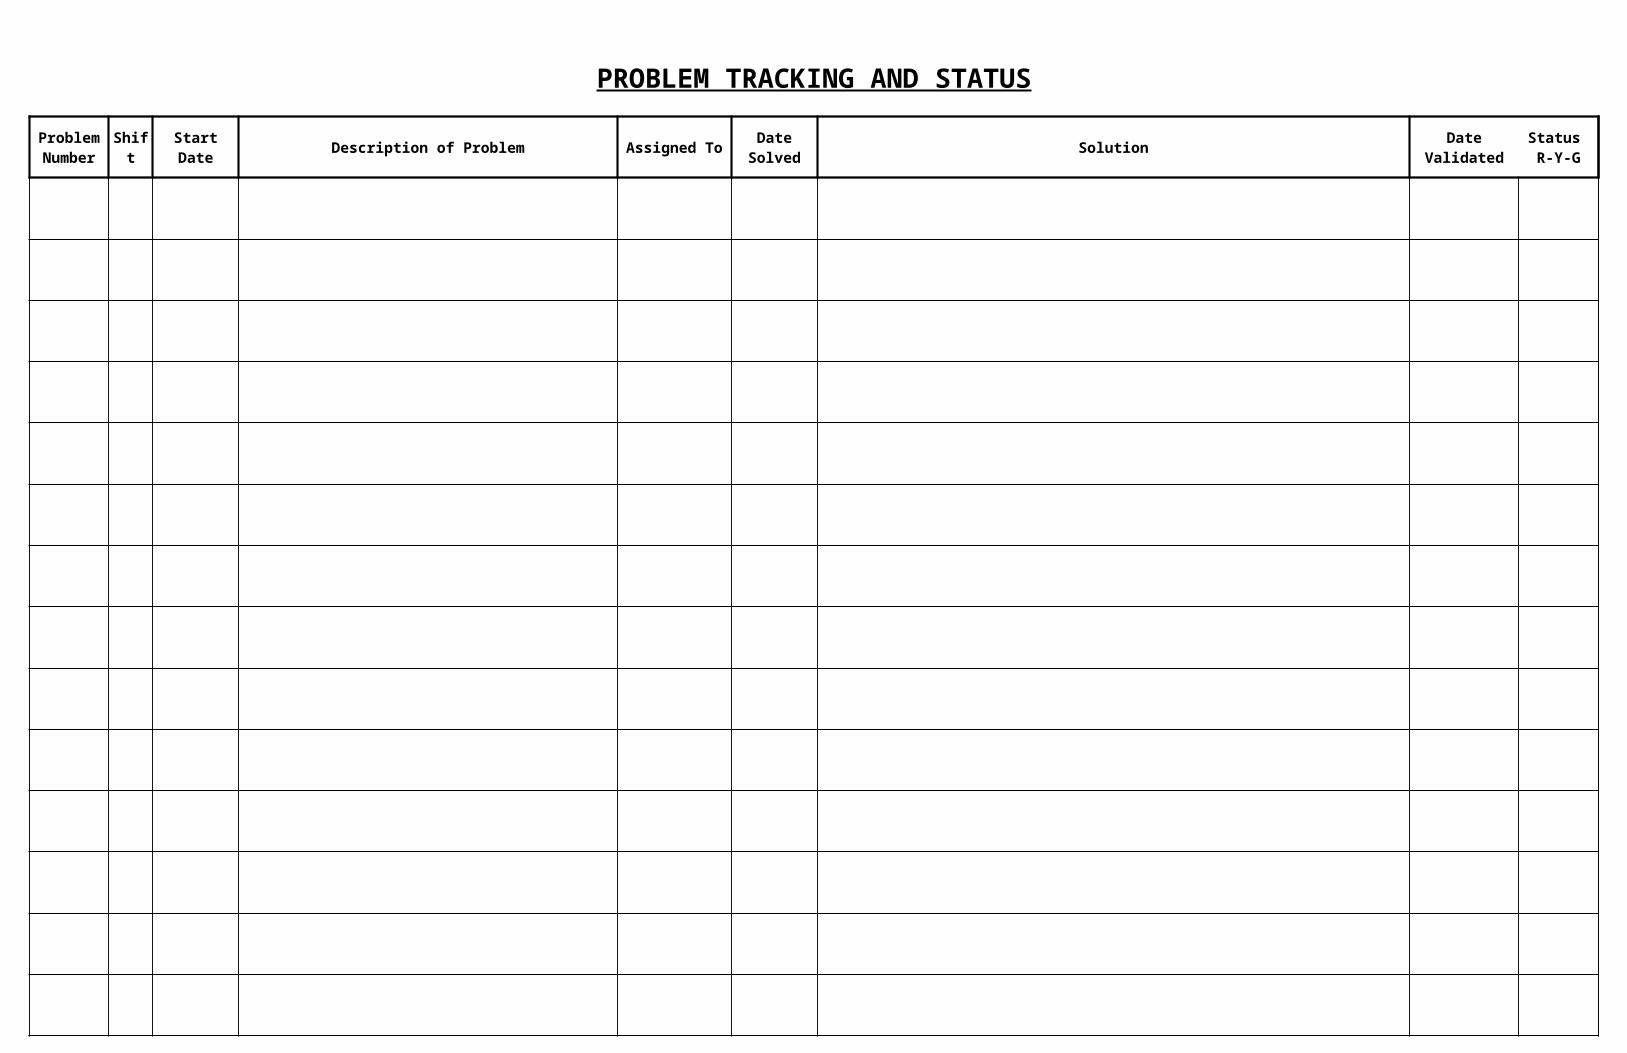
PROBLEM TRACKING AND STATUS
Shift Start Date Description of Problem Assigned To SolutionProblem Number
Date Solved
Date Validated
Status R-Y-G

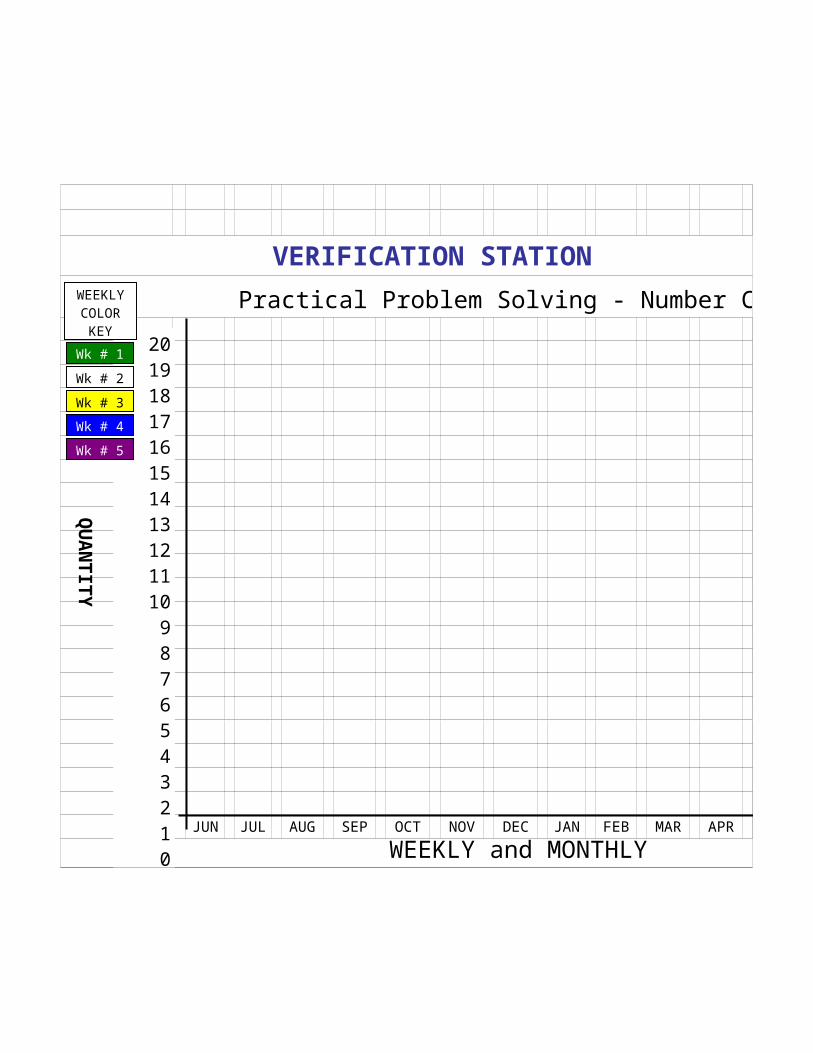
VERIFICATION STATION
Practical Problem Solving - Number Closed
JUN JUL AUG SEP OCT NOV DEC JAN FEB MAR APR MAY
WEEKLY and MONTHLY
2019181716151413121110
9876543210
QU
AN
TIT
Y
WEEKLY COLOR
KEY
Wk # 3
Wk # 4
Wk # 1
Wk # 2
Wk # 5
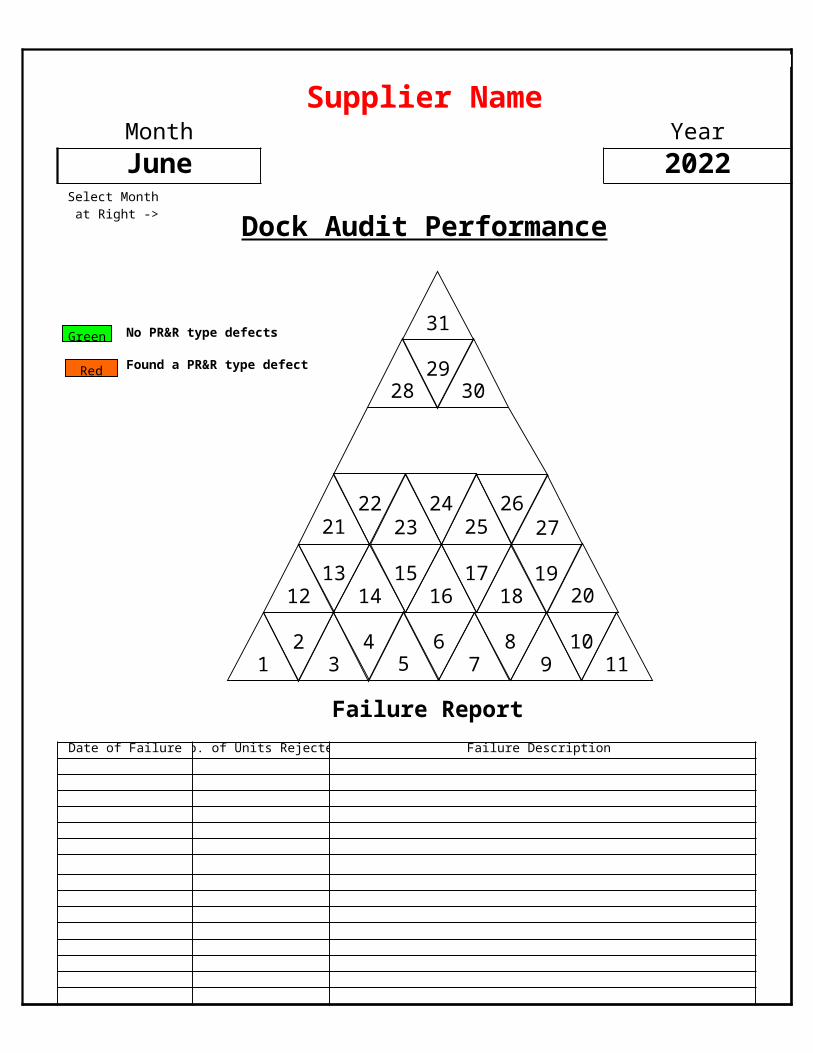
Supplier NameMonth Year
June 20236
Dock Audit Performance
No PR&R type defects
Found a PR&R type defect
Failure Report
Date of Failure No. of Units Rejected Failure Description
31
2928 30
2122
2324
2526
27
1213
1415
1617
1819
20
23
45
67
89
10111
Green
Red
Select Month at Right ->

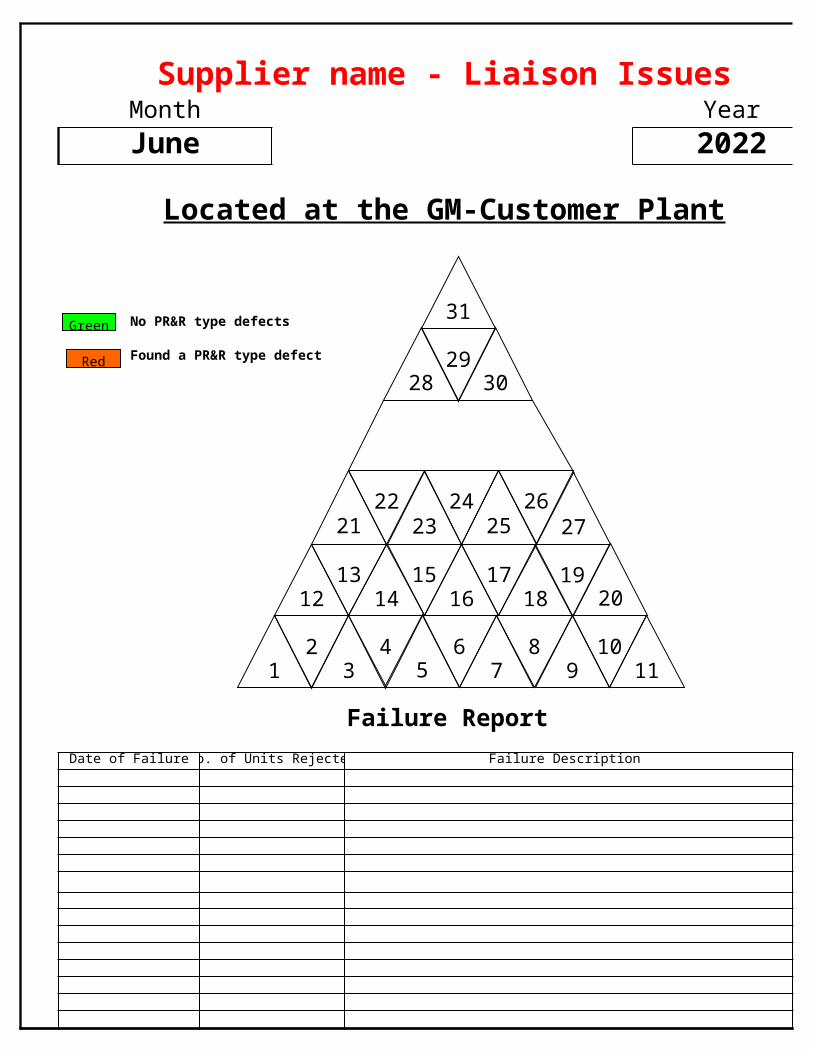
Supplier name - Liaison IssuesMonth Year
June 2023
Located at the GM-Customer Plant
No PR&R type defects
Found a PR&R type defect
Failure Report
Date of Failure No. of Units Rejected Failure Description
31
2928 30
2122
2324
2526
27
1213
1415
1617
1819
20
23
45
67
89
10111
Green
Red

GM-Customer PR&RMonth Year
June 2023
LEGEND:
No PR&Rs
Customer Quality Disruption(eg. PRR, Pull, Spill)
31
2928 30
2122
2324
2526
27
1213
1415
1617
1819
20
23
45
67
89
10111
Green
Red

CURRENT MONTH
No Customer Complaint
s

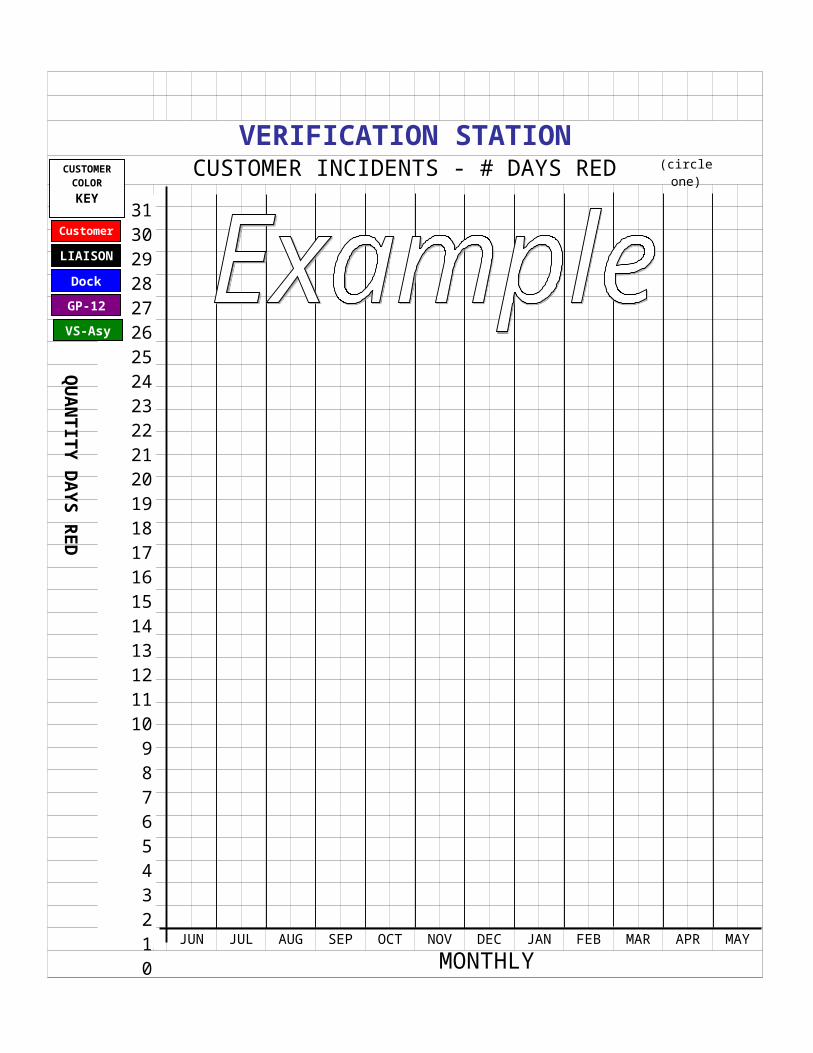
VERIFICATION STATIONCUSTOMER INCIDENTS - # DAYS RED
JUN JUL AUG SEP OCT NOV DEC JAN FEB MAR APR MAY
MONTHLY
31302928272625242322212019181716151413121110
9876543210
QU
AN
TIT
Y D
AY
S R
ED
(circle one)CUSTOMER COLORKEY
Dock AuditGP-12
Customer
LIAISON
VS-Asy
CUSTOMER INCIDENTS - # DAYS RED
VERIFICATION STATION: Model Line/Vision Area
31302928272625242322212019181716151413121110
9876543210
QU
AN
TIT
Y D
AY
S R
ED
CUSTOMER COLOR
KEY
Dock Audit
GP-12
Customer
LIAISON
(circle one)
JUN JUL AUG SEP OCT NOV DEC JAN FEB MAR APR MAY
MONTHLY
31302928272625242322212019181716151413121110
9876543210
Model Line/Vision Area
MAY
MONTHLY
Side #2Instrument Panel
Verification Station
TEAM PROBLEM SOLVING
Q-1 Instrument Panel
Verification StationProblem Solving
Side #2
Q-1 Instrument Panel
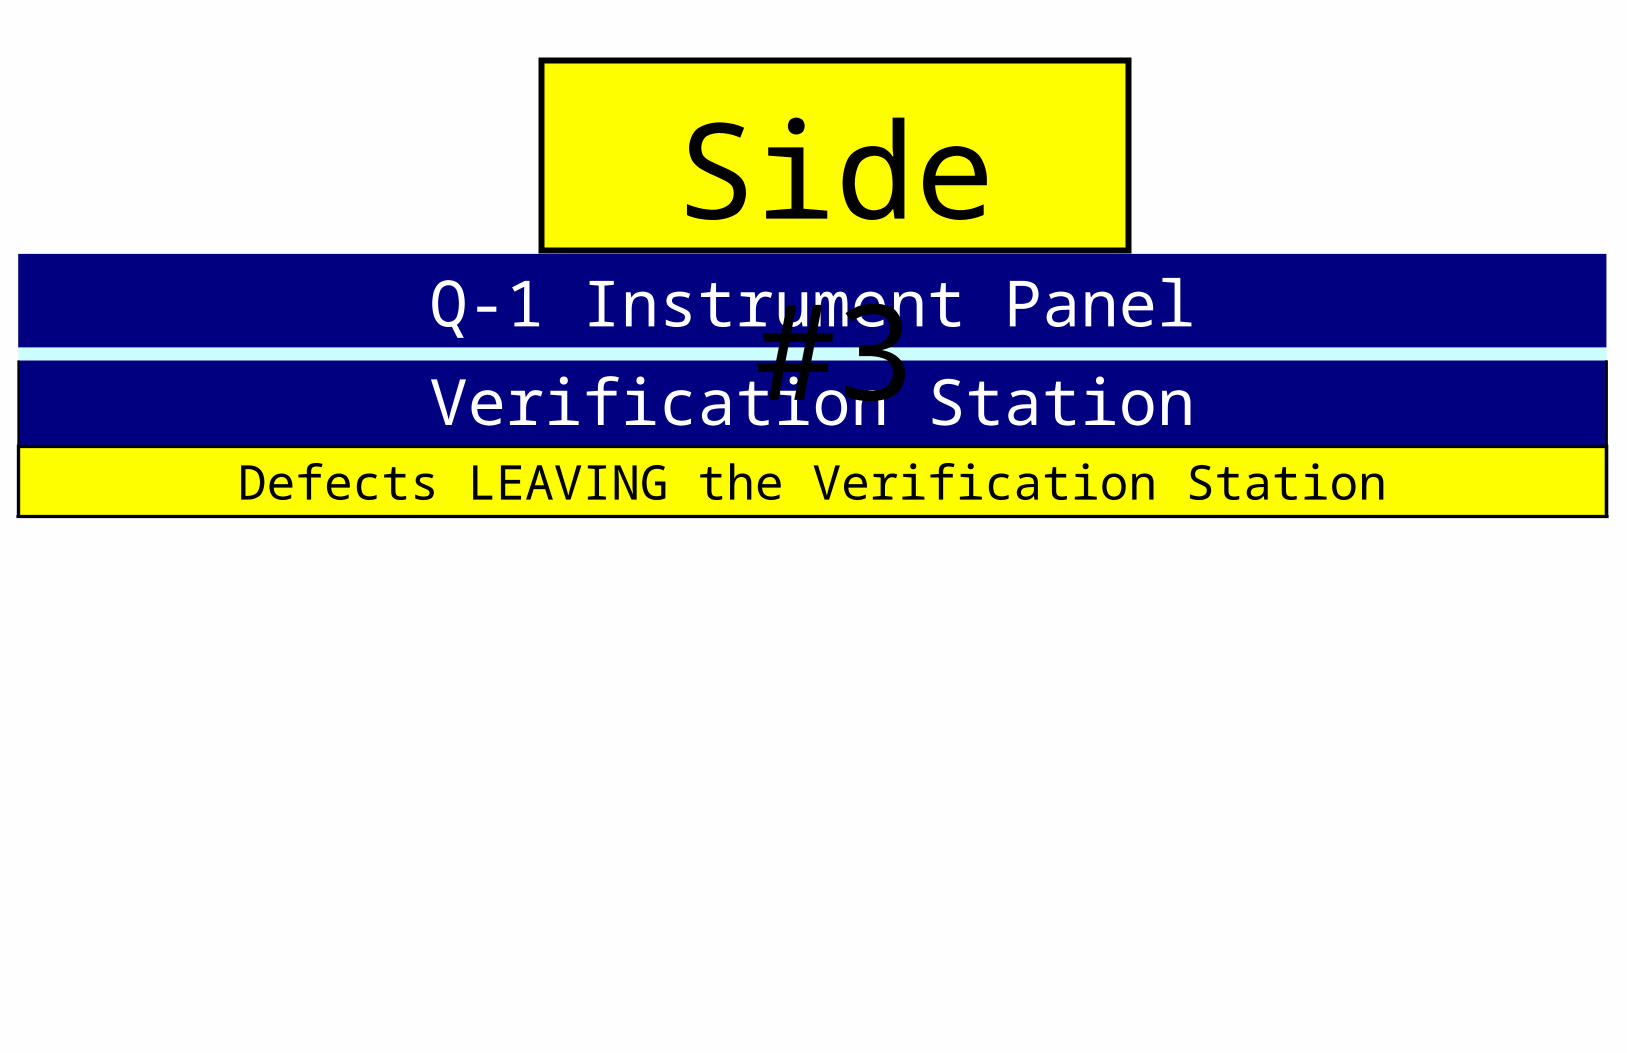
Verification StationDefects LEAVING the Verification Station
Side #3

Defect Tally Sheet
Alarm Escalation Procedure
Immediate Response Action Sheet
Daily Meeting Sign-in
Weekly Problem Solving Meeting Sign-in
Meeting Assignment Log/Tracking
Weekly & Monthly: Defects Over Time
Weekly Pareto-Top 5 Defects

1st Shift Problem Solving
2nd Shift Problem Solving
1st Report Card - Q-Final
2nd Report Card - Liaison (Night Letter)
Problem Solving Tracking
FTQ (First Time Quality) Trend Charts (over time)
FINAL Report Card - LGR (GM-Customer) PR&Rs
Scrap Trend Chart (over time)
Current PR&R LIAISON REPORT

Current PR&R LIAISON REPORT
PPSR's Closure Chart
PPSR's Closure Chart
Customer Incidents - Trend Chart
Customer Incidents - Trend Chart

PPSR's Completed
PPSR's Completed
PPSR's Completed
PPSR's Completed
1st Report Card - Q-2
3rd Report Card - Liaison Report
2nd Report Card - Q-FINAL

- CHART MARKERS -
GREEN
YELLOW
RED
BLUE
PURPLE
LIAISON REPORT
FAST RESPONSE ATTENDANCE
SIGN-IN SHEET

Blank Forms Drawer Labels
VERIFICATION STATION
- BLANK FORMS -
Defect Tally Sheet Immediate Resp./Action
Daily VS Sign-In Meeting AssignmentSheet
Practical Problem Solving Report
Weekly VS Meeting Sign-In
Problem Tracking &Status
PPSR Closure Chart
MONTHLY REPORTCARDS
CUSTOMER INCIDENTSTREND CHART

COMPLETED FORMS LABELS
VERIFICATION STATION
COMPLETED FORMS
Defect Tally Sheet- 1st Shift -
Immediate Resp./Action- 1st Shift -
Defect Tally Sheet- 2nd Shift -
Immediate Resp./Action- 2nd Shift -
Daily VS Meeting Sign-in Daily Meeting AssignmentSheet
Weekly Pareto TOP 5 Defects Charts
Defects Over TimeMonthly Trend Charts
Practical Problem Solving Reports
- 1st Shift -
Practical Problem Solving Reports
- 2nd Shift -
MONTHLY REPORTCARDS
CUSTOMER INCIDENTSTREND CHART
MONTHLY REPORTCARDS
CUSTOMER INCIDENTSTREND CHART