Embed Size (px)
Citation preview
1
Paper 010-2008
Creating Web Services Using SAS® Analytics Brad Klenz, SAS Institute Inc., Cary, NC Dan Jahn, SAS Institute Inc., Cary, NC
ABSTRACT Many companies are deploying applications using a Service Oriented Architecture (SOA). This architecture allows applications and components that are developed independently to interoperate. Deploying analytic capabilities within this architecture as a service is particularly beneficial for these reasons:
• Analytic services are usually developed independently from the applications that use them. • Analytic services might be developed by a separate team from the applications developers. • Many applications might need the same analytic service, and this architecture permits them to do so. • The use of analytics must be consistent between applications to yield consistent results, and this
architecture promotes consistency. SAS 9.2 has excellent capabilities to create Web services which surface SAS analytics. Using Web Services standards ensures that these services are open for use to all applications in an SOA. This paper provides instructions on how to build analytic Web services using SAS. Three example services will be outlined:
• A basic analytics service. In this example, input data is passed in the request to the service and output results are returned directly within the response.
• A service with large input data. Many times a request for analysis will need a large amount of input data.
This data is too large to pass directly in the service request. This example will present designs for large input data.
• A service with a complex result set. The results of an analytic service might need to return a fairly complex
result set. An application might desire a simple result (e.g., a sales forecast number), but the service would also need to return additional information to provide context to the result. This information might include a confidence interval, a model fit statistic, or a measure of input data quality. Another example is where the service must return a large number of results that are related, and must be used together.
Note: A zip file with code examples from this paper will also be available at the following website: http://support.sas.com/saspresents
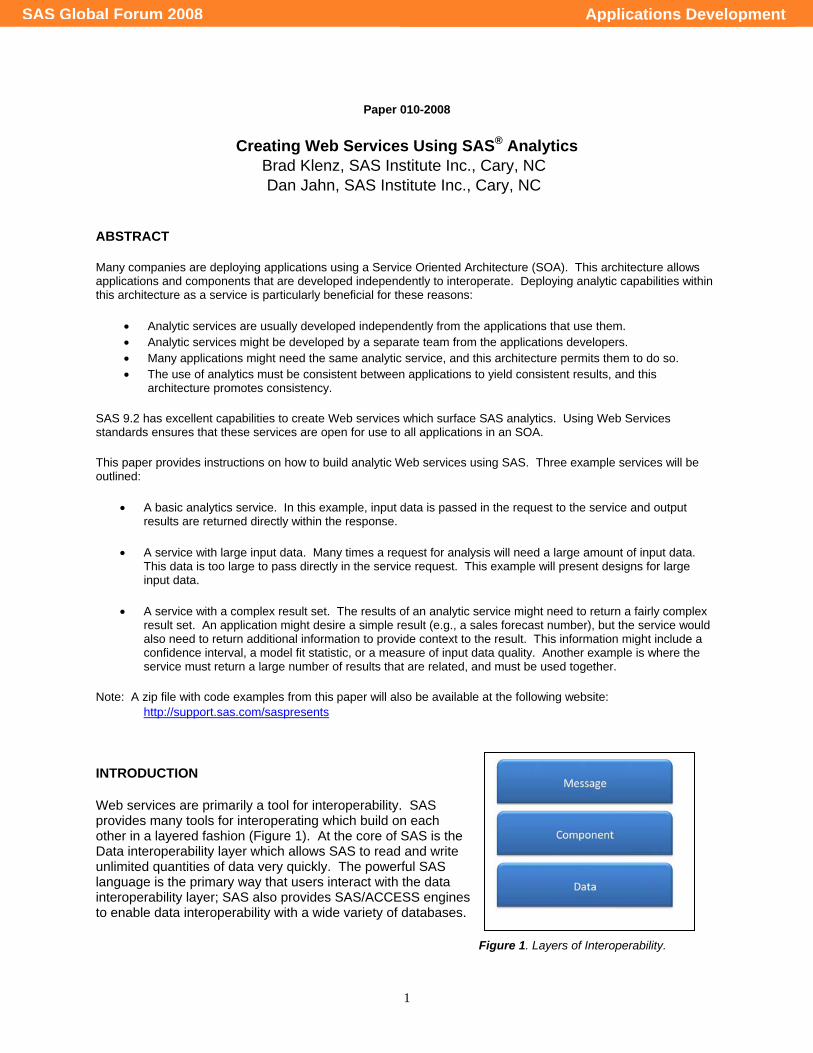
INTRODUCTION Web services are primarily a tool for interoperability. SAS provides many tools for interoperating which build on each other in a layered fashion (Figure 1). At the core of SAS is the Data interoperability layer which allows SAS to read and write unlimited quantities of data very quickly. The powerful SAS language is the primary way that users interact with the data interoperability layer; SAS also provides SAS/ACCESS engines to enable data interoperability with a wide variety of databases.
Figure 1. Layers of Interoperability.
Applications DevelopmentSAS Global Forum 2008
2
Built on the data layer is the component interoperability layer. One of the most popular components is IOM, which provides interoperability with COM, .Net, and Java components. Built on the component interoperability layer are technologies that enable SAS to interoperate with message-based communication channels. A Web service is one messaging technology. SAS 9.1 introduced SAS BI Web Services allowing SAS to be called as a Web service. In SAS 9.2, SAS BI Web services have been greatly enhanced. Note that the existence of the highly interoperable message layer does not reduce the need for the lower layers. There is a trade-off in these layers of interoperability: as you go lower in the stack, you can move more data more quickly; as you move higher, it becomes easier to interoperate with other applications. SAS BI Web services expose SAS stored processes as Web services, making it easy for other applications to call SAS code. A Web service is described by a WSDL (Web Service Description Language is an XML file that describes the set of operations that a service contains as well as the inputs and outputs of each operation). The features of SAS BI Web services include:
• Services are generated by administrators using the “Deploy as Web Service” action in the SAS Management Console Folder View.
• Any stored process can be used in a Web service. A Web service can contain any number of stored processes, each in its own operation. The same stored process can be used in multiple Web services.
• Input parameters (also called prompts) and output parameters cause corresponding entries to get added to the WSDL that gets generated for the service. The following section demonstrates the use of parameters.
• Attachments can be used for binary information. Under JBoss and Microsoft IIS, the “Message Transmission Optimization Mechanism” (MTOM) attachment standard is used. Under BEA WebLogic and IBM WebSphere the “SOAP Messages with Attachments” (SWA) standard is used. This is commonly used for ODS output from SAS. For analytic Web services, attachments provide an excellent way to obtain the complex graphical output. This is demonstrated in Working with complex result sets at the end of this paper. There are three ways to return attachments from a stored process: define the output as a ”Package” (this is the easiest way for the service author to get ODS output returned to the client); define the output as ”Streaming” (the Stored Process author must then write output to the _WEBOUT fileref); or define a generic data target (the stored process author must write output to the fileref whose name matches the data target.)
• Custom XML schemas (XSD) can be used to describe the inputs and outputs of a stored process. These schemas are exposed to Web service clients in the WSDL. This is demonstrated in WORKING WITH COMPLEX RESULT SETS.
• When a service needs to access large amounts of data, it is recommended that you pass a reference to the data instead of the data through the Web service. This technique is demonstrated in WORKING WITH LARGE INPUT DATA.
• Support for Contract-First development. Contract-First service development means you design the messages that a service uses first; then adopt those messages to operations. Code-First service development means you view Web service messages in the same way that a programming language views parameters for a function call. Web services that use simple messages tend to use Code-First Web services, while more complex messages tend to come from Contract-First design. SAS 9.2 supports the creation of Web services using either of these approaches.
SAS BI Web services are a part of the Integration Technologies product which runs on the middle (Web) tier. Your SAS code might also need to use SAS/STAT SAS/ETS, SAS/OR, or SAS/QC software for the necessary analytic functionality.
Applications DevelopmentSAS Global Forum 2008
3
A BASIC SAS ANALYTICS WEB SERVICE
CALCULATING A CORRELATION COEFFICIENT BETWEEN TWO VARIABLES There are many analytic functions that can be implemented as basic Web services. These analytic functions accept a set of input parameters and a small amount of input data. The output of these analytic functions is a result value and some supporting statistics or measurements. One example is an analytic function to calculate the correlation coefficient between to variables over a number of observations. If we take this function and create a basic Web service, we will illustrate these common tasks:
• how the service is requested • how parameter values are supplied to the service • how a small amount of input data is supplied to the service • the programming template to perform the analysis in the service • how to format the results from the analysis • how to return the results to the calling application
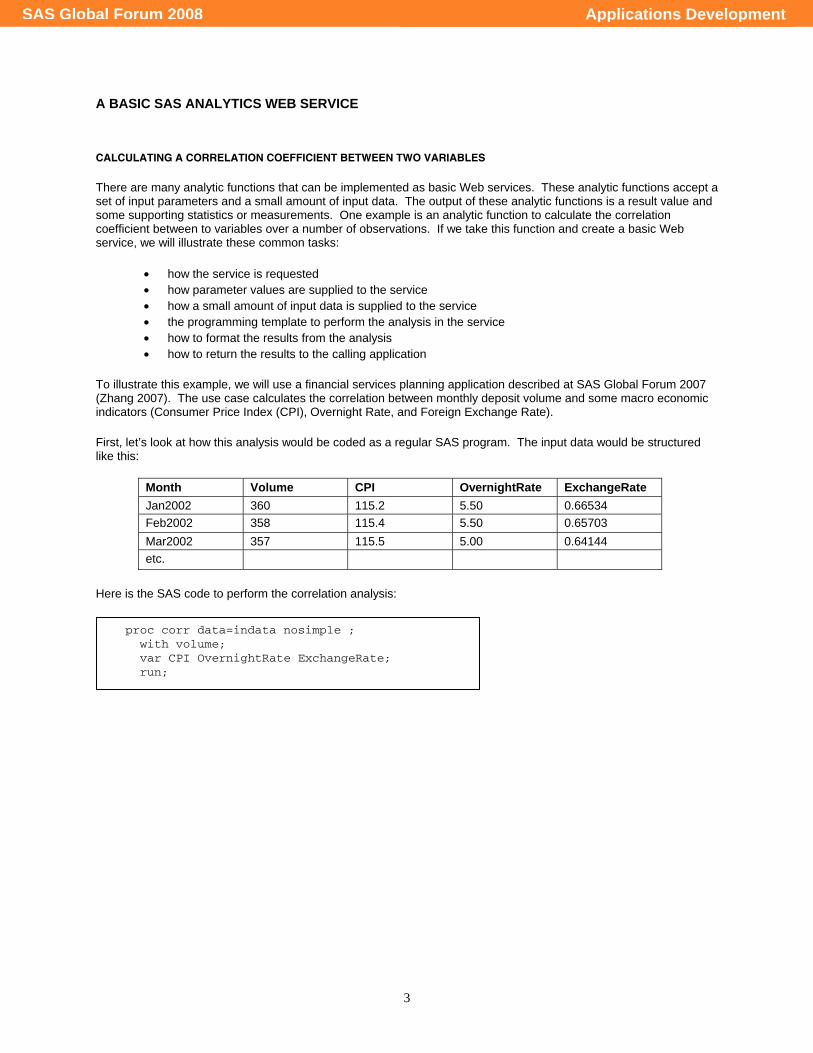
To illustrate this example, we will use a financial services planning application described at SAS Global Forum 2007 (Zhang 2007). The use case calculates the correlation between monthly deposit volume and some macro economic indicators (Consumer Price Index (CPI), Overnight Rate, and Foreign Exchange Rate). First, let’s look at how this analysis would be coded as a regular SAS program. The input data would be structured like this:
Month Volume CPI OvernightRate ExchangeRate Jan2002 360 115.2 5.50 0.66534 Feb2002 358 115.4 5.50 0.65703 Mar2002 357 115.5 5.00 0.64144 etc.
Here is the SAS code to perform the correlation analysis:
proc corr data=indata nosimple ; with volume; var CPI OvernightRate ExchangeRate; run;
Applications DevelopmentSAS Global Forum 2008
4
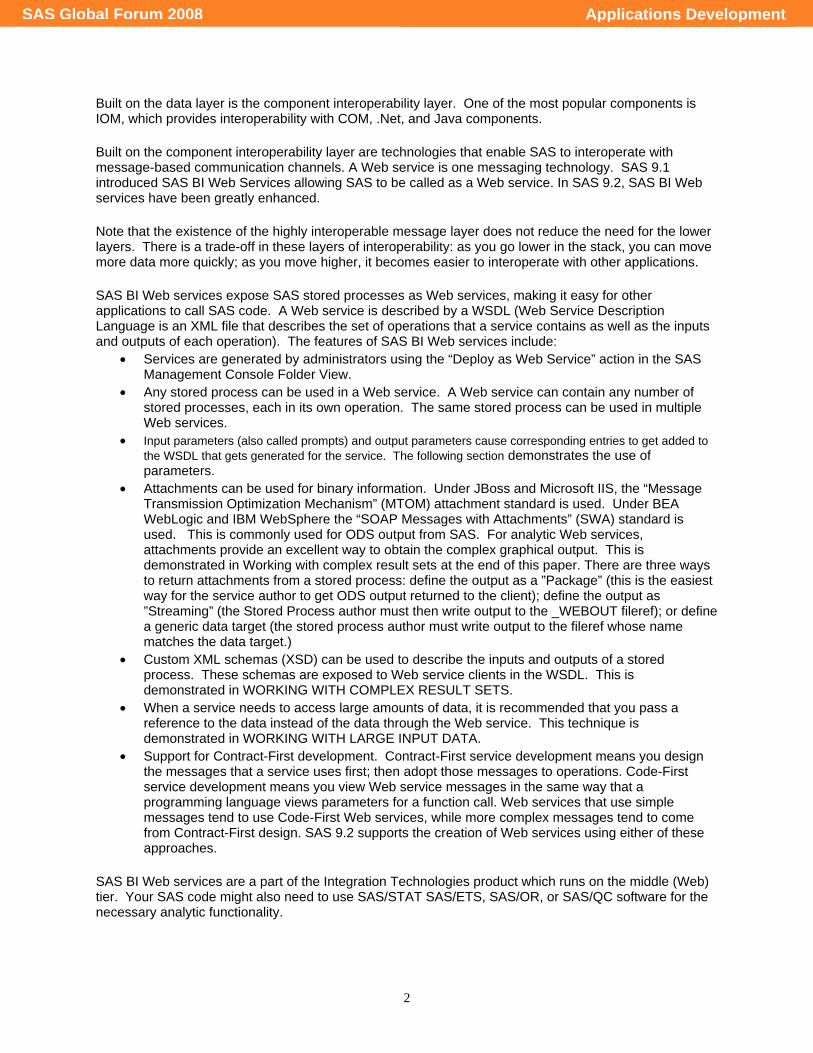
And the resulting output from the CORR procedure (Figure 2) would be:
Figure 2. Output from PROC CORR. This output tells us that, for this data, we have a high positive correlation between CPI and deposit volume, a moderate negative correlation between the overnight rate and deposit volume, and a strong positive correlation between the foreign exchange rate and the deposit volume. The calling application could combine this information with macro economic forecasts to allow the user to create financial plans for deposit volume. Now that we know what the program would look like as a regular SAS program, let us look at how to create a Web service for this program. We will build this service in the following sequence:
1. Define how the service will be called, and how parameters will be passed in. 2. Define how the input data will be passed in the request. 3. Modify the SAS program as a SAS stored process for Web service deployment. 4. Modify the SAS program to format the output results.
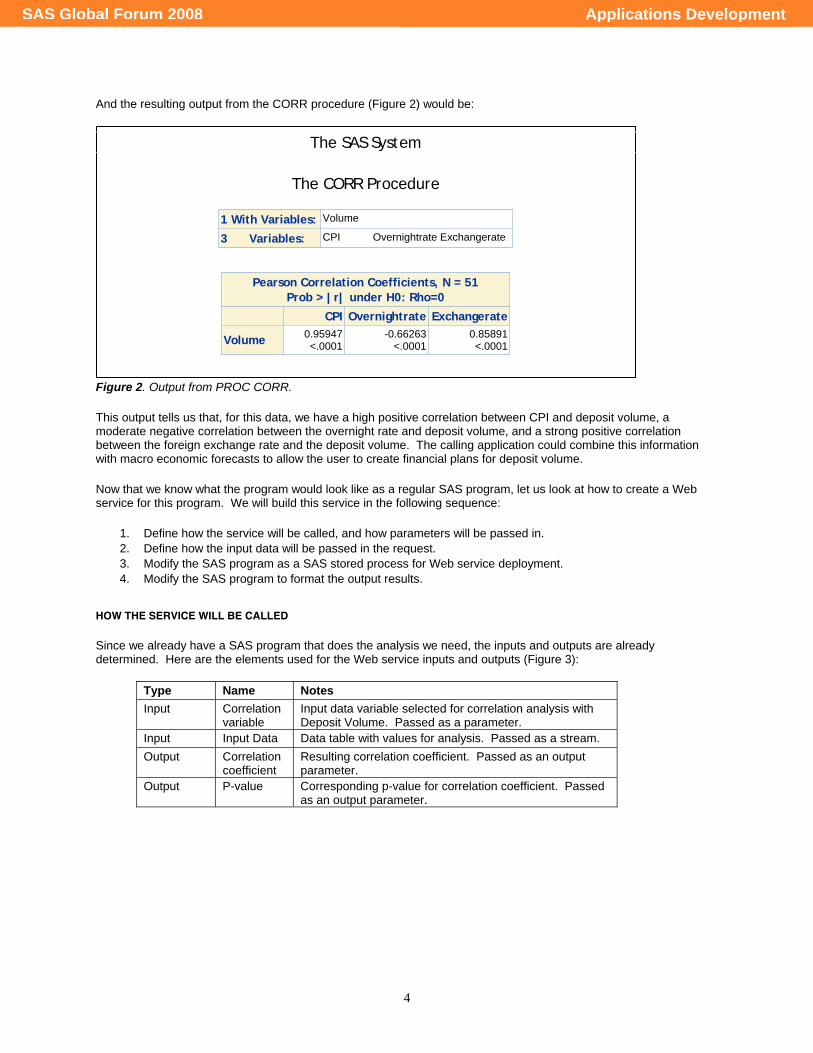
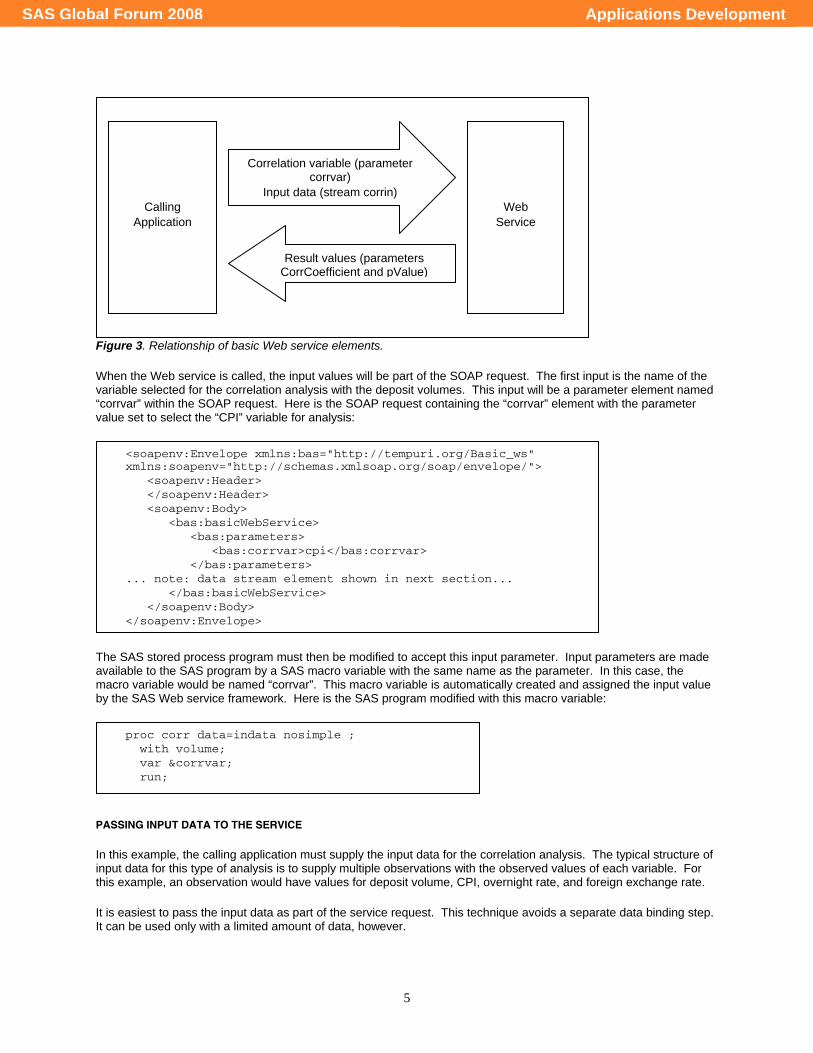
HOW THE SERVICE WILL BE CALLED Since we already have a SAS program that does the analysis we need, the inputs and outputs are already determined. Here are the elements used for the Web service inputs and outputs (Figure 3):
Type Name Notes Input Correlation
variable Input data variable selected for correlation analysis with Deposit Volume. Passed as a parameter.
Input Input Data Data table with values for analysis. Passed as a stream. Output Correlation
coefficient Resulting correlation coefficient. Passed as an output parameter.
Output P-value Corresponding p-value for correlation coefficient. Passed as an output parameter.
The SAS System
The CORR Procedure
1 With Variables: Volume
3 Variables: CPI Overnightrate Exchangerate
Pearson Correlation Coefficients, N = 51 Prob > |r| under H0: Rho=0
CPI Overnightrate Exchangerate
Volume 0.95947<.0001
-0.66263<.0001
0.85891<.0001
Applications DevelopmentSAS Global Forum 2008
5
Figure 3. Relationship of basic Web service elements. When the Web service is called, the input values will be part of the SOAP request. The first input is the name of the variable selected for the correlation analysis with the deposit volumes. This input will be a parameter element named “corrvar” within the SOAP request. Here is the SOAP request containing the “corrvar” element with the parameter value set to select the “CPI” variable for analysis:
The SAS stored process program must then be modified to accept this input parameter. Input parameters are made available to the SAS program by a SAS macro variable with the same name as the parameter. In this case, the macro variable would be named “corrvar”. This macro variable is automatically created and assigned the input value by the SAS Web service framework. Here is the SAS program modified with this macro variable:
PASSING INPUT DATA TO THE SERVICE In this example, the calling application must supply the input data for the correlation analysis. The typical structure of input data for this type of analysis is to supply multiple observations with the observed values of each variable. For this example, an observation would have values for deposit volume, CPI, overnight rate, and foreign exchange rate. It is easiest to pass the input data as part of the service request. This technique avoids a separate data binding step. It can be used only with a limited amount of data, however.
proc corr data=indata nosimple ; with volume; var &corrvar; run;
Calling Application
Web Service
Correlation variable (parameter corrvar)
Input data (stream corrin)
Result values (parameters CorrCoefficient and pValue)
<soapenv:Envelope xmlns:bas="http://tempuri.org/Basic_ws" xmlns:soapenv="http://schemas.xmlsoap.org/soap/envelope/"> <soapenv:Header> </soapenv:Header> <soapenv:Body> <bas:basicWebService> <bas:parameters> <bas:corrvar>cpi</bas:corrvar> </bas:parameters> ... note: data stream element shown in next section... </bas:basicWebService> </soapenv:Body> </soapenv:Envelope>
Applications DevelopmentSAS Global Forum 2008
6
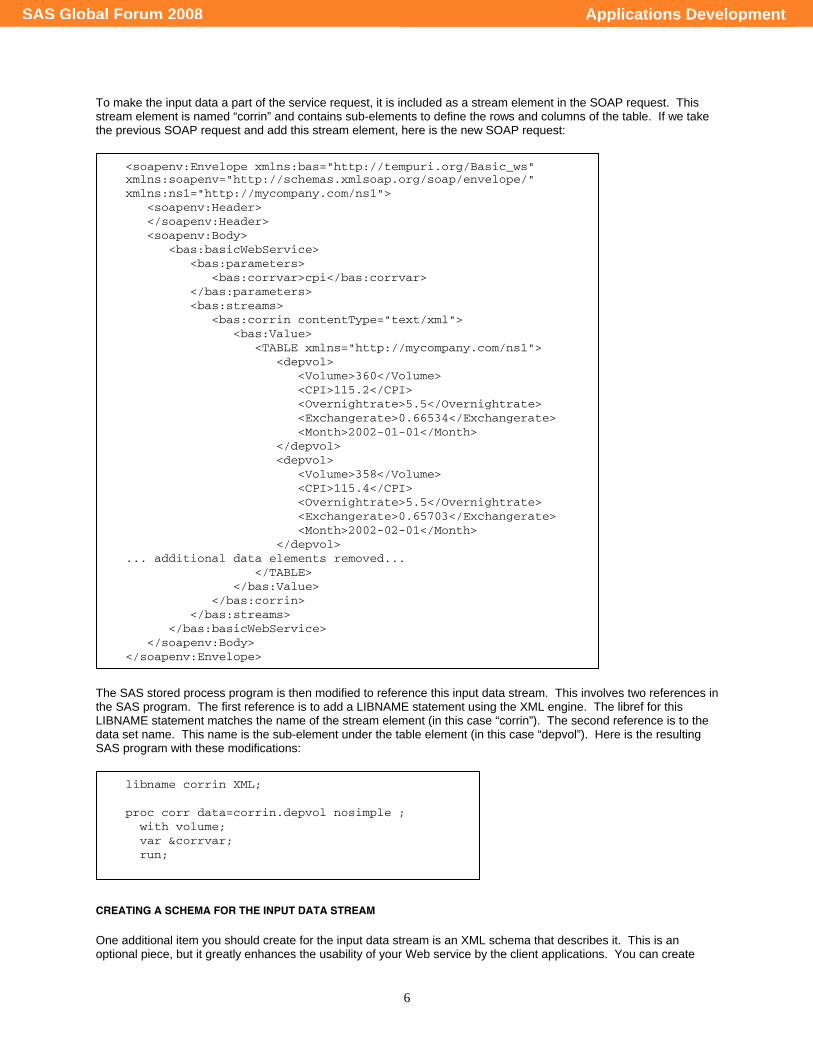
To make the input data a part of the service request, it is included as a stream element in the SOAP request. This stream element is named “corrin” and contains sub-elements to define the rows and columns of the table. If we take the previous SOAP request and add this stream element, here is the new SOAP request:
The SAS stored process program is then modified to reference this input data stream. This involves two references in the SAS program. The first reference is to add a LIBNAME statement using the XML engine. The libref for this LIBNAME statement matches the name of the stream element (in this case “corrin”). The second reference is to the data set name. This name is the sub-element under the table element (in this case “depvol”). Here is the resulting SAS program with these modifications:
CREATING A SCHEMA FOR THE INPUT DATA STREAM One additional item you should create for the input data stream is an XML schema that describes it. This is an optional piece, but it greatly enhances the usability of your Web service by the client applications. You can create
libname corrin XML; proc corr data=corrin.depvol nosimple ; with volume; var &corrvar; run;
<soapenv:Envelope xmlns:bas="http://tempuri.org/Basic_ws" xmlns:soapenv="http://schemas.xmlsoap.org/soap/envelope/" xmlns:ns1="http://mycompany.com/ns1"> <soapenv:Header> </soapenv:Header> <soapenv:Body> <bas:basicWebService> <bas:parameters> <bas:corrvar>cpi</bas:corrvar> </bas:parameters> <bas:streams> <bas:corrin contentType="text/xml"> <bas:Value> <TABLE xmlns="http://mycompany.com/ns1"> <depvol> <Volume>360</Volume> <CPI>115.2</CPI> <Overnightrate>5.5</Overnightrate> <Exchangerate>0.66534</Exchangerate> <Month>2002-01-01</Month> </depvol> <depvol> <Volume>358</Volume> <CPI>115.4</CPI> <Overnightrate>5.5</Overnightrate> <Exchangerate>0.65703</Exchangerate> <Month>2002-02-01</Month> </depvol> ... additional data elements removed... </TABLE> </bas:Value> </bas:corrin> </bas:streams> </bas:basicWebService> </soapenv:Body> </soapenv:Envelope>
Applications DevelopmentSAS Global Forum 2008

7
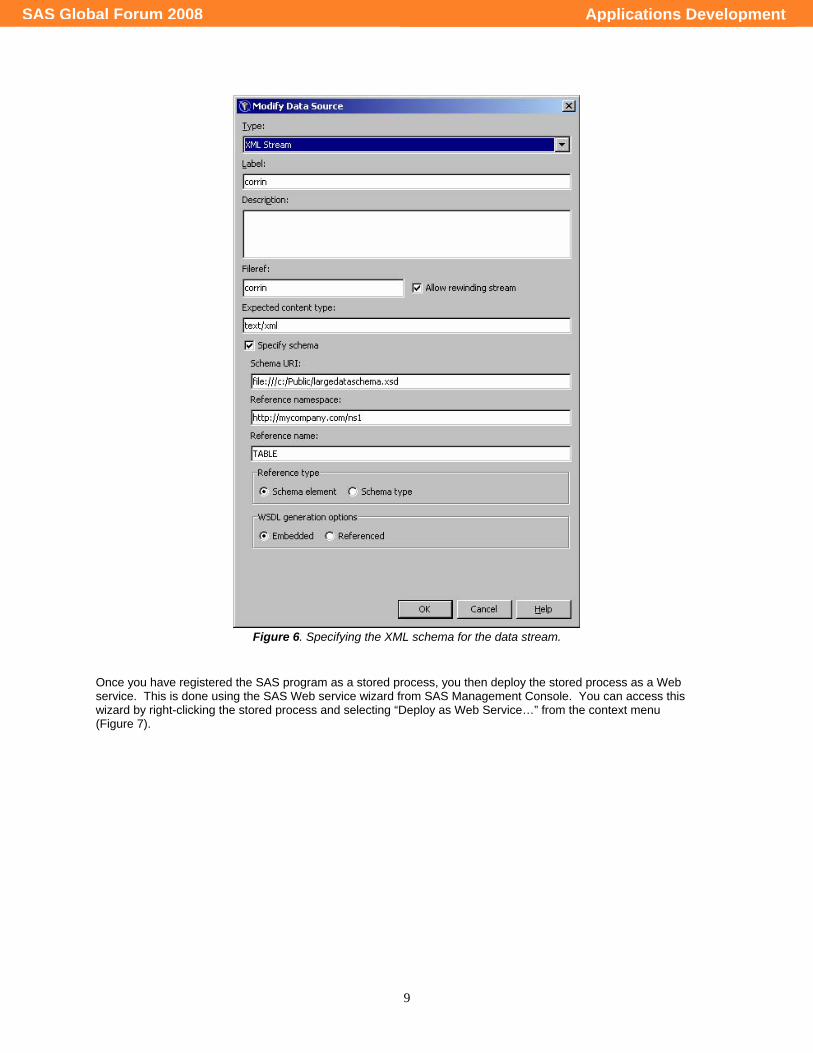
your schema while you are creating the SAS program for your service. Later, when you register the SAS program as a stored process, you will specify the schema as part of the input data stream definition. To create an XML schema in SAS, you use the XMLMETA=SCHEMA option in the LIBNAME XML statement. With this option, the XML LIBNAME engine generates a schema for describing the data set (without the XMLMETA option, you get data in the generated XML only). You will need a working copy of the input data available as a SAS data set to create the schema. It can be just a small subset of the data you would normally read into the program. The purpose of this step is just to specify the variables in the input data set and their types. Here is some SAS code which creates an XML schema:
After we manually add in the targetNamespace and the default namespace, the resulting XML schema looks like this:
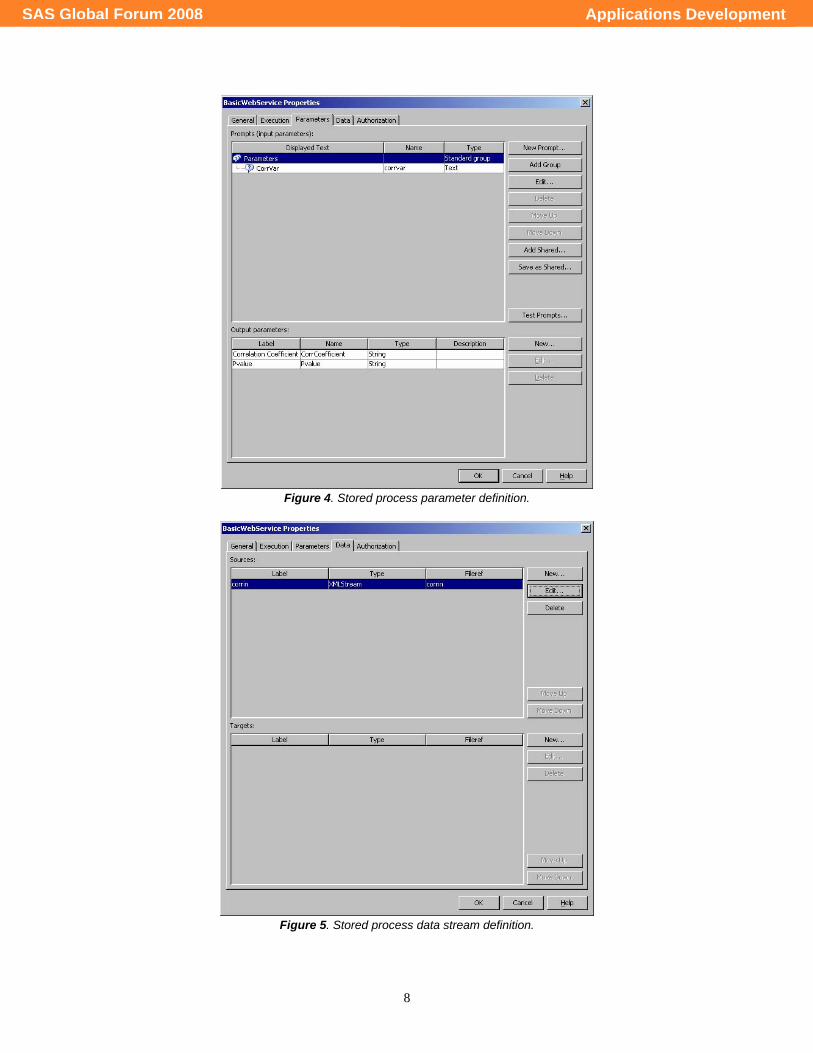
CREATING A SAS STORED PROCESS FOR WEB SERVICE DEPLOYMENT We now have to register the SAS program as a stored process and deploy it as a Web service. This is done with SAS Management Console. The documentation for SAS Management Console shows the process for registering the SAS program as a stored process. Two important steps are filling in the dialog boxes to define the parameters (Figure 4) and the input data stream (Figure 5,6).
libname myschema xml "c:\public\largedataschema.xsd" xmlmeta=schema; /* write small subset of data to create the schema */ data myschema.depvol; set depvol; run;
<xs:schema xmlns:xs="http://www.w3.org/2001/XMLSchema" xmlns:od="urn:schemas-microsoft-com:officedata" elementFormDefault="qualified" xmlns="http://mycompany.com/ns1" targetNamespace="http://mycompany.com/ns1"> <xs:element name="TABLE"> <xs:complexType> <xs:sequence> <xs:element ref="DEPVOL" minOccurs="0" maxOccurs="unbounded" /> </xs:sequence> </xs:complexType> </xs:element> <xs:element name="DEPVOL"> <xs:complexType> <xs:sequence> <xs:element name="Volume" minOccurs="0" od:jetType="double" od:sqlSType="double" type="xs:double" /> <xs:element name="CPI" minOccurs="0" od:jetType="double" od:sqlSType="double" type="xs:double" /> <xs:element name="Overnightrate" minOccurs="0" od:jetType="double" od:sqlSType="double" type="xs:double" /> <xs:element name="Exchangerate" minOccurs="0" od:jetType="double" od:sqlSType="double" type="xs:double" /> <xs:element name="Month" minOccurs="0" od:jetType="datetime" od:sqlSType="datetime" type="xs:date" /> </xs:sequence> </xs:complexType> </xs:element> </xs:schema>
Applications DevelopmentSAS Global Forum 2008
8
Figure 4. Stored process parameter definition.
Figure 5. Stored process data stream definition.
Applications DevelopmentSAS Global Forum 2008
9
Figure 6. Specifying the XML schema for the data stream.
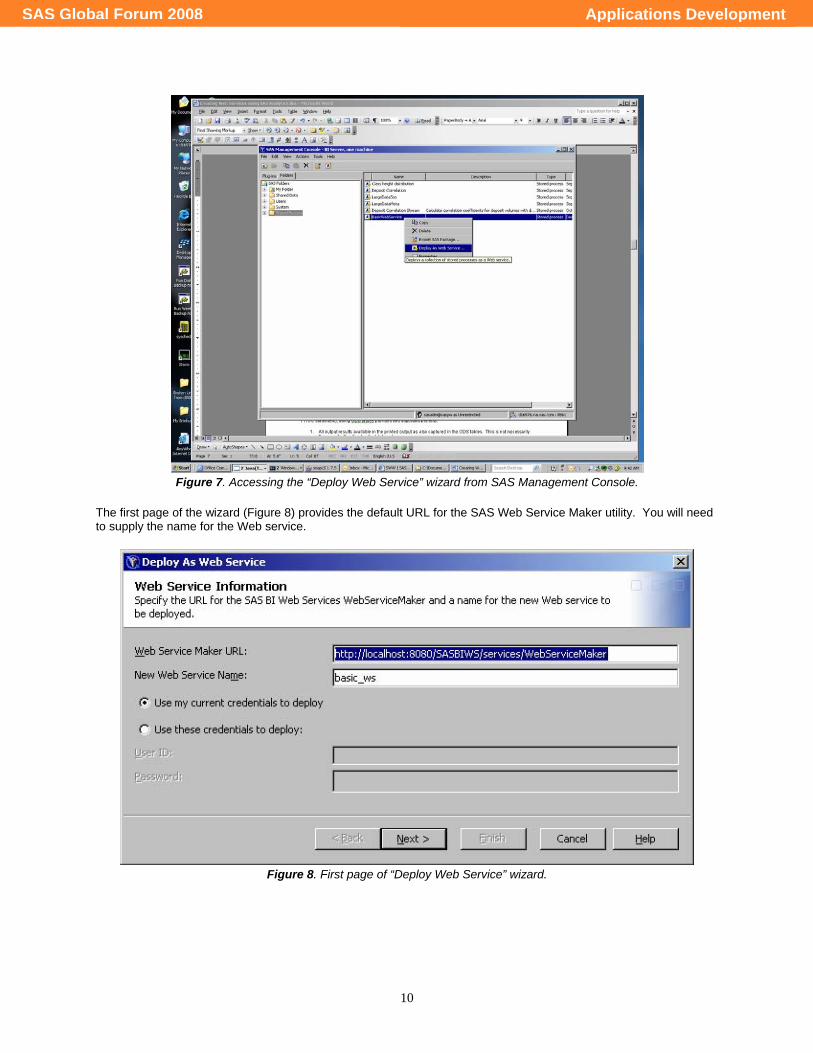
Once you have registered the SAS program as a stored process, you then deploy the stored process as a Web service. This is done using the SAS Web service wizard from SAS Management Console. You can access this wizard by right-clicking the stored process and selecting “Deploy as Web Service…” from the context menu (Figure 7).
Applications DevelopmentSAS Global Forum 2008
10
Figure 7. Accessing the “Deploy Web Service” wizard from SAS Management Console.
The first page of the wizard (Figure 8) provides the default URL for the SAS Web Service Maker utility. You will need to supply the name for the Web service.
Figure 8. First page of “Deploy Web Service” wizard.
Applications DevelopmentSAS Global Forum 2008
11
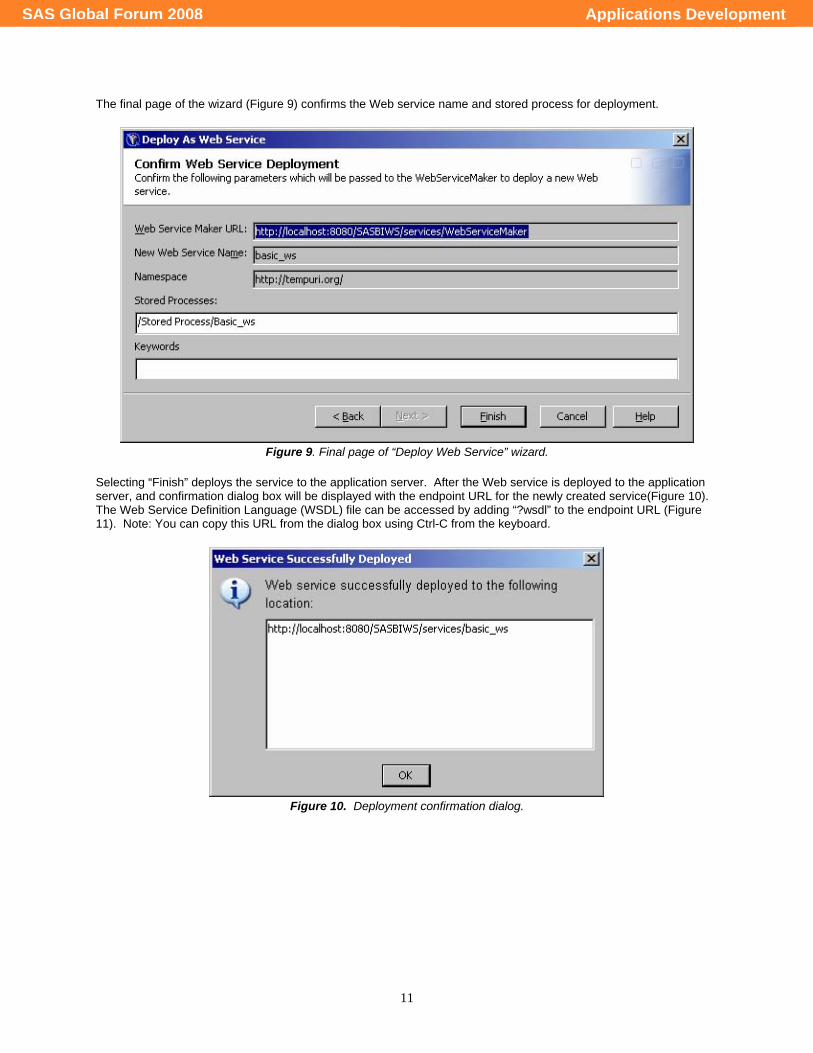
The final page of the wizard (Figure 9) confirms the Web service name and stored process for deployment.
Figure 9. Final page of “Deploy Web Service” wizard.
Selecting “Finish” deploys the service to the application server. After the Web service is deployed to the application server, and confirmation dialog box will be displayed with the endpoint URL for the newly created service(Figure 10). The Web Service Definition Language (WSDL) file can be accessed by adding “?wsdl” to the endpoint URL (Figure 11). Note: You can copy this URL from the dialog box using Ctrl-C from the keyboard.
Figure 10. Deployment confirmation dialog.
Applications DevelopmentSAS Global Forum 2008
12
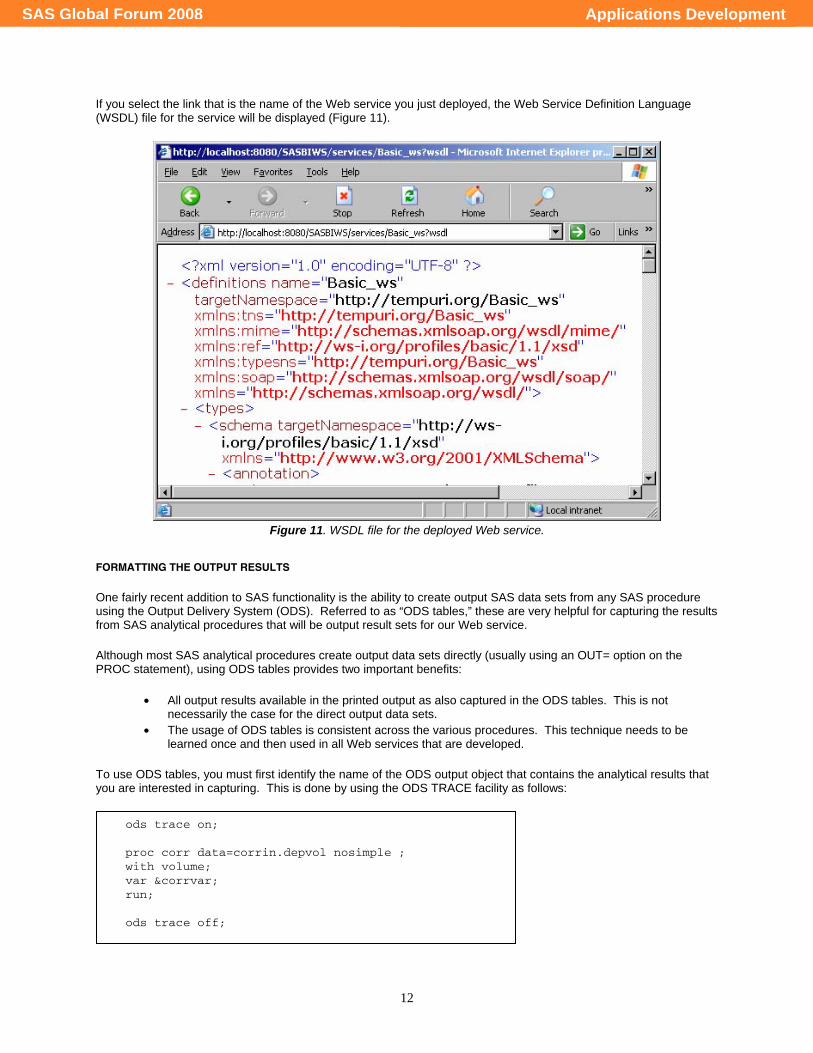
If you select the link that is the name of the Web service you just deployed, the Web Service Definition Language (WSDL) file for the service will be displayed (Figure 11).
Figure 11. WSDL file for the deployed Web service.
FORMATTING THE OUTPUT RESULTS One fairly recent addition to SAS functionality is the ability to create output SAS data sets from any SAS procedure using the Output Delivery System (ODS). Referred to as “ODS tables,” these are very helpful for capturing the results from SAS analytical procedures that will be output result sets for our Web service. Although most SAS analytical procedures create output data sets directly (usually using an OUT= option on the PROC statement), using ODS tables provides two important benefits:
• All output results available in the printed output as also captured in the ODS tables. This is not necessarily the case for the direct output data sets.
• The usage of ODS tables is consistent across the various procedures. This technique needs to be learned once and then used in all Web services that are developed.
To use ODS tables, you must first identify the name of the ODS output object that contains the analytical results that you are interested in capturing. This is done by using the ODS TRACE facility as follows:
ods trace on; proc corr data=corrin.depvol nosimple ; with volume; var &corrvar; run; ods trace off;
Applications DevelopmentSAS Global Forum 2008
13
This action will create output to the SAS log as follows:
This log tells us that the ODS output object that contains the Pearson Correlation Coefficients that we are interested in are in the output object names PearsonCorr. Now that we know the name of the ODS output object, we can capture the results into a SAS data set using the ODS OUTPUT statement as follows:
The last modification to the SAS program will be to write the result values to the output parameters returned by the stored process. The result values need to be written to SAS macro variables that correspond to output parameters specified when registering the stored process. You can write these values using the SYMPUT function from a DATA step. Here is the necessary code for our example:
Output Added: ------------- Name: VarInformation Label: Variables Information Template: base.corr.VarInfo Path: Corr.VarInformation ------------- Output Added: ------------- Name: PearsonCorr Label: Pearson Correlations Template: base.corr.StackedMatrix Path: Corr.N.PearsonCorr -------------
ods output PearsonCorr=work.Coefficients; proc corr data= corrin.depvol nosimple ; with volume; var &corrvar; run; ods output close;
data _null_; set work.Coefficients; call symput("CorrCoefficient",&corrvar); call symput("Pvalue",p&corrvar); run;
Applications DevelopmentSAS Global Forum 2008
14
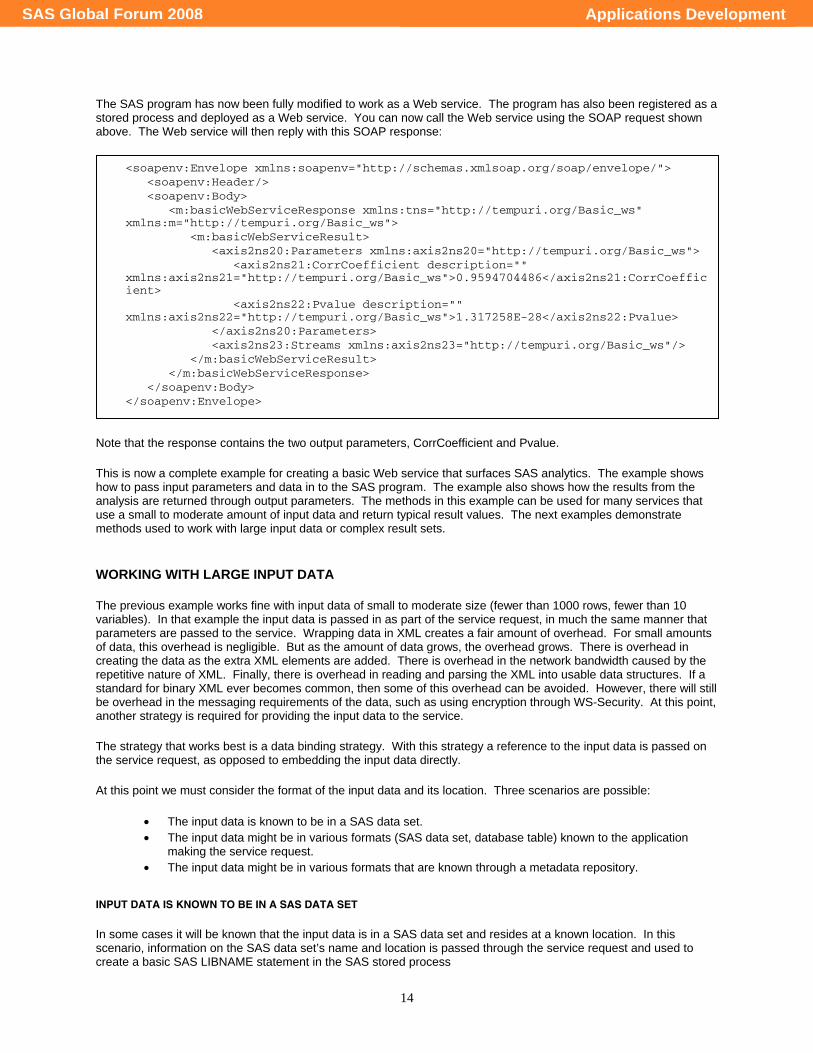
The SAS program has now been fully modified to work as a Web service. The program has also been registered as a stored process and deployed as a Web service. You can now call the Web service using the SOAP request shown above. The Web service will then reply with this SOAP response:
Note that the response contains the two output parameters, CorrCoefficient and Pvalue. This is now a complete example for creating a basic Web service that surfaces SAS analytics. The example shows how to pass input parameters and data in to the SAS program. The example also shows how the results from the analysis are returned through output parameters. The methods in this example can be used for many services that use a small to moderate amount of input data and return typical result values. The next examples demonstrate methods used to work with large input data or complex result sets.
WORKING WITH LARGE INPUT DATA The previous example works fine with input data of small to moderate size (fewer than 1000 rows, fewer than 10 variables). In that example the input data is passed in as part of the service request, in much the same manner that parameters are passed to the service. Wrapping data in XML creates a fair amount of overhead. For small amounts of data, this overhead is negligible. But as the amount of data grows, the overhead grows. There is overhead in creating the data as the extra XML elements are added. There is overhead in the network bandwidth caused by the repetitive nature of XML. Finally, there is overhead in reading and parsing the XML into usable data structures. If a standard for binary XML ever becomes common, then some of this overhead can be avoided. However, there will still be overhead in the messaging requirements of the data, such as using encryption through WS-Security. At this point, another strategy is required for providing the input data to the service. The strategy that works best is a data binding strategy. With this strategy a reference to the input data is passed on the service request, as opposed to embedding the input data directly. At this point we must consider the format of the input data and its location. Three scenarios are possible:
• The input data is known to be in a SAS data set. • The input data might be in various formats (SAS data set, database table) known to the application
making the service request. • The input data might be in various formats that are known through a metadata repository.
INPUT DATA IS KNOWN TO BE IN A SAS DATA SET In some cases it will be known that the input data is in a SAS data set and resides at a known location. In this scenario, information on the SAS data set’s name and location is passed through the service request and used to create a basic SAS LIBNAME statement in the SAS stored process
<soapenv:Envelope xmlns:soapenv="http://schemas.xmlsoap.org/soap/envelope/"> <soapenv:Header/> <soapenv:Body> <m:basicWebServiceResponse xmlns:tns="http://tempuri.org/Basic_ws" xmlns:m="http://tempuri.org/Basic_ws"> <m:basicWebServiceResult> <axis2ns20:Parameters xmlns:axis2ns20="http://tempuri.org/Basic_ws"> <axis2ns21:CorrCoefficient description="" xmlns:axis2ns21="http://tempuri.org/Basic_ws">0.9594704486</axis2ns21:CorrCoefficient> <axis2ns22:Pvalue description="" xmlns:axis2ns22="http://tempuri.org/Basic_ws">1.317258E-28</axis2ns22:Pvalue> </axis2ns20:Parameters> <axis2ns23:Streams xmlns:axis2ns23="http://tempuri.org/Basic_ws"/> </m:basicWebServiceResult> </m:basicWebServiceResponse> </soapenv:Body> </soapenv:Envelope>
Applications DevelopmentSAS Global Forum 2008
15
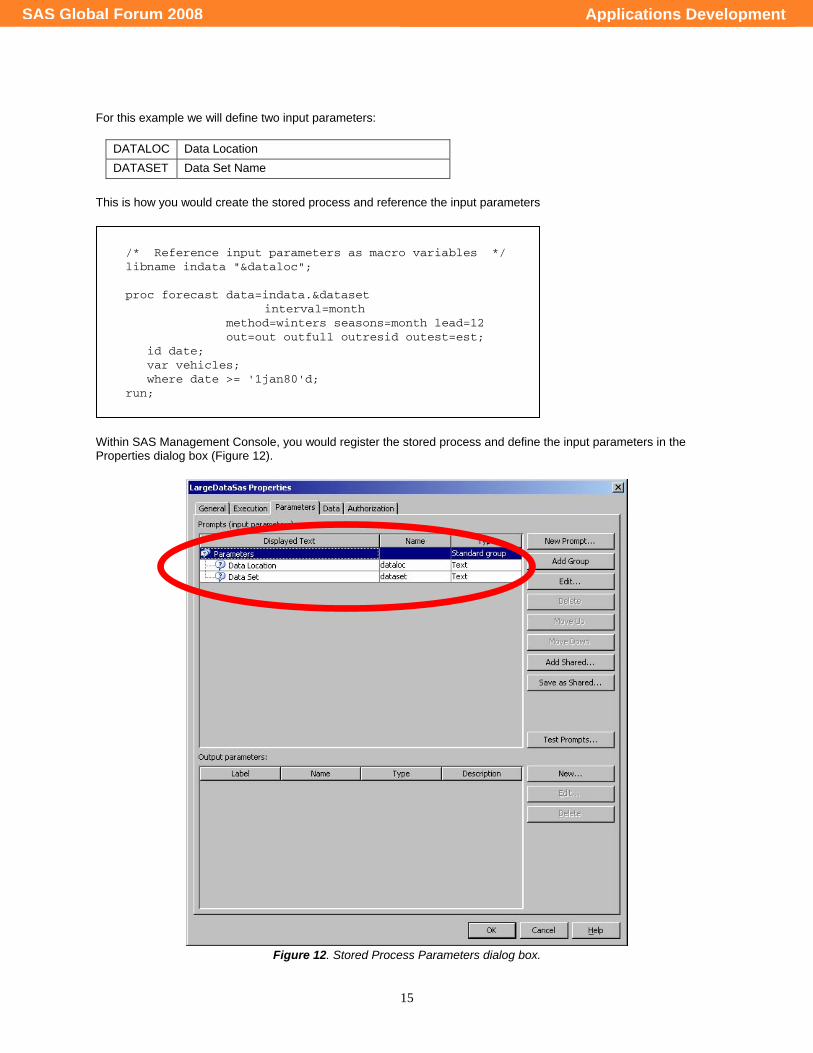
For this example we will define two input parameters:
DATALOC Data Location DATASET Data Set Name
This is how you would create the stored process and reference the input parameters
Within SAS Management Console, you would register the stored process and define the input parameters in the Properties dialog box (Figure 12).
Figure 12. Stored Process Parameters dialog box.
/* Reference input parameters as macro variables */ libname indata "&dataloc"; proc forecast data=indata.&dataset interval=month method=winters seasons=month lead=12 out=out outfull outresid outest=est; id date; var vehicles; where date >= '1jan80'd; run;
Applications DevelopmentSAS Global Forum 2008
16
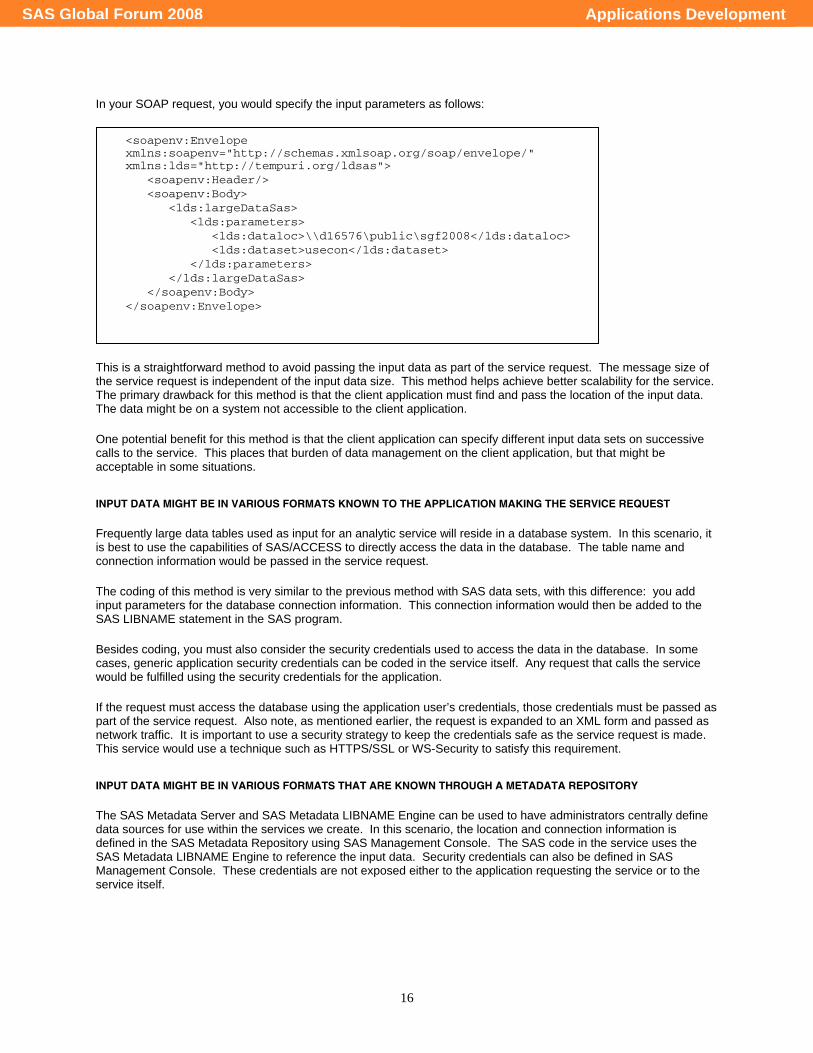
In your SOAP request, you would specify the input parameters as follows:
This is a straightforward method to avoid passing the input data as part of the service request. The message size of the service request is independent of the input data size. This method helps achieve better scalability for the service. The primary drawback for this method is that the client application must find and pass the location of the input data. The data might be on a system not accessible to the client application. One potential benefit for this method is that the client application can specify different input data sets on successive calls to the service. This places that burden of data management on the client application, but that might be acceptable in some situations.
INPUT DATA MIGHT BE IN VARIOUS FORMATS KNOWN TO THE APPLICATION MAKING THE SERVICE REQUEST Frequently large data tables used as input for an analytic service will reside in a database system. In this scenario, it is best to use the capabilities of SAS/ACCESS to directly access the data in the database. The table name and connection information would be passed in the service request. The coding of this method is very similar to the previous method with SAS data sets, with this difference: you add input parameters for the database connection information. This connection information would then be added to the SAS LIBNAME statement in the SAS program. Besides coding, you must also consider the security credentials used to access the data in the database. In some cases, generic application security credentials can be coded in the service itself. Any request that calls the service would be fulfilled using the security credentials for the application. If the request must access the database using the application user’s credentials, those credentials must be passed as part of the service request. Also note, as mentioned earlier, the request is expanded to an XML form and passed as network traffic. It is important to use a security strategy to keep the credentials safe as the service request is made. This service would use a technique such as HTTPS/SSL or WS-Security to satisfy this requirement.
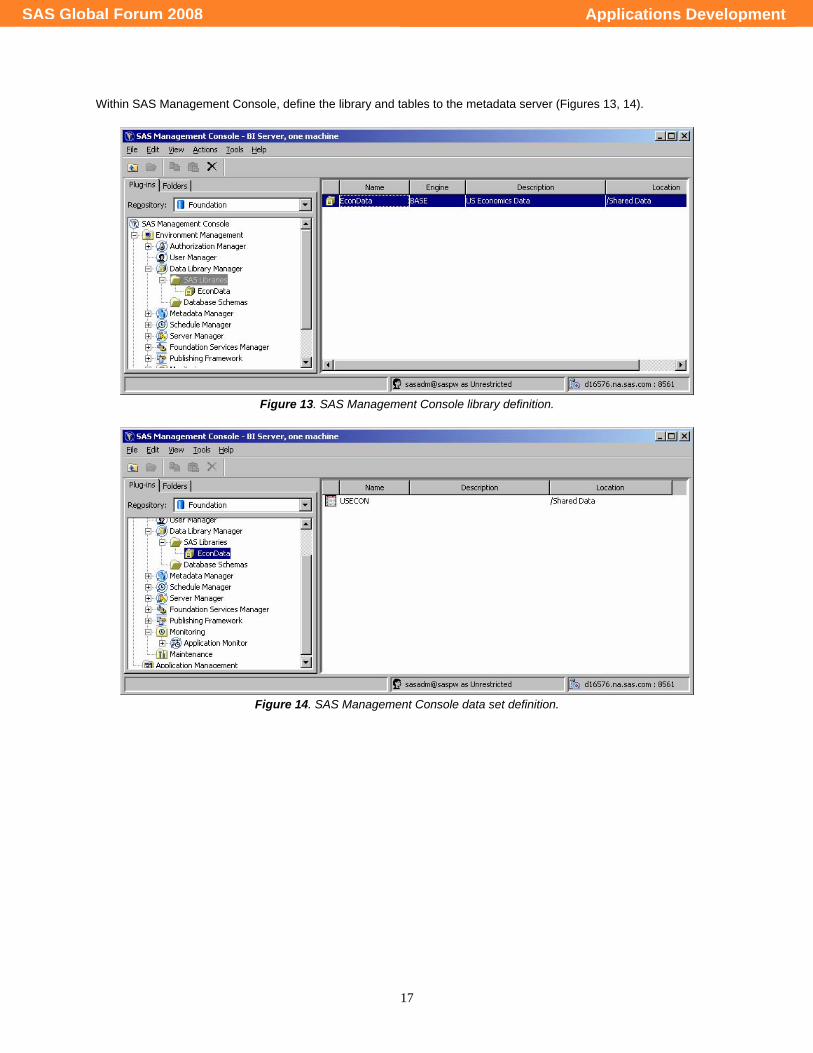
INPUT DATA MIGHT BE IN VARIOUS FORMATS THAT ARE KNOWN THROUGH A METADATA REPOSITORY The SAS Metadata Server and SAS Metadata LIBNAME Engine can be used to have administrators centrally define data sources for use within the services we create. In this scenario, the location and connection information is defined in the SAS Metadata Repository using SAS Management Console. The SAS code in the service uses the SAS Metadata LIBNAME Engine to reference the input data. Security credentials can also be defined in SAS Management Console. These credentials are not exposed either to the application requesting the service or to the service itself.
<soapenv:Envelope xmlns:soapenv="http://schemas.xmlsoap.org/soap/envelope/" xmlns:lds="http://tempuri.org/ldsas"> <soapenv:Header/> <soapenv:Body> <lds:largeDataSas> <lds:parameters> <lds:dataloc>\\d16576\public\sgf2008</lds:dataloc> <lds:dataset>usecon</lds:dataset> </lds:parameters> </lds:largeDataSas> </soapenv:Body> </soapenv:Envelope>
Applications DevelopmentSAS Global Forum 2008
17
Within SAS Management Console, define the library and tables to the metadata server (Figures 13, 14).
Figure 13. SAS Management Console library definition.
Figure 14. SAS Management Console data set definition.
Applications DevelopmentSAS Global Forum 2008
18
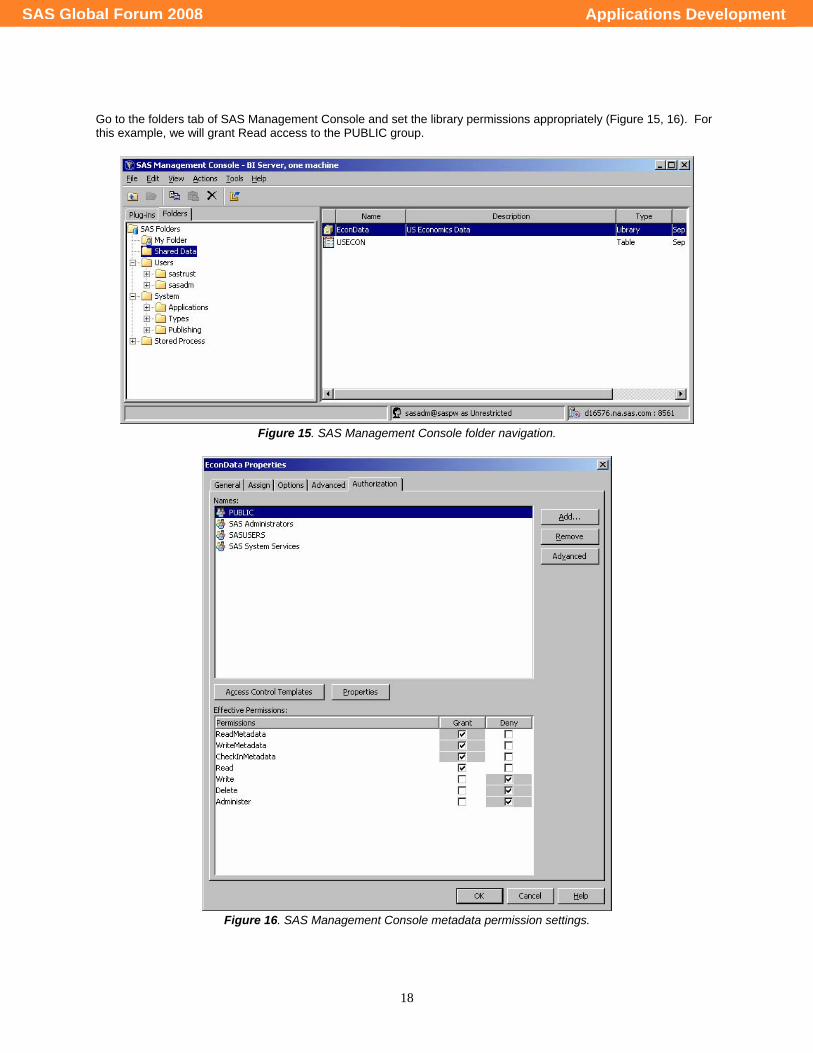
Go to the folders tab of SAS Management Console and set the library permissions appropriately (Figure 15, 16). For this example, we will grant Read access to the PUBLIC group.
Figure 15. SAS Management Console folder navigation.
Figure 16. SAS Management Console metadata permission settings.
Applications DevelopmentSAS Global Forum 2008
19
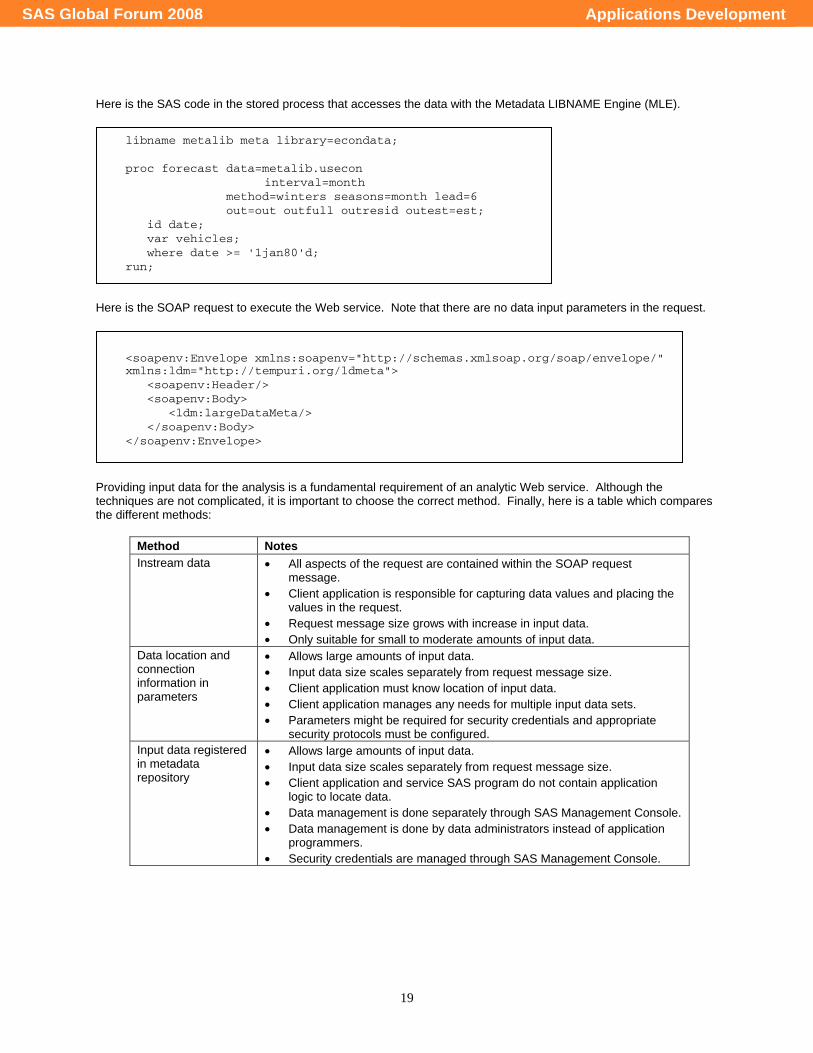
Here is the SAS code in the stored process that accesses the data with the Metadata LIBNAME Engine (MLE).
Here is the SOAP request to execute the Web service. Note that there are no data input parameters in the request.
Providing input data for the analysis is a fundamental requirement of an analytic Web service. Although the techniques are not complicated, it is important to choose the correct method. Finally, here is a table which compares the different methods:
Method Notes Instream data • All aspects of the request are contained within the SOAP request
message. • Client application is responsible for capturing data values and placing the
values in the request. • Request message size grows with increase in input data. • Only suitable for small to moderate amounts of input data.
Data location and connection information in parameters
• Allows large amounts of input data. • Input data size scales separately from request message size. • Client application must know location of input data. • Client application manages any needs for multiple input data sets. • Parameters might be required for security credentials and appropriate
security protocols must be configured. Input data registered in metadata repository
• Allows large amounts of input data. • Input data size scales separately from request message size. • Client application and service SAS program do not contain application
logic to locate data. • Data management is done separately through SAS Management Console. • Data management is done by data administrators instead of application
programmers. • Security credentials are managed through SAS Management Console.
libname metalib meta library=econdata; proc forecast data=metalib.usecon interval=month method=winters seasons=month lead=6 out=out outfull outresid outest=est; id date; var vehicles; where date >= '1jan80'd; run;
<soapenv:Envelope xmlns:soapenv="http://schemas.xmlsoap.org/soap/envelope/" xmlns:ldm="http://tempuri.org/ldmeta"> <soapenv:Header/> <soapenv:Body> <ldm:largeDataMeta/> </soapenv:Body> </soapenv:Envelope>
Applications DevelopmentSAS Global Forum 2008
20
WORKING WITH COMPLEX RESULT SETS Sometimes when you are creating analytic Web services, you need to return more complex result sets. In that case, an analytic Web service will need to return one or more of the following results:
• Predicted values for new input variables • Measure of uncertainty for predicted values (e.g., confidence intervals) • Information that describes the model that was fit (e.g., parameter estimates) • Information about how well the model fit in input data (e.g., R squared) • Residual values from data used to fit the model • Graphs of the input data values and predicted data values with confidence intervals • Diagnostic graphs for the models technique used • Trigger events detected by the application of the model • Context information for the results (e.g., where in a product hierarchy the results apply)
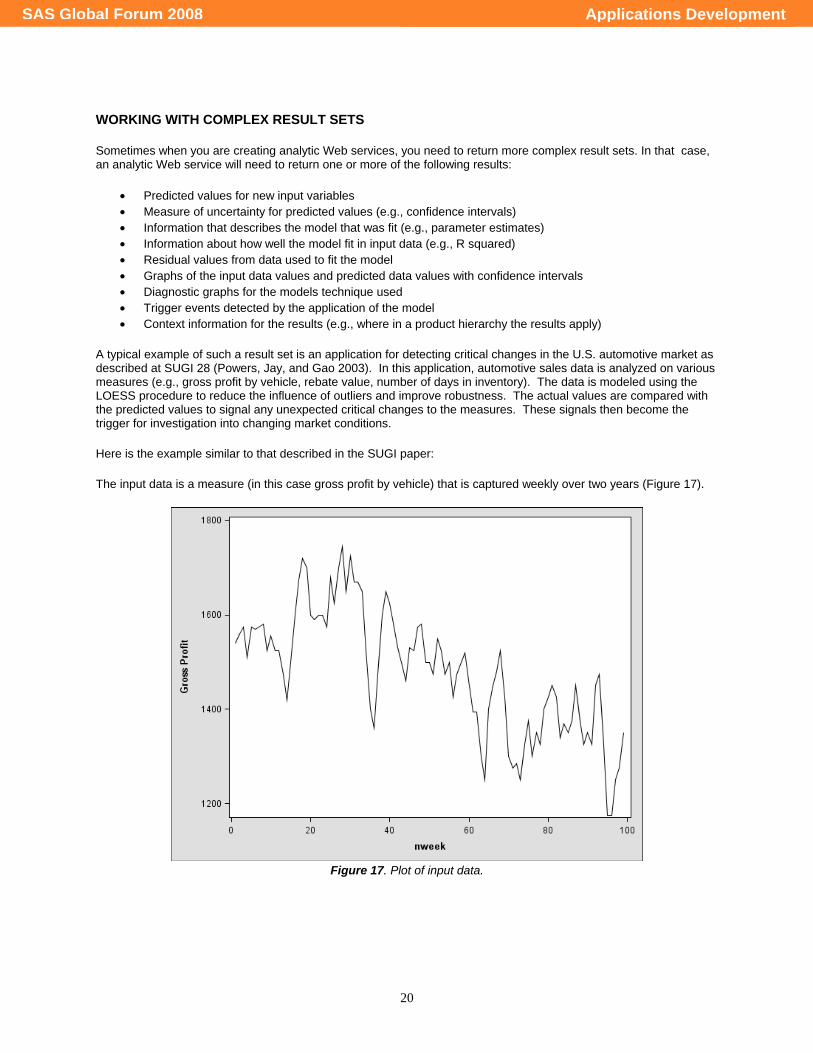
A typical example of such a result set is an application for detecting critical changes in the U.S. automotive market as described at SUGI 28 (Powers, Jay, and Gao 2003). In this application, automotive sales data is analyzed on various measures (e.g., gross profit by vehicle, rebate value, number of days in inventory). The data is modeled using the LOESS procedure to reduce the influence of outliers and improve robustness. The actual values are compared with the predicted values to signal any unexpected critical changes to the measures. These signals then become the trigger for investigation into changing market conditions. Here is the example similar to that described in the SUGI paper: The input data is a measure (in this case gross profit by vehicle) that is captured weekly over two years (Figure 17).
Figure 17. Plot of input data.
Applications DevelopmentSAS Global Forum 2008
21
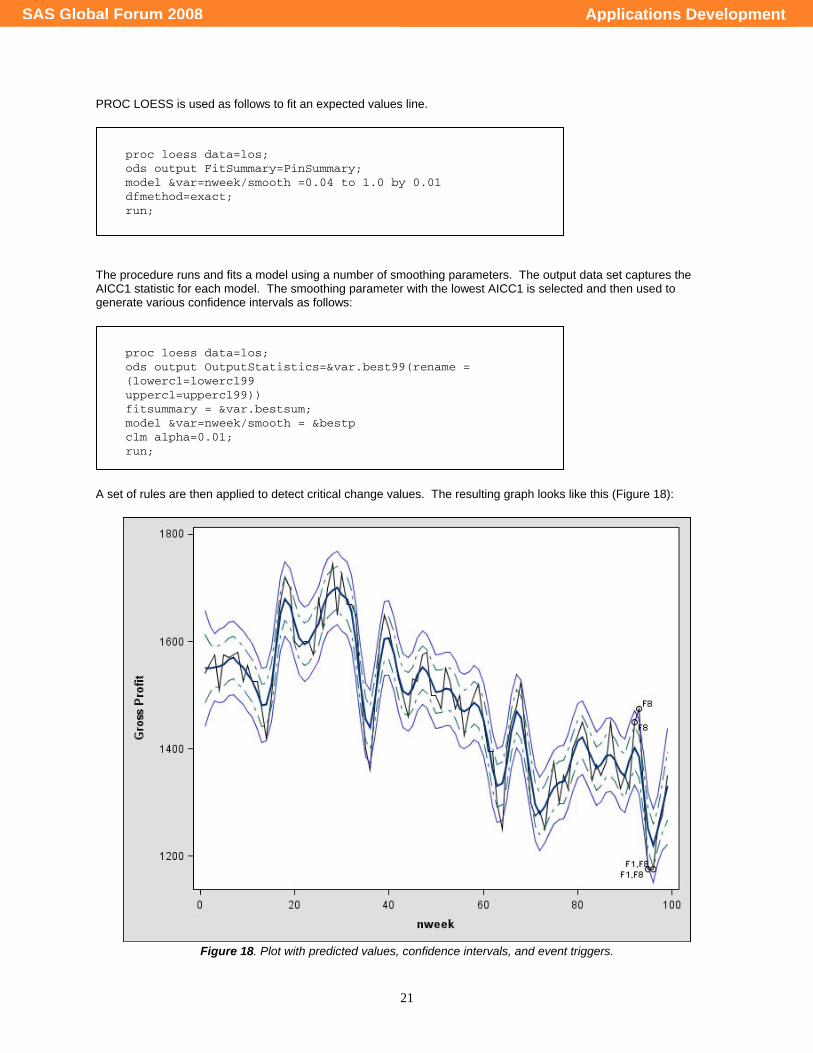
PROC LOESS is used as follows to fit an expected values line.
The procedure runs and fits a model using a number of smoothing parameters. The output data set captures the AICC1 statistic for each model. The smoothing parameter with the lowest AICC1 is selected and then used to generate various confidence intervals as follows:
A set of rules are then applied to detect critical change values. The resulting graph looks like this (Figure 18):
Figure 18. Plot with predicted values, confidence intervals, and event triggers.
proc loess data=los; ods output FitSummary=PinSummary; model &var=nweek/smooth =0.04 to 1.0 by 0.01 dfmethod=exact; run;
proc loess data=los; ods output OutputStatistics=&var.best99(rename = (lowercl=lowercl99 uppercl=uppercl99)) fitsummary = &var.bestsum; model &var=nweek/smooth = &bestp clm alpha=0.01; run;
Applications DevelopmentSAS Global Forum 2008

22
Taking this analysis and creating a Web service would require a result set with the following results:
• Actual input values and predicted result values for each week. • Selected smoothing parameter and diagnostic values such as the AICC1. • Confidence interval values • Data points that generated triggers and the rule name that triggered the flag • Graphs like those shown above.
MULTIPLE SERVICES FOR MULTIPLE RESULT SETS A few other aspects of this example also complicate the result set. It is easy to see that multiple applications might want to use this service. However, not all applications would need all of the results generated. One application might only need the data points which generate a critical change trigger and which rule flagged the trigger. Another application might require all the data values listed above. Some applications might want the graphs as well as the data values. Additionally, we might need to limit the results based on a security level of the calling application. The critical change trigger data might be suitable for a fairly large audience of applications, but the detailed data values of the actual input values might need to be more secured. To meet these requirements, it is best to define a service with three operations. Each operation would generate a specific, defined result set. Here is how these operations would be defined:
Critical change trigger operation Returns data only for points for which a critical change has been detected.
Critical change detail operation Returns all data points, predicted values, confidence intervals, and rule name where critical changes have been detected.
Critical change graph operation Returns graph of data described in detail operation. Of course, we would like to have only one SAS program perform this analysis and be able to return each of the different result sets. This way we have all the business application logic in one place. We can easily anticipate changes to the application logic such as the following:
• Addition of new rules or changing to existing rule logic • Use of an alternate statistical methodology (e.g., possibly use a method which accounts for autocorrelation) • Changes to graph format
We can define multiple stored processes that point to the same SAS source code by modifying metadata and making the SAS code aware of what the output requirements are. Here are the steps to create a service with multiple operations using one SAS program:
1. Create one SAS program which uses parameters to control which results should be returned. 2. Register the SAS program multiple times as a Stored Process, each pointing to the one SAS program 3. Use hidden parameters when registering the Stored Process to set which results should be returned for the
corresponding service. 4. Select all three stored processes and deploy as a single Web service.
One other aspect to notice is that some of our operations return data values only, while one operation also returns a graph. As seen in the basic example, if the data values are returned directly in the SOAP response they are more easily accessed by the client application. Since the graph is a binary object, it cannot be returned directly within the SOAP response. Instead it must be returned as a SOAP attachment to the response. SOAP attachments require additional programming logic in the client application. For this example, the benefit would be simpler programming logic to display the graph in the client
Applications DevelopmentSAS Global Forum 2008
23
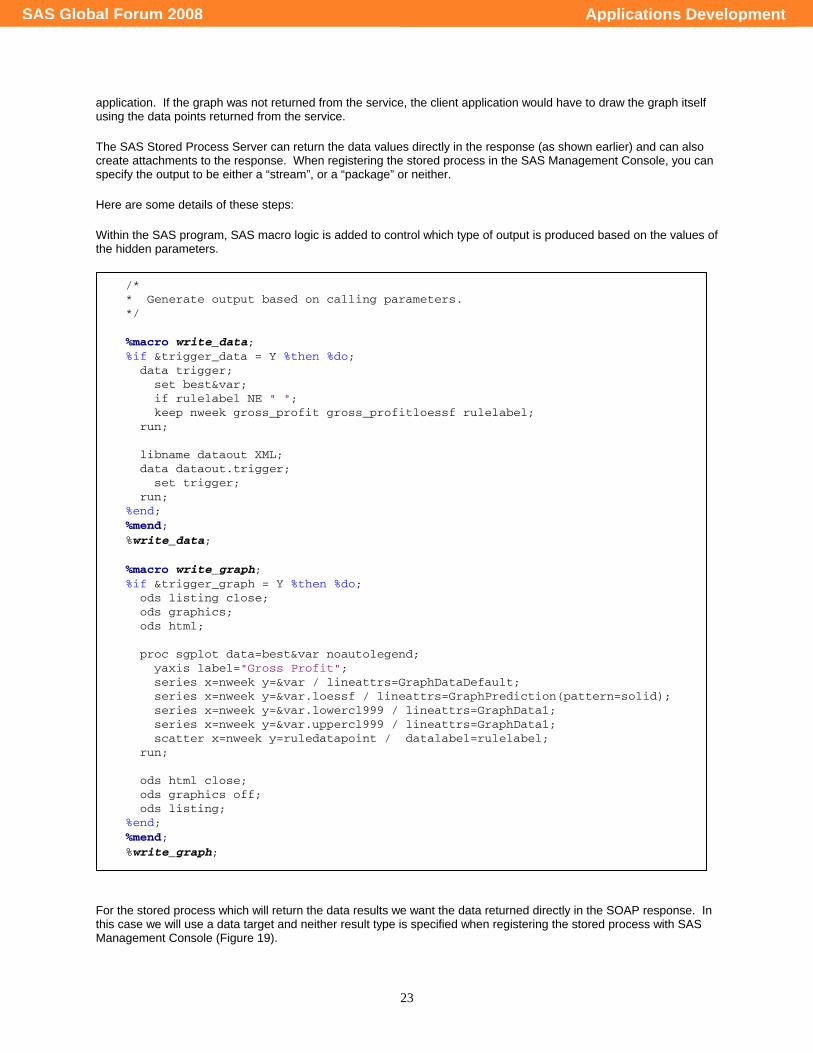
application. If the graph was not returned from the service, the client application would have to draw the graph itself using the data points returned from the service. The SAS Stored Process Server can return the data values directly in the response (as shown earlier) and can also create attachments to the response. When registering the stored process in the SAS Management Console, you can specify the output to be either a “stream”, or a “package” or neither. Here are some details of these steps: Within the SAS program, SAS macro logic is added to control which type of output is produced based on the values of the hidden parameters.
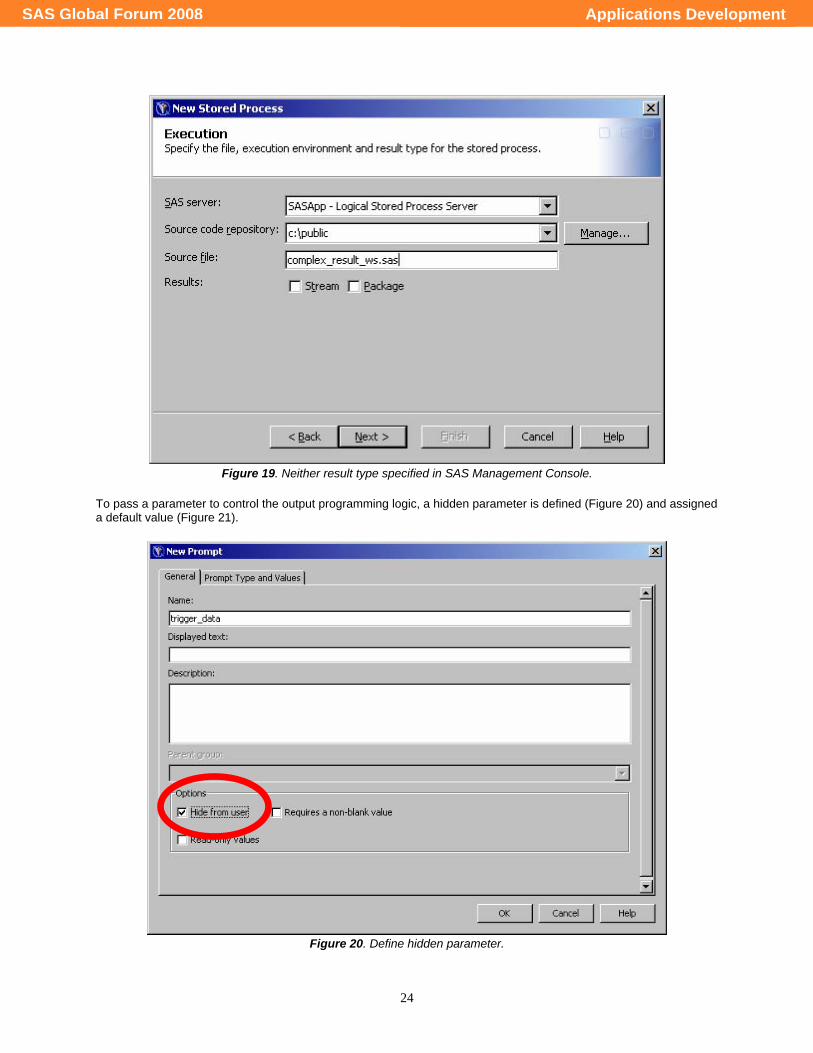
For the stored process which will return the data results we want the data returned directly in the SOAP response. In this case we will use a data target and neither result type is specified when registering the stored process with SAS Management Console (Figure 19).
/* * Generate output based on calling parameters. */ %macro write_data; %if &trigger_data = Y %then %do; data trigger; set best&var; if rulelabel NE " "; keep nweek gross_profit gross_profitloessf rulelabel; run; libname dataout XML; data dataout.trigger; set trigger; run; %end; %mend; %write_data; %macro write_graph; %if &trigger_graph = Y %then %do; ods listing close; ods graphics; ods html; proc sgplot data=best&var noautolegend; yaxis label="Gross Profit"; series x=nweek y=&var / lineattrs=GraphDataDefault; series x=nweek y=&var.loessf / lineattrs=GraphPrediction(pattern=solid); series x=nweek y=&var.lowercl999 / lineattrs=GraphData1; series x=nweek y=&var.uppercl999 / lineattrs=GraphData1; scatter x=nweek y=ruledatapoint / datalabel=rulelabel; run; ods html close; ods graphics off; ods listing; %end; %mend; %write_graph;
Applications DevelopmentSAS Global Forum 2008
24
Figure 19. Neither result type specified in SAS Management Console.
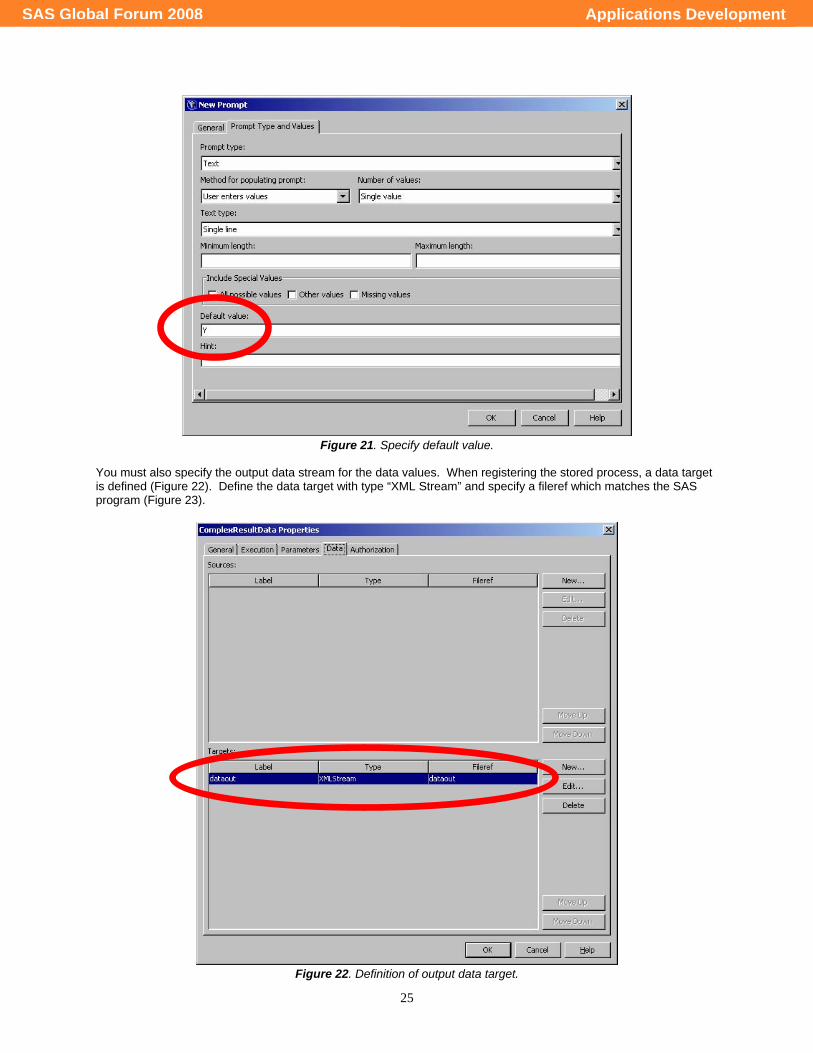
To pass a parameter to control the output programming logic, a hidden parameter is defined (Figure 20) and assigned a default value (Figure 21).
Figure 20. Define hidden parameter.
Applications DevelopmentSAS Global Forum 2008
25
Figure 21. Specify default value.
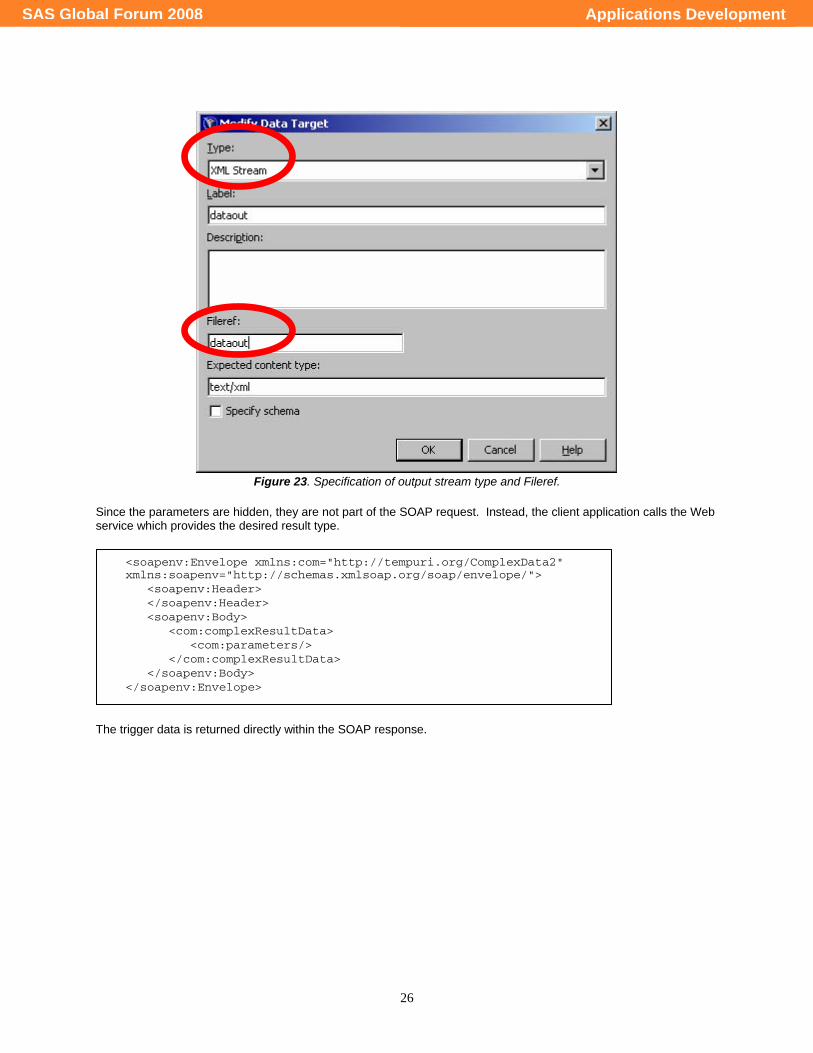
You must also specify the output data stream for the data values. When registering the stored process, a data target is defined (Figure 22). Define the data target with type “XML Stream” and specify a fileref which matches the SAS program (Figure 23).
Figure 22. Definition of output data target.
Applications DevelopmentSAS Global Forum 2008
26
Figure 23. Specification of output stream type and Fileref.
Since the parameters are hidden, they are not part of the SOAP request. Instead, the client application calls the Web service which provides the desired result type.
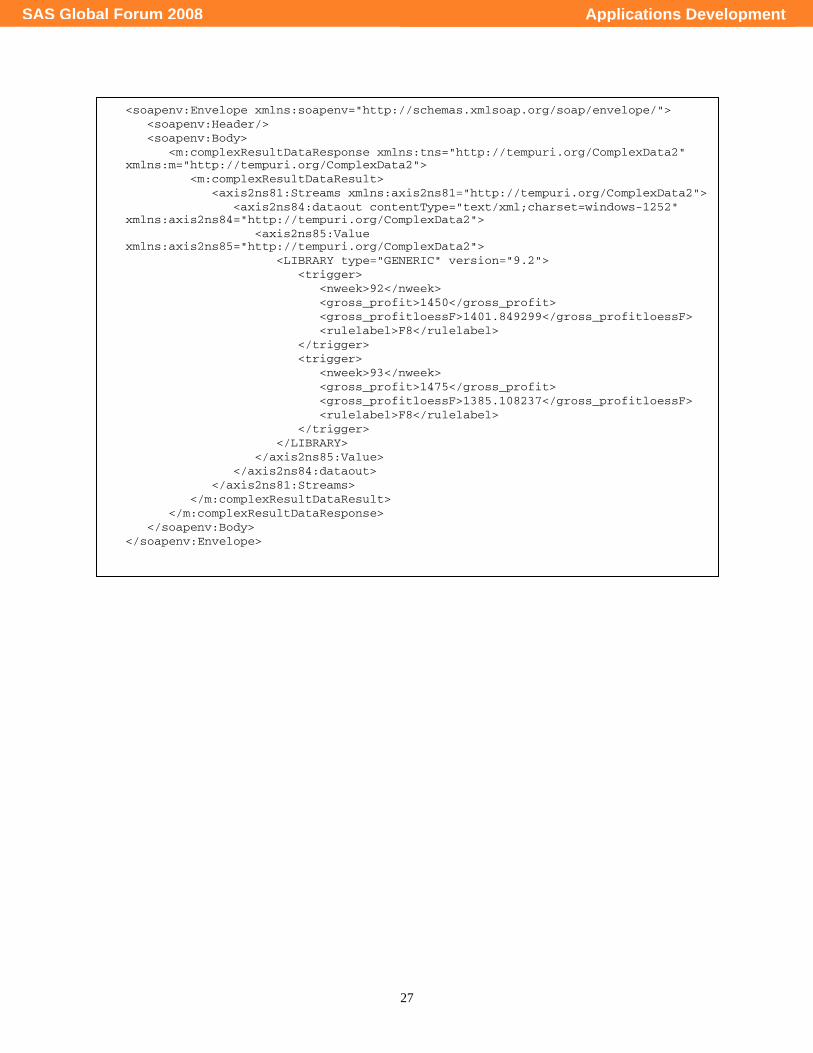
The trigger data is returned directly within the SOAP response.
<soapenv:Envelope xmlns:com="http://tempuri.org/ComplexData2" xmlns:soapenv="http://schemas.xmlsoap.org/soap/envelope/"> <soapenv:Header> </soapenv:Header> <soapenv:Body> <com:complexResultData> <com:parameters/> </com:complexResultData> </soapenv:Body> </soapenv:Envelope>
Applications DevelopmentSAS Global Forum 2008
27
<soapenv:Envelope xmlns:soapenv="http://schemas.xmlsoap.org/soap/envelope/"> <soapenv:Header/> <soapenv:Body> <m:complexResultDataResponse xmlns:tns="http://tempuri.org/ComplexData2" xmlns:m="http://tempuri.org/ComplexData2"> <m:complexResultDataResult> <axis2ns81:Streams xmlns:axis2ns81="http://tempuri.org/ComplexData2"> <axis2ns84:dataout contentType="text/xml;charset=windows-1252" xmlns:axis2ns84="http://tempuri.org/ComplexData2"> <axis2ns85:Value xmlns:axis2ns85="http://tempuri.org/ComplexData2"> <LIBRARY type="GENERIC" version="9.2"> <trigger> <nweek>92</nweek> <gross_profit>1450</gross_profit> <gross_profitloessF>1401.849299</gross_profitloessF> <rulelabel>F8</rulelabel> </trigger> <trigger> <nweek>93</nweek> <gross_profit>1475</gross_profit> <gross_profitloessF>1385.108237</gross_profitloessF> <rulelabel>F8</rulelabel> </trigger> </LIBRARY> </axis2ns85:Value> </axis2ns84:dataout> </axis2ns81:Streams> </m:complexResultDataResult> </m:complexResultDataResponse> </soapenv:Body> </soapenv:Envelope>
Applications DevelopmentSAS Global Forum 2008
28
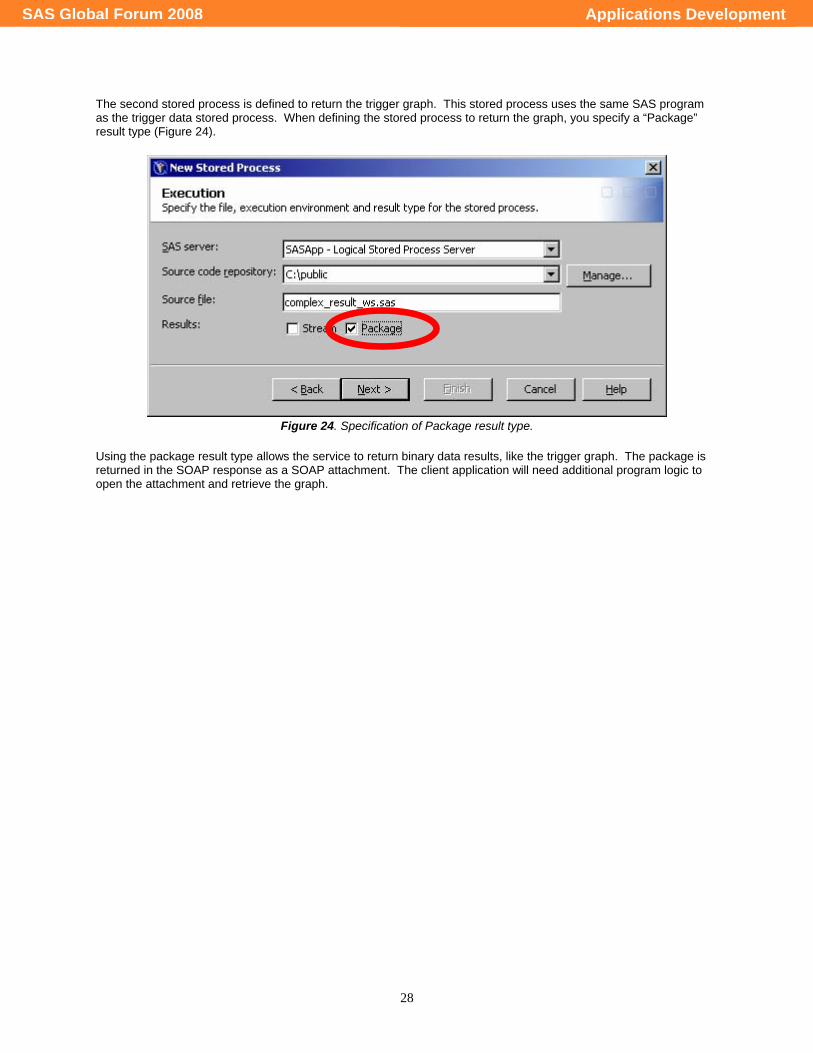
The second stored process is defined to return the trigger graph. This stored process uses the same SAS program as the trigger data stored process. When defining the stored process to return the graph, you specify a “Package” result type (Figure 24).
Figure 24. Specification of Package result type.
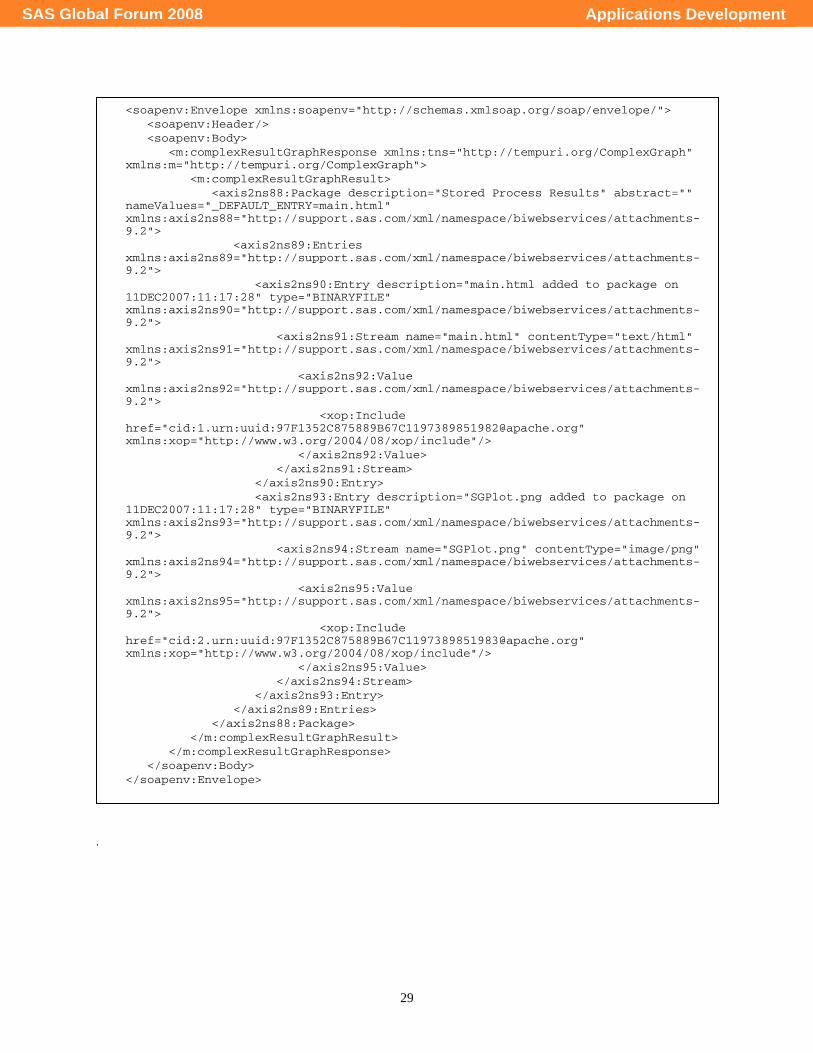
Using the package result type allows the service to return binary data results, like the trigger graph. The package is returned in the SOAP response as a SOAP attachment. The client application will need additional program logic to open the attachment and retrieve the graph.
Applications DevelopmentSAS Global Forum 2008
29
.
<soapenv:Envelope xmlns:soapenv="http://schemas.xmlsoap.org/soap/envelope/"> <soapenv:Header/> <soapenv:Body> <m:complexResultGraphResponse xmlns:tns="http://tempuri.org/ComplexGraph" xmlns:m="http://tempuri.org/ComplexGraph"> <m:complexResultGraphResult> <axis2ns88:Package description="Stored Process Results" abstract="" nameValues="_DEFAULT_ENTRY=main.html" xmlns:axis2ns88="http://support.sas.com/xml/namespace/biwebservices/attachments-9.2"> <axis2ns89:Entries xmlns:axis2ns89="http://support.sas.com/xml/namespace/biwebservices/attachments-9.2"> <axis2ns90:Entry description="main.html added to package on 11DEC2007:11:17:28" type="BINARYFILE" xmlns:axis2ns90="http://support.sas.com/xml/namespace/biwebservices/attachments-9.2"> <axis2ns91:Stream name="main.html" contentType="text/html" xmlns:axis2ns91="http://support.sas.com/xml/namespace/biwebservices/attachments-9.2"> <axis2ns92:Value xmlns:axis2ns92="http://support.sas.com/xml/namespace/biwebservices/attachments-9.2"> <xop:Include href="cid:1.urn:uuid:[email protected]" xmlns:xop="http://www.w3.org/2004/08/xop/include"/> </axis2ns92:Value> </axis2ns91:Stream> </axis2ns90:Entry> <axis2ns93:Entry description="SGPlot.png added to package on 11DEC2007:11:17:28" type="BINARYFILE" xmlns:axis2ns93="http://support.sas.com/xml/namespace/biwebservices/attachments-9.2"> <axis2ns94:Stream name="SGPlot.png" contentType="image/png" xmlns:axis2ns94="http://support.sas.com/xml/namespace/biwebservices/attachments-9.2"> <axis2ns95:Value xmlns:axis2ns95="http://support.sas.com/xml/namespace/biwebservices/attachments-9.2"> <xop:Include href="cid:2.urn:uuid:[email protected]" xmlns:xop="http://www.w3.org/2004/08/xop/include"/> </axis2ns95:Value> </axis2ns94:Stream> </axis2ns93:Entry> </axis2ns89:Entries> </axis2ns88:Package> </m:complexResultGraphResult> </m:complexResultGraphResponse> </soapenv:Body> </soapenv:Envelope>
Applications DevelopmentSAS Global Forum 2008
30
CONCLUSION We have shown how SAS now supports Contract-First (by allowing you to describes the inputs and outputs of a stored process in schema) and Code-First (by using input prompts and output parameters) development. These features, along with attachment support, provide all the features you need and enable you to extend the reach of the powerful analytics of your SAS programs. There are trade-offs between ease of use (code-first) and power/flexibility (contract-first); and in convenience of data access (sending data in the message) vs. data throughput performance (accessing data directly in the Data interoperability layer.) There are some areas we did not explore and we hope to cover in a future paper, such as what are the performance implications of each approach; what are the data limits of message based technologies such as Web services; how do you deal with long-running jobs (you can adjust timeouts in the Web container and will also need to do that in some clients); and how will new technologies such as binary XML change these trade-offs. The roadmap for moving forward should now be clear: describe your SAS programs as stored processes; then enable interoperability by deploying stored processes as Web services.
REFERENCES Zhang, Rodger. 2007. “OLS Regression? Auto-Regression? Dynamic Regression? A Practical Modeling Example in Financial Industry.” Proceedings of the SAS Global Forum 2007 Conference. Cary, NC: SAS Institute Inc. Powers, Keiko; Jay, Michael; and Gao, Tie. 2003. “Application of the LOESS Procedure for Monitoring and Detecting Critical Movements in the US Automobile Market.” Proceedings of the 28th Annual SAS Users Group International Conference. Cary, NC: SAS Institute Inc.
ACKNOWLEDGMENTS The authors would like to thank Tony Dean for his help in reviewing this paper.
RECOMMENDED READING Svolba, Gerhard. 2006. Data Preparation for Analytics Using SAS. Cary, NC: SAS Institute Inc.
CONTACT INFORMATION Your comments and questions are valued and encouraged. Contact the authors at:
Brad Klenz SAS Institute Inc. SAS Campus Dr. Cary, NC 27513 919-677-8000 [email protected]
Dan Jahn SAS Institute Inc. SAS Campus Dr. Cary, NC 27513 919-677-8000 [email protected]
SAS and all other SAS Institute Inc. product or service names are registered trademarks or trademarks of SAS Institute Inc. in the USA and other countries. ® indicates USA registration. Other brand and product names are trademarks of their respective companies.
Applications DevelopmentSAS Global Forum 2008