Embed Size (px)
Citation preview
Clough Global Dividend and Income Fund
Visit Ü www.cloughglobal.com or 1-877-256-8445
MONTHLYUPDATE
03.2018
Global Securities Holdings % of Total Portfolio^
United States 70.78%China 7.95%India 7.23%U.S. Multinationals^^ 6.62%United Kingdom 2.39%Japan 1.85%France 1.75%Germany 1.27%Singapore 1.07%Other -0.91%
^ Includes securities sold short, notional value of futures/total return swaps, and cash balances.
^^ U.S. Multinational Corporations - has more than 50% of revenues derived outside of the U.S.
Geographic Exposure†
Long Short Gross NetUnited States 111.3% -4.1% 115.4% 107.2%China 12.0% 0.0% 12.0% 12.0%India 11.7% -0.8% 12.5% 10.9%U.S. Multinationals^^ 14.7% -4.7% 19.4% 10.0%United Kingdom 3.6% 0.0% 3.6% 3.6%Japan 3.3% -0.5% 3.8% 2.8%France 2.7% 0.0% 2.7% 2.7%Germany 2.5% -0.6% 3.1% 1.9%Singapore 1.6% 0.0% 1.6% 1.6%Other 0.8% -2.2% 3.0% -1.4%Total 164.2% -12.9% 177.1% 151.3%
† % of NAV. Includes securities sold short, notional value of futures/total returns swaps, and cash balances.
^^ U.S. Multinational Corporations - has more than 50% revenue derived outside of the U.S.
Sectors % of Total Equity Related^^^
Financials 54.05%Information Technology 19.11%Consumer Discretionary 15.92%Industrials 9.85%Health Care 7.97%Closed-End Funds 3.92%Telecommunication Services 3.74%Energy 3.08%Consumer Staples 1.24%
118.88%
% of Total Equity Related (Short)^^^
Health Care -0.53%Energy -0.85%Industrials -1.08%Financials -1.88%Materials -4.36%Information Technology -10.18%
-18.88%100.00%
^^^ Includes notional value of total return swaps.
Portfolio DataTotal Assets $163,417,377Total Number of Holdings 172NYSE Amex Symbol GLVNAV Symbol XGLVXCommon Shares Outstanding 7.01 millionNAV $13.73Market Price $12.47Distribution Rate* 11.28%Leverage Ratio** 33.66%
* Distribution rate calculation is based on most current dividend rate per share of $0.1172 annualized and divided by 03/31/2018 market price of $12.47. The fixed monthly amount distributed per share is subject to change at the discretion of the Fund’s Board of Trustees.Sources of distributions to shareholders may include net investment income, net realized short-term capital gains, net realized long-term capital gains and return of capital. Based on current estimates, we anticipate the current distribution has been paid from net realized short-term and long-term capital gains. The actual amounts and sources of the amounts for tax reporting purposes will depend upon the Fund’s investment experience during the remainder of its fiscal year and may be subject to changes based on tax regulations. If a distribution includes anything other than net investment income, the fund provides a Section 19(a) notice of the best estimate of its distribution sources at that time, available at www.cloughglobal.com. These estimates may not match the final tax characterization (for the full year’s distributions) contained in shareholders’ 1099-DIV forms after the end of the year. Distribution payments are not guaranteed; distribution rates will vary.
** Total principal and interest outstanding on credit facility divided by total assets of the fund.
Performance (as of 03/31/18)
Total Return NAV Market Price
50% Barclays U.S. Aggregate Index / 50% MSCI World
1 Year 7.41% 3.95% 7.62%3 Year*** 2.53% 4.35% 4.98%5 Year*** 5.44% 6.42% 6.13%Since Inception*** 6.95% 5.85% 6.35%
***Annualized Fund. Inception July 28, 2004.
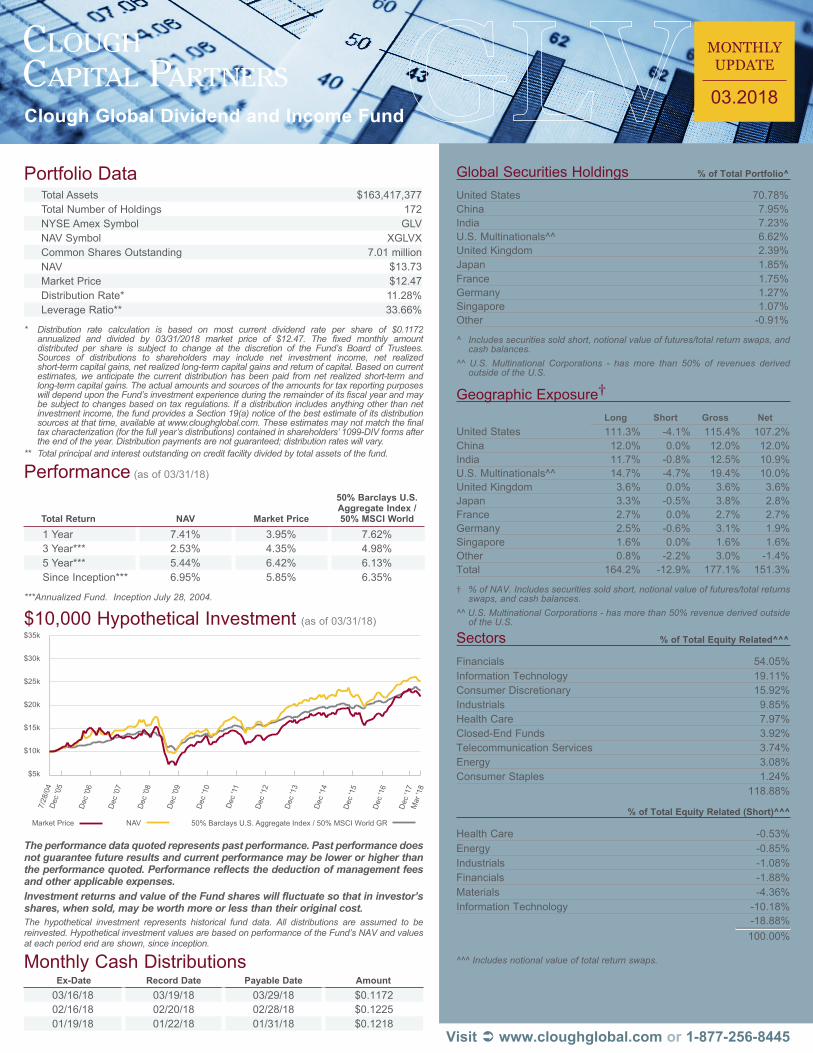
$10,000 Hypothetical Investment (as of 03/31/18)
The performance data quoted represents past performance. Past performance does not guarantee future results and current performance may be lower or higher than the performance quoted. Performance reflects the deduction of management fees and other applicable expenses.Investment returns and value of the Fund shares will fluctuate so that in investor’s shares, when sold, may be worth more or less than their original cost.The hypothetical investment represents historical fund data. All distributions are assumed to be reinvested. Hypothetical investment values are based on performance of the Fund’s NAV and values at each period end are shown, since inception.
Monthly Cash DistributionsEx-Date Record Date Payable Date Amount
03/16/18 03/19/18 03/29/18 $0.117202/16/18 02/20/18 02/28/18 $0.122501/19/18 01/22/18 01/31/18 $0.1218
$5k
$10k
$15k
$20k
$25k
$30k
$35k
NAV 50% Barclays U.S. Aggregate Index / 50% MSCI World GRMarket Price
Dec
'11
Dec
'10
Dec
'09
Dec
'08
Dec
'07
Dec
'05
Dec
'06
7/28
/04
Dec
'12
Dec
'13
Dec
'15
Dec
'16
Dec
'17
Mar
'18
Dec
'14
Clough Global Dividend and Income Fund
MONTHLYUPDATE
03.2018
Risks An investor should consider investment objectives, risks, charges and expenses carefully before investing. To obtain an annual report or semi-annual report which contains this and other information visit www.cloughglobal.com or call 1-877-256-8445. Read them carefully before investing. 3 Credit quality is a measure of a bond issuer’s ability to repay interest and principal in a timely
manner. The credit ratings shown are based on each portfolio security’s rating as provided by Standard and Poor’s, Moody’s Investors Service and/or Fitch Ratings, Ltd. and typically range from AAA (highest) to D (lowest). For this purpose, if two or more of the agencies have assigned differing ratings to a security, the highest rating is used. Securities that are unrated by all three agencies are reflected as such. The credit quality of the investments in the Fund’s portfolio does not apply to the stability or safety of the Fund. These ratings are updated monthly and may change over time. Please note, the Fund itself has not been rated by an independent rating agency. Mortgage-Backed Securities are classified as unrated.
This fact sheet is provided for informational purposes only and is not an offer to purchase or sell shares. The Clough Global Dividend and Income Fund is a closed-end fund, which is traded on the New York Stock Exchange AMEX, and does not continuously issue shares for sale as open-end mutual funds do. The market price of a closed-end fund is based on the market’s value.S&P 500® Index: Broad-based measurement of changes in stock market conditions based on the average performance of 500 widely held common stocks commonly known as the Standard & Poor’s 500® or S&P 500®. Index is unmanaged. It is not possible to invest directly in an index.Barclay’s U.S. Aggregate Bond Index - a broad-based benchmark that measures the investment grade, U.S. dollar-denominated, fixed-rate taxable bond market, including Treasuries, government-related and corporate securities, MBS (agency fixed-rate and hybrid ARM pass-throughs), ABS, and CMBS. It is not possible to invest directly in an index.MSCI World Index - MSCI’s market capitalization weighted index is composed of companies representative of the market structure of 22 developed market countries in North America, Europe, and the Asia/Pacific Region. It is not possible to invest directly in an index.The MSCI information may only be used for your internal use, may not be reproduced or redisseminated in any form and may not be used as a basis for or a component of any financial instruments or products or indices. None of the MSCI information is intended to constitute investment advice or a recommendation to make (or refrain from making) any kind of investment decision and may not be relied on as such. Historical data and analysis should not be taken as an indication or guarantee of any future performance analysis, forecast or prediction. The MSCI information is provided on an “as is” basis and the user of this information assumes the entire risk of any use made of this information. MSCI, each of its affiliates and each other person involved in or related to compiling, computing or creating any MSCI information (collectively, the “MSCI Parties”) expressly disclaims all warranties (including, without limitation, any warranties of originality, accuracy, completeness, timeliness, non-infringement, merchantability and fitness for a particular purpose) with respect to this information. Without limiting any of the foregoing, in no event shall any MSCI Party
have any liability for any direct, indirect, special, incidental, punitive, consequential (including, without limitation, lost profits) or any other damages. (www.msci.com)The net asset value (NAV) of a closed-end fund is the market value of the underlying investments (i.e., stocks and bonds) in the fund’s portfolio, minus liabilities, divided by the total number of fund shares outstanding. However, the fund also has a market price; the value at which it trades on an exchange. This market price can be more or less than its NAV.The Fund’s distribution policy may, under certain circumstances, have certain adverse consequences to the Fund and its shareholders because it may result in a return of capital resulting in less of a shareholder’s assets being invested in the Fund and, over time, increase the Fund’s expense ratio.The Fund’s investments in securities of foreign issuers are subject to risks not usually associated with owning securities of U.S. issuers. These risks can include fluctuations in foreign currencies, foreign currency exchange controls, social, political and economic instability, differences in securities regulation and trading, expropriation or nationalization of assets, and foreign taxation issues. The Fund’s investments in preferred stocks and bonds of below investment grade quality (commonly referred to as ‘‘high yield’’ or ‘‘junk bonds’’), if any, are predominantly speculative because of the credit risk of their issuers. Any investment by the Fund in REITs will subject it to various risks. The first, real estate industry risk, is the risk that the REIT share prices will decline because of adverse developments affecting the real estate industry and real property values. In general, real estate values can be affected by a variety of factors, including supply and demand for properties, the economic health of the country or of different regions, and the strength of specific industries that rent properties. The second, investment style risk, is the risk that returns from REITs—which typically are small or medium capitalization stocks—will trail returns from the overall stock market. The third, interest rate risk, is the risk that changes in interest rates may hurt real estate values or make REIT shares less attractive than other income-producing investments. Credit risk is the risk that an issuer of a preferred or debt security will become unable to meet its obligation to make dividend, interest and principal payments. Interest rate risk is the risk that preferred stocks paying fixed dividend rates and fixed-rate debt securities will decline in value because of changes in market interest rates. When interest rates rise the market value of such securities generally will fall. Derivative transactions (such as futures contracts and options thereon, options, swaps and short sales) subject the Fund to increased risk of principal loss due to imperfect correlation or unexpected price or interest rate movements. Compared to investment companies that focus only on large capitalization companies, the Fund’s share price may be more volatile because it also invests in small and medium capitalization companies.Fund Inception July 28, 2004.ALPS Portfolio Solutions Distributor, Inc., FINRA Member Firm.Clough Capital Partners, LP is the Investment Adviser.
CLO001374 5/31/18 Sponsor
Asset Allocation1
% of Total Portfolio Avg. Coupon2
Common Stock - US 23.08%Common Stock - Foreign 14.95%Exchange Traded Funds -0.38%Participation Notes 1.00%Total Return Swap Contracts 6.47%
Total Equities 45.12%Corporate Debt 29.42% 3.12%Government L/T 8.25% 3.28%Asset/ Mortgage Backed 5.35% 2.67%Preferred Stock 4.17% 7.24%
Total Fixed Income 47.19%Short-Term Investments 7.03%Other (Cash) 0.66%
Total Investments 100.00%1 Includes securities sold short. 2 For fixed income positions only.
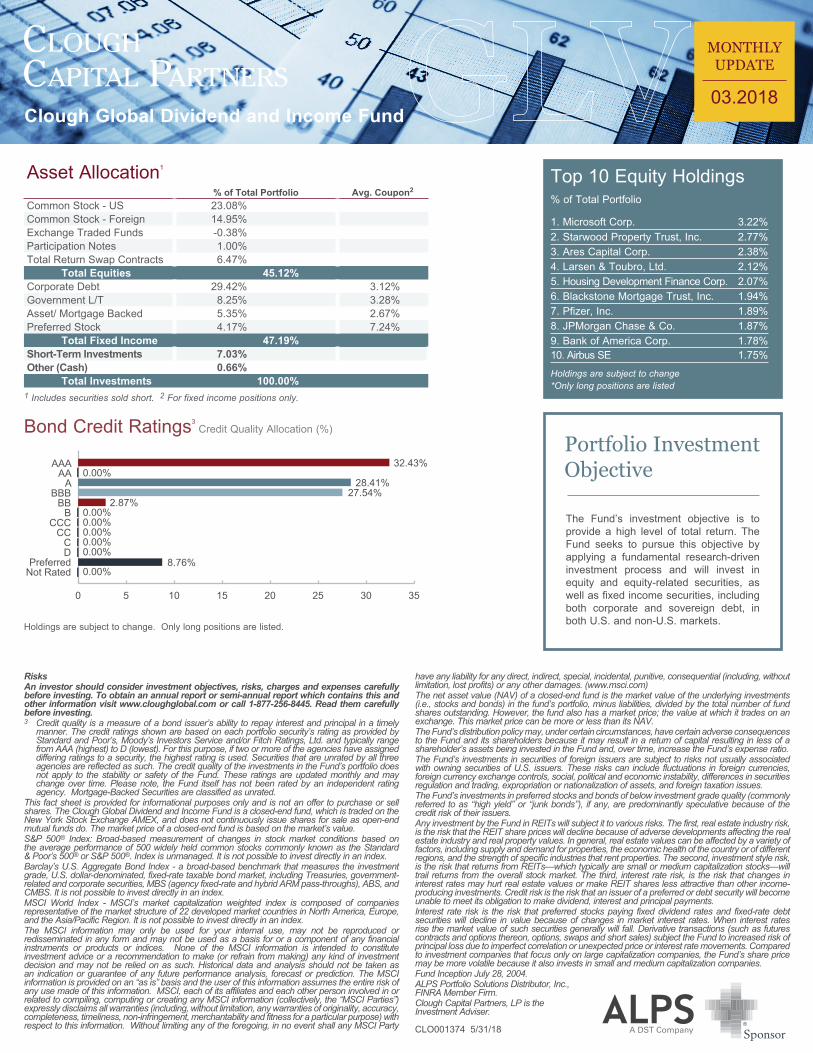
Bond Credit Ratings3 Credit Quality Allocation (%)
0 5 10 15 20 25 30 35
AAAAA
ABBB
BBB
CCCCC
CD
Not RatedPreferred
32.43%
0.00%
0.00%
2.87%
0.00%0.00%0.00%0.00%
0.00%8.76%
27.54%28.41%
Holdings are subject to change. Only long positions are listed.
Portfolio Investment Objective
The Fund’s investment objective is to provide a high level of total return. The Fund seeks to pursue this objective by applying a fundamental research-driven investment process and will invest in equity and equity-related securities, as well as fixed income securities, including both corporate and sovereign debt, in both U.S. and non-U.S. markets.
Top 10 Equity Holdings% of Total Portfolio
1. Microsoft Corp. 3.22%2. Starwood Property Trust, Inc. 2.77%3. Ares Capital Corp. 2.38%4. Larsen & Toubro, Ltd. 2.12%5. Housing Development Finance Corp. 2.07%6. Blackstone Mortgage Trust, Inc. 1.94%7. Pfizer, Inc. 1.89%8. JPMorgan Chase & Co. 1.87%9. Bank of America Corp. 1.78%10. Airbus SE 1.75%
Holdings are subject to change*Only long positions are listed