Embed Size (px)
Citation preview

IEEE TRANSACTIONS ON INTELLIGENT TRANSPORTATION SYSTEMS, VOL. 5, NO. 4, DECEMBER 2004 267
Spatial–Temporal Traffic Data Analysis Based onGlobal Data Management Using MAS
He-Sheng Zhang, Yi Zhang, Member, IEEE, Zhi-Heng Li, Member, IEEE, and Dong-Cheng Hu
Abstract—The spatial–temporal traffic data analysis basedon global data management is a newly developed and crucialapproach to help traffic managers having the global view of urbantraffic status in the level of road network, which is very clearlyuseful in traffic control and route guidance. The multiagentsystems are used in traffic data management with full consider-ation of the characteristics of traffic data and the cooperationand workflow among them. In software implementation of datamanagement, the agent-based common object request brokerarchitecture is adopted taking the distributed urban traffic data inthe large area under network environments into account. Based onthe global traffic data, the approach of visualized spatial-temporalanalysis is then induced. The similarity of traffic data is analyzedfirst for each link and its profile is achieved to undertake theprimary processing of urban traffic data. Furthermore, analysisresults are shown on the basis of the geographic informationsystems for transportation. The two types of visualization, pseu-docolor and contour maps, are adopted in the demonstration todisplay the traffic status graphically and its changing frames.Among the applications in some big cities in China, the case ofurban traffic analysis for Beijing is studied to demonstrate theimplementation of the approach.
Index Terms—Data management, multiagent systems (MASs),spatial–temporal data analysis, visualization.
I. INTRODUCTION
AN URBAN transportation system is a man-involved andtime-variable complex system, in which substantial data
are collected, monitored, and maintained. Because traffic data isdynamic with time and related to the location, the spatial–tem-poral attribute [1], describing the time and location of the col-lected data, is one of the fundamental attributes of traffic data.It leads to spatial–temporal analysis for the urban traffic impor-tant, especially analyzing traffic parameters, such as speed, flow,occupancy, and congestion, and showing the graphical anal-ysis results, which are very welcome by urban traffic managers.In fact, the analysis can provide, in a real-time way, the timesimilarity and spatial distribution similarity, traffic patterns andevolving tendency, and traffic status and its prediction in sub-stantial traffic data. All are very useful for traffic control androute guidance, which is indeed involved explicitly in all pro-cesses of urban traffic control and route guidance.
Manuscript received November 30, 2003; revised July 31, 2004. This workwas supported by the National Natural Science Foundation of China underProject 60374059. The Associate Editor for this paper was S. Tang.
The authors are with the Department of Automation, Tsinghua University,Beijing 100084, China (e-mail: [email protected]; [email protected]).
Digital Object Identifier 10.1109/TITS.2004.837816
Fig. 1. Traffic data analysis in traffic management.
The processes of urban traffic control and management aresummarized in Fig. 1, where three loops are displayed to rep-resent the different levels in traffic data analysis [2]. Loop 1 isthe local intersection control loop, in which some parameter op-timization methods used for traffic control are realized in thelocal controller. Loop 2 represents integrated computer controlfor regional parameter optimization based on the comprehen-sive spatial–temporal traffic data analysis, which provides notonly traffic control, but also route guidance (see the dashed linein Fig. 1). Loop 3 is the man-involved process in which trafficmangers adjust control parameters or issue route-guidance com-mands based on a global traffic status evaluation from the com-prehensive data analysis. Thus, the urban traffic analysis in thelevel of road network is very helpful and useful for traffic con-trol and management.
With the enlargement of coverage and the functions of theurban transportation system, some traffic systems, more thanSCOOT and SCATS, will be installed in the same city. Thatis, the urban traffic-control center in a city may be constructedcombining more than one traffic system. In this case, the basisof the global analysis for the urban traffic status is the trafficdata in the level of road network, which requires that the datain the large area is managed in the designed scheme, such thatthe data collected and stored in the different format in the dif-ferent traffic systems can be shared and semantically under-stood by each other. Furthermore, the spatial–temporal trafficdata analysis involves many other kinds of data in different sys-tems, such as data in the traffic-control system (TCS), data in thegeographic information systems (GISs), data in the anomaloustraffic system (ATS), and so on. These data [3] are distributedin the different computers and locations, and are also heteroge-neous in different data formats, developing environments, andoperation systems. In order to make the comprehensive trafficdata analysis and the global traffic-status evaluation, many kindsof data in different systems should be communicated and ex-changed, and should have the same sense.
1524-9050/04$20.00 © 2004 IEEE

268 IEEE TRANSACTIONS ON INTELLIGENT TRANSPORTATION SYSTEMS, VOL. 5, NO. 4, DECEMBER 2004
Thus, the globally distributed and heterogeneous trafficdata management is a fundamental problem in research. It hasbeen proven that the multiagent systems (MASs) can be anefficient tool to solve the problems of data management in thedistributed environment. They have been applied successfullyin many fields, such as bus-holding coordination in a transitnetwork [4], a transportation management and route-guidancesystem [5], modeling driver route choice behavior [6], a digitallibrary [7], and so on. In [4], the MAS use the negotiation algo-rithms to determine the optimal dispatching times. In [5], thecooperative MAS representing network managers, informationservice providers, and drivers equipped with route-guidancesystems negotiate each other to manage roadway networkcongestion. In [6], an agent-based route-choice decision modelunder the influence of real-time traffic information is provided.In [7], the mobile and stationary agents are used to providefunctions such as discovering new sources of interest. In thesepapers, the MASs are used in the distributed and heterogeneousenvironment, which shows the similar problems in traffic datamanagement, so the MAS can be used in global traffic datamanagement.
When using the MAS in traffic data management, however,the special characteristics of traffic data should be consid-ered. As we know, traffic data are distributed, heterogeneous,autonomous, and dynamic [3]. In addition, the security, scal-ability, and robustness are also important. Therefore, in theglobal traffic data management, the tasks of the MAS includeeliminating the difference among the distributed and heteroge-neous traffic data, keeping the autonomy of traffic data system,refreshing the dynamic data in a real-time way, and providingthe security and scalability mechanism. These tasks of theglobal data management make the design and development ofthe MAS complex and special.
In addition, due to the urban traffic data developed and dis-tributed in the different systems in the large area via the remotenetworks and, moreover, considering the scalability of the trafficdata, the common object request broker architecture (CORBA)specifications have been adopted in the software implementa-tion of global data management to deal with the description andsharing of all traffic data collected and stored in the differentformat in the different traffic systems.
Another important issue is that the result of traffic dataanalysis should be convenient to use and easy to perceive andinterpret. Visualization is a useful tool to display the trafficparameters, status, and analysis results. Then, the geographicinformation systems for transportation (GIS-T) [8] are usefulplatform to show the spatial–temporal traffic data and theiranalysis results. In addition, the pseudocolor and contour mapscan also be adopted to display the global analysis results explic-itly, which indeed satisfies the requirements for the potentialanalysis to make global evaluation and are very welcome bythe traffic managers in practices.
Therefore, using the MAS for global traffic data managementand the combination GIS-T with the pseudocolor and contourmaps to show the analysis results are two contributions to thespatial–temporal traffic data analysis globally.
This paper is organized as follows. The problem descriptionfor the global traffic data management and the spatial–temporal
Fig. 2. Distribution of traffic data via network.
traffic data analysis are described in Section II. The design andimplementation of MAS are provided in Section III. The ap-proach of spatial–temporal analysis and its visualized methodare explored in Section IV. Finally, the conclusion is summa-rized in Section V.
II. PROBLEM DESCRIPTION
From the point of view of the traffic data analysis, the trafficdata are hierarchical and, thus, the traffic data used for anal-ysis should be collected from the same level and have the samephysical meanings. Let us take the data from the SCOOT sys-tems currently running in a Beijing, China, traffic-managementcenter as an example. The raw data collected from all detectorsare located on bottom level, from which the data on the link iscalculated as the comprehensive values. It represents the trafficstatus in the single direction. The data on the node level to rep-resent the traffic status on the specific intersection is the sumof traffic status with the values collected from each direction.The regional-level data are finally produced from the traffic datain all nodes in the area. Therefore, the global spatial–temporaltraffic data analysis needs data from different nodes and levels.
It is known that the local area network (LAN) and wide areanetwork (WAN) are essential for the traffic data communication[3]. That is, all traffic data distributed in different sites are trans-ferred by either LAN in a traffic control center (TCC) or WANin a big city, which is outlined and shown in Fig. 2, where thetraffic systems certainly involve the different data models andoperation systems.
Therefore, in order to analyze the spatial–temporal trafficdata, the following issues in global data management should beconsidered:
• searching the needed traffic data and eliminating the het-erogeneity in order to analyze the traffic status globally;
• refreshing the dynamic traffic data in time to analyze thetraffic data in a real-time way;

ZHANG et al.: SPATIAL–TEMPORAL TRAFFIC DATA ANALYSIS BASED ON GLOBAL DATA MANAGEMENT USING MAS 269
• developing a mechanism for the communication to guar-antee accesses to all heterogeneous data with a fullunderstanding;
• providing the security mechanism and authorizing thetraffic user properly in order to manage traffic data safely.
From the practices in China, the approach using the visualiza-tion to show the global analysis results is welcome by the trafficmanagers. With the consideration of a spatial–temporal attributefor urban traffic data, the GIS-T are then added as the platformfor showing a spatial–temporal analysis result. The geographicmap is introduced here to fuse the relative data and the interestedplaces or regions. In this case, some solutions must be designedto deal with the following tasks for the spatial–temporal globalanalysis and its display:
• data fusion based on the combination of a spatial–temporaltraffic data in TCC with the geographic map in GIS-T;
• visualization method of the traffic data analysis resultusing global traffic data.
To resolve these problems, the MAS are used in global trafficdata management and the pseudocolor and contour maps com-bining with GIS-T to show the analysis results are used.
III. MASS FOR DATA MANAGEMENT
The MAS are a set that is made up of many computable agents[9]. Intelligent agents are software modules equipped with ar-tificial intelligence mechanisms that are capable of achievingspecific goals independently or in cooperation with other agents[10]. Using MAS for traffic data management, architecture, co-operation, and workflow, the software implementation shouldbe considered first.
A. Distributed MAS Architecture
Generally, there are three main types of agent architecture:deliberative, reactive, and hybrid. The deliberative architecturecontains an explicitly represented symbolic model of the world.However, the representation or reasoning problems are difficultto be solved. The reactive architecture responds to the inputquickly, but it does not include any kind of central symbolicworld model and complex symbolic reasoning, so it does notfit for a complex environment. The hybrid architecture com-bines the classical deliberative with the reactive approaches.The hybrid architecture includes two parts: a deliberative onecontaining a symbolic world model, which develops planningand makes decisions, and a reactive one, which is capable ofreacting to events that occur in the environment without en-gaging in complex reasoning. Often, the reactive component isgiven by some kinds of precedence over the deliberative one, sothat it can provide a rapid response to important environmentalevents. Considering the features of traffic data management andthe real-time constraint, the agent adopted here should be in thehybrid architecture with the characteristics from both the delib-erative architecture and reactive architecture.
Then, the MAS for the distributed traffic data managementcan then be formed as illustrated in Fig. 3, where two kinds ofagents in MAS are described as the user interface agent (UIA)and the local information agent (LIA).
Fig. 3. Distributed MAS architecture.
The UIA is designed to be primarily responsible for sup-porting the users, traffic managers, or other agents in searchingthe needed data; for example, understanding and modeling theusers’ intention; locating the searching data and data-access au-thorization; communicating messages with other agents; pre-senting and interpreting the results of the task; and so on. Fourmodules are needed in UIA, including the user request module(URM), user task module (UTM), user planning module (UPM),and retrieval result module (RRM).
LIA is responsible for a given data system and performsvarious functions associated with that data system, such as dataretrieval, data description, data refreshing, data-access autho-rization, understanding and decomposing tasks, data fusion,and communication with other agents. LIA is composed offive modules: local security module (LSM), local task module(LTM), local retrieval module (LRM), local managementmodule (LMM), and local planning module (LPM).
B. MAS Cooperation and Workflow
The coordination among agents requires knowing the agents’tasks and their environment. In global traffic data management,the coordination behaviors can be divided into specification andscheduling.
Specification can create the shared goals, subdivide thesegoals into tasks, and so on. For example, if the manager wantsto know the rush hour of a certain link, there is the coordinationto be active between the agents in the TCS and the GIS. Theagent can decompose the task into two subtasks to find data inTCS and in GIS.
Scheduling can assign tasks to the multiple agents or singleagent, can create the shared plans and schedules, can allocateresources, etc. For example, if several tasks come into the agentin GIS or TCS at the same time or in a short time, the agenthas the ability to schedule and allocate the resources under theoptimization of time and efficiency.
The components of agent and the cooperation mechanismamong agents are shown in Fig. 4. To help understand the agentcooperation, a MAS workflow for a practical example is givenin Fig. 5.

270 IEEE TRANSACTIONS ON INTELLIGENT TRANSPORTATION SYSTEMS, VOL. 5, NO. 4, DECEMBER 2004
Fig. 4. MAS components and its cooperation.
Fig. 5. MAS workflow.
Consider that a user or manager wants to know the trafficflow in a certain link or an anomalous traffic in some regions ina city. A query could be generated and is sent to the user requestmodule in UIA. URM should understand the user’s intention,check the authorized level, and translate it into the agent’s pos-sible task steps. Then, the URM dispatches the steps to UTM. Ifadditional information is needed, the URM sends a message toRRM to ask the user for the additional information. When theUTM receives the tasks from URM, it translates them into theagent’s different tasks and finds related LIA in the network. Ifcooperation is needed or the task is fuzzy, the UTM will sendmessages to the UPM. The UPM schedules the resource andcommunicates with other agents. In this example, the UTM willfind the data in GIS, TCS, and ATS, so the related LIA are lo-cated in the GIS, TCS, and ATS. In addition, the UPM willallocate a main LIA according to the task and the resource andefficiency. Then, UPM sends tasks to the main LIA.
In the information source, the tasks are received by the localsecurity module in main LIA, which allocates a security-leveldetermining of the range with which data can be accessed in the
local database, based on the site from which tasks came. Theauthorized tasks are sent to LTM in LIA. The LTM understandsthe tasks and translate user’s task into the local retrieval sub-tasks and sends the message to the LPM. The LPM will makeplanning of the task, assigning of the resource, and communi-cation with other agent available if necessary. In this example,the LPM will cooperate with the LIA in TCS and ATS. If theadditional information is needed, the LTM will send message tothe UPM.
The retrieval work is translated into the executable codes inLRM after receiving the work from the LPM and performingthe work. The retrieval result is sent to LMM. In addition, theretrieval results from the LMM in other cooperation with LIAare integrated in the LMM of the main LIA and the integratedinformation is transmitted to the RRM in UIA. At the same time,LMM informs the LTM to record the tasks and results.
C. Software Implementation
It has been known that the traffic data management is underthe network environment and involves distributed object com-puting. In order to eliminate the differences of network protocoland data format in data exchange and, in addition, consideringthe scalability and robustness of data management, a commonspecification should be introduced here to guarantee the uniformdata description and to understand and exchange specific urbantraffic data collected and stored in the distributed and heteroge-neous traffic systems.
CORBA [11]–[14], provided by the object managementgroup (OMG) is one of the commonly used standards or ar-chitecture for the middleware platform for distributed objectcomputing environments. Because of the separation of interfacefrom implementation, enabled by OMG interface definitionlanguage (IDL), CORBA enables interoperability in heteroge-neous data systems such as different programming languages,different operating systems, and different communicationprotocols. It also separates an object definition from its imple-mentation and provides a platform independent interface thataids the portability of code. The object request broker (ORB)that is used in client–server interaction provides many services,
ZHANG et al.: SPATIAL–TEMPORAL TRAFFIC DATA ANALYSIS BASED ON GLOBAL DATA MANAGEMENT USING MAS 271
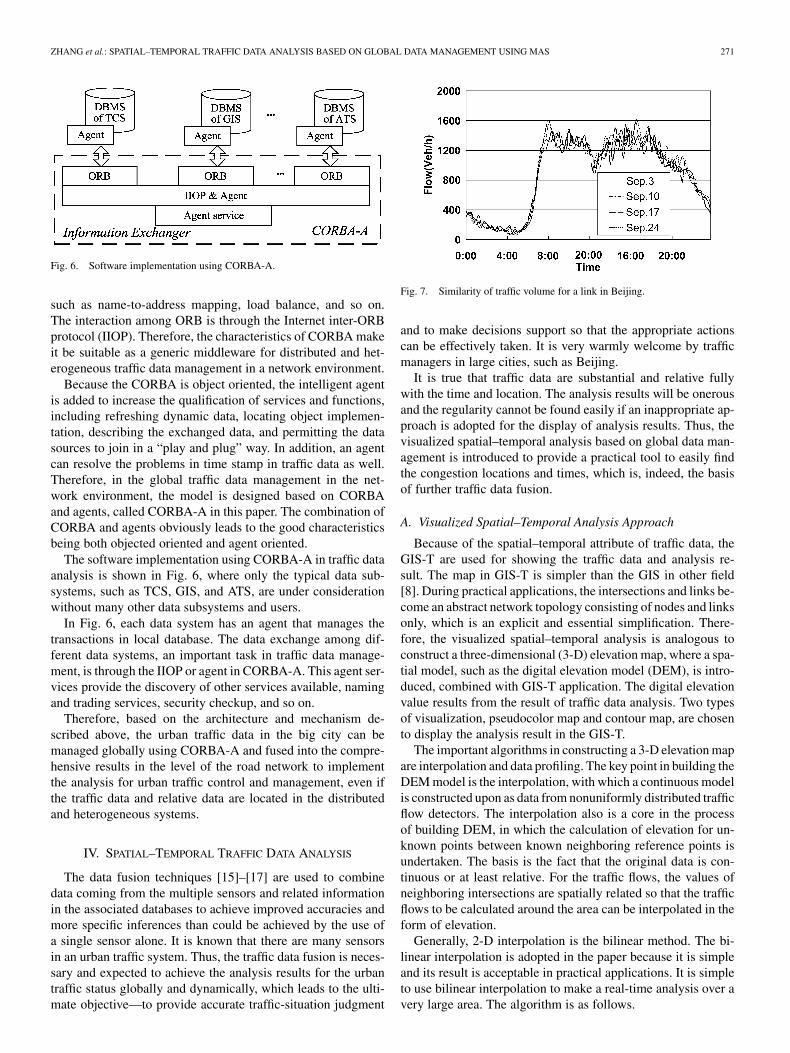
Fig. 6. Software implementation using CORBA-A.
such as name-to-address mapping, load balance, and so on.The interaction among ORB is through the Internet inter-ORBprotocol (IIOP). Therefore, the characteristics of CORBA makeit be suitable as a generic middleware for distributed and het-erogeneous traffic data management in a network environment.
Because the CORBA is object oriented, the intelligent agentis added to increase the qualification of services and functions,including refreshing dynamic data, locating object implemen-tation, describing the exchanged data, and permitting the datasources to join in a “play and plug” way. In addition, an agentcan resolve the problems in time stamp in traffic data as well.Therefore, in the global traffic data management in the net-work environment, the model is designed based on CORBAand agents, called CORBA-A in this paper. The combination ofCORBA and agents obviously leads to the good characteristicsbeing both objected oriented and agent oriented.
The software implementation using CORBA-A in traffic dataanalysis is shown in Fig. 6, where only the typical data sub-systems, such as TCS, GIS, and ATS, are under considerationwithout many other data subsystems and users.
In Fig. 6, each data system has an agent that manages thetransactions in local database. The data exchange among dif-ferent data systems, an important task in traffic data manage-ment, is through the IIOP or agent in CORBA-A. This agent ser-vices provide the discovery of other services available, namingand trading services, security checkup, and so on.
Therefore, based on the architecture and mechanism de-scribed above, the urban traffic data in the big city can bemanaged globally using CORBA-A and fused into the compre-hensive results in the level of the road network to implementthe analysis for urban traffic control and management, even ifthe traffic data and relative data are located in the distributedand heterogeneous systems.
IV. SPATIAL–TEMPORAL TRAFFIC DATA ANALYSIS
The data fusion techniques [15]–[17] are used to combinedata coming from the multiple sensors and related informationin the associated databases to achieve improved accuracies andmore specific inferences than could be achieved by the use ofa single sensor alone. It is known that there are many sensorsin an urban traffic system. Thus, the traffic data fusion is neces-sary and expected to achieve the analysis results for the urbantraffic status globally and dynamically, which leads to the ulti-mate objective—to provide accurate traffic-situation judgment
Fig. 7. Similarity of traffic volume for a link in Beijing.
and to make decisions support so that the appropriate actionscan be effectively taken. It is very warmly welcome by trafficmanagers in large cities, such as Beijing.
It is true that traffic data are substantial and relative fullywith the time and location. The analysis results will be onerousand the regularity cannot be found easily if an inappropriate ap-proach is adopted for the display of analysis results. Thus, thevisualized spatial–temporal analysis based on global data man-agement is introduced to provide a practical tool to easily findthe congestion locations and times, which is, indeed, the basisof further traffic data fusion.
A. Visualized Spatial–Temporal Analysis Approach
Because of the spatial–temporal attribute of traffic data, theGIS-T are used for showing the traffic data and analysis re-sult. The map in GIS-T is simpler than the GIS in other field[8]. During practical applications, the intersections and links be-come an abstract network topology consisting of nodes and linksonly, which is an explicit and essential simplification. There-fore, the visualized spatial–temporal analysis is analogous toconstruct a three-dimensional (3-D) elevation map, where a spa-tial model, such as the digital elevation model (DEM), is intro-duced, combined with GIS-T application. The digital elevationvalue results from the result of traffic data analysis. Two typesof visualization, pseudocolor map and contour map, are chosento display the analysis result in the GIS-T.
The important algorithms in constructing a 3-D elevation mapare interpolation and data profiling. The key point in building theDEM model is the interpolation, with which a continuous modelis constructed upon as data from nonuniformly distributed trafficflow detectors. The interpolation also is a core in the processof building DEM, in which the calculation of elevation for un-known points between known neighboring reference points isundertaken. The basis is the fact that the original data is con-tinuous or at least relative. For the traffic flows, the values ofneighboring intersections are spatially related so that the trafficflows to be calculated around the area can be interpolated in theform of elevation.
Generally, 2-D interpolation is the bilinear method. The bi-linear interpolation is adopted in the paper because it is simpleand its result is acceptable in practical applications. It is simpleto use bilinear interpolation to make a real-time analysis over avery large area. The algorithm is as follows.

272 IEEE TRANSACTIONS ON INTELLIGENT TRANSPORTATION SYSTEMS, VOL. 5, NO. 4, DECEMBER 2004
Fig. 8. Distribution of chosen nodes in Beijing.
Suppose that the four nearest neighbor points are
(1)Then, the point to be interpolated can be defined as
(2)
To ensure that the point to be calculated has the same char-acteristic as the four neighbor points, the following relationshipmust be satisfied:
(3)
where 0, 1, 2, 3. The matrix form of (3) can then be achievedas
(4)
and the value of can be determined via
(5)
It is obvious that the derivative of the interpolation functionis noncontinuous and that the resulting model is not verysmooth. However, comparing the model with one produced
using the more complicated interpolated model, the algorithm,the bilinear interpolation is already enough for this level ofanalysis. The spatial analysis can then be easily undertakenusing bilinear interpolation.
Another important algorithm in the traffic-flow analysis isdata profiling, which smooths the data and reduces the impactof incidents to guarantee the efficiency and close to the real sit-uations. The data-profiling method is based on the periodicityand similarity characteristics of general traffic flow data. Fromexperience, the traffic flow of the same day in different weeks ata definite intersection should be similar due to the human activi-ties with the self-organization [18], [19]. For instance, the curveof the flow versus time in a Monday is very similar to one ofanother Monday, which is shown in Fig. 7. Thus, the smoothingmethod in the data profiling is based on the similarity and can re-duce the negative effects of incidents and short-period detectorfailures in advance to enhance its robustness.
The data-profiling method can be applied as follows. Con-sider that the similarity of traffic volume data is periodic inweek. The matrix sequence and are defined to store thedata profile of a whole week in the form of time sequence. Asdescribed before, the interval of flow data is 15 min and, thus,the length of column is 96 for each day, i.e.,
and
(6)
ZHANG et al.: SPATIAL–TEMPORAL TRAFFIC DATA ANALYSIS BASED ON GLOBAL DATA MANAGEMENT USING MAS 273
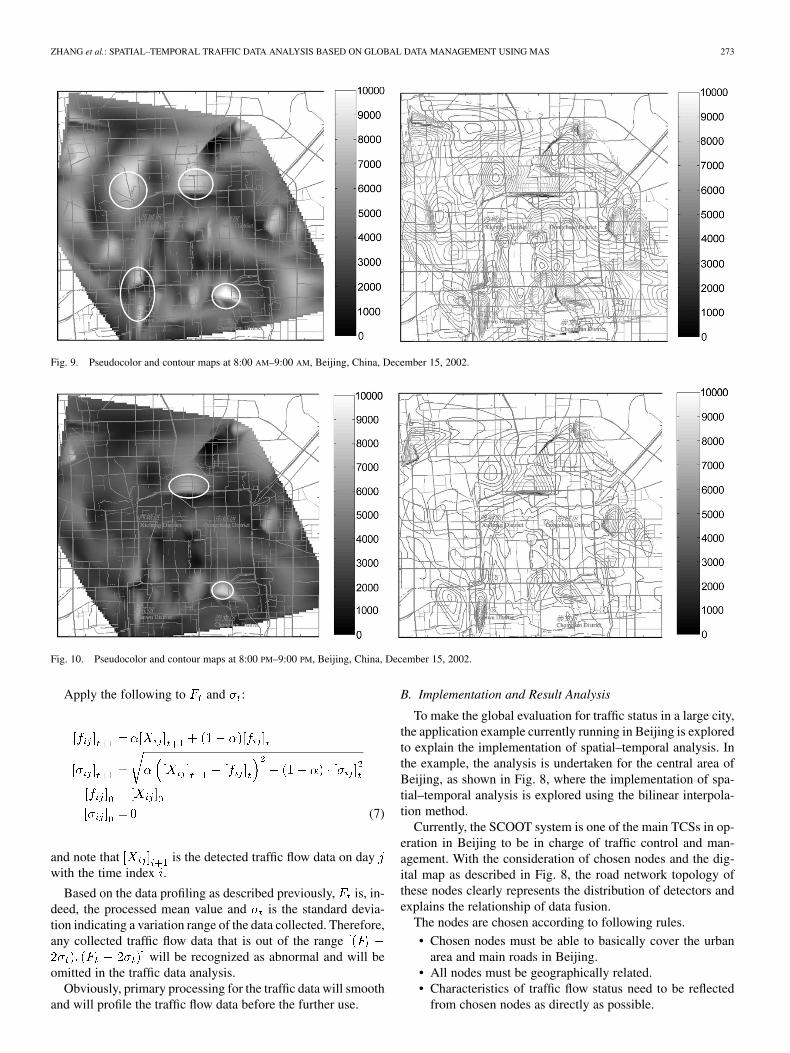
Fig. 9. Pseudocolor and contour maps at 8:00 AM–9:00 AM, Beijing, China, December 15, 2002.
Fig. 10. Pseudocolor and contour maps at 8:00 PM–9:00 PM, Beijing, China, December 15, 2002.
Apply the following to and :
(7)
and note that is the detected traffic flow data on daywith the time index .
Based on the data profiling as described previously, is, in-deed, the processed mean value and is the standard devia-tion indicating a variation range of the data collected. Therefore,any collected traffic flow data that is out of the range
will be recognized as abnormal and will beomitted in the traffic data analysis.
Obviously, primary processing for the traffic data will smoothand will profile the traffic flow data before the further use.
B. Implementation and Result Analysis
To make the global evaluation for traffic status in a large city,the application example currently running in Beijing is exploredto explain the implementation of spatial–temporal analysis. Inthe example, the analysis is undertaken for the central area ofBeijing, as shown in Fig. 8, where the implementation of spa-tial–temporal analysis is explored using the bilinear interpola-tion method.
Currently, the SCOOT system is one of the main TCSs in op-eration in Beijing to be in charge of traffic control and man-agement. With the consideration of chosen nodes and the dig-ital map as described in Fig. 8, the road network topology ofthese nodes clearly represents the distribution of detectors andexplains the relationship of data fusion.
The nodes are chosen according to following rules.
• Chosen nodes must be able to basically cover the urbanarea and main roads in Beijing.
• All nodes must be geographically related.• Characteristics of traffic flow status need to be reflected
from chosen nodes as directly as possible.

274 IEEE TRANSACTIONS ON INTELLIGENT TRANSPORTATION SYSTEMS, VOL. 5, NO. 4, DECEMBER 2004
• Detectors located on the chosen nodes must run withouterrors or with few error data.
Considering the traffic flow data in the chosen network fromthe connected intersections (nodes), dating from December 1,2002 to December 31, 2002, they can be extracted explicitlyfrom a database from the SCOOT system, where the flow datafrom each node are obviously time sequences and the intervalof data sampling is 15 min. Then, the total 184 of all 206 nodesin the chosen area are adopted to undertake the spatial–temporalanalysis after the primary filtering.
After the determination of nodes and traffic data profilingwith the results of mean value, the interpolation can undertakethe traffic spatial–temporal analysis. The interpolated points areall within the convex hull of the node set. The result of analysisis shown in pseudocolor and contour maps, as shown in Figs. 9and 10. For printing convenience, the grayscale is adopted in-stead of color for displaying the figures.
Fig. 9 shows the traffic-flow distribution in the morning peakhour over the urban central area. In this pseudocolor map, thewhite areas indicate the traffic status with the heave trafficflows, while the black areas indicate the traffic status with thesmall traffic flows. Obviously, the overall appearance of figureis bright, especially for four areas as marked in this figure,which could show that the traffic situation in these areas is toobad and may be closed due to the congestion. In fact, these fourareas are closed to the second ring road, where there are themain channels for the city traffic and are usually with the heavetraffic. From the fact that the central part of figure remains dark,it is known that the traffic situation in the city center is normal.
In Fig. 10, the overall appearance is darker as compared withthe situation in Fig. 9. It represents the globally lower flowsexisting in this period. Besides, two white areas in Fig. 10 (theupper left and lower left ones) disappeared while the other twoin Fig. 10 still exist. As the time is 8:00 PM–9:00 PM, these twoareas could be considered to be an abnormal situation accordingto common people’s behavior. This shows that more concernsshould be paid to these unusually high flow areas.
Based on the investigation after analysis example, the trafficsituation in the marked areas in Figs. 9 and 10, as describedpreviously, are caused by nearby road construction. Then, it isclear that the traffic situation will be improved definitely afterthe construction projects.
V. CONCLUSION
The spatial–temporal traffic data analysis discussed above isa comprehensive evaluation method for the traffic situation inthe road network level. The global traffic data management pro-vides data from different systems through networks and the vi-sualization of the analysis result provides the explicit show oftraffic status.
The global traffic data management is necessary not only fortraffic data analysis, but also for traffic managers and users inusing various traffic information services. To make the multipledata sources coexist and to support the data integration fromthe distributed traffic systems, the MAS are used to simplifythe complex tasks into a set of collaborating subtasks. At thesame time, the agent-based approach with CORBA eliminates
the distribution and heterogeneity in exchanging the traffic data.From the practical example and implementation of global trafficanalysis, the global data-management approach is feasible.
The visualized spatial–temporal analysis, such as using thepseudocolor and contour maps, provides a practical and simplemethod to display the traffic status globally, where the traffic jamarea and the dynamic traffic flow are shown explicitly, whichcan be displayed like a film. This is very clearly useful in trafficcontrol and route guidance.
However, the interpolation algorithm, node choosing, and vi-sualization approaches could be further improved according tothe different requirements and their potential applications. Itcan also be undertaken more efficiently combined with otherdata-processing approaches, such as the pattern recognition andartificial neural network, to build an intelligent analysis system.
To conclude, the spatial–temporal traffic data analysis basedon the global data management using MAS is practical anduseful. It is used in traffic management and is very welcomeby the traffic managers. It can also be integrated in UTCS asthe decision support subsystems to the urban traffic control andmanagement.
REFERENCES
[1] J. Ren and Y. Zhang et al., “Information model and exchange mode forinformation application-oriented ITS,” J. Tsinghua Univ. (Sci. Tech.),vol. 42, no. 3, pp. 417–420, 2002.
[2] X. Ning, Z. Li, and Y. Zhang, “A practical research on visualized spa-tial analysis of traffic volume data,” in Proc. IEEE Int. Conf. IntelligentTransportation Systems, Shanghai, China, 2003, pp. 172–175.
[3] H. Zhang and Y. Zhang et al., “Study on ITS data management based onmultiagent systems,” in Proc. IEEE Int. Conf. Intelligent TransportationSystems, Shanghai, China, 2003, pp. 183–187.
[4] J. Zhao, B. Satish, and M. D. Maged, “Distributed architecture for real-time coordination of bus holding in transit networks,” IEEE Trans. Intell.Transport. Syst., vol. 4, pp. 43–51, Mar. 2003.
[5] J. L. Adler and V. J. Blue, “A cooperative multi-agent transportationmanagement and route guidance system,” Transport. Res. C, vol. 10, no.5/6, pp. 433–454, 2002.
[6] H. Dia, “An agent-based approach to modeling driver route choice be-havior under the influence of real-time information,” Transport. Res. C,vol. 10, no. 5/6, pp. 331–349, 2002.
[7] Y. Yang and O. F. Rana et al., “Agent based data management in digitallibraries,” Parallel Comput., vol. 28, no. 5, pp. 773–792, 2002.
[8] H. Zhang and Y. Zhang et al., “The research and design of geographicalinformation systems for intelligent transportation systems,” J. HighwayTransportation Res. Develop., vol. 21, no. 3, pp. 71–74, 2004.
[9] M. Wooldridge and N. R. Jennings, “Intelligent agents: Theory and prac-tice,” Knowledge Eng. Rev., vol. 10, no. 2, pp. 115–152, 1995.
[10] N. Boudriga and M. S. Obaidat, “Intelligent agents on the web: A re-view,” IEEE Comput. Sci. Eng. Mag., vol. 6, pp. 35–42, July/Aug. 2004.
[11] Object Management Group, The Common Object Request Broker: Ar-chitecture and Specification, 2nd ed., 2000.
[12] I. Pyarali, D. C. Schmidt, and R. K. Cytron, “Techniques for en-hancing real-time CORBA quality of service,” Proc. IEEE, vol. 91, pp.1070–1085, July 2003.
[13] I. A. Fatah and S. Majunmdar, “Performance of CORBA-basedclient-sever architecture,” IEEE Trans. Parallel Distrib. Syst., vol. 13,pp. 111–127, Feb. 2002.
[14] D. J. Dailey, M. Stuart, W. C. Fritz, and D. Meyers, “A self-describingdata transfer model for ITS applications,” IEEE Trans. Intell. Transport.Syst., vol. 3, pp. 293–300, Dec. 2002.
[15] D. L. Hall and J. Llinas, “An introduction to multisensor data fusion,”Proc. IEEE, vol. 85, pp. 6–23, Jan. 1997.
[16] J. Z. Sasiadek, “Sensor fusion,” Annu. Rev. Control, vol. 26, pp.203–228, 2002.
[17] P. K. Varshney, “Multisensor data fusion,” Electron. Commun. Eng. J.,vol. 9, no. 6, pp. 245–253, 1997.

ZHANG et al.: SPATIAL–TEMPORAL TRAFFIC DATA ANALYSIS BASED ON GLOBAL DATA MANAGEMENT USING MAS 275
[18] X. Ning, Z. Li, and J. Song, “A practical research on dynamic trafficflow data profile,” in Proc. IEEE 5th Int. Conf. Intelligent TransportationSystems, 2002, pp. 791–794.
[19] X. Ou and Y. Zhang et al., “A neural network model for urban trafficvolumes compression,” Proc. Information Systems Concepts and Appli-cations of Systemic, Cybernetics and Informatics, pp. 524–528, 2002.
He-Sheng Zhang received the B.S.E.E. and M.S. de-grees in electrical engineering from Northern Jiao-tong University, Beijing, China, in 1992 and 1995, re-spectively. He is currently working toward the Ph.D.degree in control science and technology at TsinghuaUniversity, Beijing, China.
He also is a Teacher in the School of ElectricalEngineering, Beijing Jiaotong University, Beijing,China. His current research interests include intel-ligent transportation system engineering, distributeddata management and data fusion, intelligent infor-
mation processing, and distributed automatic detection and control.
Yi Zhang (S’01–M’04) received the B.S.E.E. andM.S. degrees from the Department of Automation,Tsinghua University, Beijing, China, in 1986 and1988, respectively, and the Ph.D. degree in controlscience and engineering from the University ofStrathclyde, Glasgow, U.K., in 1995.
He is a Full Professor of control science andengineering and the Chief Scientist with the ITSTechnology Research Center, Tsinghua University.His current research interests include intelligenttransportation system engineering, urban traffic
control and management, management and analysis for diving athletes training,automatic detection and control, and advanced control theory and application.
Zhi-Heng Li (M’02) received the B.S. degree insystems engineering and the M.S. degree fromNorthern Jiaotong University, Beijing, China, in1997 and 2001, respectively.
He is a Teacher of automation at Tsinghua Uni-versity, Beijing, China. His current research interestsinclude applied technologies in intelligent transporta-tion systems, intelligent transportation system engi-neering, and traffic control and data processing.
Dong-Cheng Hu received the B.S.E.E. degree inelectrical engineering from Tsinghua University,Beijing, China, in 1970.
He is a Professor of control science and engi-neering at Tsinghua University, Beijing, China.His current research interests include intelligenttransportation systems and automatic detection andcontrol.


