Embed Size (px)
Citation preview
The AES Corporation Fourth Quarter & FY 2016 Financial Review February 27, 2017
2 Contains Forward-Looking Statements
Safe Harbor Disclosure Certain statements in the following presentation regarding AES’ business operations may constitute “forward-looking statements.” Such forward-looking statements include, but are not limited to, those related to future earnings growth and financial and operating performance. Forward-looking statements are not intended to be a guarantee of future results, but instead constitute AES’ current expectations based on reasonable assumptions. Forecasted financial information is based on certain material assumptions. These assumptions include, but are not limited to, accurate projections of future interest rates, commodity prices and foreign currency pricing, continued normal or better levels of operating performance and electricity demand at our distribution companies and operational performance at our generation businesses consistent with historical levels, as well as achievements of planned productivity improvements and incremental growth from investments at investment levels and rates of return consistent with prior experience. For additional assumptions see Slide 67 and the Appendix to this presentation. Actual results could differ materially from those projected in our forward-looking statements due to risks, uncertainties and other factors. Important factors that could affect actual results are discussed in AES’ filings with the Securities and Exchange Commission including but not limited to the risks discussed under Item 1A “Risk Factors” and Item 7: “Management’s Discussion & Analysis” in AES’ 2016 Annual Report on Form 10-K, as well as our other SEC filings. AES undertakes no obligation to update or revise any forward-looking statements, whether as a result of new information, future events or otherwise. Reconciliation to U.S. GAAP Financial Information The following presentation includes certain “non-GAAP financial measures” as defined in Regulation G under the Securities Exchange Act of 1934, as amended. Schedules are included herein that reconcile the non-GAAP financial measures included in the following presentation to the most directly comparable financial measures calculated and presented in accordance with U.S. GAAP.
3 Contains Forward-Looking Statements
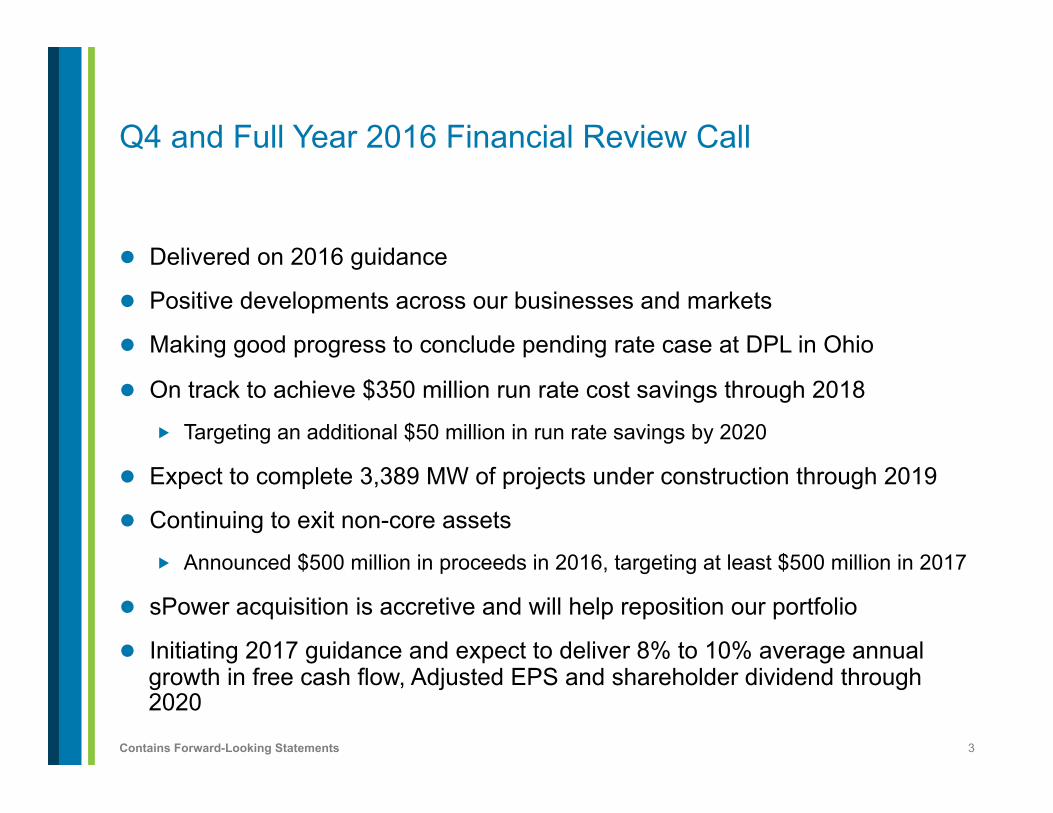
Q4 and Full Year 2016 Financial Review Call
l Delivered on 2016 guidance
l Positive developments across our businesses and markets
l Making good progress to conclude pending rate case at DPL in Ohio
l On track to achieve $350 million run rate cost savings through 2018
� Targeting an additional $50 million in run rate savings by 2020
l Expect to complete 3,389 MW of projects under construction through 2019
l Continuing to exit non-core assets
� Announced $500 million in proceeds in 2016, targeting at least $500 million in 2017
l sPower acquisition is accretive and will help reposition our portfolio
l Initiating 2017 guidance and expect to deliver 8% to 10% average annual growth in free cash flow, Adjusted EPS and shareholder dividend through 2020
4 Contains Forward-Looking Statements
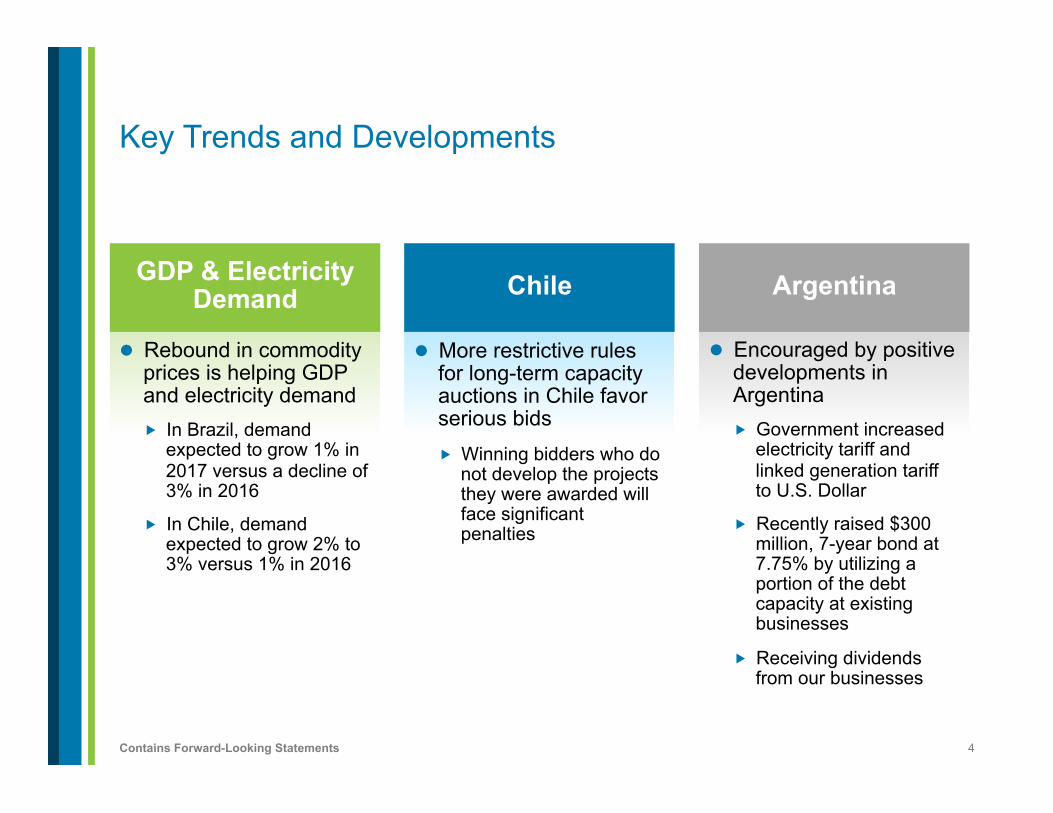
Key Trends and Developments
GDP & Electricity Demand Argentina Chile
l Rebound in commodity prices is helping GDP and electricity demand � In Brazil, demand
expected to grow 1% in 2017 versus a decline of 3% in 2016
� In Chile, demand expected to grow 2% to 3% versus 1% in 2016
l More restrictive rules for long-term capacity auctions in Chile favor serious bids � Winning bidders who do
not develop the projects they were awarded will face significant penalties
l Encouraged by positive developments in Argentina � Government increased
electricity tariff and linked generation tariff to U.S. Dollar
� Recently raised $300 million, 7-year bond at 7.75% by utilizing a portion of the debt capacity at existing businesses
� Receiving dividends from our businesses
5 Contains Forward-Looking Statements
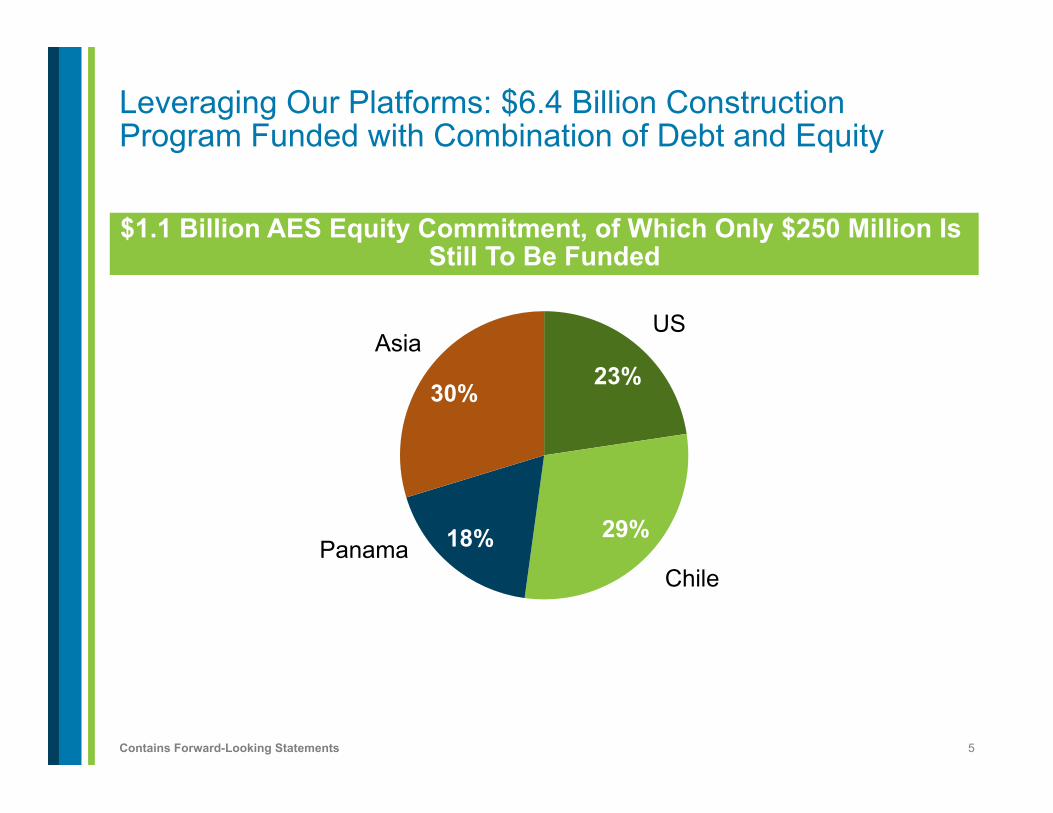
23%
29% 18%
30%
Leveraging Our Platforms: $6.4 Billion Construction Program Funded with Combination of Debt and Equity
$1.1 Billion AES Equity Commitment, of Which Only $250 Million Is Still To Be Funded
US
Chile
Asia
Panama
6 Contains Forward-Looking Statements
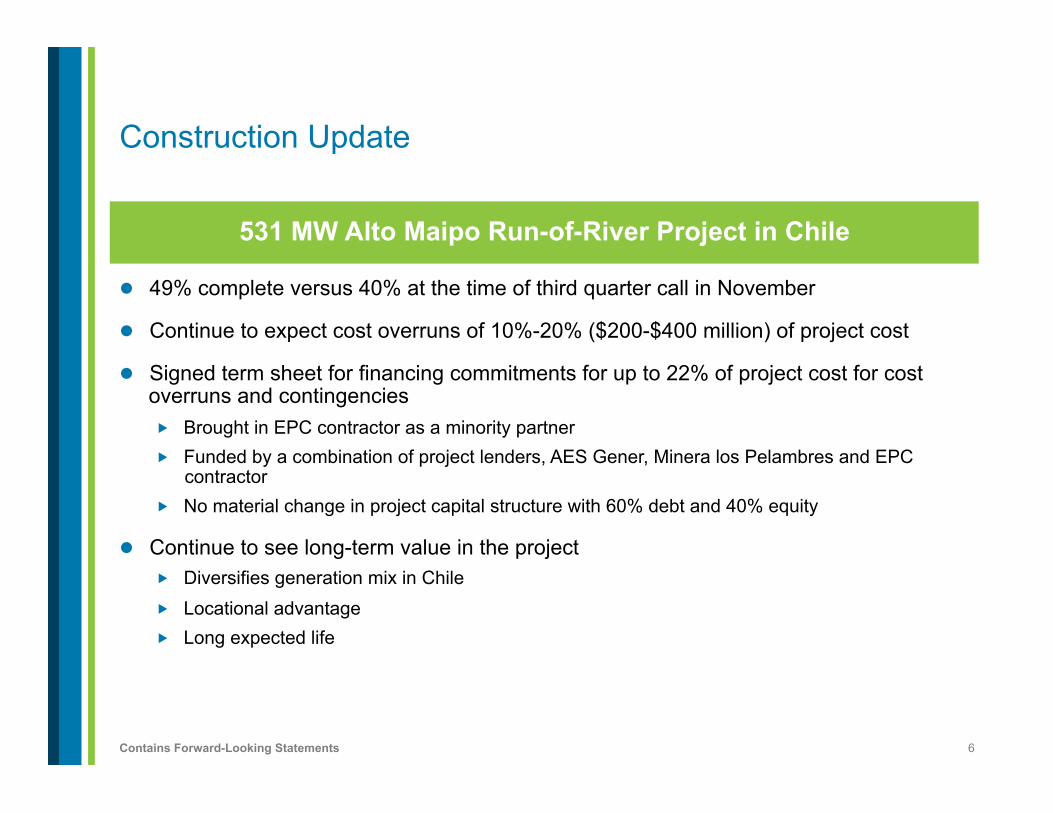
l 49% complete versus 40% at the time of third quarter call in November
l Continue to expect cost overruns of 10%-20% ($200-$400 million) of project cost
l Signed term sheet for financing commitments for up to 22% of project cost for cost overruns and contingencies � Brought in EPC contractor as a minority partner � Funded by a combination of project lenders, AES Gener, Minera los Pelambres and EPC
contractor � No material change in project capital structure with 60% debt and 40% equity
l Continue to see long-term value in the project � Diversifies generation mix in Chile � Locational advantage � Long expected life
Construction Update
531 MW Alto Maipo Run-of-River Project in Chile
7 Contains Forward-Looking Statements
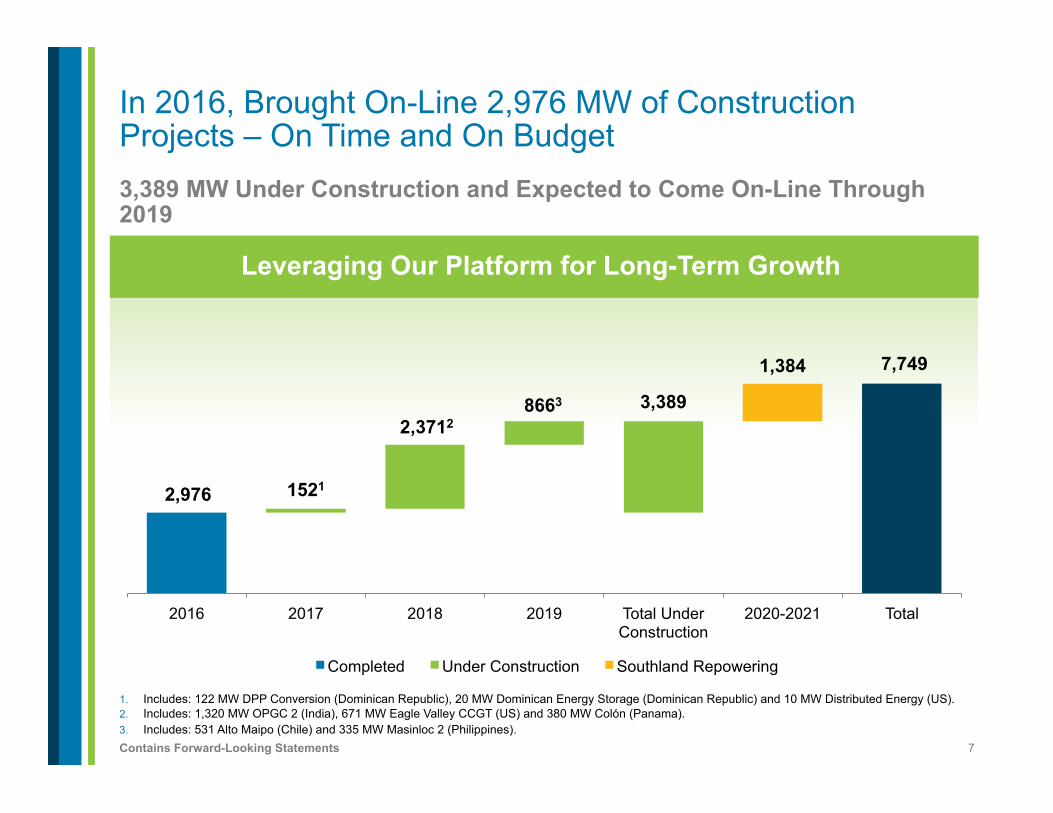
3,389 MW Under Construction and Expected to Come On-Line Through 2019
1. Includes: 122 MW DPP Conversion (Dominican Republic), 20 MW Dominican Energy Storage (Dominican Republic) and 10 MW Distributed Energy (US). 2. Includes: 1,320 MW OPGC 2 (India), 671 MW Eagle Valley CCGT (US) and 380 MW Colón (Panama). 3. Includes: 531 Alto Maipo (Chile) and 335 MW Masinloc 2 (Philippines).
2,976
7,749
1521
2,3712 8663 3,389
1,384
2016 2017 2018 2019 Total Under Construction
2020-2021 Total
Completed Under Construction Southland Repowering
In 2016, Brought On-Line 2,976 MW of Construction Projects – On Time and On Budget
Leveraging Our Platform for Long-Term Growth
8 Contains Forward-Looking Statements
Attributes of Future Growth Projects
l Natural gas generation and infrastructure projects, as well as renewables
l Long-term, U.S. Dollar-denominated contracts
l Reduction of carbon intensity
l Offer attractive risk-adjusted returns
Focusing on Accretive and Credit-Positive Projects
9 Contains Forward-Looking Statements
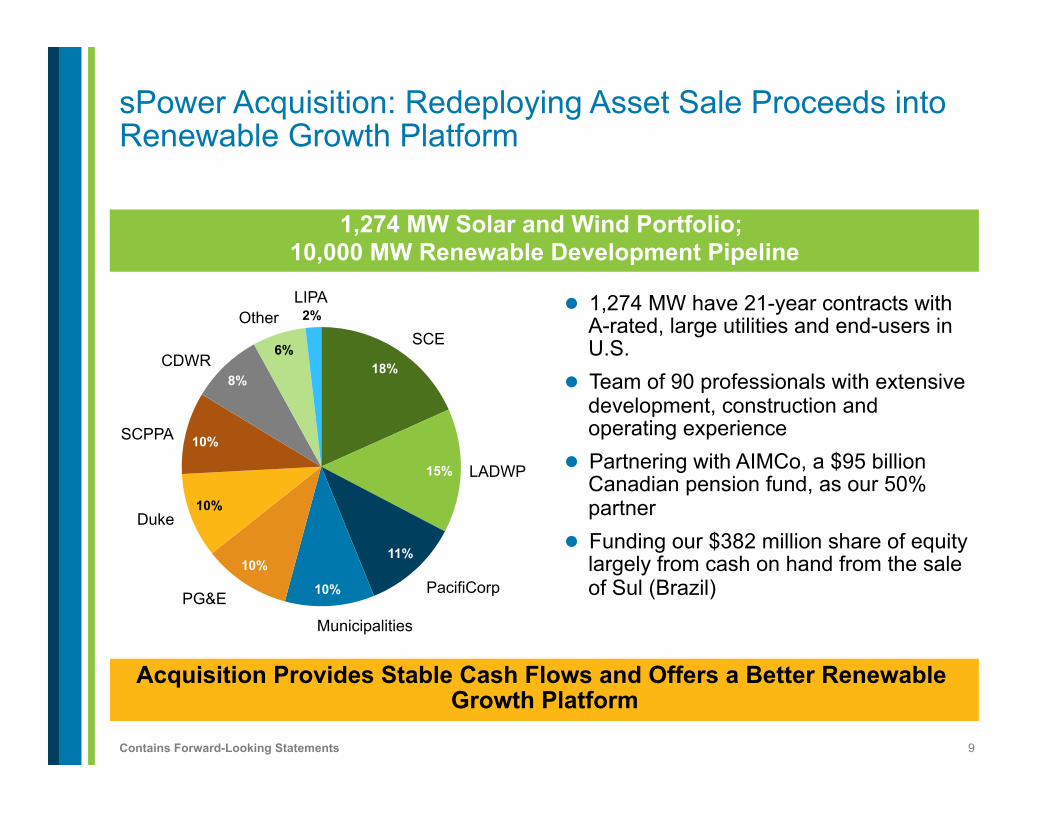
sPower Acquisition: Redeploying Asset Sale Proceeds into Renewable Growth Platform
l 1,274 MW have 21-year contracts with A-rated, large utilities and end-users in U.S.
l Team of 90 professionals with extensive development, construction and operating experience
l Partnering with AIMCo, a $95 billion Canadian pension fund, as our 50% partner
l Funding our $382 million share of equity largely from cash on hand from the sale of Sul (Brazil)
1,274 MW Solar and Wind Portfolio; 10,000 MW Renewable Development Pipeline
Acquisition Provides Stable Cash Flows and Offers a Better Renewable Growth Platform
18%
15%
11%
10%
10%
10%
10%
8%
6%
2%
SCE
LADWP
PacifiCorp
Municipalities
PG&E
Duke
SCPPA
CDWR
Other LIPA
10 Contains Forward-Looking Statements
l Average remaining contract life of 18 years
l Will diversify Tietê’s generation mix from 100% hydro and contribute stable cash flows
l R$650 million transaction enables Tietê to capitalize on its R$1.5 billion debt capacity
Tietê’s Acquisition of Renova’s Wind Business in Brazil
386 MW Alto de Sertão II Wind Business in State of Bahia
11 Contains Forward-Looking Statements
l Follows previously signed supply agreement with ENGIE for Colón in Panama, which is currently under construction
l Jointly marketing 0.7 million tonnes per annum of LNG through the Andres terminal in the Dominican Republic � Currently utilize 50% of the capacity for existing power plants in the Dominican
Republic
l Significant potential to maximize value of the terminal through sales to downstream customers in the Dominican Republic and the Caribbean
l Partnership with ENGIE positions us to offer long-term source of reliable energy at competitive prices to electric generation and industrial customers
LNG in the Dominican Republic
Partnership Agreement with ENGIE
12 Contains Forward-Looking Statements
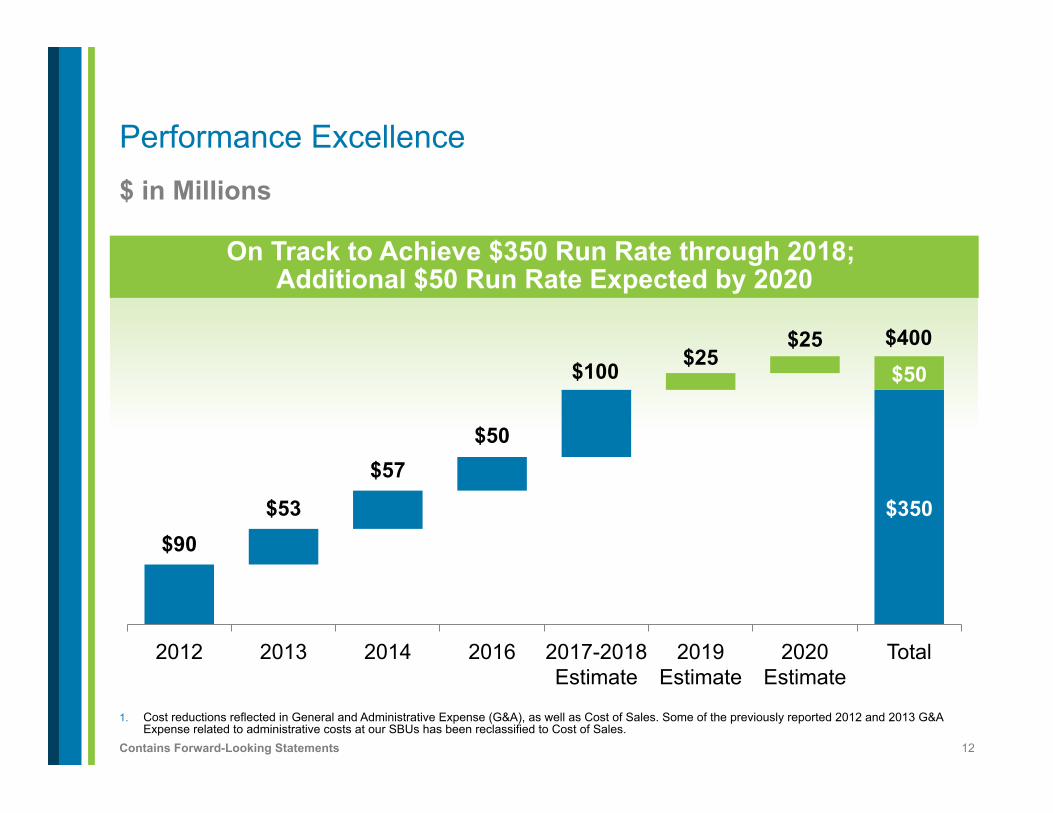
$ in Millions
1. Cost reductions reflected in General and Administrative Expense (G&A), as well as Cost of Sales. Some of the previously reported 2012 and 2013 G&A Expense related to administrative costs at our SBUs has been reclassified to Cost of Sales.
$90 $350 $53
$57 $50
$100 $25 $25
$50
2012 2013 2014 2016 2017-2018 Estimate
2019 Estimate
2020 Estimate
Total
Performance Excellence
On Track to Achieve $350 Run Rate through 2018; Additional $50 Run Rate Expected by 2020
$400
13 Contains Forward-Looking Statements
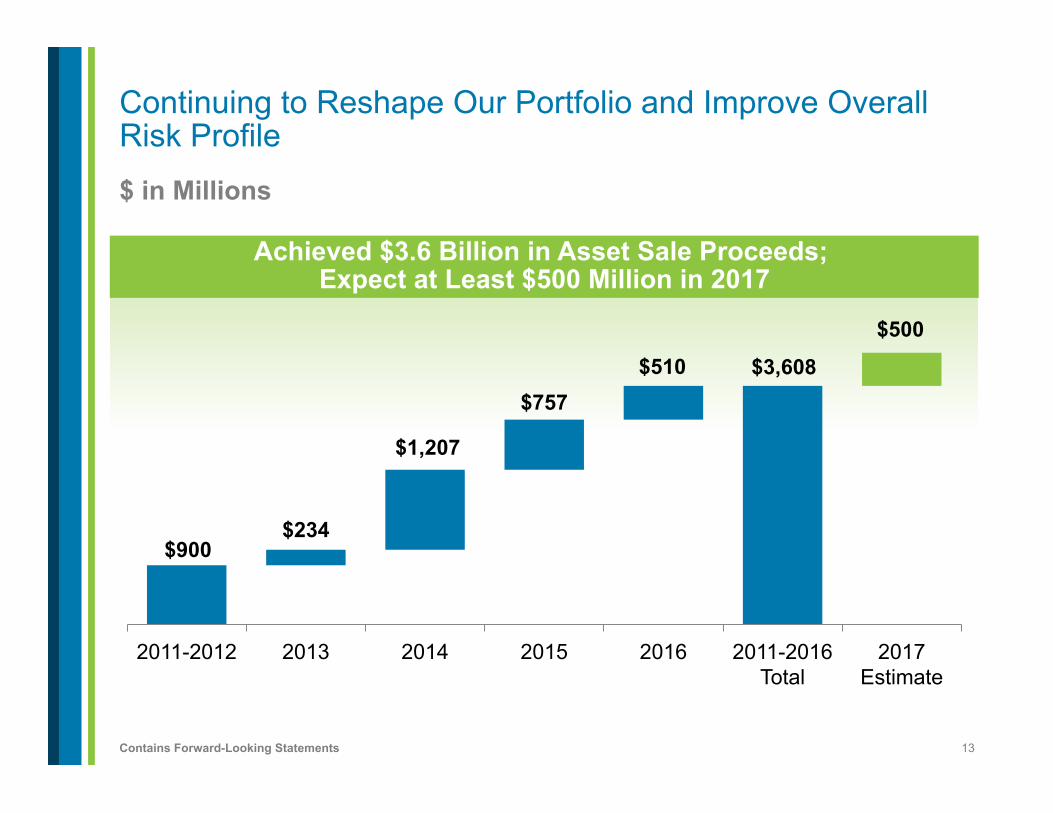
$ in Millions
Continuing to Reshape Our Portfolio and Improve Overall Risk Profile
Achieved $3.6 Billion in Asset Sale Proceeds; Expect at Least $500 Million in 2017
$900
$3,608
$234
$1,207
$757 $510
$500
2011-2012 2013 2014 2015 2016 2011-2016 Total
2017 Estimate
14 Contains Forward-Looking Statements
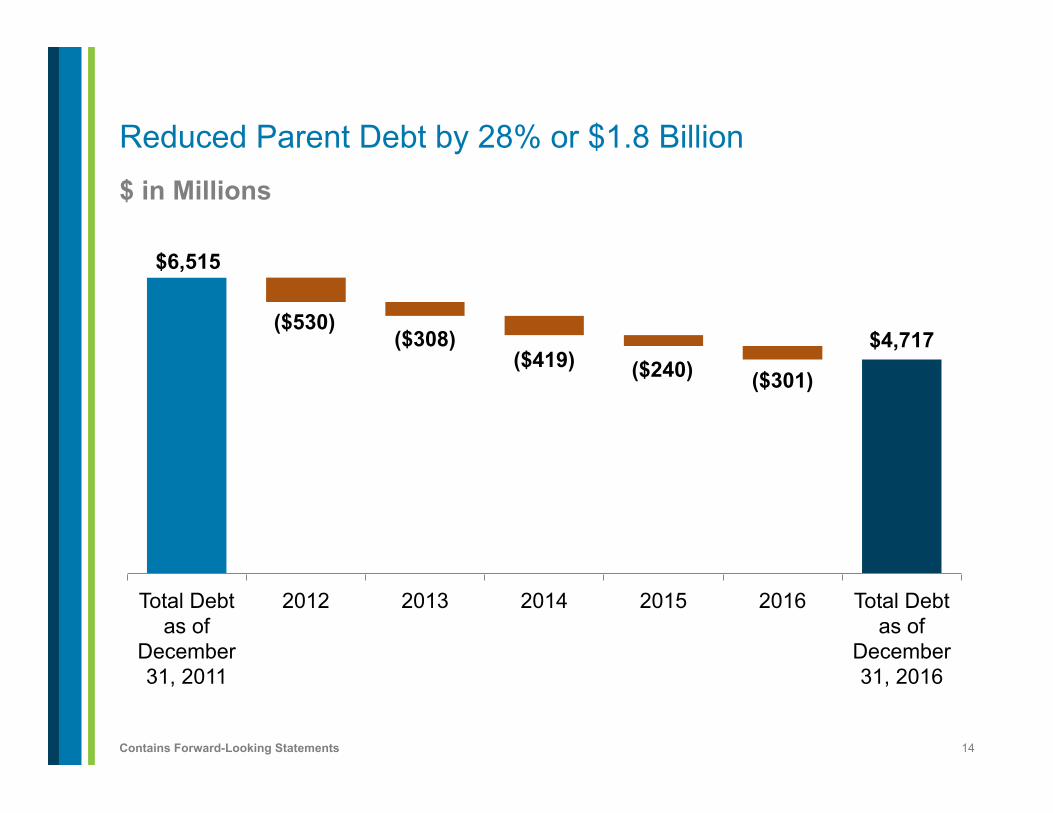
$ in Millions
Reduced Parent Debt by 28% or $1.8 Billion
$6,515
$4,717 ($530)
($308) ($419) ($240) ($301)
Total Debt as of
December 31, 2011
2012 2013 2014 2015 2016 Total Debt as of
December 31, 2016
15 Contains Forward-Looking Statements 1. A non-GAAP financial measure. See Appendix for definition.
Q4 and Full Year 2016 Financial Review
l Q4 and FY 2016 results � Adjusted EPS1
� Proportional Free Cash Flow1 and Adjusted PTC1 by Strategic Business Unit (SBU)
l 2016 Parent capital allocation plan
l 2017 Guidance and 2018-2020 expectations
l 2017 Parent capital allocation plan
16 Contains Forward-Looking Statements 1. A non-GAAP financial measure. See Appendix for definition and reconciliation to the nearest GAAP measure.
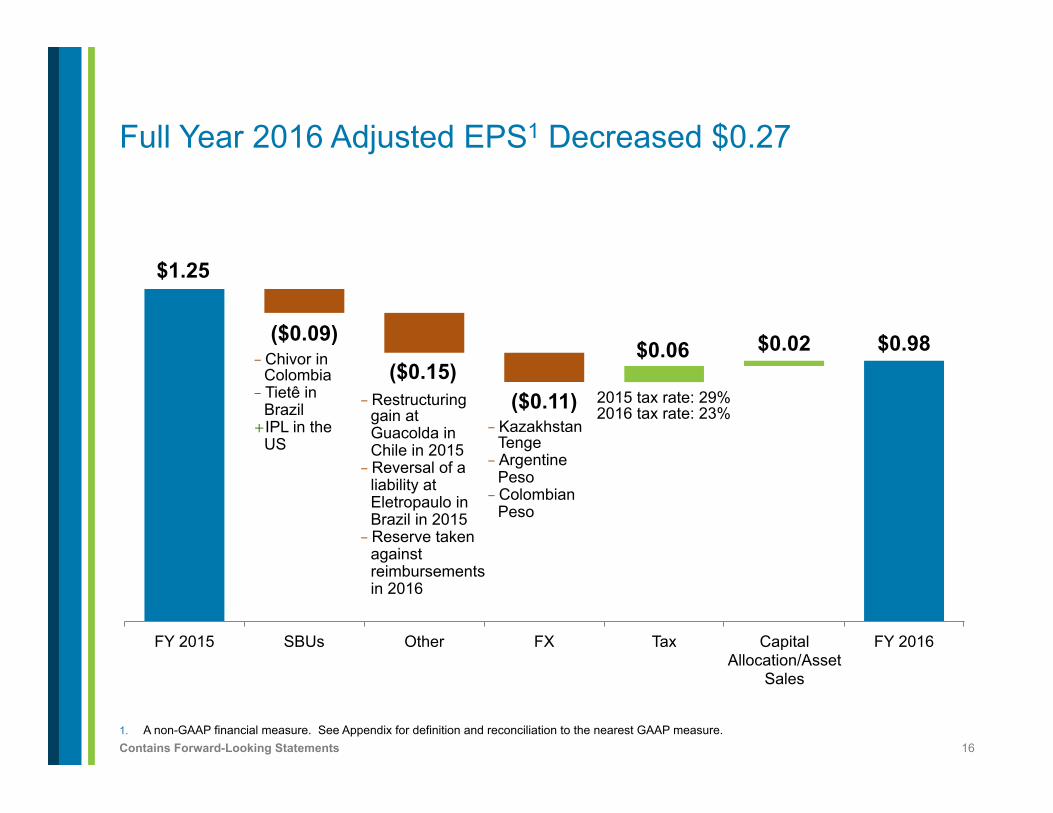
Full Year 2016 Adjusted EPS1 Decreased $0.27
$1.25
$0.98 ($0.09)
($0.15) ($0.11)
$0.06 $0.02
FY 2015 SBUs Other FX Tax Capital Allocation/Asset
Sales
FY 2016
- Chivor in Colombia - Tietê in
Brazil + IPL in the
US
- Restructuring gain at Guacolda in Chile in 2015 - Reversal of a
liability at Eletropaulo in Brazil in 2015 - Reserve taken
against reimbursements in 2016
- Kazakhstan Tenge - Argentine
Peso - Colombian
Peso
2015 tax rate: 29% 2016 tax rate: 23%
17 Contains Forward-Looking Statements
Full Year Financial Results $ in Millions
1. A non-GAAP financial measure. See Appendix for definition and reconciliation to the nearest GAAP measure.
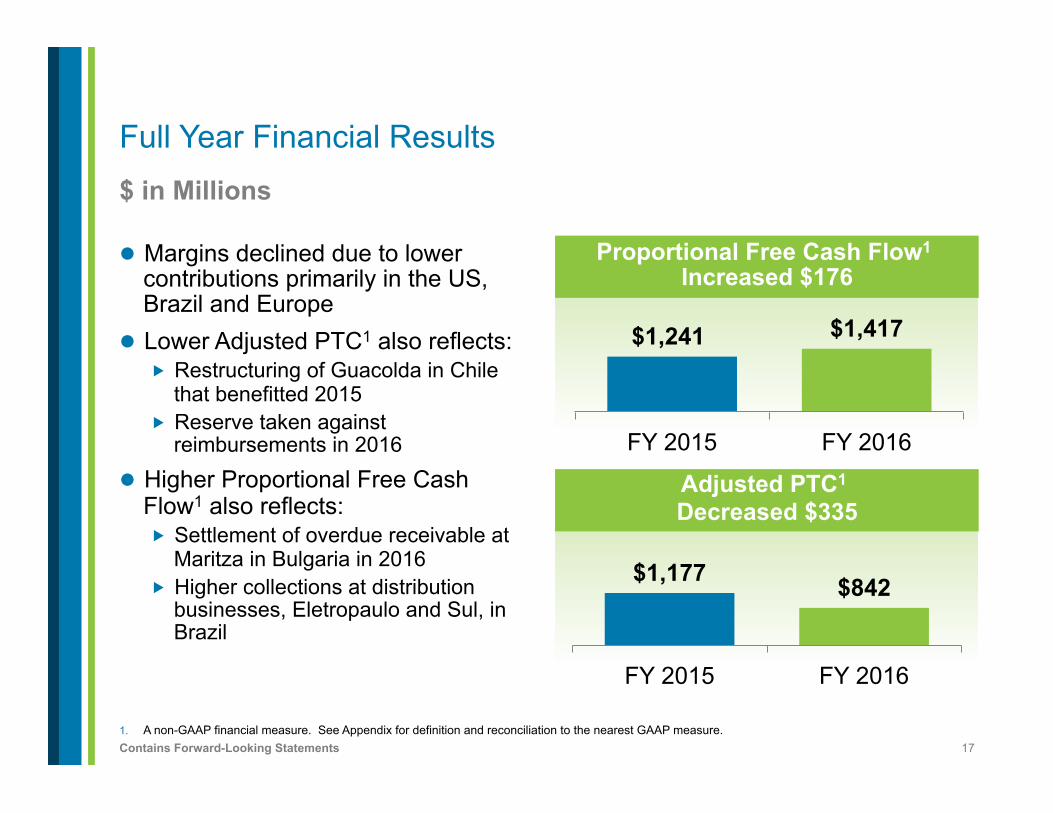
l Margins declined due to lower contributions primarily in the US, Brazil and Europe
l Lower Adjusted PTC1 also reflects: � Restructuring of Guacolda in Chile
that benefitted 2015 � Reserve taken against
reimbursements in 2016
l Higher Proportional Free Cash Flow1 also reflects: � Settlement of overdue receivable at
Maritza in Bulgaria in 2016 � Higher collections at distribution
businesses, Eletropaulo and Sul, in Brazil
Proportional Free Cash Flow1 Increased $176
$1,241 $1,417
FY 2015 FY 2016
Adjusted PTC1 Decreased $335
$1,177 $842
FY 2015 FY 2016
18 Contains Forward-Looking Statements
Full Year Financial Results: US SBU $ in Millions
1. A non-GAAP financial measure. See Appendix for definition and reconciliation to the nearest GAAP measure.
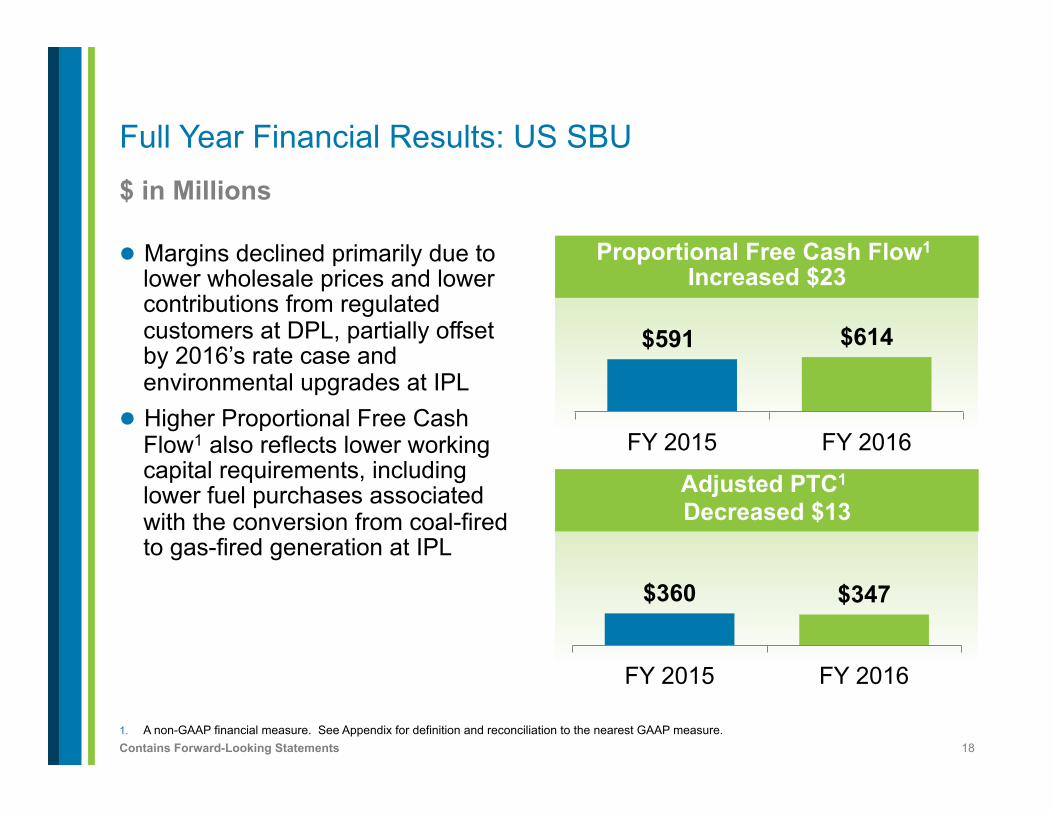
l Margins declined primarily due to lower wholesale prices and lower contributions from regulated customers at DPL, partially offset by 2016’s rate case and environmental upgrades at IPL
l Higher Proportional Free Cash Flow1 also reflects lower working capital requirements, including lower fuel purchases associated with the conversion from coal-fired to gas-fired generation at IPL
Proportional Free Cash Flow1 Increased $23
$591 $614
FY 2015 FY 2016
Adjusted PTC1 Decreased $13
$360 $347
FY 2015 FY 2016
19 Contains Forward-Looking Statements
Full Year Financial Results: Andes SBU $ in Millions
1. A non-GAAP financial measure. See Appendix for definition and reconciliation to the nearest GAAP measure.
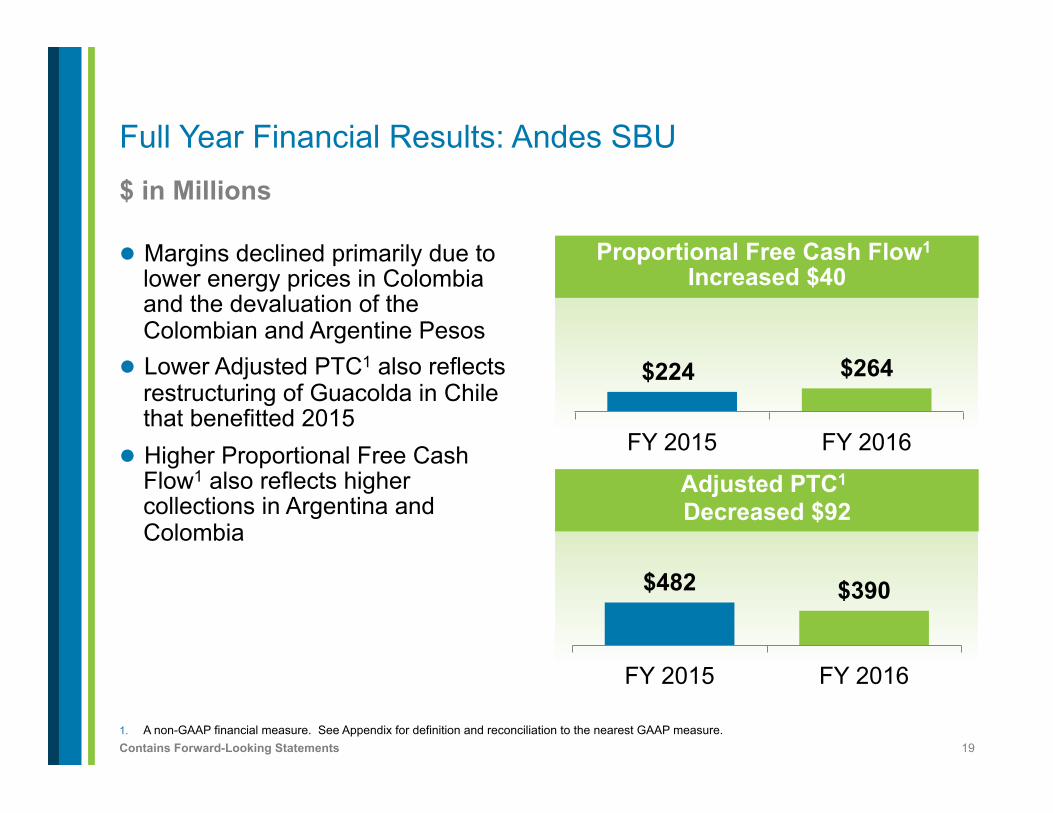
l Margins declined primarily due to lower energy prices in Colombia and the devaluation of the Colombian and Argentine Pesos
l Lower Adjusted PTC1 also reflects restructuring of Guacolda in Chile that benefitted 2015
l Higher Proportional Free Cash Flow1 also reflects higher collections in Argentina and Colombia
Proportional Free Cash Flow1 Increased $40
$224 $264
FY 2015 FY 2016
Adjusted PTC1 Decreased $92
$482 $390
FY 2015 FY 2016
20 Contains Forward-Looking Statements
Full Year Financial Results: Brazil SBU $ in Millions
1. A non-GAAP financial measure. See Appendix for definition and reconciliation to the nearest GAAP measure.
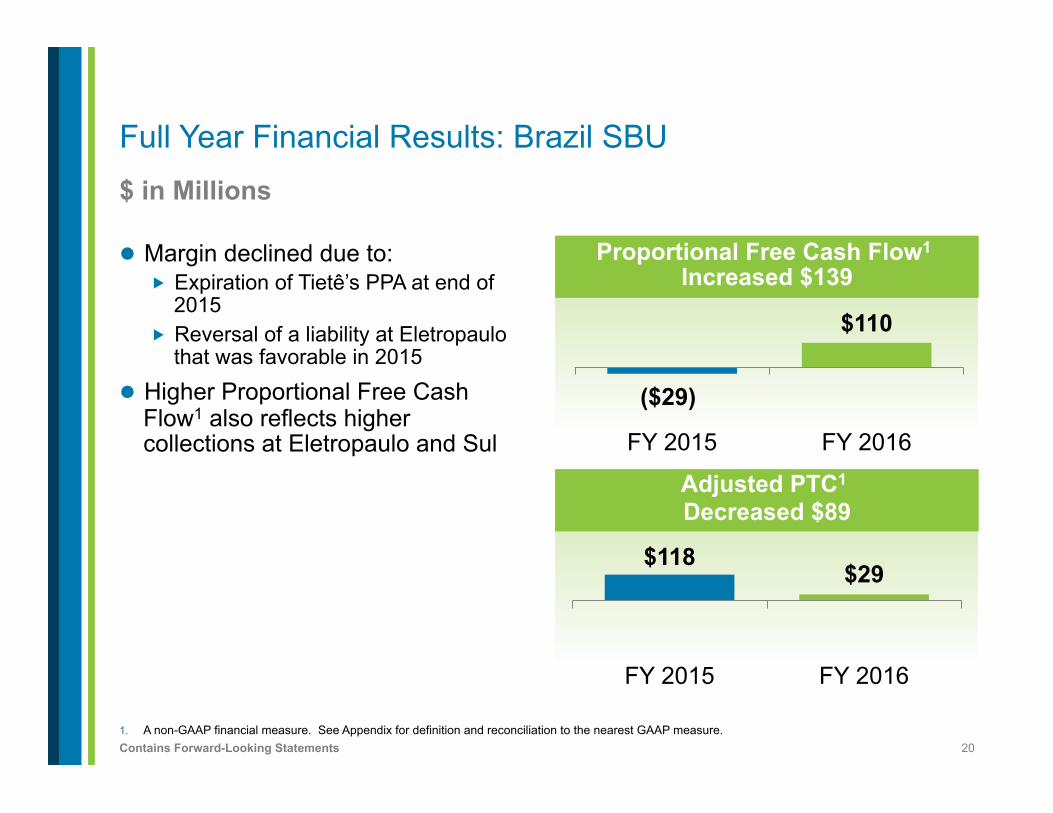
l Margin declined due to: � Expiration of Tietê’s PPA at end of
2015 � Reversal of a liability at Eletropaulo
that was favorable in 2015
l Higher Proportional Free Cash Flow1 also reflects higher collections at Eletropaulo and Sul
Proportional Free Cash Flow1 Increased $139
($29)
$110
FY 2015 FY 2016
Adjusted PTC1 Decreased $89
$118 $29
FY 2015 FY 2016
21 Contains Forward-Looking Statements
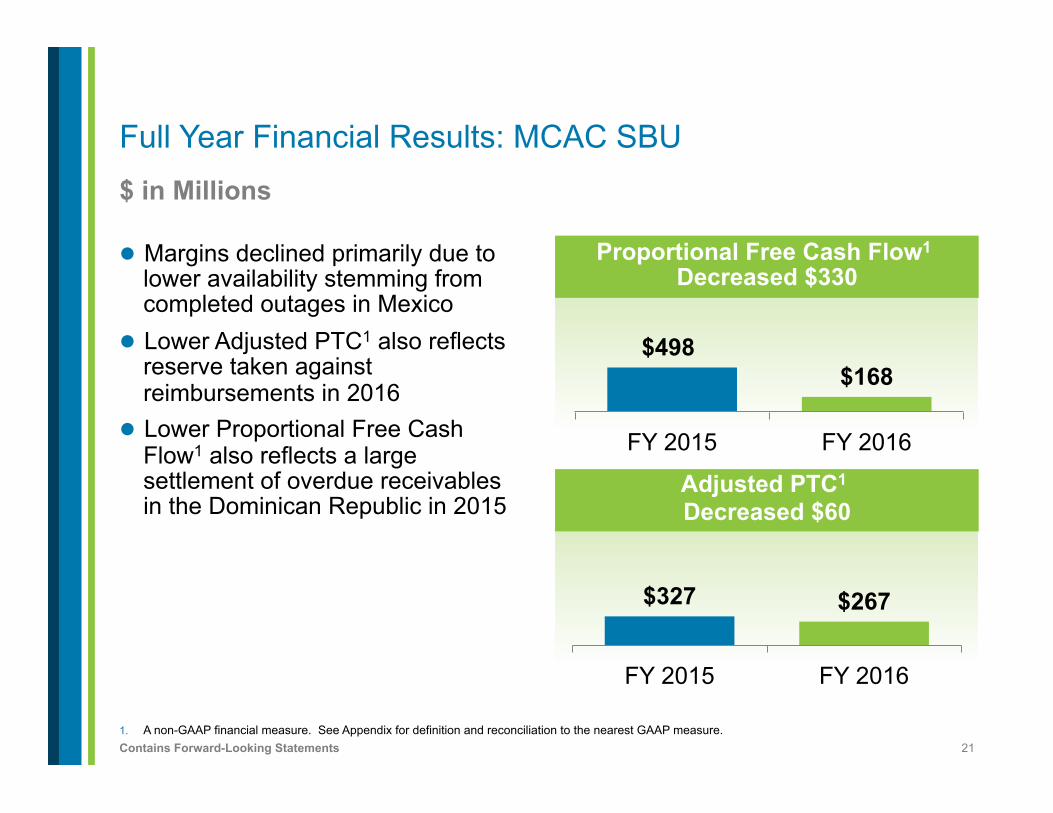
Full Year Financial Results: MCAC SBU $ in Millions
1. A non-GAAP financial measure. See Appendix for definition and reconciliation to the nearest GAAP measure.
l Margins declined primarily due to lower availability stemming from completed outages in Mexico
l Lower Adjusted PTC1 also reflects reserve taken against reimbursements in 2016
l Lower Proportional Free Cash Flow1 also reflects a large settlement of overdue receivables in the Dominican Republic in 2015
Proportional Free Cash Flow1 Decreased $330
$498 $168
FY 2015 FY 2016
Adjusted PTC1 Decreased $60
$327 $267
FY 2015 FY 2016
22 Contains Forward-Looking Statements
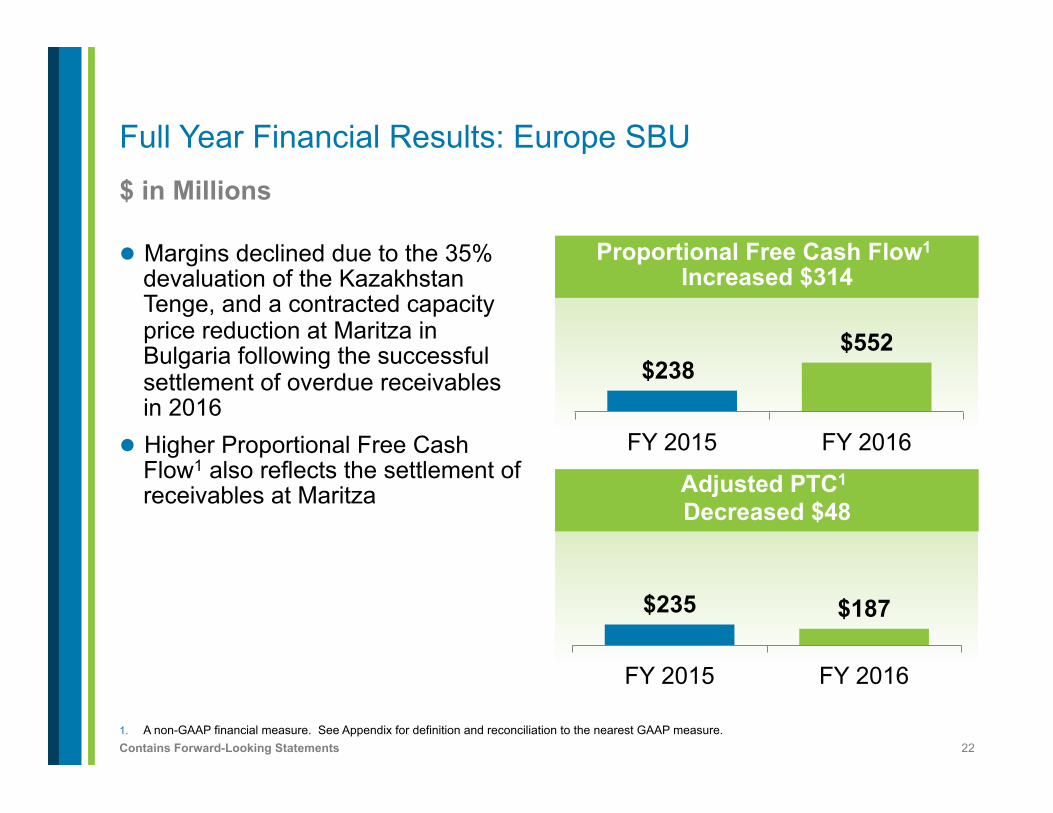
Full Year Financial Results: Europe SBU $ in Millions
1. A non-GAAP financial measure. See Appendix for definition and reconciliation to the nearest GAAP measure.
l Margins declined due to the 35% devaluation of the Kazakhstan Tenge, and a contracted capacity price reduction at Maritza in Bulgaria following the successful settlement of overdue receivables in 2016
l Higher Proportional Free Cash Flow1 also reflects the settlement of receivables at Maritza
Proportional Free Cash Flow1 Increased $314
$238 $552
FY 2015 FY 2016
Adjusted PTC1 Decreased $48
$235 $187
FY 2015 FY 2016
23 Contains Forward-Looking Statements
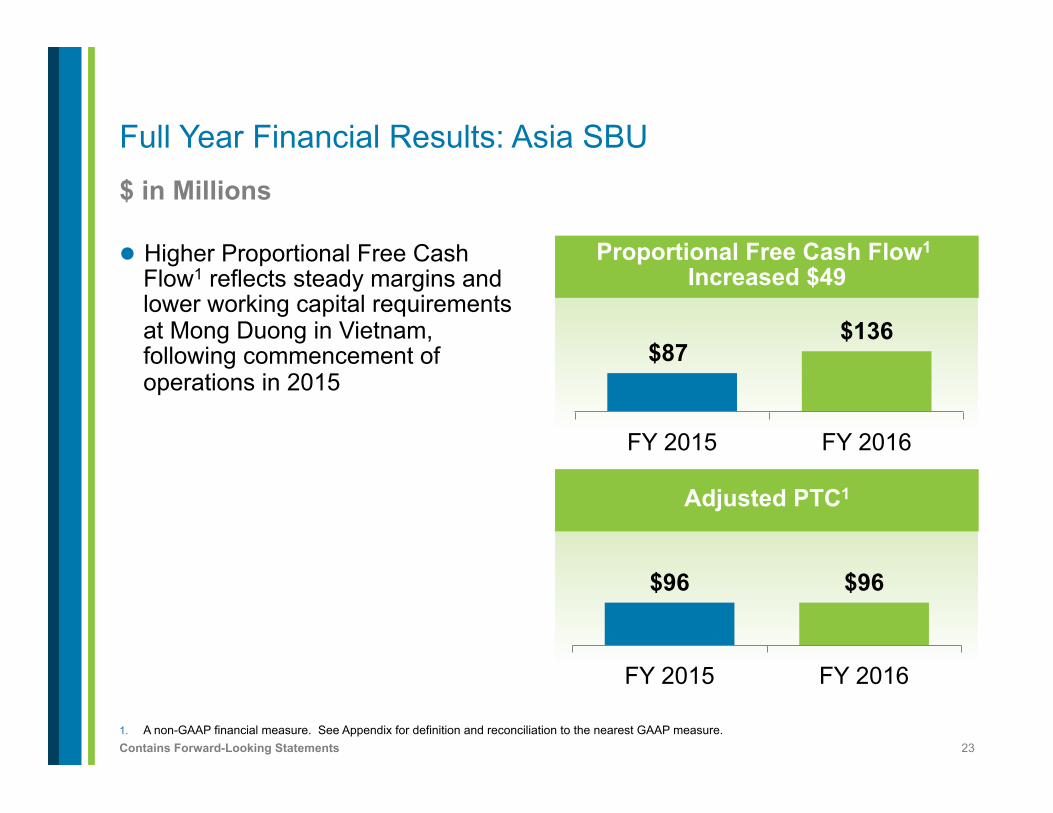
Full Year Financial Results: Asia SBU $ in Millions
1. A non-GAAP financial measure. See Appendix for definition and reconciliation to the nearest GAAP measure.
l Higher Proportional Free Cash Flow1 reflects steady margins and lower working capital requirements at Mong Duong in Vietnam, following commencement of operations in 2015
Proportional Free Cash Flow1 Increased $49
$87 $136
FY 2015 FY 2016
Adjusted PTC1
$96 $96
FY 2015 FY 2016
24 Contains Forward-Looking Statements
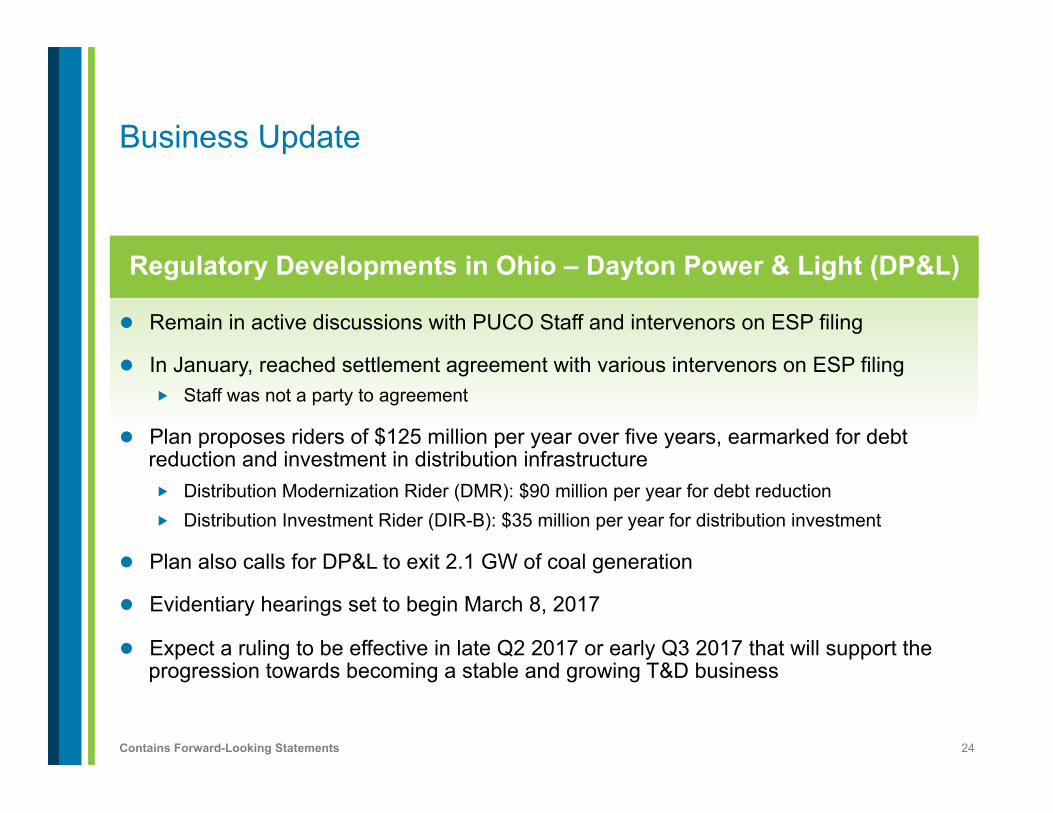
l Remain in active discussions with PUCO Staff and intervenors on ESP filing
l In January, reached settlement agreement with various intervenors on ESP filing � Staff was not a party to agreement
l Plan proposes riders of $125 million per year over five years, earmarked for debt reduction and investment in distribution infrastructure � Distribution Modernization Rider (DMR): $90 million per year for debt reduction � Distribution Investment Rider (DIR-B): $35 million per year for distribution investment
l Plan also calls for DP&L to exit 2.1 GW of coal generation
l Evidentiary hearings set to begin March 8, 2017
l Expect a ruling to be effective in late Q2 2017 or early Q3 2017 that will support the progression towards becoming a stable and growing T&D business
Business Update
Regulatory Developments in Ohio – Dayton Power & Light (DP&L)
25 Contains Forward-Looking Statements
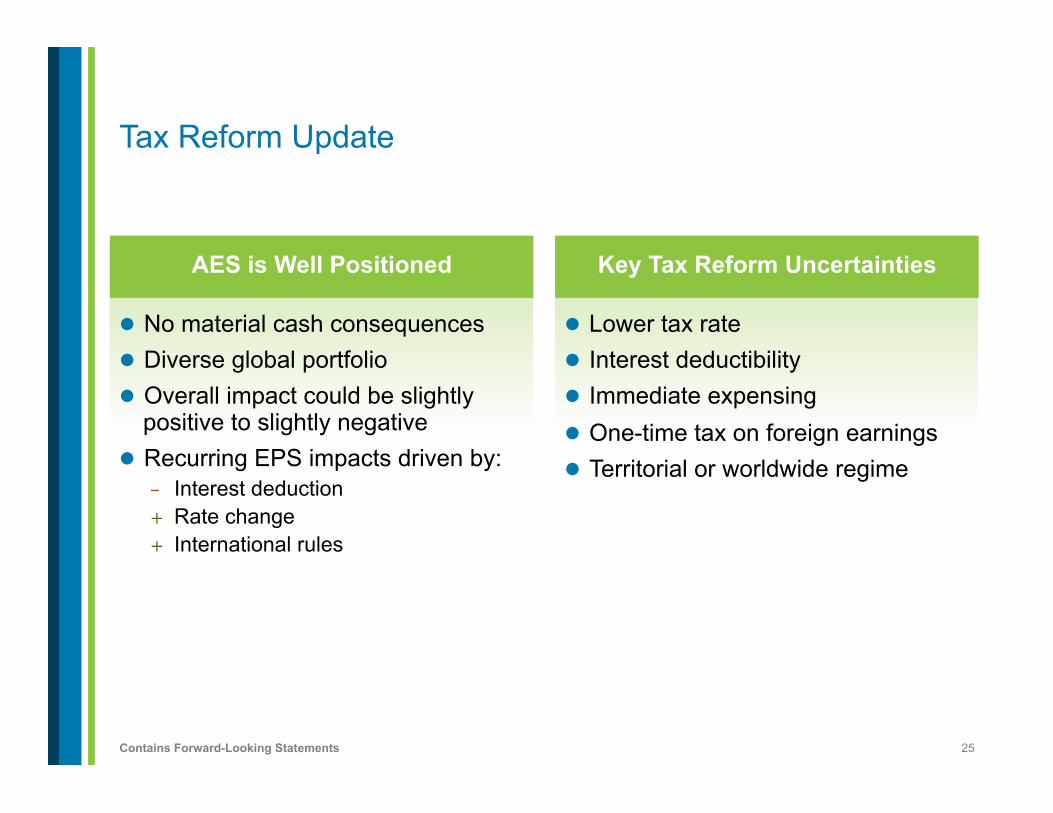
Tax Reform Update
Key Tax Reform Uncertainties
l Lower tax rate l Interest deductibility l Immediate expensing l One-time tax on foreign earnings l Territorial or worldwide regime
AES is Well Positioned
l No material cash consequences l Diverse global portfolio l Overall impact could be slightly
positive to slightly negative l Recurring EPS impacts driven by:
- Interest deduction + Rate change + International rules
26 Contains Forward-Looking Statements
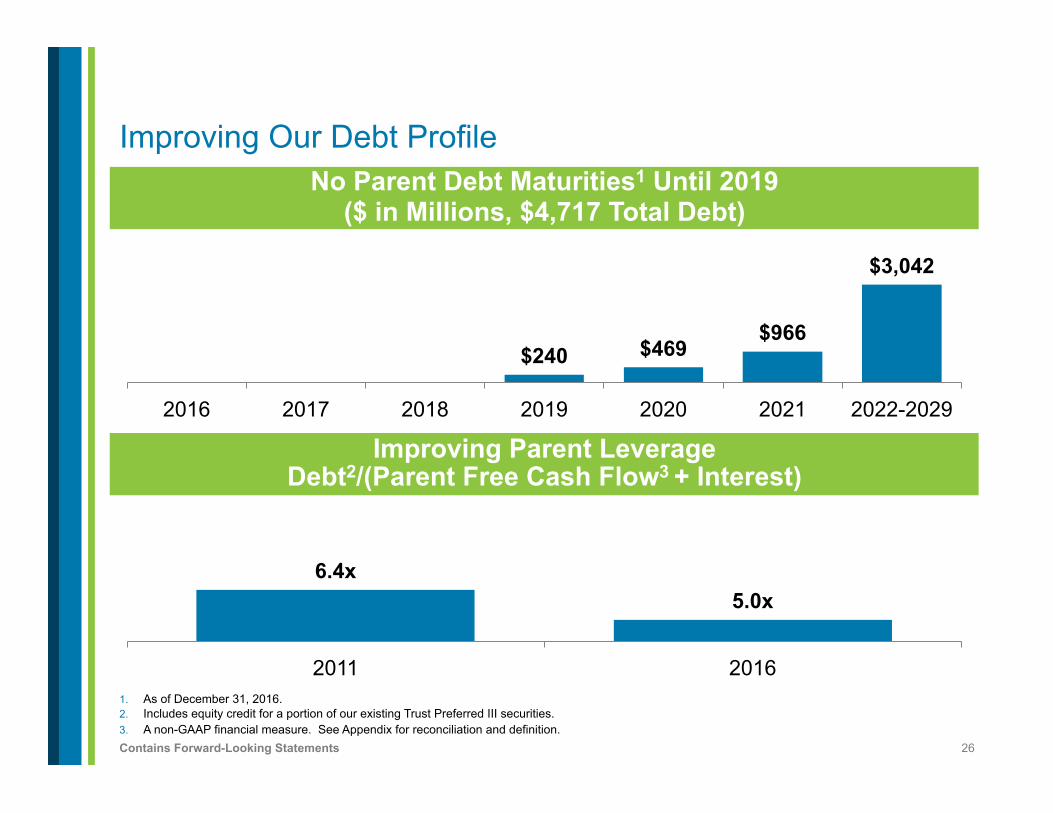
$240 $469 $966
$3,042
2016 2017 2018 2019 2020 2021 2022-2029
Improving Our Debt Profile No Parent Debt Maturities1 Until 2019
($ in Millions, $4,717 Total Debt)
Improving Parent Leverage Debt2/(Parent Free Cash Flow3 + Interest)
6.4x 5.0x
2011 2016 1. As of December 31, 2016. 2. Includes equity credit for a portion of our existing Trust Preferred III securities. 3. A non-GAAP financial measure. See Appendix for reconciliation and definition.
27 Contains Forward-Looking Statements
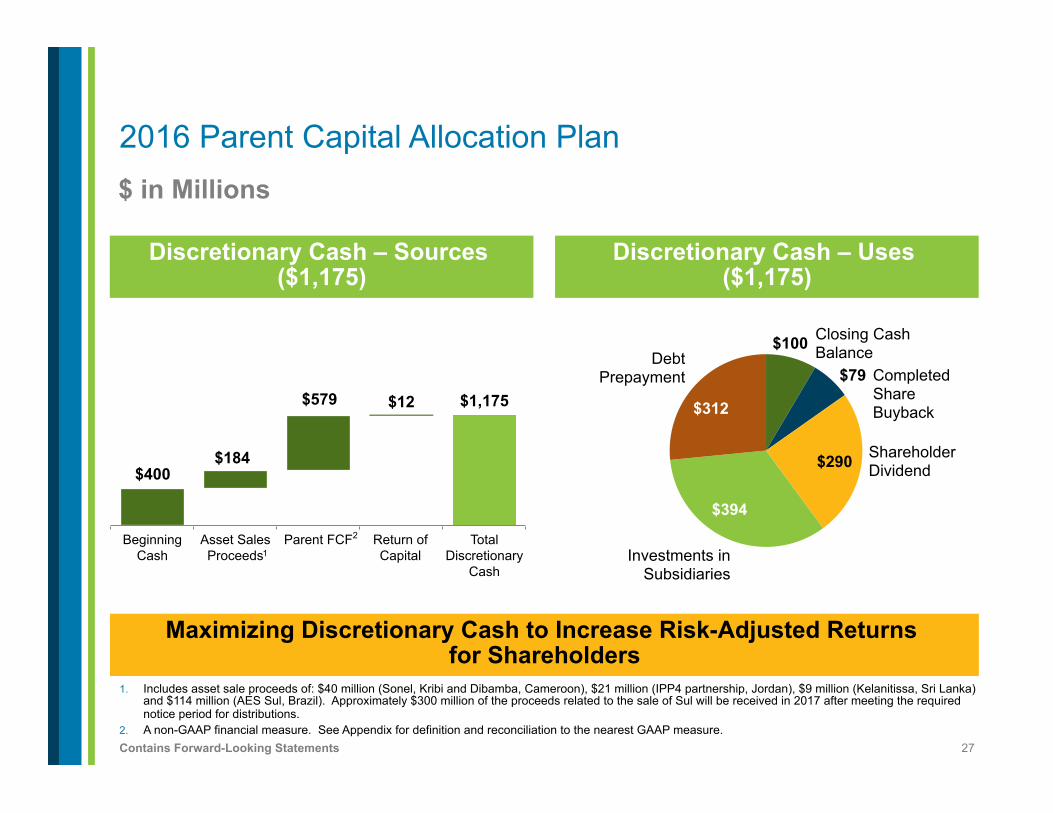
2016 Parent Capital Allocation Plan $ in Millions
1. Includes asset sale proceeds of: $40 million (Sonel, Kribi and Dibamba, Cameroon), $21 million (IPP4 partnership, Jordan), $9 million (Kelanitissa, Sri Lanka) and $114 million (AES Sul, Brazil). Approximately $300 million of the proceeds related to the sale of Sul will be received in 2017 after meeting the required notice period for distributions.
2. A non-GAAP financial measure. See Appendix for definition and reconciliation to the nearest GAAP measure.
Discretionary Cash – Uses ($1,175)
Discretionary Cash – Sources ($1,175)
$400
$579 $1,175
$184
$12
Beginning Cash
Asset Sales Proceeds
Parent FCF Return of Capital
Total Discretionary
Cash
2
1
$100
$79
$290
$394
$312
Closing Cash Balance
Investments in Subsidiaries
Shareholder Dividend
Debt Prepayment
Maximizing Discretionary Cash to Increase Risk-Adjusted Returns for Shareholders
Completed Share Buyback
28 Contains Forward-Looking Statements
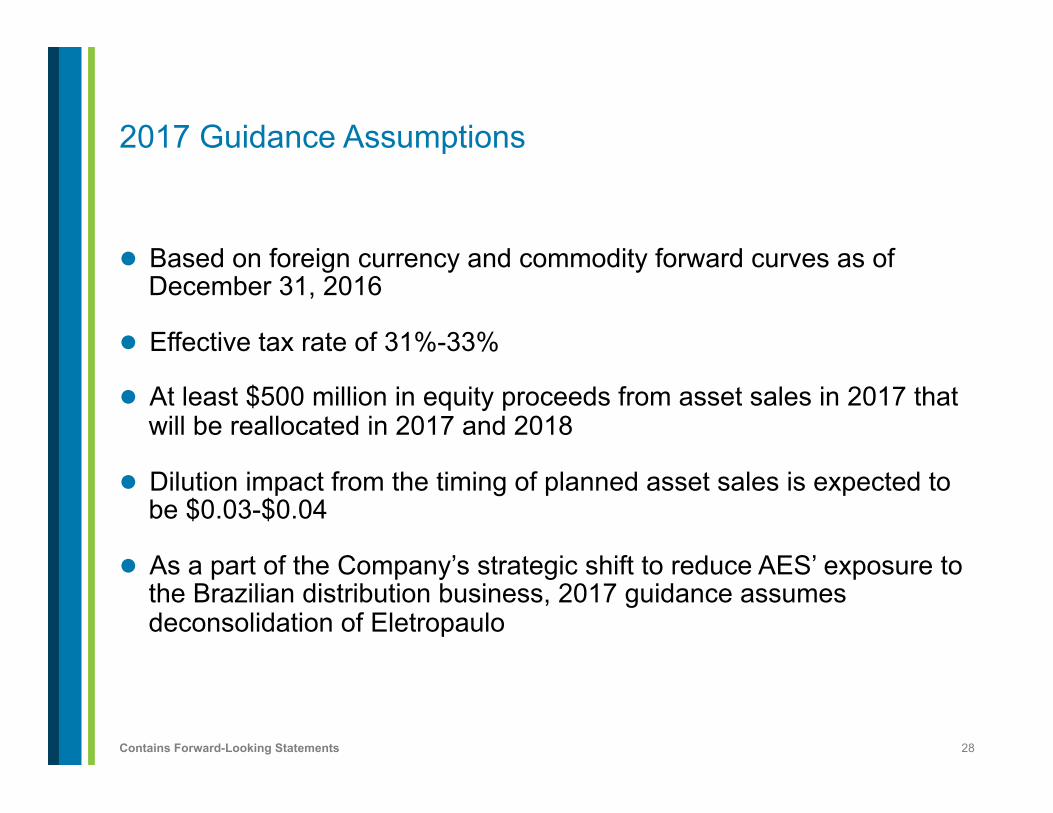
2017 Guidance Assumptions
l Based on foreign currency and commodity forward curves as of December 31, 2016
l Effective tax rate of 31%-33%
l At least $500 million in equity proceeds from asset sales in 2017 that will be reallocated in 2017 and 2018
l Dilution impact from the timing of planned asset sales is expected to be $0.03-$0.04
l As a part of the Company’s strategic shift to reduce AES’ exposure to the Brazilian distribution business, 2017 guidance assumes deconsolidation of Eletropaulo
29 Contains Forward-Looking Statements
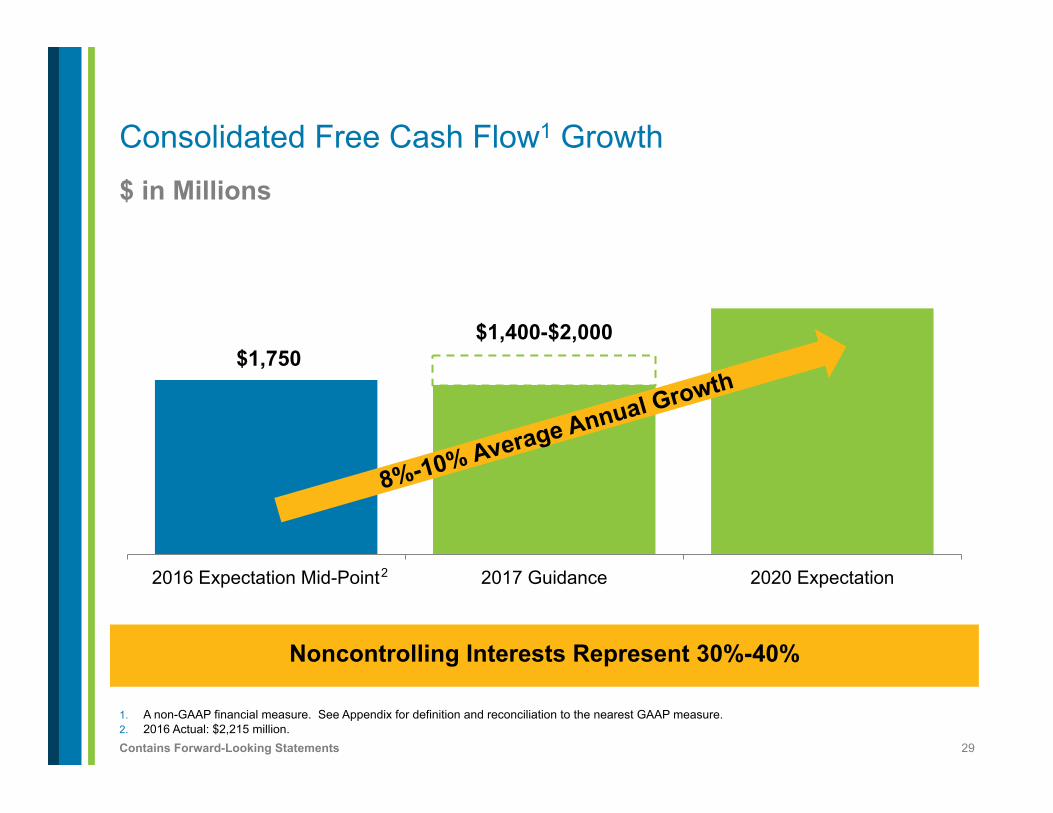
$ in Millions
Consolidated Free Cash Flow1 Growth
$1,750 $1,400-$2,000
2016 Expectation Mid-Point 2017 Guidance 2020 Expectation
1. A non-GAAP financial measure. See Appendix for definition and reconciliation to the nearest GAAP measure. 2. 2016 Actual: $2,215 million.
8%-10% Average Annual Growth
Noncontrolling Interests Represent 30%-40%
2
30 Contains Forward-Looking Statements
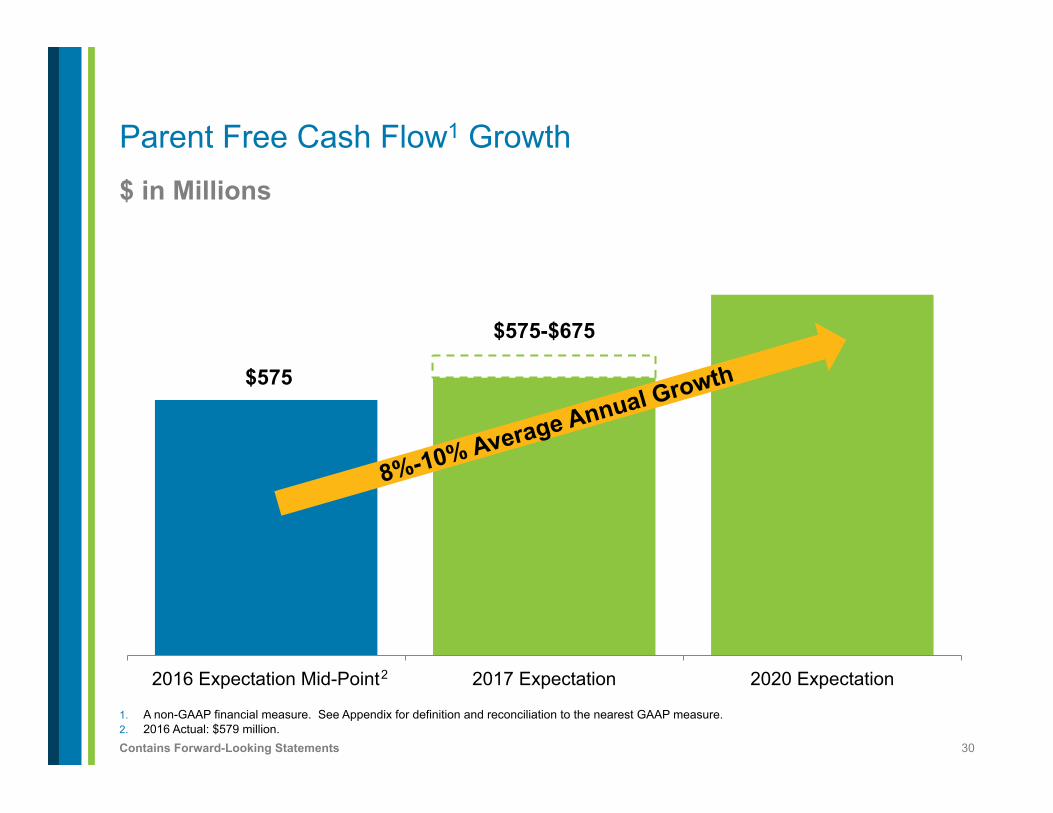
$ in Millions
Parent Free Cash Flow1 Growth
$575
$575-$675
2016 Expectation Mid-Point 2017 Expectation 2020 Expectation
1. A non-GAAP financial measure. See Appendix for definition and reconciliation to the nearest GAAP measure. 2. 2016 Actual: $579 million.
8%-10% Average Annual Growth
2
31 Contains Forward-Looking Statements
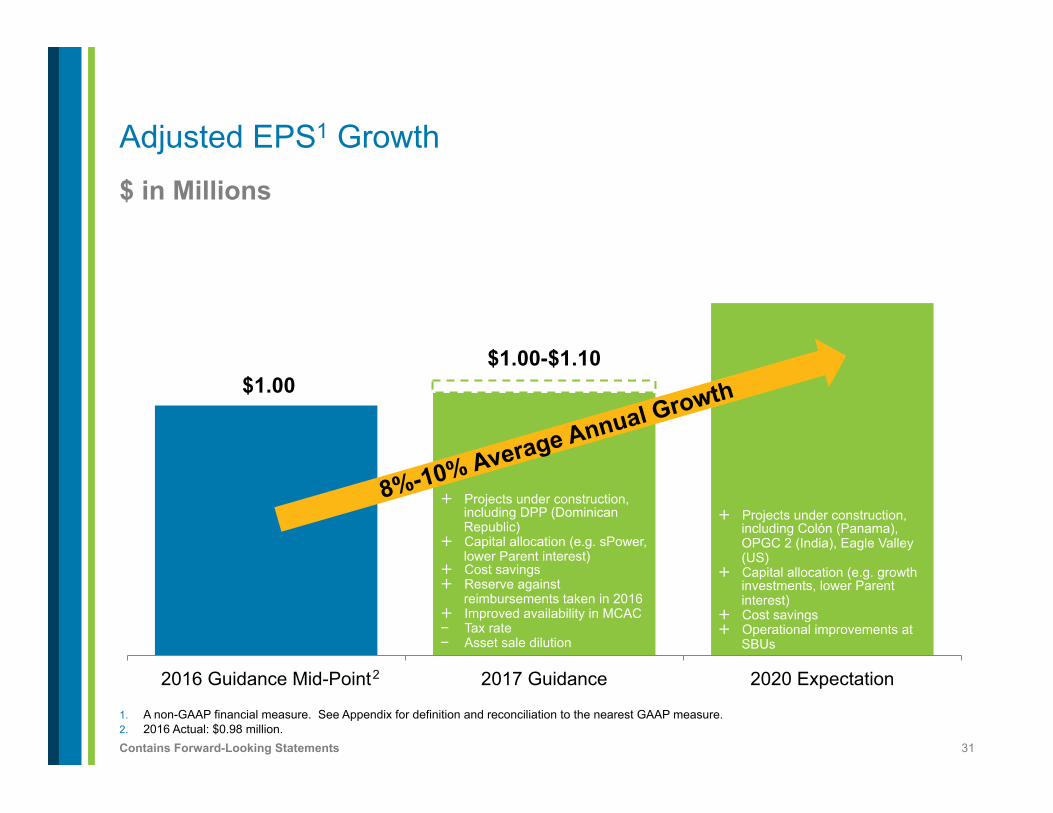
$ in Millions
Adjusted EPS1 Growth
$1.00 $1.00-$1.10
2016 Guidance Mid-Point 2017 Guidance 2020 Expectation
1. A non-GAAP financial measure. See Appendix for definition and reconciliation to the nearest GAAP measure. 2. 2016 Actual: $0.98 million.
8%-10% Average Annual Growth
+ Projects under construction, including DPP (Dominican Republic)
+ Capital allocation (e.g. sPower, lower Parent interest)
+ Cost savings + Reserve against
reimbursements taken in 2016 + Improved availability in MCAC - Tax rate - Asset sale dilution
+ Projects under construction, including Colón (Panama), OPGC 2 (India), Eagle Valley (US)
+ Capital allocation (e.g. growth investments, lower Parent interest)
+ Cost savings + Operational improvements at
SBUs
2
32 Contains Forward-Looking Statements
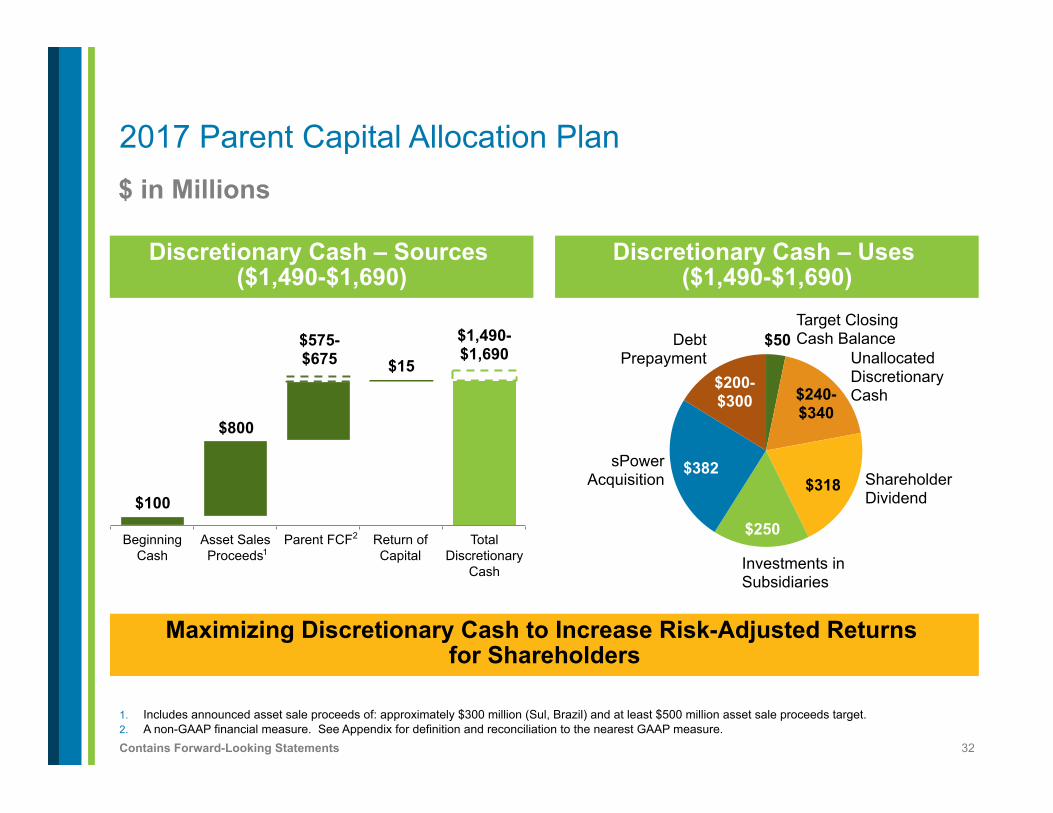
2017 Parent Capital Allocation Plan $ in Millions
1. Includes announced asset sale proceeds of: approximately $300 million (Sul, Brazil) and at least $500 million asset sale proceeds target. 2. A non-GAAP financial measure. See Appendix for definition and reconciliation to the nearest GAAP measure.
Discretionary Cash – Uses ($1,490-$1,690)
Discretionary Cash – Sources ($1,490-$1,690)
$100
$575- $675
$1,490-$1,690
$800
$15
Beginning Cash
Asset Sales Proceeds
Parent FCF Return of Capital
Total Discretionary
Cash
2
1
$50
$240- $340
$318
$250
$382
$200- $300
Target Closing Cash Balance
Shareholder Dividend
Unallocated Discretionary Cash
Investments in Subsidiaries
Maximizing Discretionary Cash to Increase Risk-Adjusted Returns for Shareholders
Debt Prepayment
sPower Acquisition
33 Contains Forward-Looking Statements
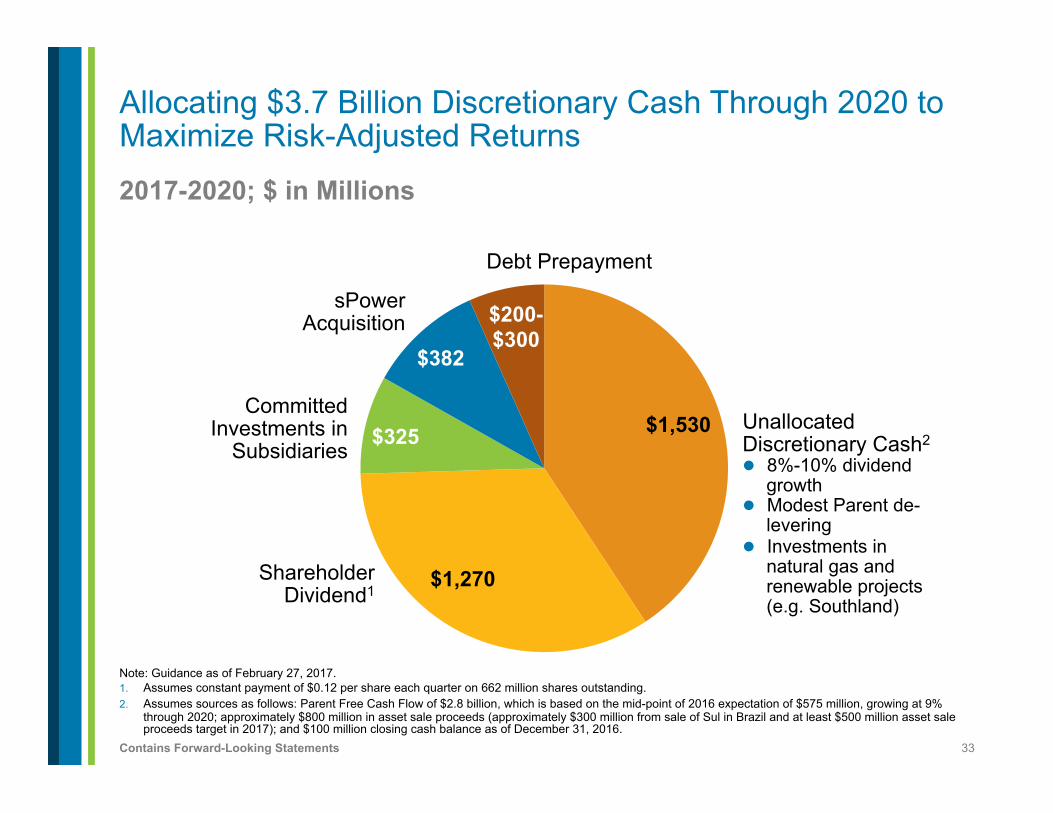
2017-2020; $ in Millions
Note: Guidance as of February 27, 2017. 1. Assumes constant payment of $0.12 per share each quarter on 662 million shares outstanding. 2. Assumes sources as follows: Parent Free Cash Flow of $2.8 billion, which is based on the mid-point of 2016 expectation of $575 million, growing at 9%
through 2020; approximately $800 million in asset sale proceeds (approximately $300 million from sale of Sul in Brazil and at least $500 million asset sale proceeds target in 2017); and $100 million closing cash balance as of December 31, 2016.
Allocating $3.7 Billion Discretionary Cash Through 2020 to Maximize Risk-Adjusted Returns
$1,530
$1,270
$325
$382
$200-$300
Unallocated Discretionary Cash2 l 8%-10% dividend
growth l Modest Parent de-
levering l Investments in
natural gas and renewable projects (e.g. Southland)
Debt Prepayment
sPower Acquisition
Committed Investments in
Subsidiaries
Shareholder Dividend1
34 Contains Forward-Looking Statements
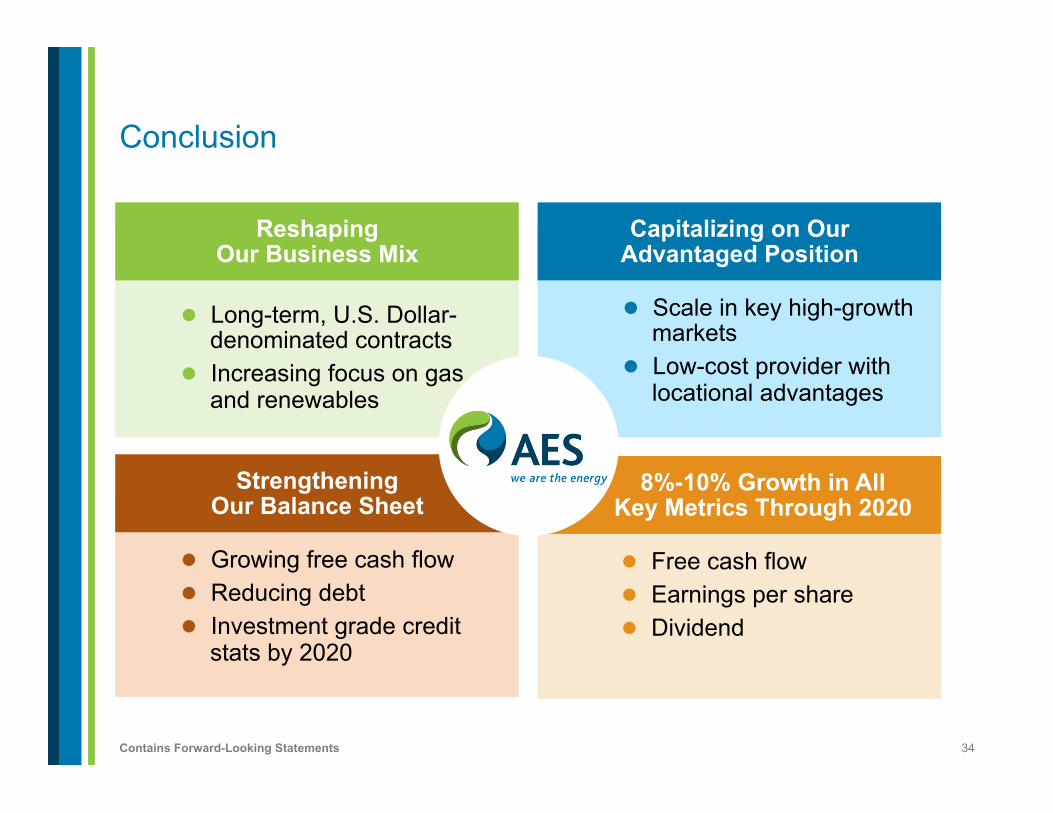
8%-10% Growth in All Key Metrics Through 2020
Strengthening Our Balance Sheet
Capitalizing on Our Advantaged Position
Conclusion
l Scale in key high-growth markets
l Low-cost provider with locational advantages
l Free cash flow l Earnings per share l Dividend
l Growing free cash flow l Reducing debt l Investment grade credit
stats by 2020
l Long-term, U.S. Dollar-denominated contracts
l Increasing focus on gas and renewables
Reshaping Our Business Mix
35 Contains Forward-Looking Statements 1. A non-GAAP financial measure.
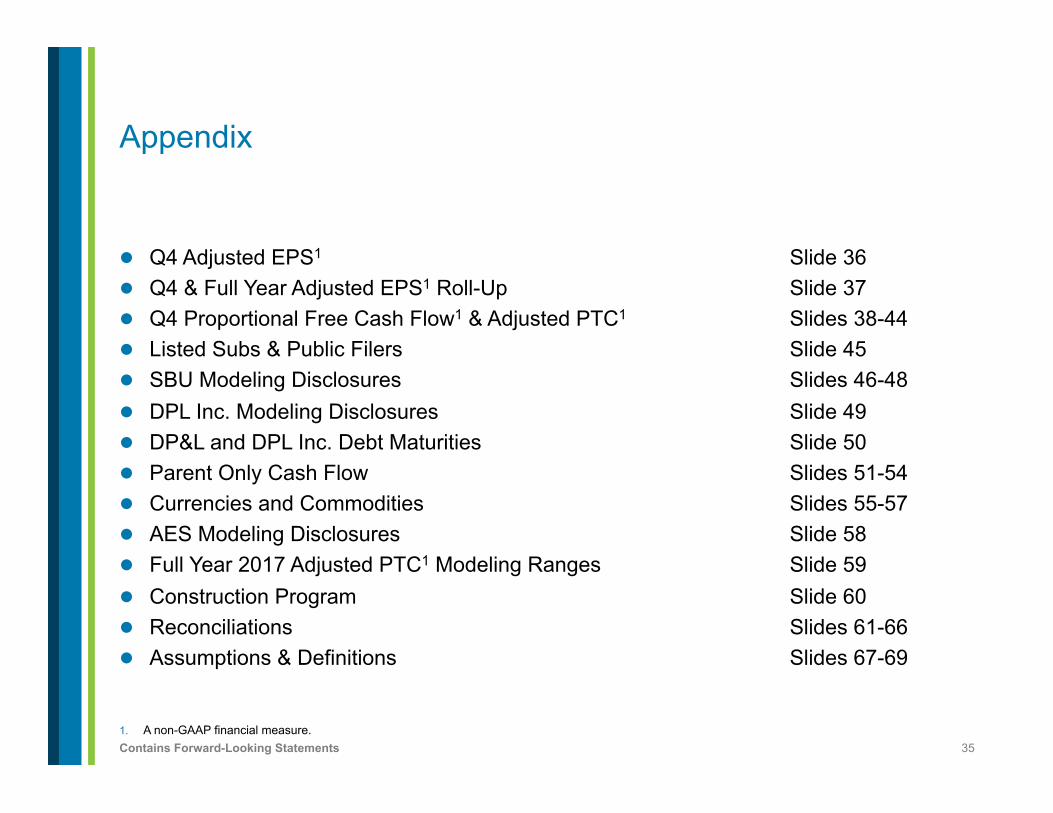
Appendix
l Q4 Adjusted EPS1 Slide 36 l Q4 & Full Year Adjusted EPS1 Roll-Up Slide 37 l Q4 Proportional Free Cash Flow1 & Adjusted PTC1 Slides 38-44 l Listed Subs & Public Filers Slide 45 l SBU Modeling Disclosures Slides 46-48 l DPL Inc. Modeling Disclosures Slide 49 l DP&L and DPL Inc. Debt Maturities Slide 50 l Parent Only Cash Flow Slides 51-54 l Currencies and Commodities Slides 55-57 l AES Modeling Disclosures Slide 58 l Full Year 2017 Adjusted PTC1 Modeling Ranges Slide 59 l Construction Program Slide 60 l Reconciliations Slides 61-66 l Assumptions & Definitions Slides 67-69
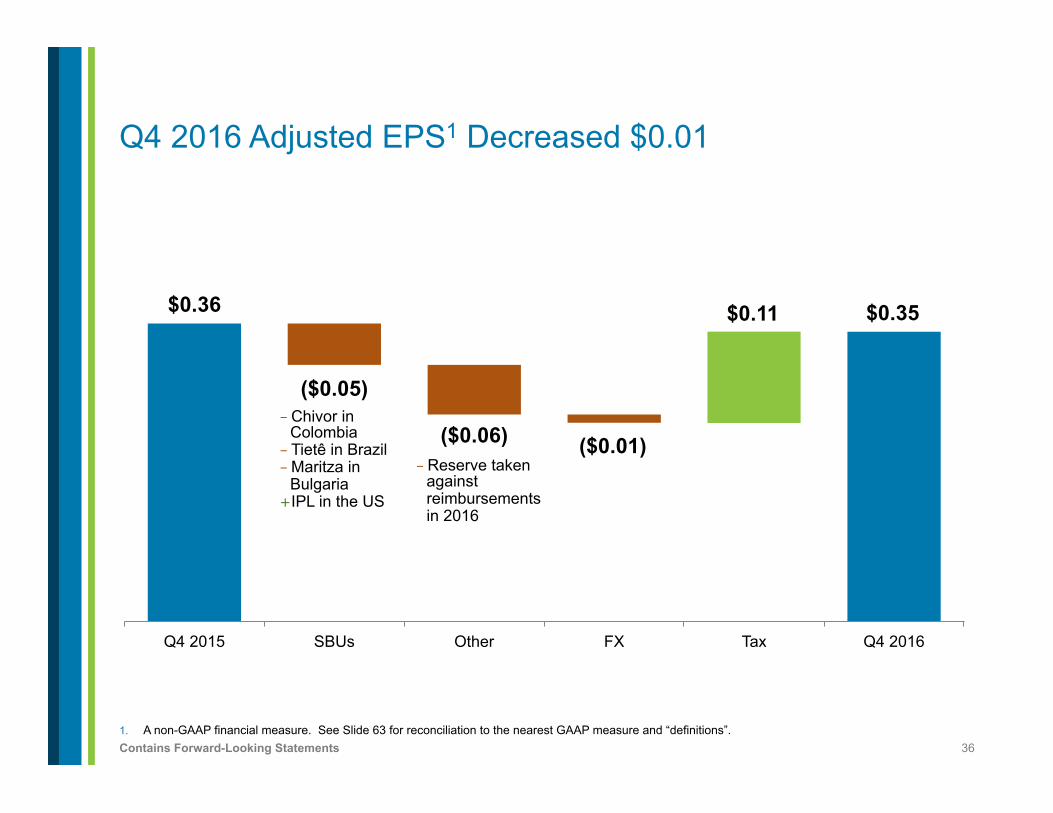
36 Contains Forward-Looking Statements 1. A non-GAAP financial measure. See Slide 63 for reconciliation to the nearest GAAP measure and “definitions”.
Q4 2016 Adjusted EPS1 Decreased $0.01
$0.36 $0.35
($0.05)
($0.06) ($0.01)
$0.11
Q4 2015 SBUs Other FX Tax Q4 2016
- Chivor in Colombia - Tietê in Brazil - Maritza in
Bulgaria + IPL in the US
- Reserve taken against reimbursements in 2016
37 Contains Forward-Looking Statements
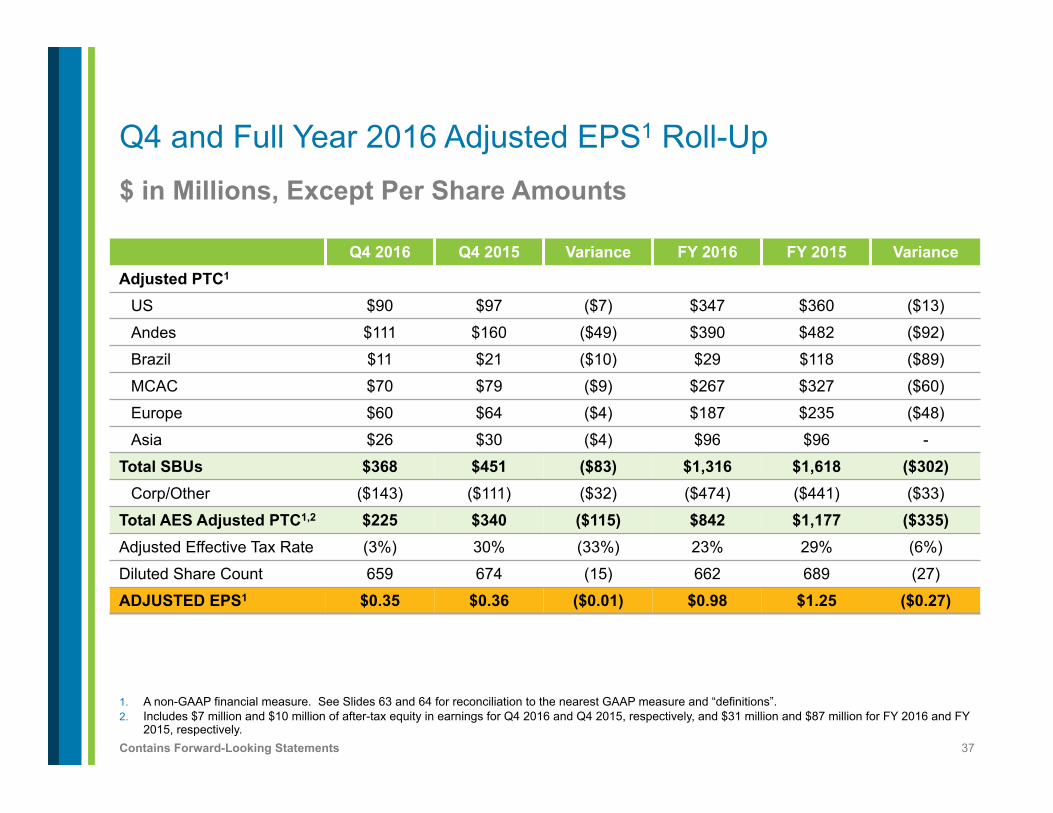
$ in Millions, Except Per Share Amounts
1. A non-GAAP financial measure. See Slides 63 and 64 for reconciliation to the nearest GAAP measure and “definitions”. 2. Includes $7 million and $10 million of after-tax equity in earnings for Q4 2016 and Q4 2015, respectively, and $31 million and $87 million for FY 2016 and FY
2015, respectively.
Q4 and Full Year 2016 Adjusted EPS1 Roll-Up
Q4 2016 Q4 2015 Variance FY 2016 FY 2015 Variance Adjusted PTC1
US $90 $97 ($7) $347 $360 ($13)
Andes $111 $160 ($49) $390 $482 ($92)
Brazil $11 $21 ($10) $29 $118 ($89)
MCAC $70 $79 ($9) $267 $327 ($60)
Europe $60 $64 ($4) $187 $235 ($48)
Asia $26 $30 ($4) $96 $96 -
Total SBUs $368 $451 ($83) $1,316 $1,618 ($302) Corp/Other ($143) ($111) ($32) ($474) ($441) ($33)
Total AES Adjusted PTC1,2 $225 $340 ($115) $842 $1,177 ($335) Adjusted Effective Tax Rate (3%) 30% (33%) 23% 29% (6%)
Diluted Share Count 659 674 (15) 662 689 (27)
ADJUSTED EPS1 $0.35 $0.36 ($0.01) $0.98 $1.25 ($0.27)
38 Contains Forward-Looking Statements
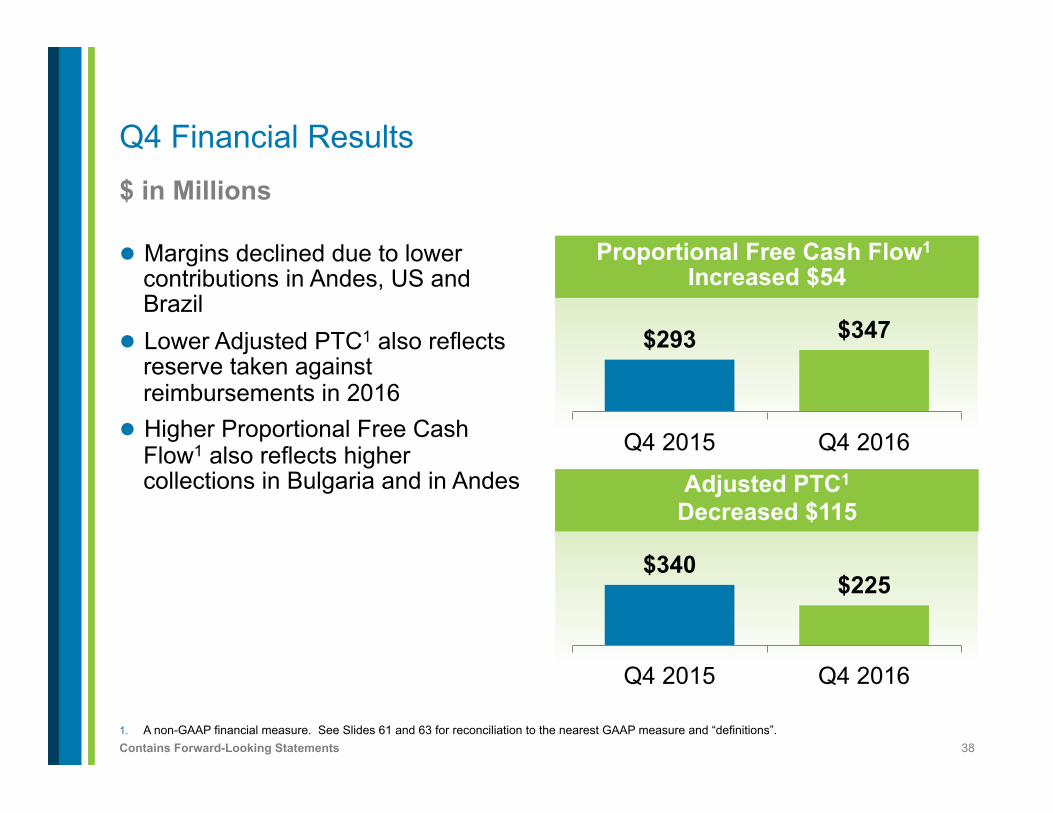
Q4 Financial Results $ in Millions
1. A non-GAAP financial measure. See Slides 61 and 63 for reconciliation to the nearest GAAP measure and “definitions”.
l Margins declined due to lower contributions in Andes, US and Brazil
l Lower Adjusted PTC1 also reflects reserve taken against reimbursements in 2016
l Higher Proportional Free Cash Flow1 also reflects higher collections in Bulgaria and in Andes
Proportional Free Cash Flow1 Increased $54
$293 $347
Q4 2015 Q4 2016
Adjusted PTC1
Decreased $115
$340 $225
Q4 2015 Q4 2016
39 Contains Forward-Looking Statements
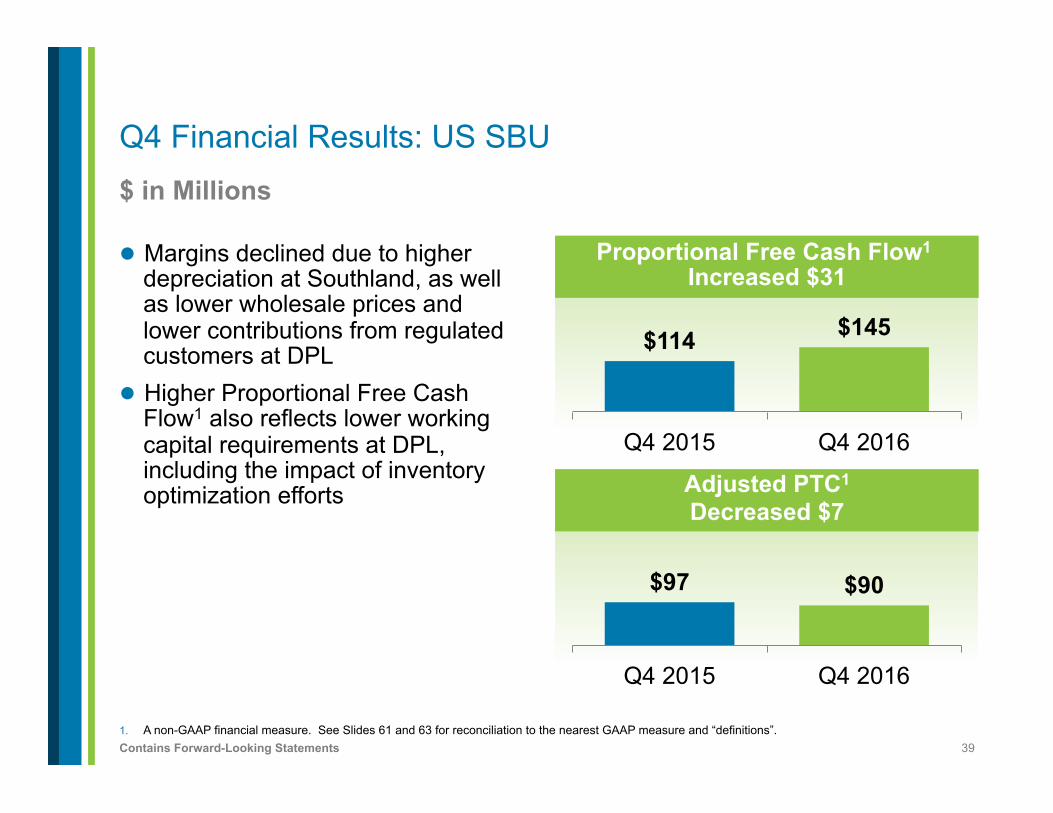
Q4 Financial Results: US SBU $ in Millions
l Margins declined due to higher depreciation at Southland, as well as lower wholesale prices and lower contributions from regulated customers at DPL
l Higher Proportional Free Cash Flow1 also reflects lower working capital requirements at DPL, including the impact of inventory optimization efforts
Proportional Free Cash Flow1 Increased $31
$114 $145
Q4 2015 Q4 2016
Adjusted PTC1
Decreased $7
$97 $90
Q4 2015 Q4 2016
1. A non-GAAP financial measure. See Slides 61 and 63 for reconciliation to the nearest GAAP measure and “definitions”.
40 Contains Forward-Looking Statements
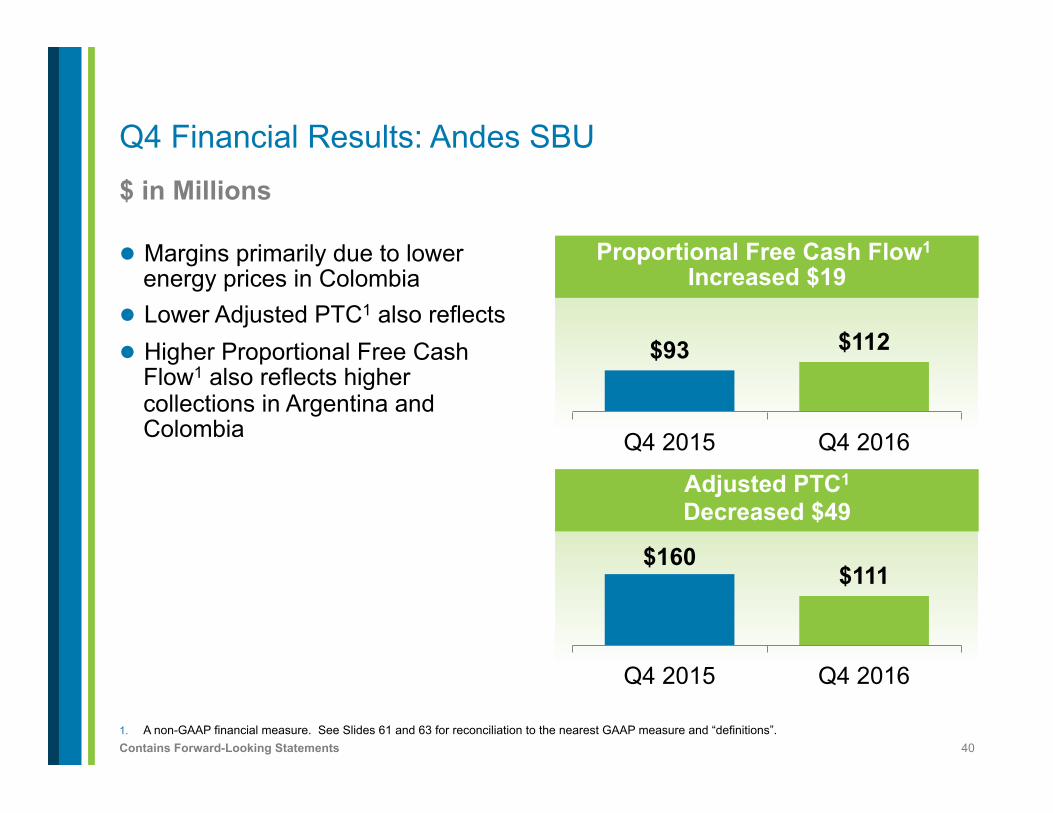
Q4 Financial Results: Andes SBU $ in Millions
l Margins primarily due to lower energy prices in Colombia
l Lower Adjusted PTC1 also reflects l Higher Proportional Free Cash
Flow1 also reflects higher collections in Argentina and Colombia
Proportional Free Cash Flow1 Increased $19
$93 $112
Q4 2015 Q4 2016
Adjusted PTC1
Decreased $49
$160 $111
Q4 2015 Q4 2016
1. A non-GAAP financial measure. See Slides 61 and 63 for reconciliation to the nearest GAAP measure and “definitions”.
41 Contains Forward-Looking Statements
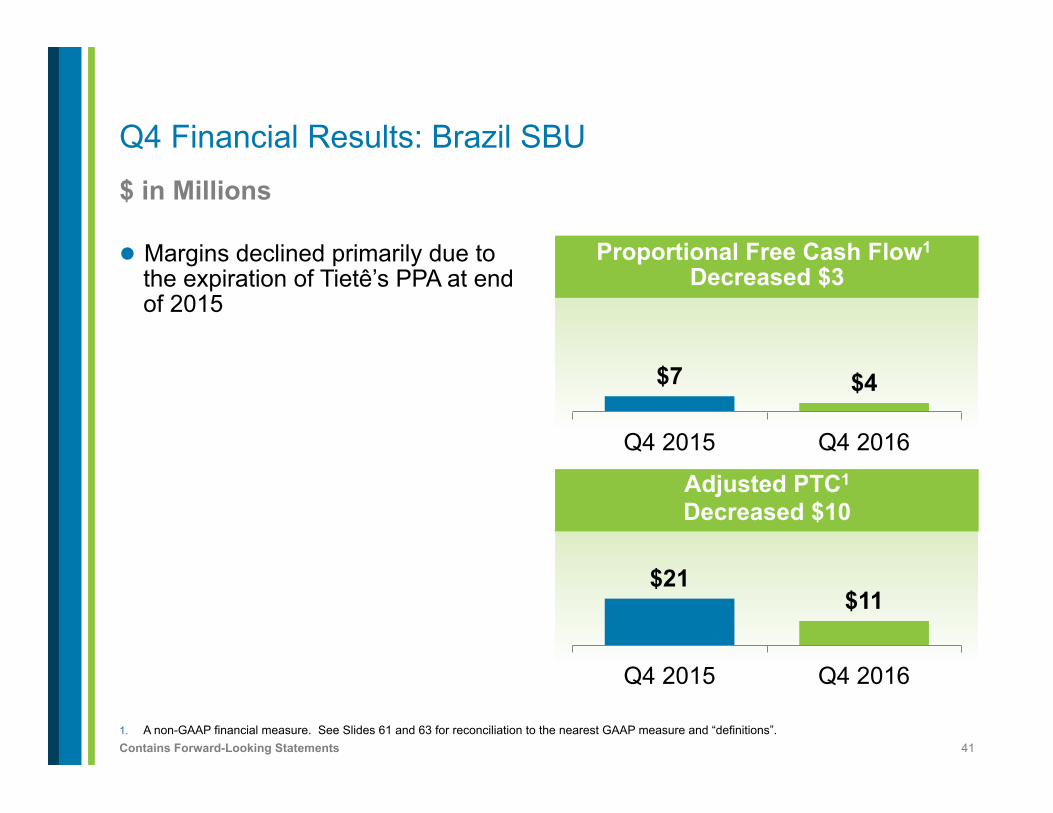
Q4 Financial Results: Brazil SBU $ in Millions
l Margins declined primarily due to the expiration of Tietê’s PPA at end of 2015
Proportional Free Cash Flow1 Decreased $3
$7 $4
Q4 2015 Q4 2016
Adjusted PTC1
Decreased $10
$21 $11
Q4 2015 Q4 2016
1. A non-GAAP financial measure. See Slides 61 and 63 for reconciliation to the nearest GAAP measure and “definitions”.
42 Contains Forward-Looking Statements
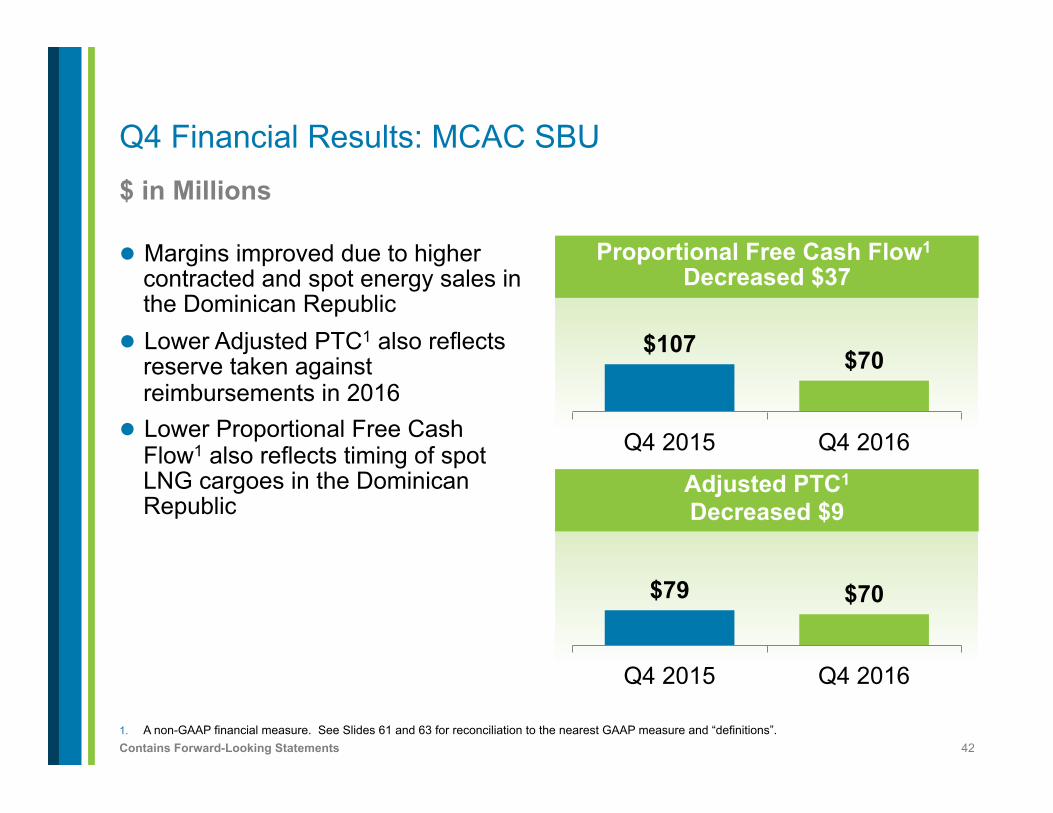
Q4 Financial Results: MCAC SBU $ in Millions
l Margins improved due to higher contracted and spot energy sales in the Dominican Republic
l Lower Adjusted PTC1 also reflects reserve taken against reimbursements in 2016
l Lower Proportional Free Cash Flow1 also reflects timing of spot LNG cargoes in the Dominican Republic
Proportional Free Cash Flow1 Decreased $37
$107 $70
Q4 2015 Q4 2016
Adjusted PTC1
Decreased $9
$79 $70
Q4 2015 Q4 2016
1. A non-GAAP financial measure. See Slides 61 and 63 for reconciliation to the nearest GAAP measure and “definitions”.
43 Contains Forward-Looking Statements
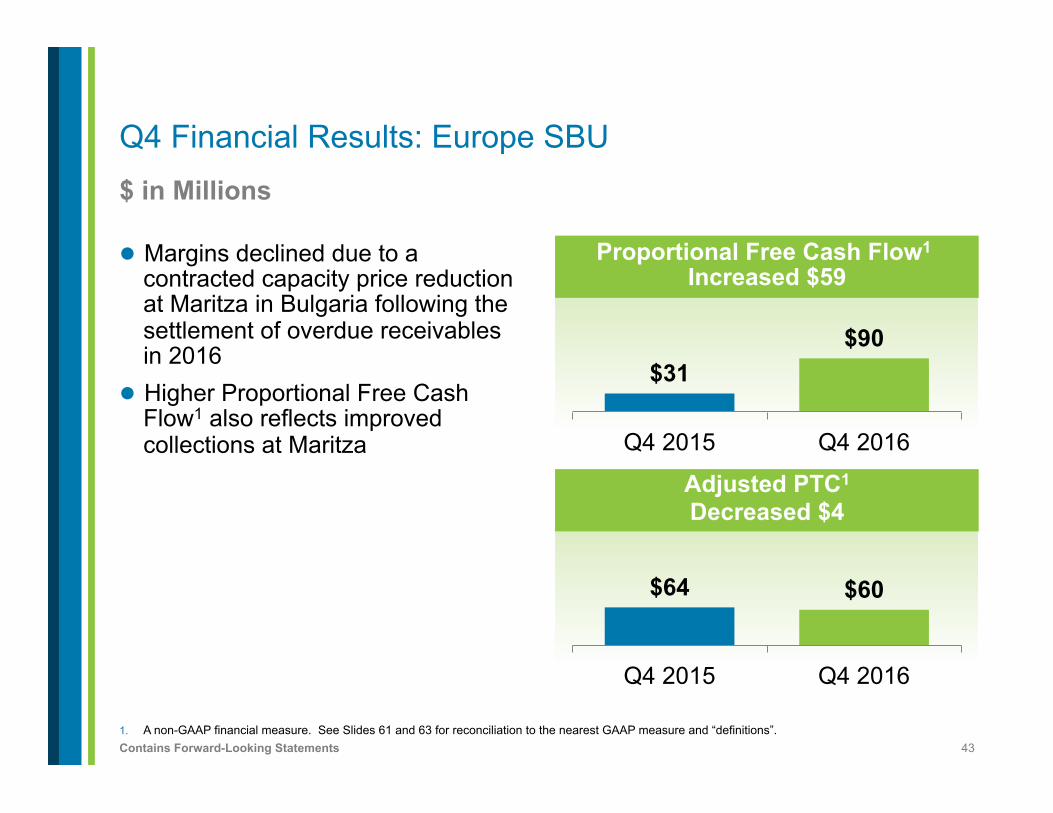
Q4 Financial Results: Europe SBU $ in Millions
l Margins declined due to a contracted capacity price reduction at Maritza in Bulgaria following the settlement of overdue receivables in 2016
l Higher Proportional Free Cash Flow1 also reflects improved collections at Maritza
Proportional Free Cash Flow1 Increased $59
$31 $90
Q4 2015 Q4 2016
Adjusted PTC1
Decreased $4
$64 $60
Q4 2015 Q4 2016
1. A non-GAAP financial measure. See Slides 61 and 63 for reconciliation to the nearest GAAP measure and “definitions”.
44 Contains Forward-Looking Statements
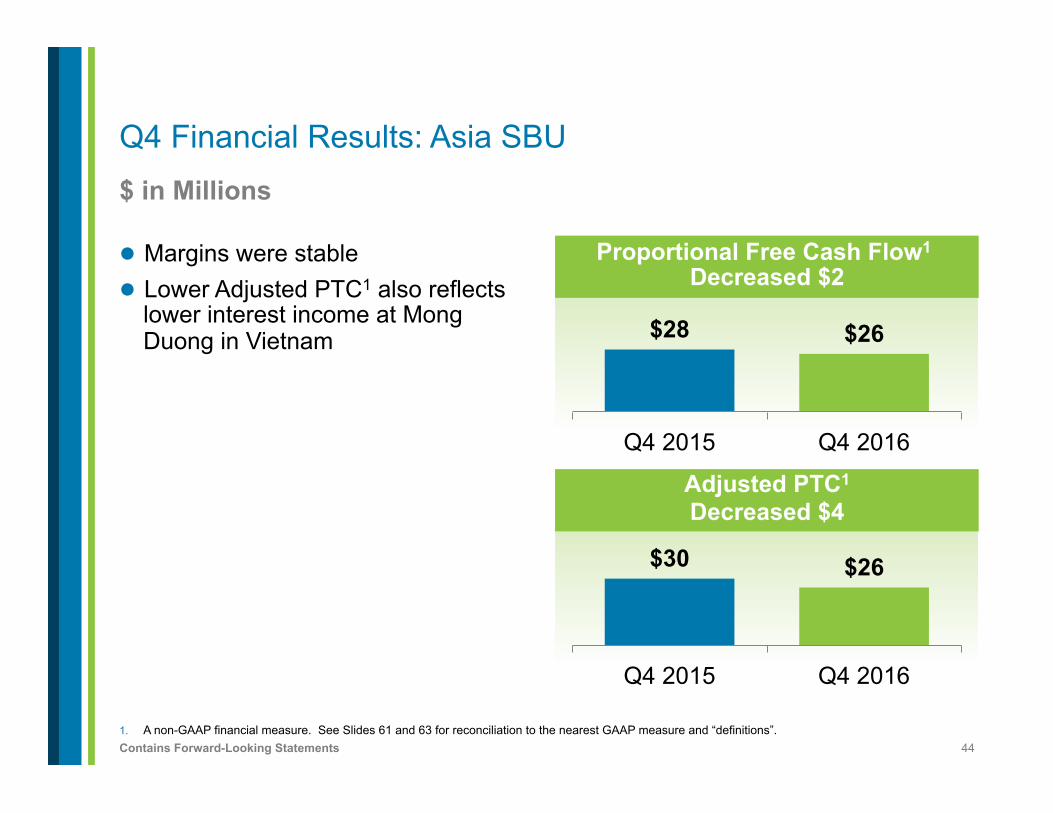
Q4 Financial Results: Asia SBU $ in Millions
l Margins were stable l Lower Adjusted PTC1 also reflects
lower interest income at Mong Duong in Vietnam
Proportional Free Cash Flow1 Decreased $2
$28 $26
Q4 2015 Q4 2016
Adjusted PTC1
Decreased $4
$30 $26
Q4 2015 Q4 2016
1. A non-GAAP financial measure. See Slides 61 and 63 for reconciliation to the nearest GAAP measure and “definitions”.
45 Contains Forward-Looking Statements
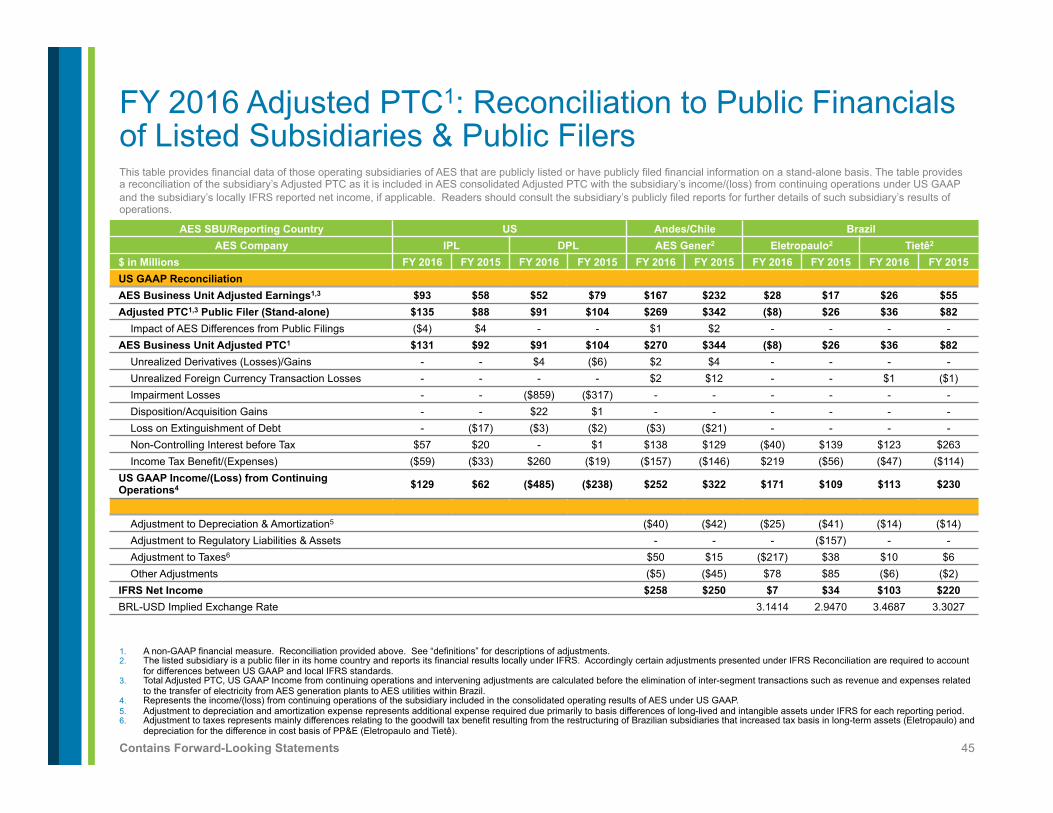
This table provides financial data of those operating subsidiaries of AES that are publicly listed or have publicly filed financial information on a stand-alone basis. The table provides a reconciliation of the subsidiary’s Adjusted PTC as it is included in AES consolidated Adjusted PTC with the subsidiary’s income/(loss) from continuing operations under US GAAP and the subsidiary’s locally IFRS reported net income, if applicable. Readers should consult the subsidiary’s publicly filed reports for further details of such subsidiary’s results of operations.
1. A non-GAAP financial measure. Reconciliation provided above. See “definitions” for descriptions of adjustments. 2. The listed subsidiary is a public filer in its home country and reports its financial results locally under IFRS. Accordingly certain adjustments presented under IFRS Reconciliation are required to account
for differences between US GAAP and local IFRS standards. 3. Total Adjusted PTC, US GAAP Income from continuing operations and intervening adjustments are calculated before the elimination of inter-segment transactions such as revenue and expenses related
to the transfer of electricity from AES generation plants to AES utilities within Brazil. 4. Represents the income/(loss) from continuing operations of the subsidiary included in the consolidated operating results of AES under US GAAP. 5. Adjustment to depreciation and amortization expense represents additional expense required due primarily to basis differences of long-lived and intangible assets under IFRS for each reporting period. 6. Adjustment to taxes represents mainly differences relating to the goodwill tax benefit resulting from the restructuring of Brazilian subsidiaries that increased tax basis in long-term assets (Eletropaulo) and
depreciation for the difference in cost basis of PP&E (Eletropaulo and Tietê).
FY 2016 Adjusted PTC1: Reconciliation to Public Financials of Listed Subsidiaries & Public Filers
AES SBU/Reporting Country US Andes/Chile Brazil AES Company IPL DPL AES Gener2 Eletropaulo2 Tietê2
$ in Millions FY 2016 FY 2015 FY 2016 FY 2015 FY 2016 FY 2015 FY 2016 FY 2015 FY 2016 FY 2015 US GAAP Reconciliation
AES Business Unit Adjusted Earnings1,3 $93 $58 $52 $79 $167 $232 $28 $17 $26 $55 Adjusted PTC1,3 Public Filer (Stand-alone) $135 $88 $91 $104 $269 $342 ($8) $26 $36 $82
Impact of AES Differences from Public Filings ($4) $4 - - $1 $2 - - - - AES Business Unit Adjusted PTC1 $131 $92 $91 $104 $270 $344 ($8) $26 $36 $82
Unrealized Derivatives (Losses)/Gains - - $4 ($6) $2 $4 - - - - Unrealized Foreign Currency Transaction Losses - - - - $2 $12 - - $1 ($1) Impairment Losses - - ($859) ($317) - - - - - - Disposition/Acquisition Gains - - $22 $1 - - - - - - Loss on Extinguishment of Debt - ($17) ($3) ($2) ($3) ($21) - - - - Non-Controlling Interest before Tax $57 $20 - $1 $138 $129 ($40) $139 $123 $263 Income Tax Benefit/(Expenses) ($59) ($33) $260 ($19) ($157) ($146) $219 ($56) ($47) ($114)
US GAAP Income/(Loss) from Continuing Operations4 $129 $62 ($485) ($238) $252 $322 $171 $109 $113 $230
Adjustment to Depreciation & Amortization5 ($40) ($42) ($25) ($41) ($14) ($14) Adjustment to Regulatory Liabilities & Assets - - - ($157) - - Adjustment to Taxes6 $50 $15 ($217) $38 $10 $6 Other Adjustments ($5) ($45) $78 $85 ($6) ($2)
IFRS Net Income $258 $250 $7 $34 $103 $220 BRL-USD Implied Exchange Rate 3.1414 2.9470 3.4687 3.3027

46 Contains Forward-Looking Statements
$ in Millions
1. A non-GAAP financial measure. See reconciliation to the nearest GAAP measure on Slide 64 and “definitions”.
FY 2016 Modeling Disclosures
Adjusted PTC1
Interest Expense Interest Income Depreciation & Amortization
Consolidated Adjustment Factor Proportional Consolidated Adjustment
Factor Proportional Consolidated Adjustment Factor Proportional
US $347 $236 ($28) $208 - - - $471 $73 $398
DPL $91 $105 - $105 - - - $130 - $130
IPL $131 $94 ($28) $66 - - - $218 ($65) $153
Andes $390 $178 ($57) $121 $56 ($3) $53 $218 ($75) $143
AES Gener $270 $162 ($57) $105 $9 ($3) $6 $210 ($75) $135
Brazil $29 $365 ($300) $65 $257 ($205) $52 $145 ($119) $26
Tietê $36 $66 ($50) $16 $25 ($19) $6 $33 ($25) $8
Eletropaulo ($8) $296 ($248) $48 $218 ($183) $35 $112 ($94) $18
MCAC $267 $163 ($22) $141 $11 ($2) $9 $165 ($39) $126
Europe $187 $68 ($16) $52 $5 ($1) $4 $116 ($17) $99
Asia $96 $111 ($54) $57 $134 ($66) $68 $33 ($16) $17
Subtotal $1,316 $1,121 (S477) $644 $463 ($277) $186 $1,148 ($339) $809
Corp/Other ($474) $310 - $310 $1 - $1 $12 - $12
TOTAL $842 $1,431 ($477) $954 $464 ($277) $187 $1,160 ($339) $821
47 Contains Forward-Looking Statements
$ in Millions
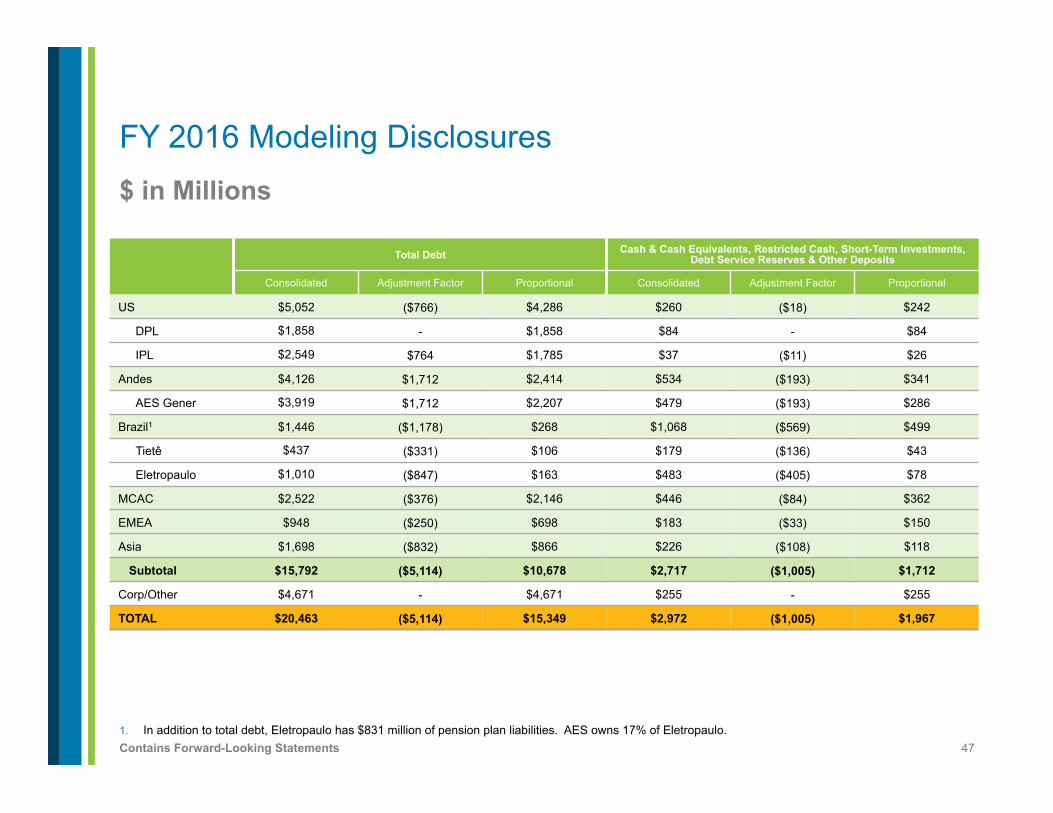
1. In addition to total debt, Eletropaulo has $831 million of pension plan liabilities. AES owns 17% of Eletropaulo.
FY 2016 Modeling Disclosures
Total Debt Cash & Cash Equivalents, Restricted Cash, Short-Term Investments, Debt Service Reserves & Other Deposits
Consolidated Adjustment Factor Proportional Consolidated Adjustment Factor Proportional
US $5,052 ($766) $4,286 $260 ($18) $242
DPL $1,858 - $1,858 $84 - $84
IPL $2,549 $764 $1,785 $37 ($11) $26
Andes $4,126 $1,712 $2,414 $534 ($193) $341
AES Gener $3,919 $1,712 $2,207 $479 ($193) $286
Brazil1 $1,446 ($1,178) $268 $1,068 ($569) $499
Tietê $437 ($331) $106 $179 ($136) $43
Eletropaulo $1,010 ($847) $163 $483 ($405) $78
MCAC $2,522 ($376) $2,146 $446 ($84) $362
EMEA $948 ($250) $698 $183 ($33) $150
Asia $1,698 ($832) $866 $226 ($108) $118
Subtotal $15,792 ($5,114) $10,678 $2,717 ($1,005) $1,712
Corp/Other $4,671 - $4,671 $255 - $255
TOTAL $20,463 ($5,114) $15,349 $2,972 ($1,005) $1,967
48 Contains Forward-Looking Statements
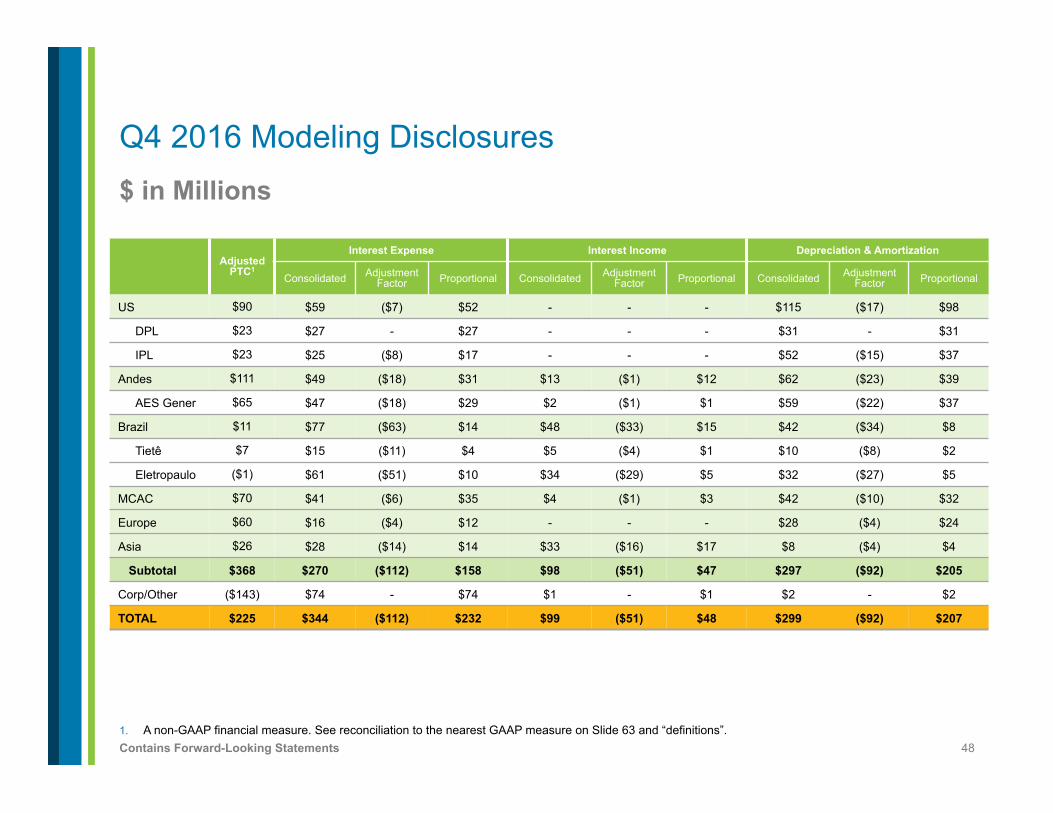
$ in Millions
1. A non-GAAP financial measure. See reconciliation to the nearest GAAP measure on Slide 63 and “definitions”.
Q4 2016 Modeling Disclosures
Adjusted PTC1
Interest Expense Interest Income Depreciation & Amortization
Consolidated Adjustment Factor Proportional Consolidated Adjustment
Factor Proportional Consolidated Adjustment Factor Proportional
US $90 $59 ($7) $52 - - - $115 ($17) $98
DPL $23 $27 - $27 - - - $31 - $31
IPL $23 $25 ($8) $17 - - - $52 ($15) $37
Andes $111 $49 ($18) $31 $13 ($1) $12 $62 ($23) $39
AES Gener $65 $47 ($18) $29 $2 ($1) $1 $59 ($22) $37
Brazil $11 $77 ($63) $14 $48 ($33) $15 $42 ($34) $8
Tietê $7 $15 ($11) $4 $5 ($4) $1 $10 ($8) $2
Eletropaulo ($1) $61 ($51) $10 $34 ($29) $5 $32 ($27) $5
MCAC $70 $41 ($6) $35 $4 ($1) $3 $42 ($10) $32
Europe $60 $16 ($4) $12 - - - $28 ($4) $24
Asia $26 $28 ($14) $14 $33 ($16) $17 $8 ($4) $4
Subtotal $368 $270 ($112) $158 $98 ($51) $47 $297 ($92) $205
Corp/Other ($143) $74 - $74 $1 - $1 $2 - $2
TOTAL $225 $344 ($112) $232 $99 ($51) $48 $299 ($92) $207
49 Contains Forward-Looking Statements
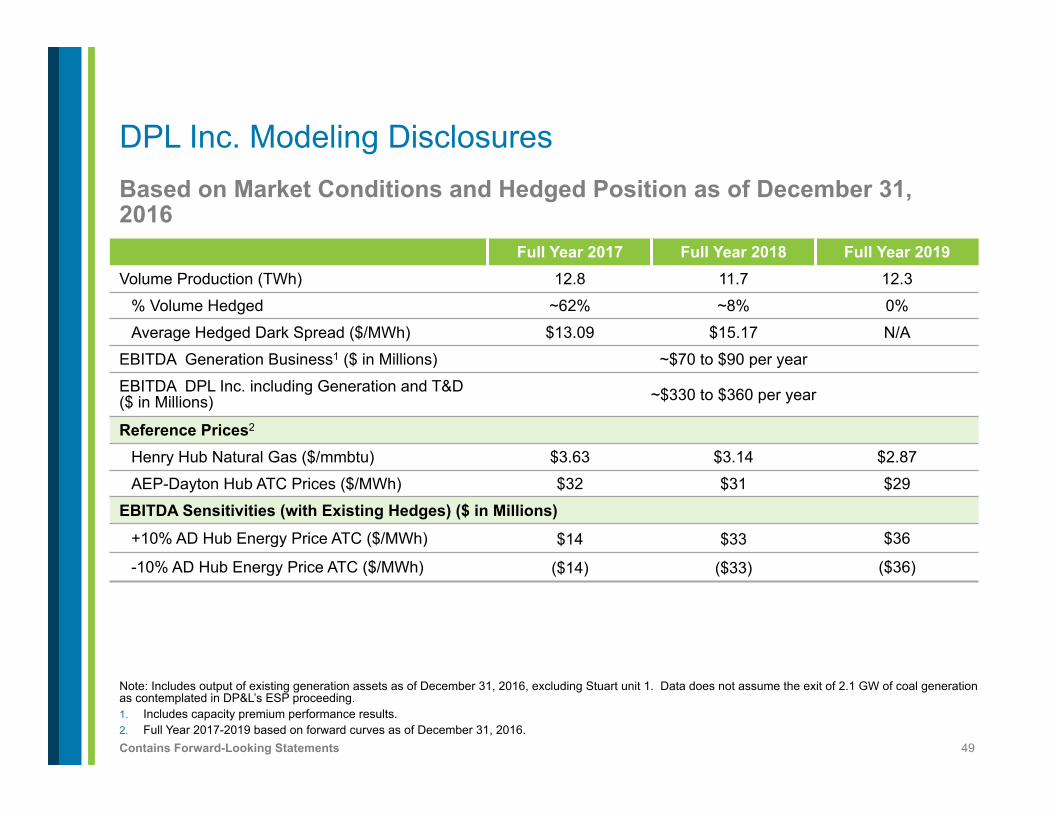
Based on Market Conditions and Hedged Position as of December 31, 2016
Note: Includes output of existing generation assets as of December 31, 2016, excluding Stuart unit 1. Data does not assume the exit of 2.1 GW of coal generation as contemplated in DP&L’s ESP proceeding. 1. Includes capacity premium performance results. 2. Full Year 2017-2019 based on forward curves as of December 31, 2016.
DPL Inc. Modeling Disclosures
Full Year 2017 Full Year 2018 Full Year 2019 Volume Production (TWh) 12.8 11.7 12.3
% Volume Hedged ~62% ~8% 0%
Average Hedged Dark Spread ($/MWh) $13.09 $15.17 N/A
EBITDA Generation Business1 ($ in Millions) ~$70 to $90 per year
EBITDA DPL Inc. including Generation and T&D ($ in Millions) ~$330 to $360 per year
Reference Prices2
Henry Hub Natural Gas ($/mmbtu) $3.63 $3.14 $2.87
AEP-Dayton Hub ATC Prices ($/MWh) $32 $31 $29
EBITDA Sensitivities (with Existing Hedges) ($ in Millions) +10% AD Hub Energy Price ATC ($/MWh) $14 $33 $36
-10% AD Hub Energy Price ATC ($/MWh) ($14) ($33) ($36)
50 Contains Forward-Looking Statements
$ in Millions
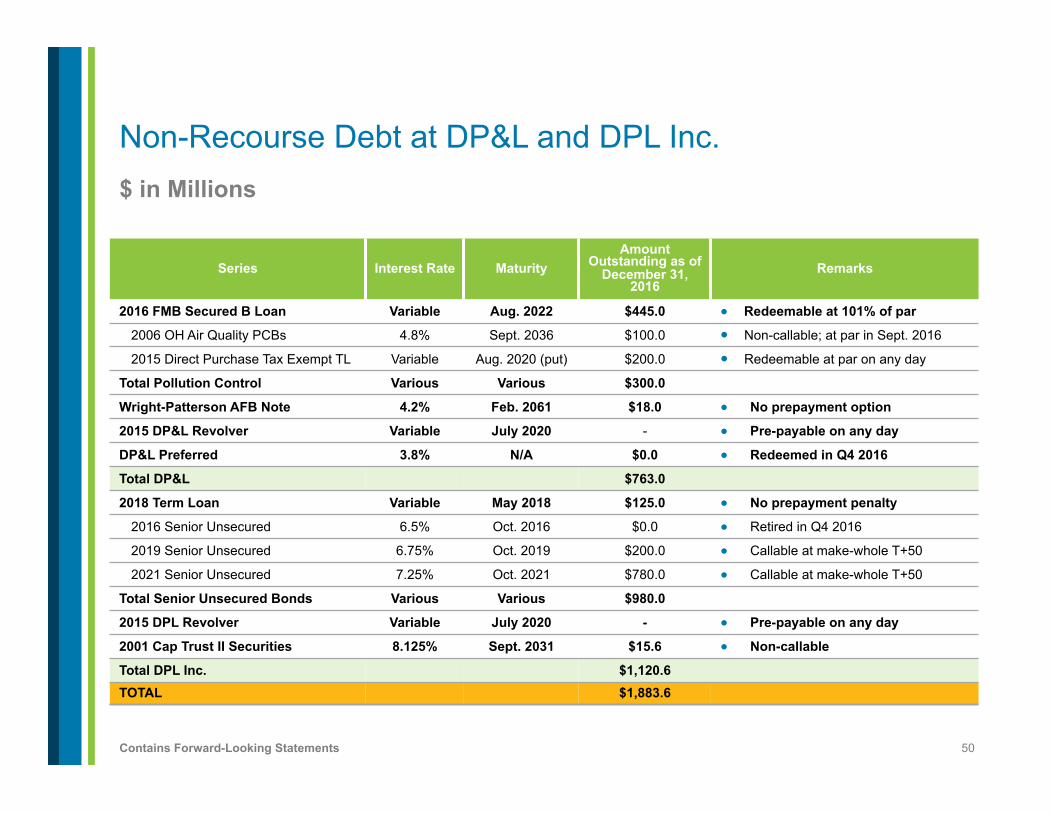
Non-Recourse Debt at DP&L and DPL Inc.
Series Interest Rate Maturity Amount
Outstanding as of December 31,
2016 Remarks
2016 FMB Secured B Loan Variable Aug. 2022 $445.0 ● Redeemable at 101% of par
2006 OH Air Quality PCBs 4.8% Sept. 2036 $100.0 ● Non-callable; at par in Sept. 2016
2015 Direct Purchase Tax Exempt TL Variable Aug. 2020 (put) $200.0 ● Redeemable at par on any day
Total Pollution Control Various Various $300.0
Wright-Patterson AFB Note 4.2% Feb. 2061 $18.0 ● No prepayment option
2015 DP&L Revolver Variable July 2020 - ● Pre-payable on any day
DP&L Preferred 3.8% N/A $0.0 ● Redeemed in Q4 2016
Total DP&L $763.0
2018 Term Loan Variable May 2018 $125.0 ● No prepayment penalty
2016 Senior Unsecured 6.5% Oct. 2016 $0.0 ● Retired in Q4 2016
2019 Senior Unsecured 6.75% Oct. 2019 $200.0 ● Callable at make-whole T+50
2021 Senior Unsecured 7.25% Oct. 2021 $780.0 ● Callable at make-whole T+50
Total Senior Unsecured Bonds Various Various $980.0
2015 DPL Revolver Variable July 2020 - ● Pre-payable on any day
2001 Cap Trust II Securities 8.125% Sept. 2031 $15.6 ● Non-callable
Total DPL Inc. $1,120.6 TOTAL $1,883.6
51 Contains Forward-Looking Statements
1. See “definitions”. 2. A non-GAAP financial measure. See “definitions”.
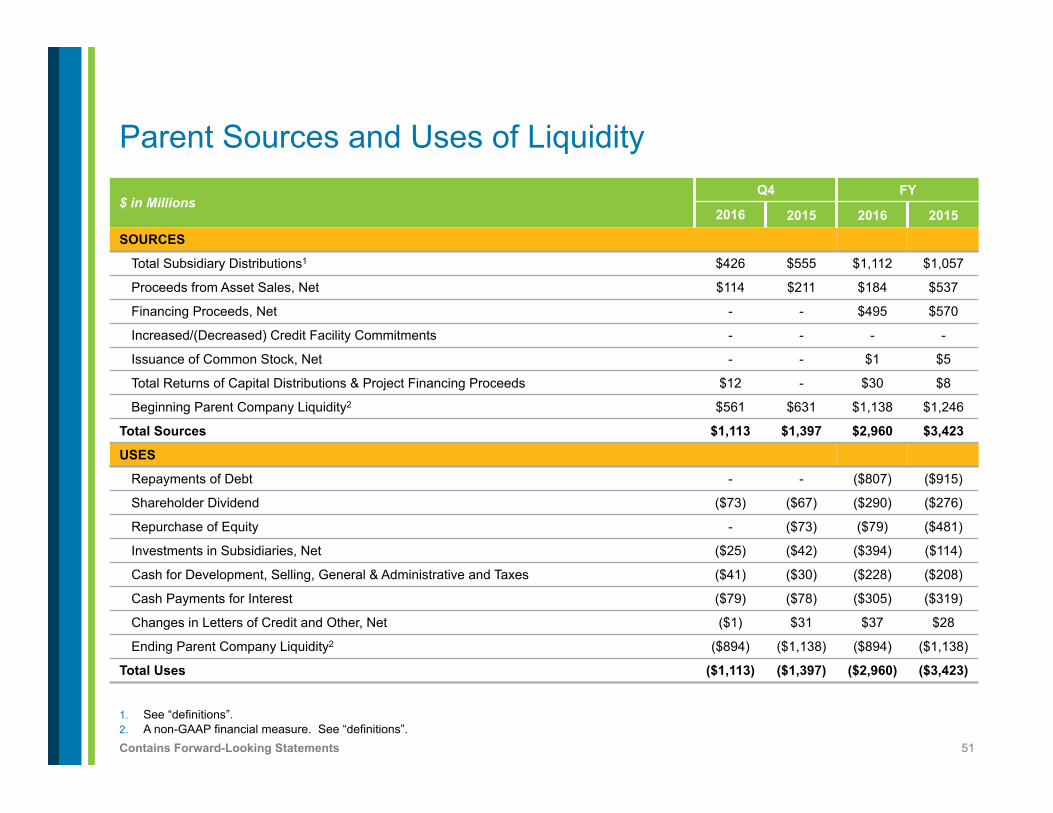
Parent Sources and Uses of Liquidity
$ in Millions Q4 FY
2016 2015 2016 2015
SOURCES
Total Subsidiary Distributions1 $426 $555 $1,112 $1,057
Proceeds from Asset Sales, Net $114 $211 $184 $537
Financing Proceeds, Net - - $495 $570
Increased/(Decreased) Credit Facility Commitments - - - -
Issuance of Common Stock, Net - - $1 $5
Total Returns of Capital Distributions & Project Financing Proceeds $12 - $30 $8
Beginning Parent Company Liquidity2 $561 $631 $1,138 $1,246
Total Sources $1,113 $1,397 $2,960 $3,423
USES
Repayments of Debt - - ($807) ($915)
Shareholder Dividend ($73) ($67) ($290) ($276)
Repurchase of Equity - ($73) ($79) ($481)
Investments in Subsidiaries, Net ($25) ($42) ($394) ($114)
Cash for Development, Selling, General & Administrative and Taxes ($41) ($30) ($228) ($208)
Cash Payments for Interest ($79) ($78) ($305) ($319)
Changes in Letters of Credit and Other, Net ($1) $31 $37 $28
Ending Parent Company Liquidity2 ($894) ($1,138) ($894) ($1,138)
Total Uses ($1,113) ($1,397) ($2,960) ($3,423)
52 Contains Forward-Looking Statements
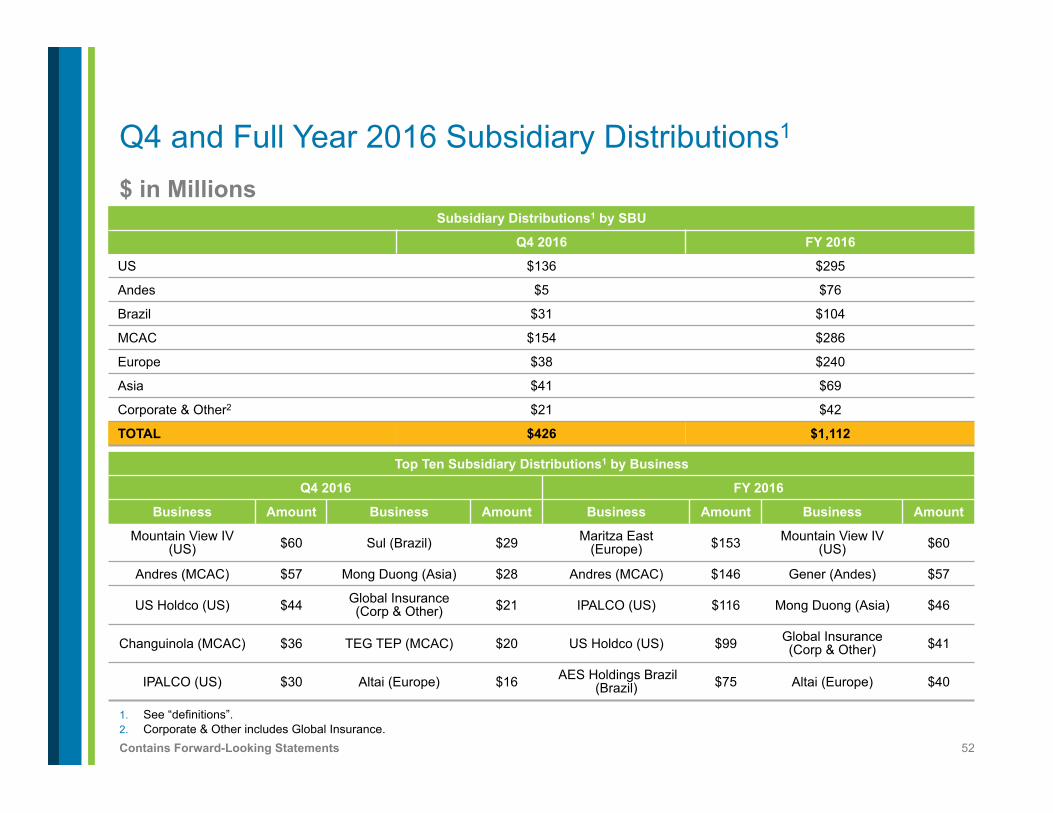
Subsidiary Distributions1 by SBU
Q4 2016 FY 2016
US $136 $295
Andes $5 $76
Brazil $31 $104
MCAC $154 $286
Europe $38 $240
Asia $41 $69
Corporate & Other2 $21 $42
TOTAL $426 $1,112
$ in Millions
1. See “definitions”. 2. Corporate & Other includes Global Insurance.
Q4 and Full Year 2016 Subsidiary Distributions1
Top Ten Subsidiary Distributions1 by Business
Q4 2016 FY 2016
Business Amount Business Amount Business Amount Business Amount
Mountain View IV (US) $60 Sul (Brazil) $29 Maritza East
(Europe) $153 Mountain View IV (US) $60
Andres (MCAC) $57 Mong Duong (Asia) $28 Andres (MCAC) $146 Gener (Andes) $57
US Holdco (US) $44 Global Insurance (Corp & Other) $21 IPALCO (US) $116 Mong Duong (Asia) $46
Changuinola (MCAC) $36 TEG TEP (MCAC) $20 US Holdco (US) $99 Global Insurance (Corp & Other) $41
IPALCO (US) $30 Altai (Europe) $16 AES Holdings Brazil (Brazil) $75 Altai (Europe) $40
53 Contains Forward-Looking Statements
$ in Millions
1. See “definitions”. 2. A non-GAAP financial measure. See “definitions”. 3. Qualified Holding Company. See “assumptions”.
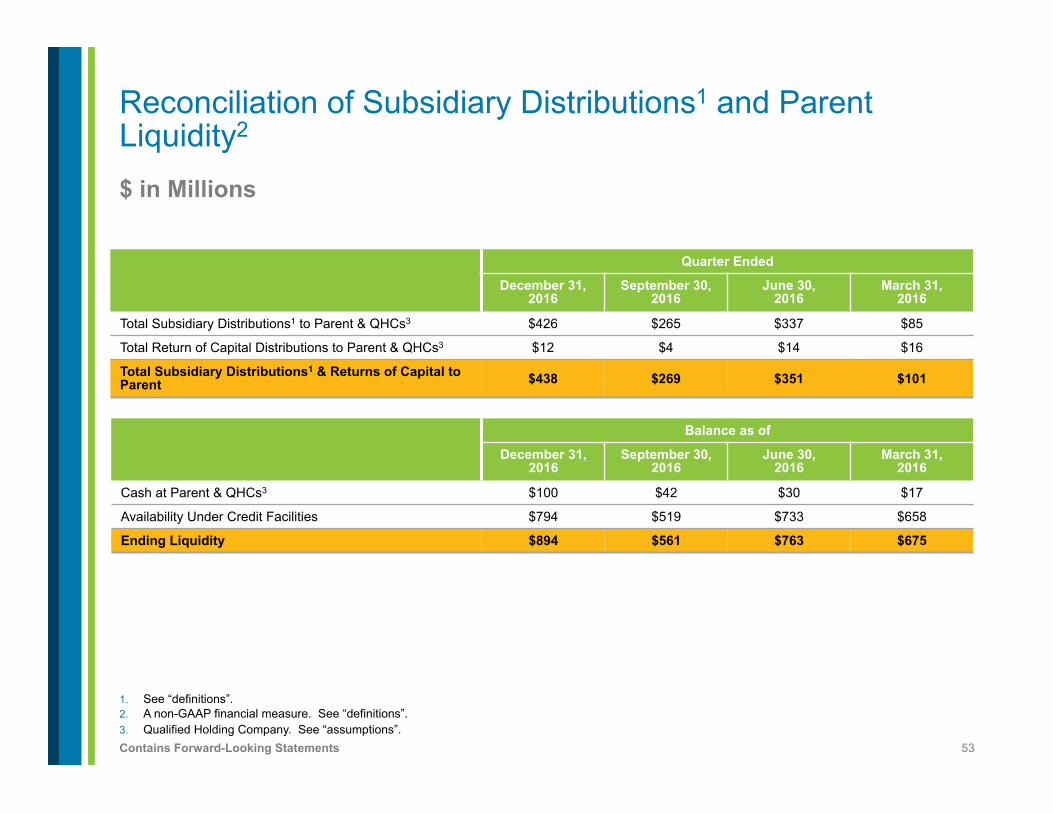
Reconciliation of Subsidiary Distributions1 and Parent Liquidity2
Quarter Ended
December 31, 2016
September 30, 2016
June 30, 2016
March 31, 2016
Total Subsidiary Distributions1 to Parent & QHCs3 $426 $265 $337 $85
Total Return of Capital Distributions to Parent & QHCs3 $12 $4 $14 $16
Total Subsidiary Distributions1 & Returns of Capital to Parent $438 $269 $351 $101
Balance as of
December 31, 2016
September 30, 2016
June 30, 2016
March 31, 2016
Cash at Parent & QHCs3 $100 $42 $30 $17
Availability Under Credit Facilities $794 $519 $733 $658
Ending Liquidity $894 $561 $763 $675
54 Contains Forward-Looking Statements
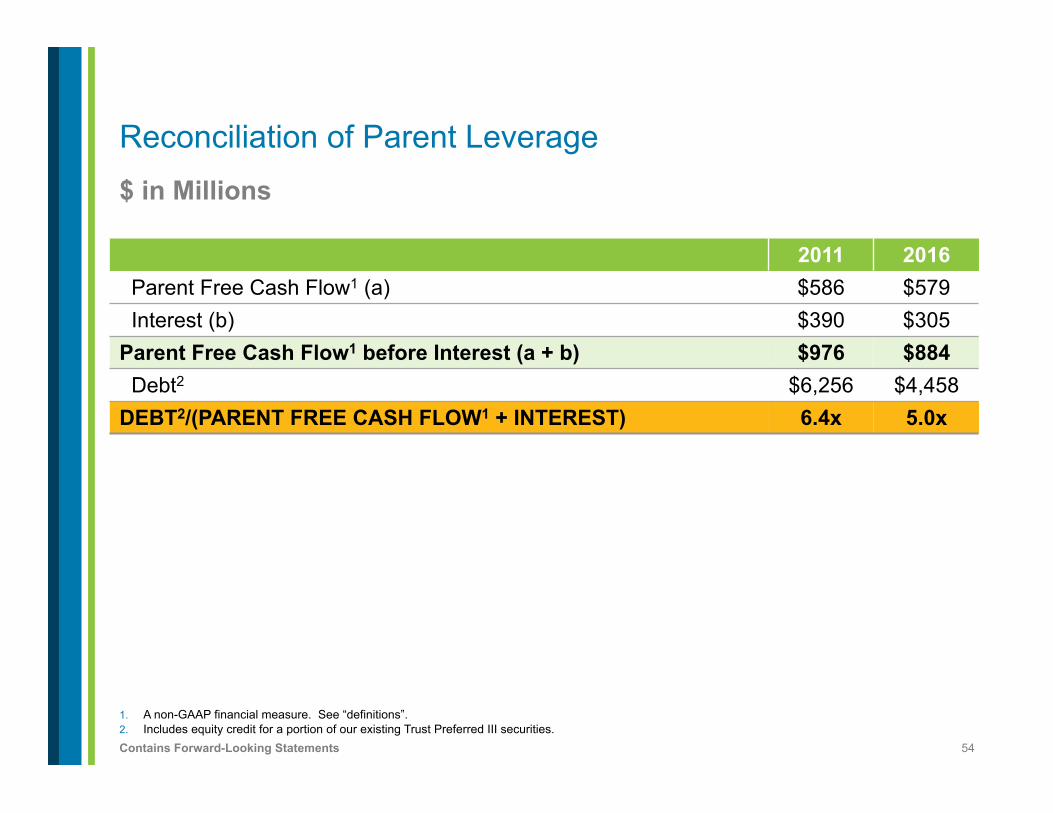
$ in Millions
1. A non-GAAP financial measure. See “definitions”. 2. Includes equity credit for a portion of our existing Trust Preferred III securities.
Reconciliation of Parent Leverage
2011 2016 Parent Free Cash Flow1 (a) $586 $579 Interest (b) $390 $305
Parent Free Cash Flow1 before Interest (a + b) $976 $884 Debt2 $6,256 $4,458
DEBT2/(PARENT FREE CASH FLOW1 + INTEREST) 6.4x 5.0x
55 Contains Forward-Looking Statements
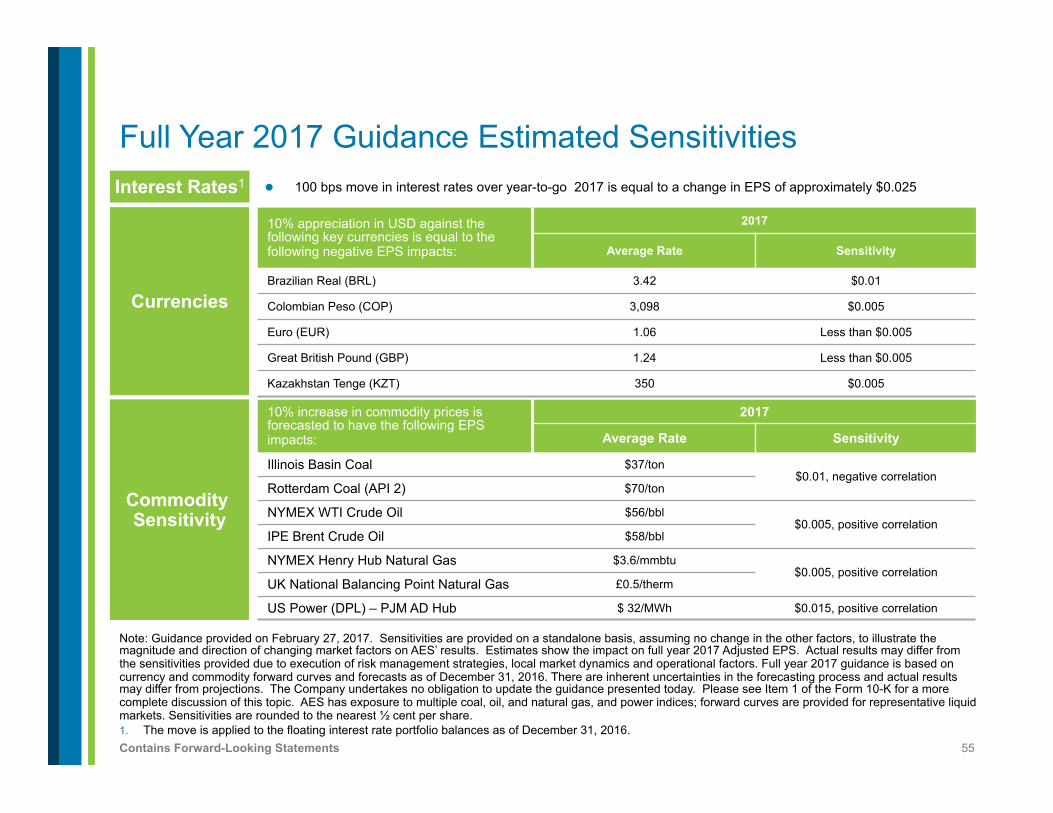
Interest Rates1
Currencies
Commodity Sensitivity
l 100 bps move in interest rates over year-to-go 2017 is equal to a change in EPS of approximately $0.025
10% appreciation in USD against the following key currencies is equal to the following negative EPS impacts:
2017
Average Rate Sensitivity
Brazilian Real (BRL) 3.42 $0.01
Colombian Peso (COP) 3,098 $0.005
Euro (EUR) 1.06 Less than $0.005
Great British Pound (GBP) 1.24 Less than $0.005
Kazakhstan Tenge (KZT) 350 $0.005
10% increase in commodity prices is forecasted to have the following EPS impacts:
2017
Average Rate Sensitivity
Illinois Basin Coal $37/ton $0.01, negative correlation
Rotterdam Coal (API 2) $70/ton
NYMEX WTI Crude Oil $56/bbl $0.005, positive correlation
IPE Brent Crude Oil $58/bbl
NYMEX Henry Hub Natural Gas $3.6/mmbtu $0.005, positive correlation
UK National Balancing Point Natural Gas £0.5/therm
US Power (DPL) – PJM AD Hub $ 32/MWh $0.015, positive correlation
Note: Guidance provided on February 27, 2017. Sensitivities are provided on a standalone basis, assuming no change in the other factors, to illustrate the magnitude and direction of changing market factors on AES’ results. Estimates show the impact on full year 2017 Adjusted EPS. Actual results may differ from the sensitivities provided due to execution of risk management strategies, local market dynamics and operational factors. Full year 2017 guidance is based on currency and commodity forward curves and forecasts as of December 31, 2016. There are inherent uncertainties in the forecasting process and actual results may differ from projections. The Company undertakes no obligation to update the guidance presented today. Please see Item 1 of the Form 10-K for a more complete discussion of this topic. AES has exposure to multiple coal, oil, and natural gas, and power indices; forward curves are provided for representative liquid markets. Sensitivities are rounded to the nearest ½ cent per share. 1. The move is applied to the floating interest rate portfolio balances as of December 31, 2016.
Full Year 2017 Guidance Estimated Sensitivities
56 Contains Forward-Looking Statements
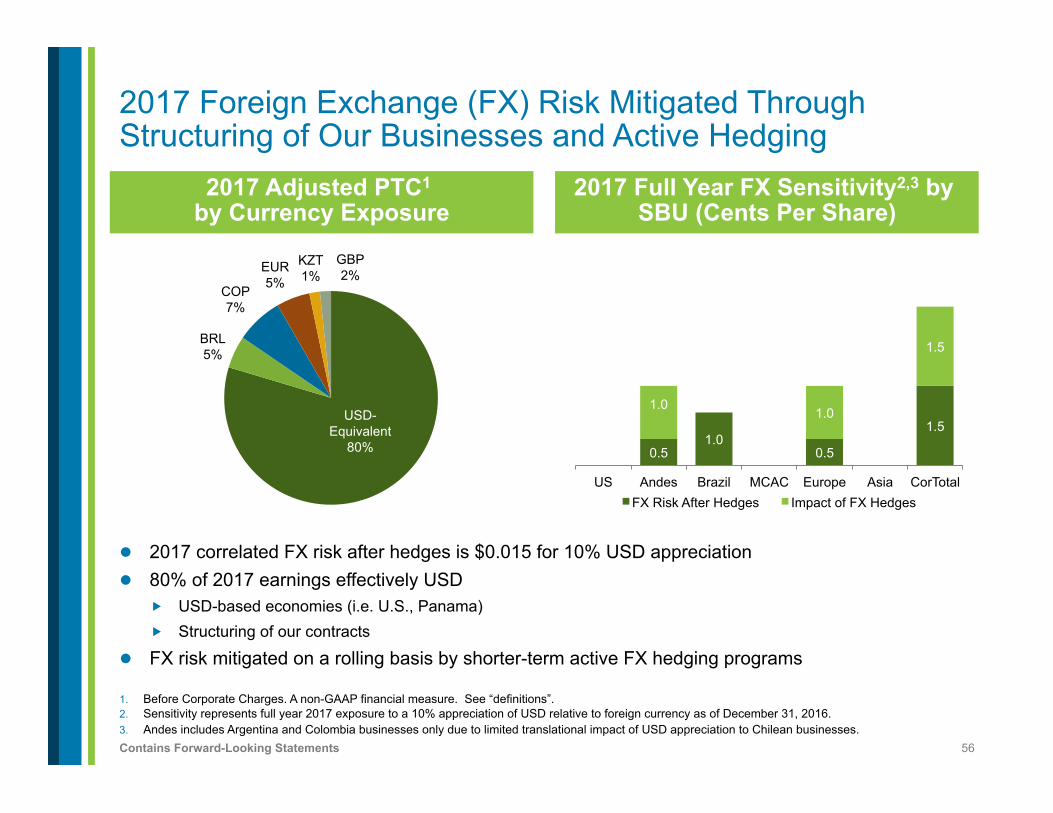
2017 Foreign Exchange (FX) Risk Mitigated Through Structuring of Our Businesses and Active Hedging
1. Before Corporate Charges. A non-GAAP financial measure. See “definitions”. 2. Sensitivity represents full year 2017 exposure to a 10% appreciation of USD relative to foreign currency as of December 31, 2016. 3. Andes includes Argentina and Colombia businesses only due to limited translational impact of USD appreciation to Chilean businesses.
2017 Full Year FX Sensitivity2,3 by SBU (Cents Per Share)
0.5 1.0
0.5
1.5 1.0 1.0
1.5
US Andes Brazil MCAC Europe Asia CorTotal FX Risk After Hedges Impact of FX Hedges
2017 Adjusted PTC1 by Currency Exposure
l 2017 correlated FX risk after hedges is $0.015 for 10% USD appreciation l 80% of 2017 earnings effectively USD
� USD-based economies (i.e. U.S., Panama) � Structuring of our contracts
l FX risk mitigated on a rolling basis by shorter-term active FX hedging programs
USD-Equivalent
80%
BRL 5%
COP 7%
EUR 5%
KZT 1%
GBP 2%
57 Contains Forward-Looking Statements
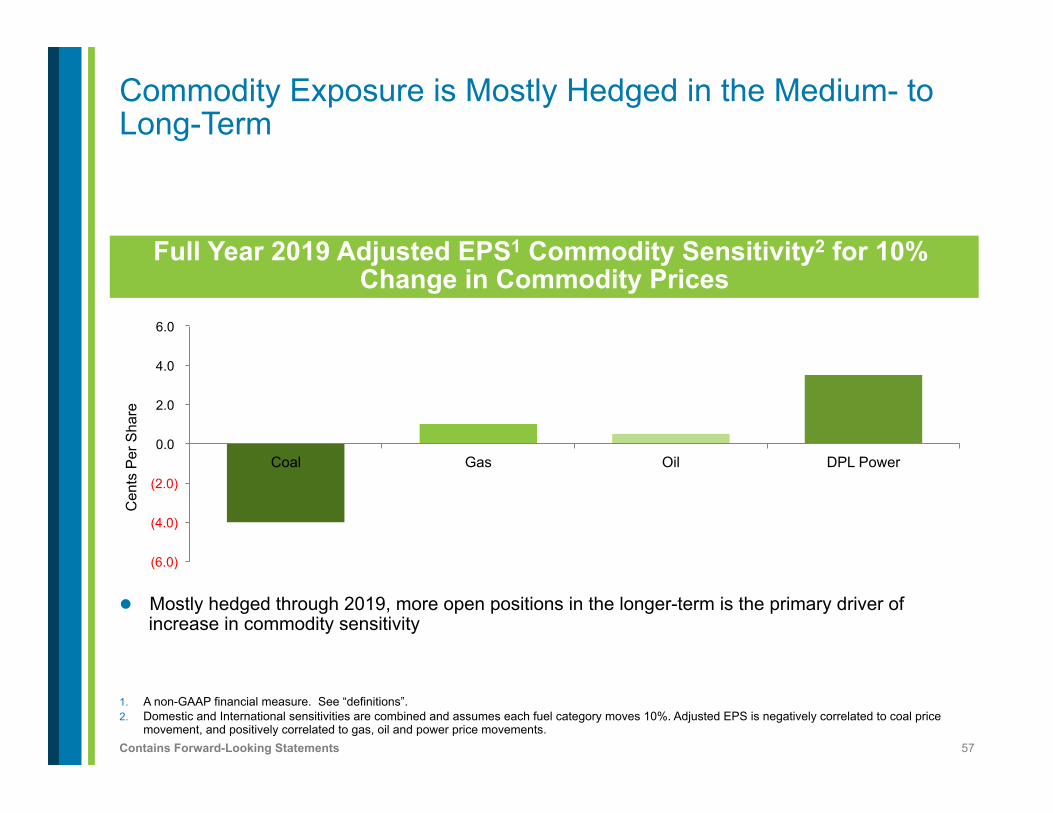
1. A non-GAAP financial measure. See “definitions”. 2. Domestic and International sensitivities are combined and assumes each fuel category moves 10%. Adjusted EPS is negatively correlated to coal price
movement, and positively correlated to gas, oil and power price movements.
Commodity Exposure is Mostly Hedged in the Medium- to Long-Term
Full Year 2019 Adjusted EPS1 Commodity Sensitivity2 for 10% Change in Commodity Prices
(6.0)
(4.0)
(2.0)
0.0
2.0
4.0
6.0
Coal Gas Oil DPL Power
Cen
ts P
er S
hare
l Mostly hedged through 2019, more open positions in the longer-term is the primary driver of increase in commodity sensitivity
58 Contains Forward-Looking Statements
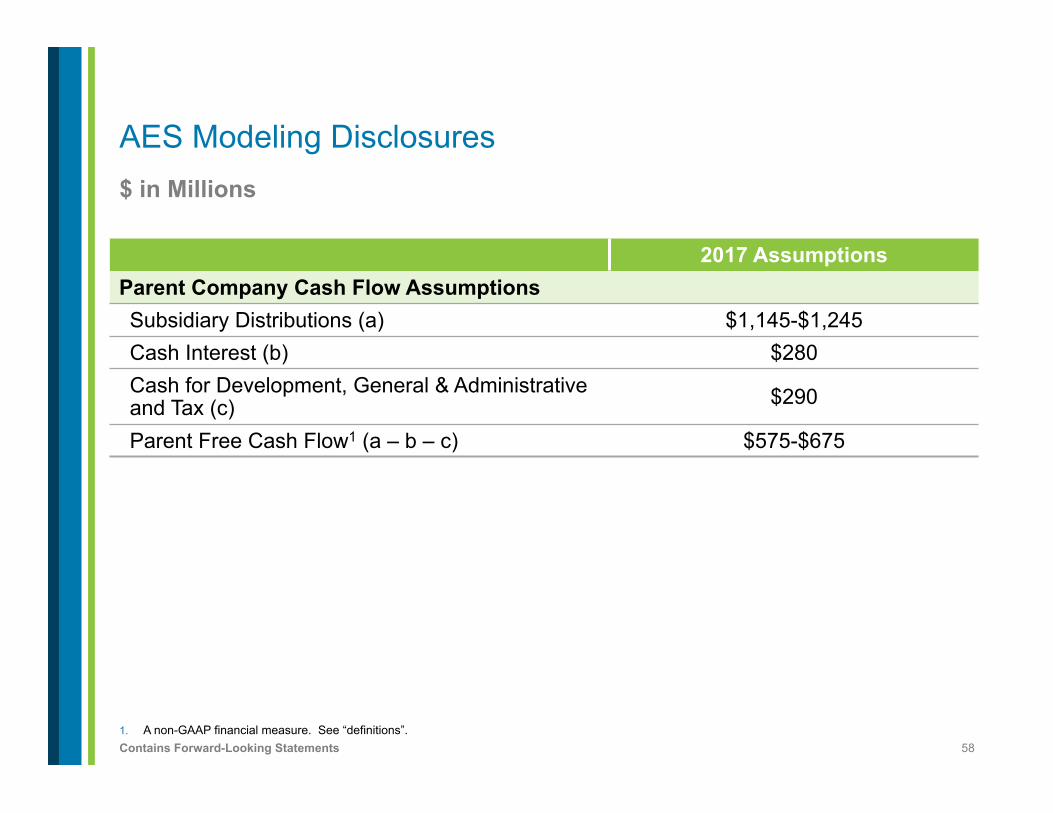
$ in Millions
1. A non-GAAP financial measure. See “definitions”.
AES Modeling Disclosures
2017 Assumptions Parent Company Cash Flow Assumptions Subsidiary Distributions (a) $1,145-$1,245 Cash Interest (b) $280 Cash for Development, General & Administrative and Tax (c) $290
Parent Free Cash Flow1 (a – b – c) $575-$675
59 Contains Forward-Looking Statements
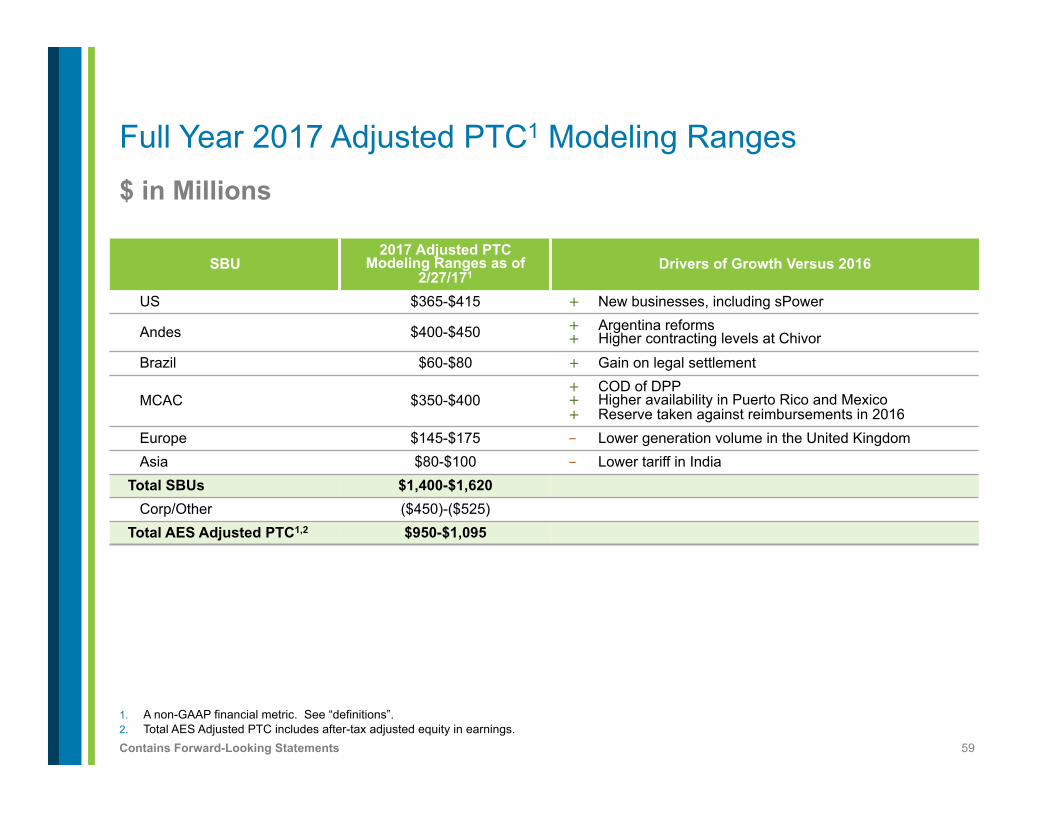
$ in Millions
Full Year 2017 Adjusted PTC1 Modeling Ranges
SBU 2017 Adjusted PTC
Modeling Ranges as of 2/27/171
Drivers of Growth Versus 2016
US $365-$415 + New businesses, including sPower
Andes $400-$450 + Argentina reforms + Higher contracting levels at Chivor
Brazil $60-$80 + Gain on legal settlement
MCAC $350-$400 + COD of DPP + Higher availability in Puerto Rico and Mexico + Reserve taken against reimbursements in 2016
Europe $145-$175 - Lower generation volume in the United Kingdom Asia $80-$100 - Lower tariff in India
Total SBUs $1,400-$1,620 Corp/Other ($450)-($525)
Total AES Adjusted PTC1,2 $950-$1,095
1. A non-GAAP financial metric. See “definitions”. 2. Total AES Adjusted PTC includes after-tax adjusted equity in earnings.
60 Contains Forward-Looking Statements
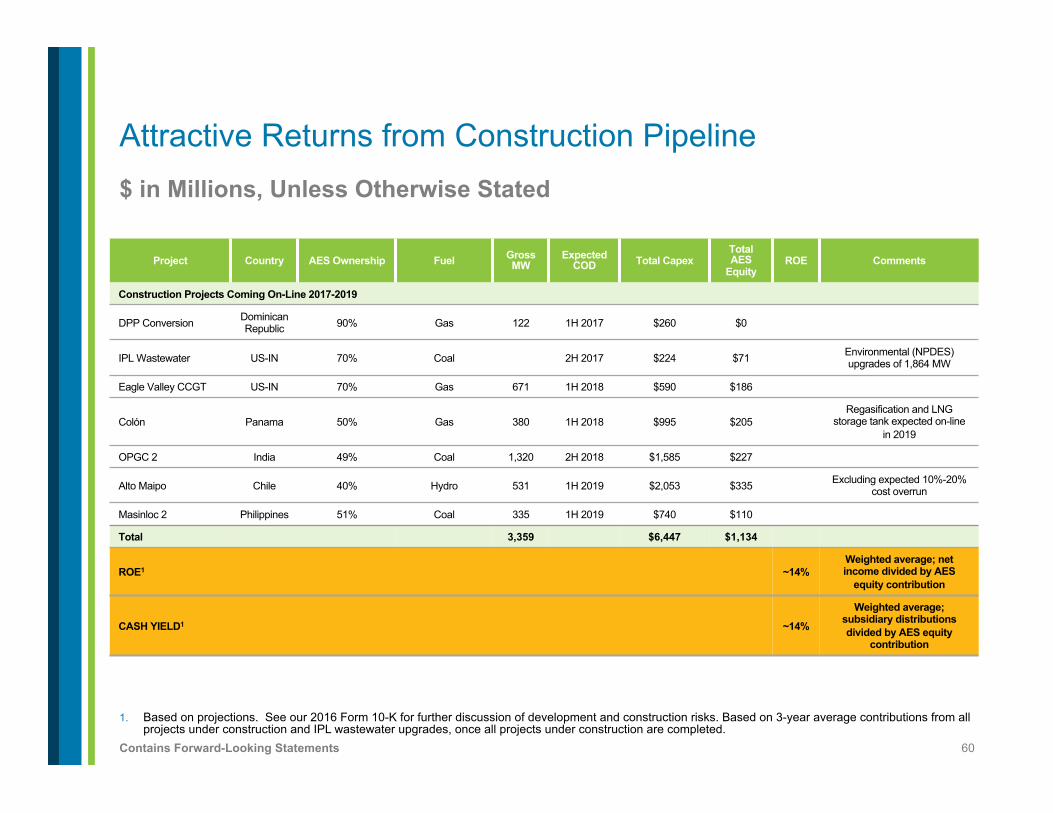
$ in Millions, Unless Otherwise Stated
1. Based on projections. See our 2016 Form 10-K for further discussion of development and construction risks. Based on 3-year average contributions from all projects under construction and IPL wastewater upgrades, once all projects under construction are completed.
Attractive Returns from Construction Pipeline
Project Country AES Ownership Fuel Gross MW
Expected COD Total Capex
Total AES
Equity ROE Comments
Construction Projects Coming On-Line 2017-2019
DPP Conversion Dominican Republic 90% Gas 122 1H 2017 $260 $0
IPL Wastewater US-IN 70% Coal 2H 2017 $224 $71 Environmental (NPDES) upgrades of 1,864 MW
Eagle Valley CCGT US-IN 70% Gas 671 1H 2018 $590 $186
Colón Panama 50% Gas 380 1H 2018 $995 $205 Regasification and LNG
storage tank expected on-line in 2019
OPGC 2 India 49% Coal 1,320 2H 2018 $1,585 $227
Alto Maipo Chile 40% Hydro 531 1H 2019 $2,053 $335 Excluding expected 10%-20% cost overrun
Masinloc 2 Philippines 51% Coal 335 1H 2019 $740 $110
Total 3,359 $6,447 $1,134
ROE1 ~14% Weighted average; net income divided by AES
equity contribution
CASH YIELD1 ~14%
Weighted average; subsidiary distributions divided by AES equity
contribution
61 Contains Forward-Looking Statements
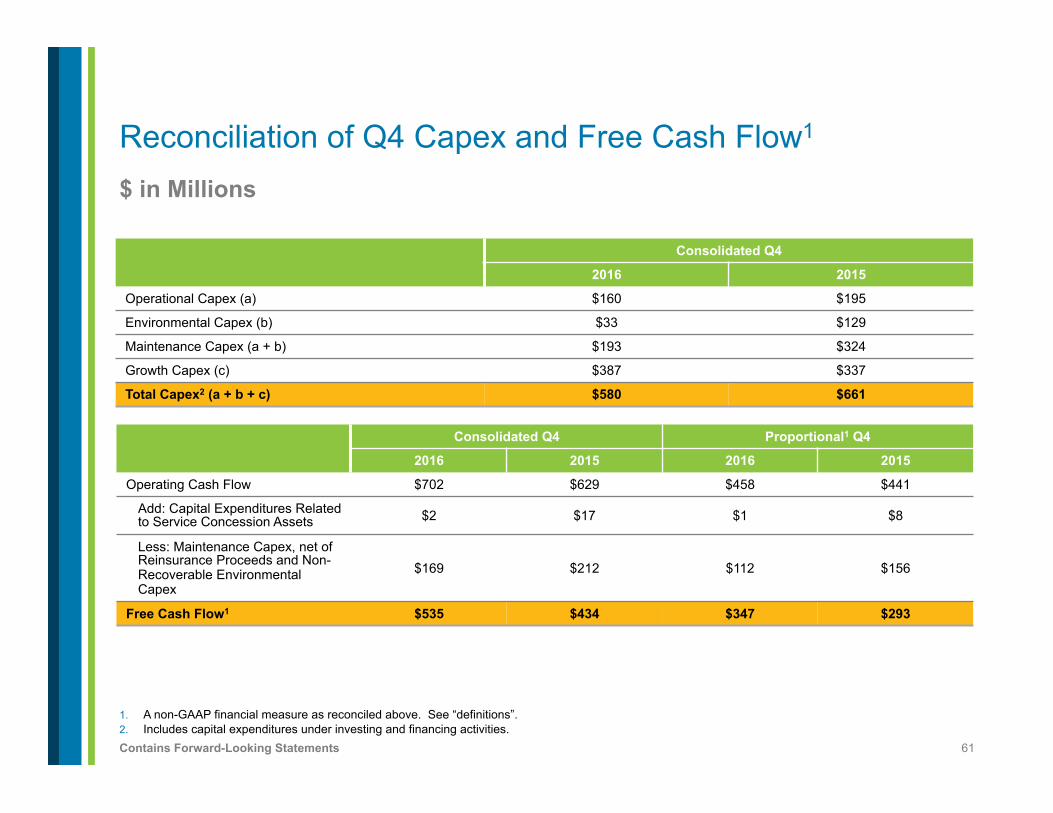
$ in Millions
1. A non-GAAP financial measure as reconciled above. See “definitions”. 2. Includes capital expenditures under investing and financing activities.
Reconciliation of Q4 Capex and Free Cash Flow1
Consolidated Q4
2016 2015
Operational Capex (a) $160 $195
Environmental Capex (b) $33 $129
Maintenance Capex (a + b) $193 $324
Growth Capex (c) $387 $337
Total Capex2 (a + b + c) $580 $661
Consolidated Q4 Proportional1 Q4
2016 2015 2016 2015
Operating Cash Flow $702 $629 $458 $441
Add: Capital Expenditures Related to Service Concession Assets $2 $17 $1 $8
Less: Maintenance Capex, net of Reinsurance Proceeds and Non-Recoverable Environmental Capex
$169 $212 $112 $156
Free Cash Flow1 $535 $434 $347 $293
62 Contains Forward-Looking Statements
$ in Millions
1. A non-GAAP financial measure as reconciled above. See “definitions”. 2. Includes capital expenditures under investing and financing activities.
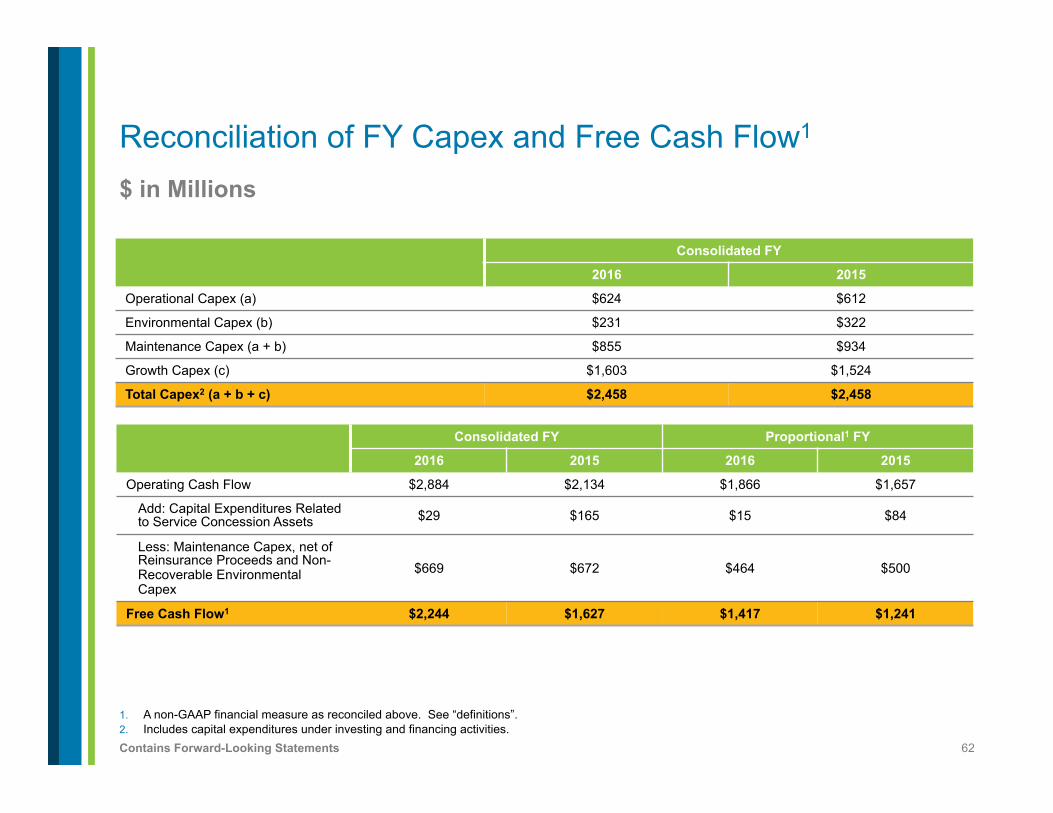
Reconciliation of FY Capex and Free Cash Flow1
Consolidated FY
2016 2015
Operational Capex (a) $624 $612
Environmental Capex (b) $231 $322
Maintenance Capex (a + b) $855 $934
Growth Capex (c) $1,603 $1,524
Total Capex2 (a + b + c) $2,458 $2,458
Consolidated FY Proportional1 FY
2016 2015 2016 2015
Operating Cash Flow $2,884 $2,134 $1,866 $1,657
Add: Capital Expenditures Related to Service Concession Assets $29 $165 $15 $84
Less: Maintenance Capex, net of Reinsurance Proceeds and Non-Recoverable Environmental Capex
$669 $672 $464 $500
Free Cash Flow1 $2,244 $1,627 $1,417 $1,241
63 Contains Forward-Looking Statements
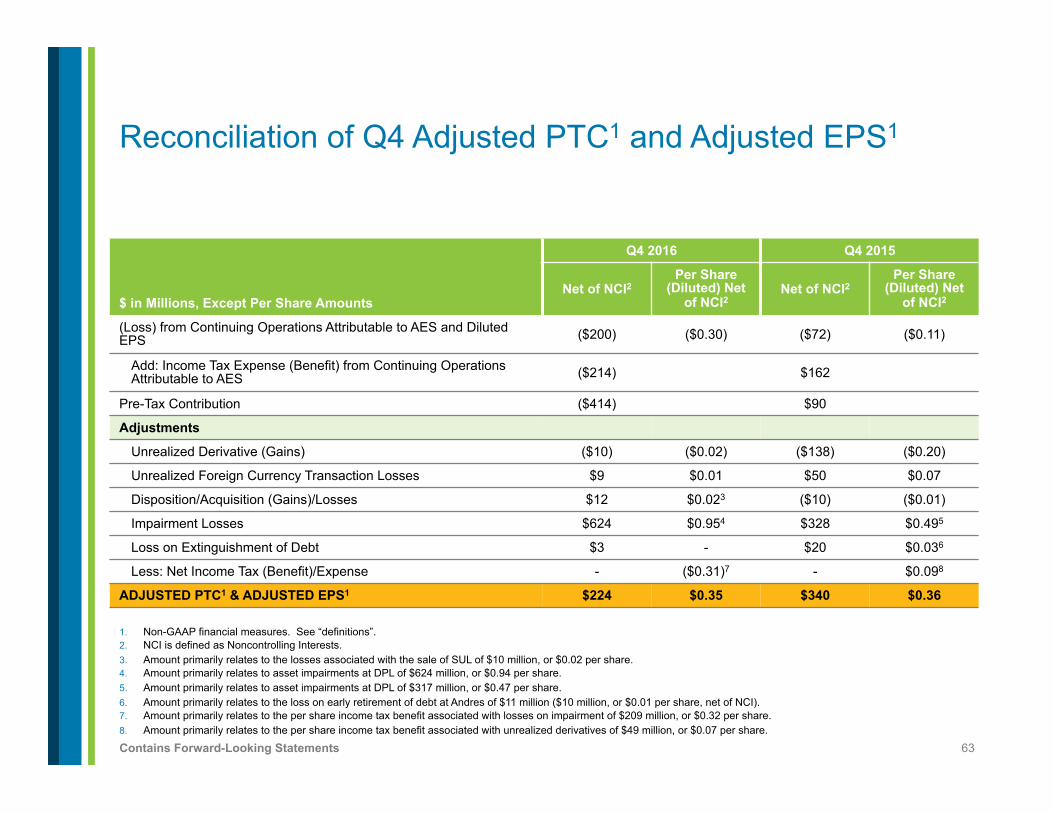
1. Non-GAAP financial measures. See “definitions”. 2. NCI is defined as Noncontrolling Interests. 3. Amount primarily relates to the losses associated with the sale of SUL of $10 million, or $0.02 per share. 4. Amount primarily relates to asset impairments at DPL of $624 million, or $0.94 per share. 5. Amount primarily relates to asset impairments at DPL of $317 million, or $0.47 per share. 6. Amount primarily relates to the loss on early retirement of debt at Andres of $11 million ($10 million, or $0.01 per share, net of NCI). 7. Amount primarily relates to the per share income tax benefit associated with losses on impairment of $209 million, or $0.32 per share. 8. Amount primarily relates to the per share income tax benefit associated with unrealized derivatives of $49 million, or $0.07 per share.
Reconciliation of Q4 Adjusted PTC1 and Adjusted EPS1
$ in Millions, Except Per Share Amounts
Q4 2016 Q4 2015
Net of NCI2 Per Share
(Diluted) Net of NCI2
Net of NCI2 Per Share
(Diluted) Net of NCI2
(Loss) from Continuing Operations Attributable to AES and Diluted EPS ($200) ($0.30) ($72) ($0.11)
Add: Income Tax Expense (Benefit) from Continuing Operations Attributable to AES ($214) $162
Pre-Tax Contribution ($414) $90
Adjustments
Unrealized Derivative (Gains) ($10) ($0.02) ($138) ($0.20)
Unrealized Foreign Currency Transaction Losses $9 $0.01 $50 $0.07
Disposition/Acquisition (Gains)/Losses $12 $0.023 ($10) ($0.01)
Impairment Losses $624 $0.954 $328 $0.495
Loss on Extinguishment of Debt $3 - $20 $0.036
Less: Net Income Tax (Benefit)/Expense - ($0.31)7 - $0.098
ADJUSTED PTC1 & ADJUSTED EPS1 $224 $0.35 $340 $0.36
64 Contains Forward-Looking Statements
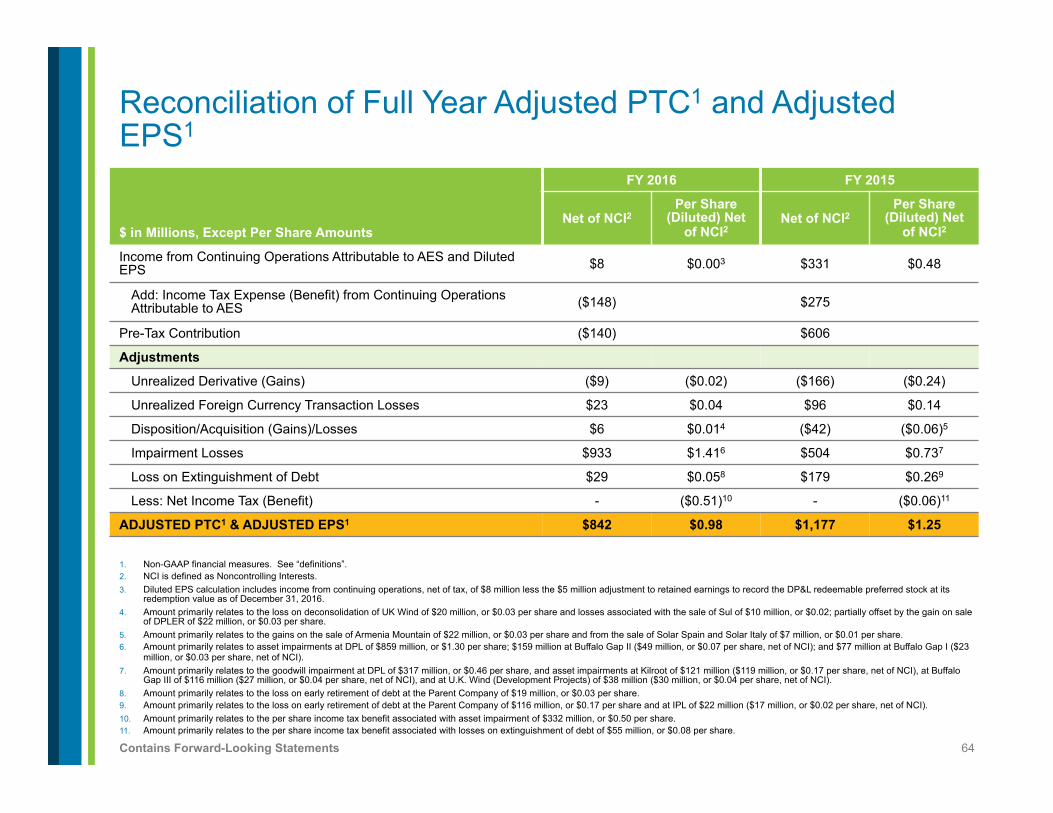
1. Non-GAAP financial measures. See “definitions”. 2. NCI is defined as Noncontrolling Interests. 3. Diluted EPS calculation includes income from continuing operations, net of tax, of $8 million less the $5 million adjustment to retained earnings to record the DP&L redeemable preferred stock at its
redemption value as of December 31, 2016. 4. Amount primarily relates to the loss on deconsolidation of UK Wind of $20 million, or $0.03 per share and losses associated with the sale of Sul of $10 million, or $0.02; partially offset by the gain on sale
of DPLER of $22 million, or $0.03 per share. 5. Amount primarily relates to the gains on the sale of Armenia Mountain of $22 million, or $0.03 per share and from the sale of Solar Spain and Solar Italy of $7 million, or $0.01 per share. 6. Amount primarily relates to asset impairments at DPL of $859 million, or $1.30 per share; $159 million at Buffalo Gap II ($49 million, or $0.07 per share, net of NCI); and $77 million at Buffalo Gap I ($23
million, or $0.03 per share, net of NCI). 7. Amount primarily relates to the goodwill impairment at DPL of $317 million, or $0.46 per share, and asset impairments at Kilroot of $121 million ($119 million, or $0.17 per share, net of NCI), at Buffalo
Gap III of $116 million ($27 million, or $0.04 per share, net of NCI), and at U.K. Wind (Development Projects) of $38 million ($30 million, or $0.04 per share, net of NCI). 8. Amount primarily relates to the loss on early retirement of debt at the Parent Company of $19 million, or $0.03 per share. 9. Amount primarily relates to the loss on early retirement of debt at the Parent Company of $116 million, or $0.17 per share and at IPL of $22 million ($17 million, or $0.02 per share, net of NCI). 10. Amount primarily relates to the per share income tax benefit associated with asset impairment of $332 million, or $0.50 per share. 11. Amount primarily relates to the per share income tax benefit associated with losses on extinguishment of debt of $55 million, or $0.08 per share.
Reconciliation of Full Year Adjusted PTC1 and Adjusted EPS1
$ in Millions, Except Per Share Amounts
FY 2016 FY 2015
Net of NCI2 Per Share
(Diluted) Net of NCI2
Net of NCI2 Per Share
(Diluted) Net of NCI2
Income from Continuing Operations Attributable to AES and Diluted EPS $8 $0.003 $331 $0.48
Add: Income Tax Expense (Benefit) from Continuing Operations Attributable to AES ($148) $275
Pre-Tax Contribution ($140) $606
Adjustments
Unrealized Derivative (Gains) ($9) ($0.02) ($166) ($0.24)
Unrealized Foreign Currency Transaction Losses $23 $0.04 $96 $0.14
Disposition/Acquisition (Gains)/Losses $6 $0.014 ($42) ($0.06)5
Impairment Losses $933 $1.416 $504 $0.737
Loss on Extinguishment of Debt $29 $0.058 $179 $0.269
Less: Net Income Tax (Benefit) - ($0.51)10 - ($0.06)11
ADJUSTED PTC1 & ADJUSTED EPS1 $842 $0.98 $1,177 $1.25
65 Contains Forward-Looking Statements
$ in Millions, Except Per Share Amounts
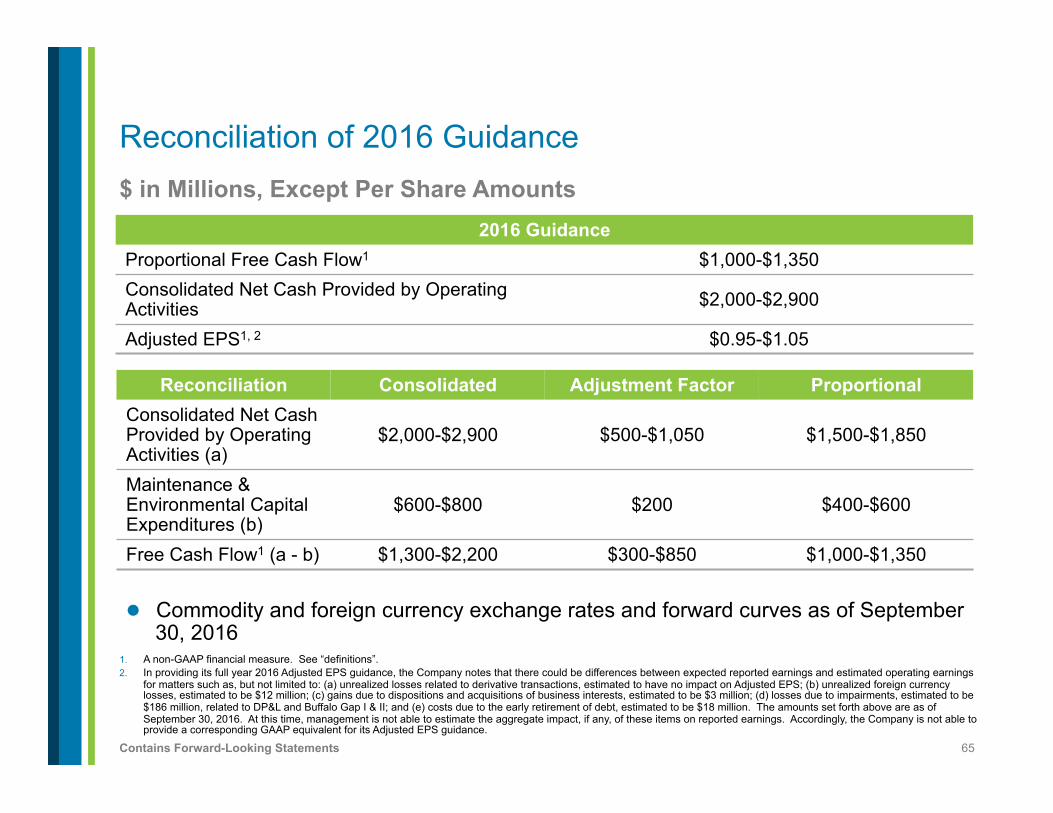
1. A non-GAAP financial measure. See “definitions”. 2. In providing its full year 2016 Adjusted EPS guidance, the Company notes that there could be differences between expected reported earnings and estimated operating earnings
for matters such as, but not limited to: (a) unrealized losses related to derivative transactions, estimated to have no impact on Adjusted EPS; (b) unrealized foreign currency losses, estimated to be $12 million; (c) gains due to dispositions and acquisitions of business interests, estimated to be $3 million; (d) losses due to impairments, estimated to be $186 million, related to DP&L and Buffalo Gap I & II; and (e) costs due to the early retirement of debt, estimated to be $18 million. The amounts set forth above are as of September 30, 2016. At this time, management is not able to estimate the aggregate impact, if any, of these items on reported earnings. Accordingly, the Company is not able to provide a corresponding GAAP equivalent for its Adjusted EPS guidance.
Reconciliation of 2016 Guidance
2016 Guidance Proportional Free Cash Flow1 $1,000-$1,350 Consolidated Net Cash Provided by Operating Activities $2,000-$2,900
Adjusted EPS1, 2 $0.95-$1.05
Reconciliation Consolidated Adjustment Factor Proportional Consolidated Net Cash Provided by Operating Activities (a)
$2,000-$2,900 $500-$1,050 $1,500-$1,850
Maintenance & Environmental Capital Expenditures (b)
$600-$800 $200 $400-$600
Free Cash Flow1 (a - b) $1,300-$2,200 $300-$850 $1,000-$1,350
l Commodity and foreign currency exchange rates and forward curves as of September 30, 2016
66 Contains Forward-Looking Statements
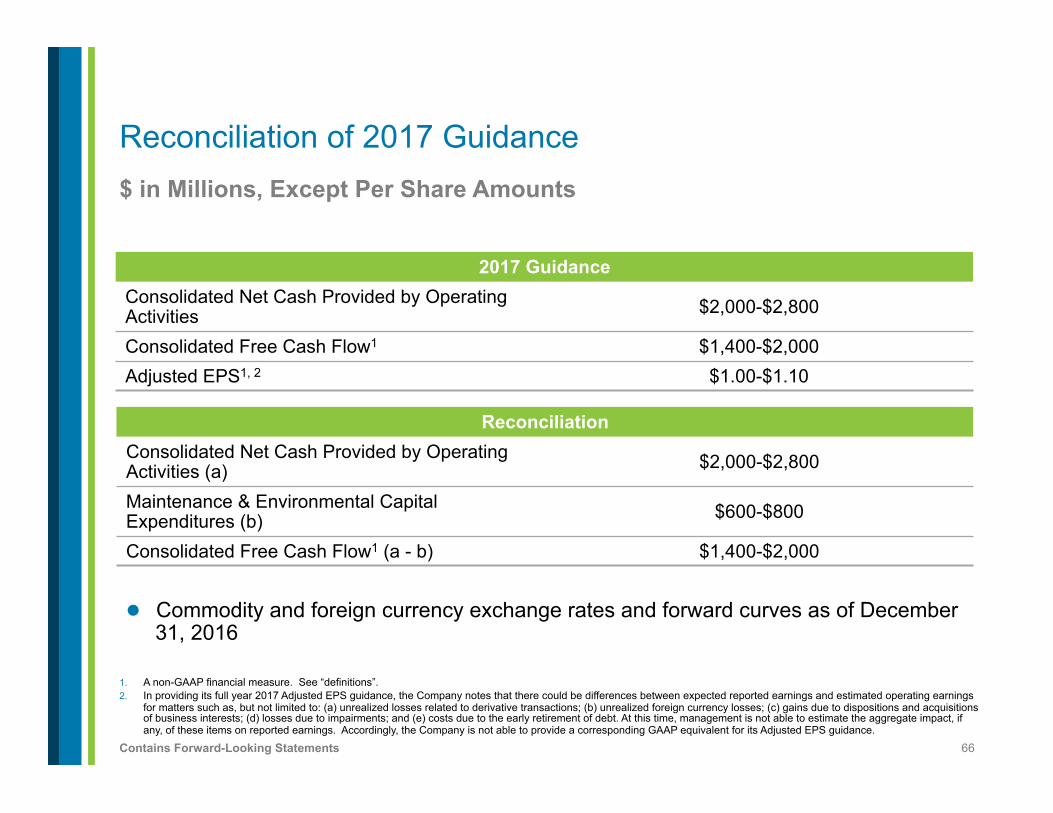
$ in Millions, Except Per Share Amounts
1. A non-GAAP financial measure. See “definitions”. 2. In providing its full year 2017 Adjusted EPS guidance, the Company notes that there could be differences between expected reported earnings and estimated operating earnings
for matters such as, but not limited to: (a) unrealized losses related to derivative transactions; (b) unrealized foreign currency losses; (c) gains due to dispositions and acquisitions of business interests; (d) losses due to impairments; and (e) costs due to the early retirement of debt. At this time, management is not able to estimate the aggregate impact, if any, of these items on reported earnings. Accordingly, the Company is not able to provide a corresponding GAAP equivalent for its Adjusted EPS guidance.
Reconciliation of 2017 Guidance
2017 Guidance Consolidated Net Cash Provided by Operating Activities $2,000-$2,800
Consolidated Free Cash Flow1 $1,400-$2,000 Adjusted EPS1, 2 $1.00-$1.10
Reconciliation Consolidated Net Cash Provided by Operating Activities (a) $2,000-$2,800
Maintenance & Environmental Capital Expenditures (b) $600-$800
Consolidated Free Cash Flow1 (a - b) $1,400-$2,000
l Commodity and foreign currency exchange rates and forward curves as of December 31, 2016
67 Contains Forward-Looking Statements
Assumptions
Forecasted financial information is based on certain material assumptions. Such assumptions include, but are not limited to: (a) no unforeseen external events such as wars, depressions, or economic or political disruptions occur; (b) businesses continue to operate in a manner consistent with or better than prior operating performance, including achievement of planned productivity improvements including benefits of global sourcing, and in accordance with the provisions of their relevant contracts or concessions; (c) new business opportunities are available to AES in sufficient quantity to achieve its growth objectives; (d) no material disruptions or discontinuities occur in the Gross Domestic Product (GDP), foreign exchange rates, inflation or interest rates during the forecast period; and (e) material business-specific risks as described in the Company’s SEC filings do not occur individually or cumulatively. In addition, benefits from global sourcing include avoided costs, reduction in capital project costs versus budgetary estimates, and projected savings based on assumed spend volume which may or may not actually be achieved. Also, improvement in certain Key Performance Indicators (KPIs) such as equivalent forced outage rate and commercial availability may not improve financial performance at all facilities based on commercial terms and conditions. These benefits will not be fully reflected in the Company’s consolidated financial results.
The cash held at qualified holding companies (“QHCs”) represents cash sent to subsidiaries of the Company domiciled outside of the U.S. Such subsidiaries had no contractual restrictions on their ability to send cash to AES, the Parent Company, however, cash held at qualified holding companies does not reflect the impact of any tax liabilities that may result from any such cash being repatriated to the Parent Company in the U.S. Cash at those subsidiaries was used for investment and related activities outside of the U.S. These investments included equity investments and loans to other foreign subsidiaries as well as development and general costs and expenses incurred outside the U.S. Since the cash held by these QHCs is available to the Parent, AES uses the combined measure of subsidiary distributions to Parent and QHCs as a useful measure of cash available to the Parent to meet its international liquidity needs. AES believes that unconsolidated parent company liquidity is important to the liquidity position of AES as a parent company because of the non-recourse nature of most of AES’ indebtedness.
68 Contains Forward-Looking Statements
Definitions
l Adjusted Earnings Per Share (a non-GAAP financial measure) is defined as diluted earnings per share from continuing operations excluding gains or losses of both consolidated entities and entities accounted for under the equity method due to (a) unrealized gains or losses related to derivative transactions, (b) unrealized foreign currency gains or losses, (c) gains or losses due to dispositions and acquisitions of business interests, (d) losses due to impairments, and (e) costs due to the early retirement of debt, adjusted for the same gains or losses excluded from consolidated entities. The GAAP measure most comparable to Adjusted EPS is diluted earnings per share from continuing operations. AES believes that Adjusted EPS better reflects the underlying business performance of the Company and is considered in the Company’s internal evaluation of financial performance. Factors in this determination include the variability due to unrealized gains or losses related to derivative transactions, unrealized foreign currency gains or losses, losses due to impairments and strategic decisions to dispose or acquire business interests or retire debt, which affect results in a given period or periods. Adjusted EPS should not be construed as an alternative to diluted earnings per share from continuing operations, which is determined in accordance with GAAP.
l Adjusted Pre-Tax Contribution (a non-GAAP financial measure) represents pre-tax income from continuing operations attributable to AES excluding gains or losses of both consolidated entities and entities accounted for under the equity method due to (a) unrealized gains or losses related to derivative transactions, (b) unrealized foreign currency gains or losses, (c) gains or losses due to dispositions and acquisitions of business interests, (d) losses due to impairments, and (e) costs due to the early retirement of debt, adjusted for the same gains or losses excluded from consolidated entities. It includes net equity in earnings of affiliates, on an after-tax basis. The GAAP measure most comparable to Adjusted PTC is income from continuing operations attributable to AES. AES believes that Adjusted PTC better reflects the underlying business performance of the Company and is considered in the Company’s internal evaluation of financial performance. Factors in this determination include the variability due to unrealized gains or losses related to derivative transactions, unrealized foreign currency gains or losses, losses due to impairments and strategic decisions to dispose or acquire business interests or retire debt, which affect results in a given period or periods. Earnings before tax represents the business performance of the Company before the application of statutory income tax rates and tax adjustments, including the affects of tax planning, corresponding to the various jurisdictions in which the Company operates. Adjusted PTC should not be construed as an alternative to income from continuing operations attributable to AES, which is determined in accordance with GAAP.
l Free Cash Flow (a non-GAAP financial measure) is defined as net cash from operating activities (adjusted for service concession asset capital expenditures) less maintenance capital expenditures (including non-recoverable environmental capital expenditures), net of reinsurance proceeds from third parties. AES believes that free cash flow is a useful measure for evaluating our financial condition because it represents the amount of cash generated by the business after the funding of maintenance capital expenditures that may be available for investing in growth opportunities or for repaying debt. Free cash flow should not be construed as an alternative to net cash from operating activities, which is determined in accordance with GAAP.
l Net Debt (a non-GAAP financial measure) is defined as current and non-current recourse and non-recourse debt less cash and cash equivalents, restricted cash, short term investments, debt service reserves and other deposits. AES believes that net debt is a useful measure for evaluating our financial condition because it is a standard industry measure that provides an alternate view of a company’s indebtedness by considering the capacity of cash. It is also a required component of valuation techniques used by management and the investment community.
l Parent Company Liquidity (a non-GAAP financial measure) is defined as cash at the Parent Company plus availability under corporate credit facilities plus cash at qualified holding companies (“QHCs”). AES believes that unconsolidated Parent Company liquidity is important to the liquidity position of AES as a Parent Company because of the non-recourse nature of most of AES’ indebtedness.
l Parent Free Cash Flow (a non-GAAP financial measure) should not be construed as an alternative to Net Cash Provided by Operating Activities which is determined in accordance with GAAP. Parent Free Cash Flow is equal to Subsidiary Distributions less cash used for interest costs, development, general and administrative activities, and tax payments by the Parent Company. Parent Free Cash Flow is used for dividends, share repurchases, growth investments, recourse debt repayments, and other uses by the Parent Company.
69 Contains Forward-Looking Statements
Definitions (Continued)
l Proportional Free Cash Flow – The Company defines Proportional Free Cash Flow as cash flows from operating activities (adjusted for service concession asset capital expenditures), less maintenance capital expenditures (including non-recoverable environmental capital expenditures and net of reinsurance proceeds), adjusted for the estimated impact of noncontrolling interests. The proportionate share of cash flows and related adjustments attributable to noncontrolling interests in our subsidiaries comprise the proportional adjustment factor. Upon the Company’s adoption of the accounting guidance for service concession arrangements effective January 1, 2015, capital expenditures related to service concession assets that would have been classified as investing activities on the Condensed Consolidated Statement of Cash Flows are now classified as operating activities. The GAAP measure most comparable to proportional free cash flow is cash flows from operating activities. We believe that proportional free cash flow better reflects the underlying business performance of the Company, as it measures the cash generated by the business, after the funding of maintenance capital expenditures, that may be available for investing or repaying debt or other purposes. Factors in this determination include the impact of noncontrolling interests, where AES consolidates the results of a subsidiary that is not wholly owned by the Company.
l Proportional Metrics – The Company is a holding company that derives its income and cash flows from the activities of its subsidiaries, some of which are not wholly-owned by the Company. Accordingly, the Company has presented certain financial metrics which are defined as Proportional (a non-GAAP financial measure) to account for the Company’s ownership interest. Proportional metrics present the Company’s estimate of its share in the economics of the underlying metric. The Company believes that the Proportional metrics are useful to investors because they exclude the economic share in the metric presented that is held by non-AES shareholders. For example, Operating Cash Flow is a GAAP metric which presents the Company’s cash flow from operations on a consolidated basis, including operating cash flow allocable to noncontrolling interests. Proportional Operating Cash Flow removes the share of operating cash flow allocable to noncontrolling interests and therefore may act as an aid in the valuation the Company. Beginning in Q1 2015, the definition was revised to also exclude cash flows related to service concession assets. Proportional metrics are reconciled to the nearest GAAP measure. Certain assumptions have been made to estimate our proportional financial measures. These assumptions include: (i) the Company’s economic interest has been calculated based on a blended rate for each consolidated business when such business represents multiple legal entities; (ii) the Company’s economic interest may differ from the percentage implied by the recorded net income or loss attributable to noncontrolling interests or dividends paid during a given period; (iii) the Company’s economic interest for entities accounted for using the hypothetical liquidation at book value method is 100%; (iv) individual operating performance of the Company’s equity method investments is not reflected and (v) inter-segment transactions are included as applicable for the metric presented. The proportional adjustment factor, proportional maintenance capital expenditures (net of reinsurance proceeds) and proportional non-recoverable environmental capital expenditures are calculated by multiplying the percentage owned by noncontrolling interests for each entity by its corresponding consolidated cash flow metric and are totaled to the resulting figures. For example, Parent Company A owns 20% of Subsidiary Company B, a consolidated subsidiary. Thus, Subsidiary Company B has an 80% noncontrolling interest. Assuming a consolidated net cash flow from operating activities of $100 from Subsidiary B, the proportional adjustment factor for Subsidiary B would equal $80 (or $100 x 80%). The Company calculates the proportional adjustment factor for each consolidated business in this manner and then sums these amounts to determine the total proportional adjustment factor used in the reconciliation. The proportional adjustment factor may differ from the proportion of income attributable to noncontrolling interests as a result of (a) non-cash items which impact income but not cash and (b) AES’ ownership interest in the subsidiary where such items occur.
l Subsidiary Liquidity (a non-GAAP financial measure) is defined as cash and cash equivalents and bank lines of credit at various subsidiaries. l Subsidiary Distributions should not be construed as an alternative to Net Cash Provided by Operating Activities which is determined in accordance with GAAP. Subsidiary
Distributions are important to the Parent Company because the Parent Company is a holding company that does not derive any significant direct revenues from its own activities but instead relies on its subsidiaries’ business activities and the resultant distributions to fund the debt service, investment and other cash needs of the holding company. The reconciliation of the difference between the Subsidiary Distributions and Net Cash Provided by Operating Activities consists of cash generated from operating activities that is retained at the subsidiaries for a variety of reasons which are both discretionary and non-discretionary in nature. These factors include, but are not limited to, retention of cash to fund capital expenditures at the subsidiary, cash retention associated with non-recourse debt covenant restrictions and related debt service requirements at the subsidiaries, retention of cash related to sufficiency of local GAAP statutory retained earnings at the subsidiaries, retention of cash for working capital needs at the subsidiaries, and other similar timing differences between when the cash is generated at the subsidiaries and when it reaches the Parent Company and related holding companies.


![Audited Financial Results FY 2018-19 April 24, 2019 · Key Financial Highlights: FY 18-19 vs FY 17-18 as per Indian Accounting Standards [IndAS] Key Financial Highlights: Q4 FY 18-19](https://img.pdfslide.net/doc/110x75/5f1a178b938ef210d370e190/audited-financial-results-fy-2018-19-april-24-2019-key-financial-highlights-fy.jpg)