Embed Size (px)
Citation preview


COMPANY NAME : Banque de l’Habitat
HEAD OFFICE ADDRESS : 18, avenue Mohamed V 1080 Tunis
BOX OFFICE : 242 Cédex 1080
PHONE : +216 71 126 000
FAX : +216 71 337 957
SWIFT ADDRESS : BHBKTNTT
E-MAIL : [email protected]
WEBSITE : www.bh.com.tn
CALL CENTER : 1800 (from abroad : +216 71 001 800)
VOCAL SERVER : 88 401 421
BH SMS : 87 987
CAPITAL : 90 000 000 dinars
Quantity Amount : TD Percentage
Tunisian State 5 872 427 29 362 135 32.62%
Public 4 140 571 20 702 855 23.00%
Para public 255 306 1 276 530 1.42%
Private business 1 387 401 6 937 005 7.71%
Private individuals 4 485 283 22 426 415 24.92%
Foreigners 1 852 446 9 262 230 10.29%
Staff 5 826 29 130 0.03%
Free unconfirmed 740 3 700 0.004%
Total 18 000 000 90 000 000 100.00%
generalpresentation on the BH
PAGE 02
Structure of the capital as of 31/12/2010
banque de l’habitat • ANNUAL REPORT 2010
PAGE 03
SUMMARY
PAGE 04
08
16
46
1 0
24
Speech of the Chairman and Managing Director
National economic situation
Assessment of undertaken actions in 2010
International environment
The activities of the Bank
banque de l’habitat • ANNUAL REPORT 2010
PAGE 05
54
76
102
58
86
Future prospects
Management report of the Group Banque de l’Habitat
Resolutions
Financial statements
Consolidated financial statements

executive board
PAGE 06
Public sector
Mr Brahim HAJJI
Chairman and Managing Director
Mrs Fawzia Moussa SAAYID
Director representing the State
Mrs Souhir TAKTAK
Director respresenting the State
Mr Jalel CHOUIHI
Director representing the State
Mr Habib TOUMI
Director representing the State
Mr Ettajouri FATNASSI
Director representing the State

banque de l’habitat • ANNUAL REPORT 2010
PAGE 07
Private sector
Mr Ahmed TRABELSI
Mr Mohamed Sadok DRISS
Mr Rached EL HORCHANI
Mr Mohamed Taoufik DRISS
General Manager Assistant in
charge of facility management
Mr Adel ZARROUK
Mr Néjib
BEN Laaroussi MARZOUGUI
Mr Mahmoud
Montacer MANSOUR
State Controller
Mr Chihab GHANMI
Auditor
Mr Cherif BEN ZINA
Auditor
SPEECHOF THE CHAIRMAN
AND MANAGING DIRECTOR
Ladies and gentlemen shareholders,
I have the honor of presenting to you the annual report of the Bank’s activity as well as the financial statements and the main indicators trends during the fiscal year 2010.
Dear shareholders,
Dignity and freedom are universal values appreciated at the expense of priceless sacrifices. The Tunisian people and the youth offered them to Tunisia on January 14, 2011 our revolution day, May God all the mighty award to our martyrs his infinite forgiveness and may this revolution offer a better future to our youth and people.
Though the events that accompanied the 14 January revolution concern the year 2011, the fiscal year 2010 has been affected by the classification of the commitments of the deposed president. In effect, the Bank in a reasoning of preventing and preserving its financial balances and its shareholders, customers and staff interests constituted sound additional provisions.
Had it not been for this special circumstance, the Bank net result would have been at the expected level and we are confident in your comprehension and support in this exceptional situation.
At the level of risks management, the Bank proceeded during 2010 to the setting up of a set of measures related to the standardization of concepts tied to risks in order to control them in their different aspects: credit, rate, liquidity… thanks to committees that see to the good governance of these new practices.
At the activity level, the Bank’s results are satisfying on the whole. In effect, the year 2010 was marked by the 118.8 MTD (+2.3%) assets progress rising to 5 295.7 MTD, the increase in financing the economy by 527.6 MTD (+12.7%) and the raising of additional resources of 162.8 MTD (+3.3%).
Customers depos i ts were marked by an inc rease o f 1 08 .8 MTD (+3 .3%) to amount to 3 363.9 MTD.
As far as uses are concerned, the Bank managed during 2010 to maintain the revival of real estate activity achieving one of its strategic objectives namely the recovery of its market share in this activity sector. In effect, real estate loans to property providers went up by 98.4 MTD (+30.2%). Concurrently, the Bank continued to consolidate its core trade, buyers loans, in spite of increased competition in this field.
Totaling 3 680.4 MTD as of 31/12/2010 vs. 3 342.5 MTD a year before, productive claims went up by 437.9 MTD.
As for classified claims, they accounted for 10.8% of total loans and were covered at 68.9% by provisions and reserved charges.
PAGE 08

banque de l’habitat • ANNUAL REPORT 2010
Concerning operating results, net banking proceed came in at 194.6 MTD and operating gross result at 128.3 MTD, up respectively by 8.1 MTD (+4.4%) and 5.1 MTD (+4.1%). Net result of the fiscal year amounted to 32.6 MTD as of 31/12/2010.
As for regulatory ratios, the liquidity ratio and the solvency ratio reached respectively 111.94% and 9.95% at the end of 2010.
Concerning the group BH, the different subsidiaries of the Bank registered satisfying results on the whole helping to register a group’s net profit of 38.3 MTD at the end of the fiscal year 2010.
On the other hand, the Bank undertook several actions dealing with improvements in files processing delays and services quality; these measures dealt with sales points organizational procedures and the setting up of controller position.
Concerned with offering better quality services and in order to be close to its customers, the Bank extended branches network to 93 through the opening of 4 new sales points in Rawabi Bizerte, Moulares, Korba and northern urban zone.
As for prospects, the Bank intends to pursue its development process during 2011 by seeing to consolidating and preserving its financial balances and a better appropriateness between uses and resources. In effect, the Bank views to issue a 150 MTD debenture loan at conditions that will be set later taking into account the trends in financial market situation.
Thus, the Bank will strive to reinforce its information system through notably the system of exchanging information with the Central Bank, the system of combating money laundering and all mechanisms likely to reinforce surveillance and reduce risks in particular those related to daily operations and transactions and new products and services development…
Finally, I would like to take this opportunity to express my most profound thanks to the Bank’s staff for their effort and the spirit of enterprise that they showed; I also express my gratitude to the members of the executive board for their contribution to ensure the good governance of the Bank and our kind clientele for their loyalty.
PAGE 09


PAGE 11
INTERNATIONAL
ENVIRONMENT

World economic activity progress came in at around 5% in 2010, showing that world economy
recovered from financial crisis effects.
Should many countries overcome economic difficulties, it should be outlined that not all of them
are shielded from a possible shock. It is the case for most developed countries : some of them are facing
high levels of unemployment and others trade and / or budget imbalances.
In the United States , annual economic activity would register a 2.9% growth in 2010. In 2010
last quarter its GDP progressed by 3.2% vs. 2.6% in the third quarter. This performance is tied to household
consumption which went up by 4.4% and investments in facilities and softwares (+ 5.8%).
In 2010 second half, the euro zone experienced turbulences linked to countries indebtedness
crisis such as Greece, Ireland and at a lesser extent Spain and Portugal. This situation has an impact on this
zone growth level which would come in at 1.8%. As for emerging countries such as China, India and Brazil ,
they keep on registering a sound growth between 7.5% and 10.3%.
Japan found its growth path again 4.3% in 2010 after experiencing one of its serious recessions
in 2009 (-6.3%). This country’s exports soared in 2010 second half particularly in December 2010 (+5.7%).
Concurrently, it should be noted a decrease in imports because of domestic demand drop.
In emerging countries , economic activity was sound throughout 2010. The Chinese economy
was the strongest with a growth rate of 10.3% vs. 9.2% in 2009. It took advantage of an increasing
international demand and a growing domestic demand.
India , Asia’s third economic power would register a 9.7% growth rate in 2010.
INTERNATIONALENVIRONMENT
PAGE 12
World growth

INTERNATIONAL ENVIRONMENT • ANNUAL REPORT 2010
PAGE 13
At the end of 2010, commodities international prices registered an increase for most foodstuffs
under the effect notably of unfavorable climatic conditions having affected many agricultural crops such as
cereals in many producing countries like Brazil , Australia and China. In particular, prices rise reached at
the end of 2010 compared to the end of the previous year 46.2% for wheat and 18.9% for sugar against
20.1% and 2.2% respectively at the end of November. Also, industrial raw materials kept on increasing
reaching at the same date 89.4% for cotton and 32.6% for copper against 80.4% and 14% at end November.
On the other hand, crude oil prices have exceeded 90 dollars the barrel since the beginning of
December 2010 along with world demand revival, stocks decrease and the ongoing cold wave that hit
the United States and Europe. Thus, the barrel price amounted at the end 2010 to 94.75 dollars for the Brent
and 91.38 dollars for American light oil that is an increase by 21.6% and 15.1% respectively compared to the
end of the previous year.
As far as inflation is concerned, consumer prices registered some acceleration during December
2010 in the main industrialized countries following notably an increase in energy prices. In terms of annual
slide, inflation rate reached 1.5% in the United States vs. 1.1% the previous month and 2.2% in the Euro
zone vs. 1.9%.
As for unemployment, employment situation registered some improvement in industrial countries
with an unemployment rate regressing to 9.4% in the United States in December 2010 vs. 9.8% the previous
month. Moreover, the unemployment rate stabilized at 10.1% in November of the same year in the Euro zone
and at 5.1% in Japan.
Inflation
Employment
Commodities world market

Foreign Exchange markets and
monetary policies
On international foreign exchange markets , the euro decreased against the dollar in 2010 mainly
because of the fallouts of sovereign debt crisis in some European countries and the risks of its spread
to other countries of the Euro zone. The European currency ended the year 2010 at 1.3386 dollar registering
a drop by 6.6% against the dollar from the end of a year to another.
On the contrary, the yen appreciated in 2010 against the dollar taking advantage of its choice as
a safe currency by investors against turmoils experienced by international financial markets following notably
sovereign debt crisis. Then it reached at the end of the year 80.915 yens for a dollar, a 13.1% appreciation
from one end of the year to another.
On the other hand, Central banks in many industrialised countries have kept on softening
their monetary policies during 2010 through notably non conventional measures in the form of programmes
of assets purchase such as treasury bonds and treasury bills following the example of the American Federal
Reserve and the Bank of Japan which intervened for respective amounts of 600 billion dollars
and 5 000 billion yens (about 43 billion Euros). On the other hand, central banks in some industrialised
countries and emerging countries have started to apply restrictive monetary policies to lighten pressures on
the economy. In particular the Bank of China rose its key interest rate twice during 2010 and six times
the rate of reserve requirements in the same year.
INTERNATIONALENVIRONMENT
INTERNATIONAL ENVIRONMENT • ANNUAL REPORT 2010
PAGE 14 PAGE 15

International stock markets indexes
INTERNATIONALENVIRONMENT
INTERNATIONAL ENVIRONMENT • ANNUAL REPORT 2010
PAGE 14 PAGE 15
On another level, the trend of main international stock markets diverged during 2010. In particular,
the American stock market registered positive results taking advantage of important interventions
of the Federal Reserve to support the economy revival and the improvement in economic indicators
in the United States at the end of the year. In this context, the Dow Jones and Nasdaq went up respectively
by 11% and 16.9% from one end of the year to another.
On the contrary, many European stock markets registered a decrease because of sovereign debt
crisis. The CAC 40 in particular went down by 3.3% between end 2009 and end 2010. Also, Tokyo stock
market recorded a decrease under the effect of the yen’s appreciation which affected exports
and consequently the financial results of Japanese businesses. The Nikkei drop reached 3.3% from one end
of year to another.


PAGE 17
NATIONAL ECONOMIC
SITUATION

NATIONALECONOMIC SITUATION
NATIONAL ECONOMIC SITUATION • ANNUAL REPORT 2010
PAGE 18 PAGE 19
The Tunisian economy recorded satisfying results on the whole during 2010 and was able
to register an improvement compared to the previous year. Thus, and in spite of a relatively modest agricultural
campaign, these results have been obtained thanks to production progress the trend in some manufacturing
industries activities notably with world economic growth revival and a slight increase in tourism and transport
sectors.
In 2010, the agricultural sector registered a decrease in its added value estimated at 8.8%
in constant prices against a 6% progress in 2009 following notably a regress in cereals and olive oil
productions.
In effect, cereals production of the 2009-2010 campaign came in at 10.8 million quintals against
25.3 million in 2008 - 2009 campaign.
As for olive oil production of 2010 – 2011 campaign, it is estimated at 120 thousand tonnes
against 150 thousand tonnes in the previous campaign.
However, dates and citrus fruits productions went up respectively by 7.4% and 13.9% compared
to the previous campaign reaching 174 and 352 thousand tonnes.
As for the sector of breeding, fresh milk production progressed by 2.3% in 2010 which helped
increase collected quantities intended to dairy industry.
Economic growth rate came in at 3.8% in 2010 against 3.1% in the previous year.
This progress is ascribable to the recovery in manufacturing industries thanks to the net
improvement in external demand. Like mechanical and electrical industries, the service sector was also
characterized by a positive trend of indicators pertaining to tourism and air transport activities.
Growth
Agriculture and Fishing

NATIONALECONOMIC SITUATION
NATIONAL ECONOMIC SITUATION • ANNUAL REPORT 2010
PAGE 18 PAGE 19
Concerning the sector of fish and fish farming , the production stabilized during the first eleven
months of 2010 at the level of the same period in 2009 that is 93 thousand tonnes.
On the level of trade transactions of agricultural and food products with abroad, cereals imports
went up by about 65% in quantity in 2010 and by 78% in value reaching 3 234 thousand tonnes for a value
of 1 087 MTD following the decrease in production and prices increase on world market.
As for exports, olive oil exported quantities reached 110 thousand tonnes in 2010 for a value
of 444 MTD against about 142 thousand tonnes and 533 MTD the previous year.
Concerning dates , their exports have reached since the beginning of the current trading campaign
and till January 24, 2011, a level similar to the one registered during the same period of the previous
campaign that is about 25 thousand tonnes. These exports value rose by 3.7% reaching 85 MTD following
an improvement in prices average level.
Sea products exports went up by 3.7% in quantity in 2010 and by 1.6% in value to reach about
17 thousand tonnes and 185 MTD.
Thus, the food trade balance showed a deficit of about 557 MTD in 2010 against a 38 MTD
surplus the year before because of imports increase by 38.6% against exports slight increase by 1.2%.
It resulted a decrease in the rate of coverage of food products imports by exports which
regressed from 102.4% to 74.8% from one year to another.

NATIONALECONOMIC SITUATION
NATIONAL ECONOMIC SITUATION • ANNUAL REPORT 2010
PAGE 20 PAGE 21
During 2010, industrial production general index rose by 7.8% against a 4.5% decrease
the previous year following production revival in the manufacturing industries (9.3% vs. -6% a year earlier) as
well as in mining sector (15.4% vs. -2.8%) while production registered a virtual stagnation in energy sector
(0.6% vs. 1.7% a year earlier) .
Manufacturing industries production progress concerned all sectors in particular mechanical
and electrical industries (25.2% vs. -8.3% in 2009) and chemical industries (6.9% vs. 2.3%) which took
advantage of external demand rise. Also, the production in the sector of textile, clothing, leather, and footwear
went up by 4.2% against a 14.8% decrease a year earlier.
As for trade transactions with abroad, manufacturing industries exports other than foodstuffs
registered a net revival in 2010 (22.1% vs. - 13.4% the year before).
Also, chemical industries exports registered a revival (23.1% vs. -43% a year earlier) following
essentially phosphate by products exports revival and prices rise on world market.
Concerning clothing and textile sector exports , they progressed by 6.8% vs. a 8.7% drop
in 2009 along with the sector progressive activity revival.
Energy sector trade balance showed a deficit of 484 MTD vs. a 152 MTD deficit a year earlier
because of imports which exceeded exports notably for oil products along with prices rise on world markets
and the break in Bizerte refinery.
Industrial activity

During 2010, passengers air traffic rose by 5.5% after regressing by 5.4% in the previous year
to amount to 11.2 million passengers. This trend concerned international flights (5.4% against a drop
at the same rate in 2009), notably regular flights (12.2%) as well as domestic flights (9.8%).
In terms of trade transactions with abroad, exports and imports went up respectively by 20.8%
and 23% during 2010 against respective drops of 17.6% and 14.4% in 2009 which meant a widening
of the trade deficit by 1 889.7 MTD and a decrease in the coverage rate which went down from 75.2%
to 73.9% from one period to another.
Current deficit accounted for 4.8% of GDP in 2010 against 2.8% in 2009.
Net assets in foreign currencies amounted to 13 003 MTD at end 2010 corresponding to
147 days of imports against 13 353 MTD and 186 days at the same date in 2009.
NATIONALECONOMIC SITUATION
NATIONAL ECONOMIC SITUATION • ANNUAL REPORT 2010
PAGE 20 PAGE 21
The number of foreign tourists stagnated in 2010 after decreasing by 2.1% the previous year
reaching 6.9 million tourists. This situation is explained by the regress in Maghreb tourists flows (-2.4%) while
the number of European tourists went up by (1.9% vs. an 8.8% decrease a year earlier) .
On the other hand, overall tourist bednights rose by 4.3% in 2010 against a 9.2% drop a year
earlier to reach 36.2 million units.
As for the occupancy rate of used accommodation capacity , it came in at 50.3% and varied
between 17.5% in the zone of Gabès and 60.3% in the one of Djerba-Zarzis.
Regarding tourism earnings in foreign currencies in 2010, they rose by 1.2% (-1.2% excluding
foreign exchange effect) against a 2.4% progress the previous year reaching 3513 MTD which accounts
for about 10% of current receipts of the balance of payments against 11.6% in 2009.
Tourism activity
Air transport
External trade
NATIONALECONOMIC SITUATION
NATIONAL ECONOMIC SITUATION • ANNUAL REPORT 2010
PAGE 22 PAGE 23
The increase in the supply of banks the liquidity of which is in excess and more important than
the one of banks showing a deficit during the last quarter of 2010, meant a decrease in banks needs
in liquidity on the money market.
The year 2010 was also characterized by :
• An increase in money supply M3 by 11.1% vs. 13% in 2009.
• The decrease in net claims on abroad by 482 MTD compared to their level of the previous year
reflecting essentially the shrinking in net assets in foreign currencies (-350 MTD).
• The decrease in net claims on the State by 168 MTD against a 953 MTD increase a year before
under the effect mainly of the decrease in the outstanding balance of treasury bonds in banks portfolio
(-111 MTD) and the increase in treasury current account balance (+ 209 MTD).
• The performance of financing the economy (19.2% or 6 934 MTD) against (10.3% or 3 371 MTD)
during the previous fiscal year. This increase reflects the one of loans granted on ordinary resources (20.6%
vs. 11%). However, the outstanding balance of loans on special resources kept on decreasing but at a lesser
pace than the one of the previous year (-1% vs. -3.3%).
• At the end of 2010 and compared to its level at end 2009, the rate of the dinar on interbank
market registered a respective decrease by 19.4% against the Japanese yen, 8.4% against the American
dollar, 2.3% against the Moroccan dirham but a virtual stability against the euro (-1.2%).
Monetary policy
The inflation rate came in at 4.4% during 2010 against 3.5% in 2009.
This is ascribable essentially to the rise in imported products world prices mainly foodstuffs
and energy in addition to the impact of foreign exchange rate fluctuations and in particular the euro
appreciation against the Tunisian dinar.
It should be mentioned that the increase in consumer prices general index has been slowering
from one month to another compared to the start of the previous year going down from a 4.9% peak
in February 2010 to 4.4% in December 2010.
INFLATION

NATIONALECONOMIC SITUATION
NATIONAL ECONOMIC SITUATION • ANNUAL REPORT 2010
PAGE 22 PAGE 23
Tunis stock market ended 2010 with a Tunindex annual yield of 19% vs. 48.4% a year before
registering its eighth increase in a row. It should be mentioned that the last quarter was characterized
by a drop in transactions following the announcement of taxing added values on stock markets.
Stock market indexes have been as follows :
• Tunindex capitalization index ended the year 2010 on 19.1% profit at 5 681.39 points against
4 291.72 points; a satisfying performance compared to the record yield of 48.4% registered a year earlier.
• Stock market capitalization came in at 15 282 MTD at end 2010 against 12 227 MTD in 2009,
a 25% increase compared to its 2009 level.
This increase is the combined effect of a record number of introductions on the stock market
(5 companies: Salim, Tunis Re, Carthage Cement, Ennakl and Modern Leasing) bringing the number of listed
companies to 56 and the four capital increase of listed companies.
• Annual transactions on the cotation reached 2 702 MTD against 1 814 MTD during 2009,
a 49% increase showing an improvement in liquidity with a daily average volume of 10.4 MTD against
6.8 MTD a year before.
This dynamism is due to investors infatuation for newly introduced securities and some financial
securities which captured about 50% of transactions overall volume.
• Annual yields of sector related indexes were positive except for the index “services
to consumers” (-0.01% vs. +60.8% in 2009) led by the decrease in the security “Tunisair” (-18.9%).
These positive yields varied between 3.2% for the index “Distribution” and 38.6% for the index
“financial services” with an increase in the index “Tunbank” of 19.6% against 49.7% in 2009.
• Foreign investors share in stock market capitalization came in at 20.16% at end December
2010 against 21.92% in 2009 and against 19.97% in September 2010, an increase ascribable
to the comeback of these investors to the Tunisian market for a 22 MTD balance on the stock market cotation
(that is purchases for 71 MTD and sales for 49 MTD).
It should be noted that “Modern Leasing” security newly introduced at end 2010 registered
the highest increase of the year that is 40.8%.
Financial market

THE ACTIVITIES
OF THE BANK
PAGE 25
THE ACTIVITIESOF THE BANK
THE ACTIVITIES OF THE BANK • ANNUAL REPORT 2010
PAGE 26 PAGE 27
Act i v i ty ind ica to rs 31/12/2010 31/12/2009 31/12/2008 31/12/2007 31/12/2006
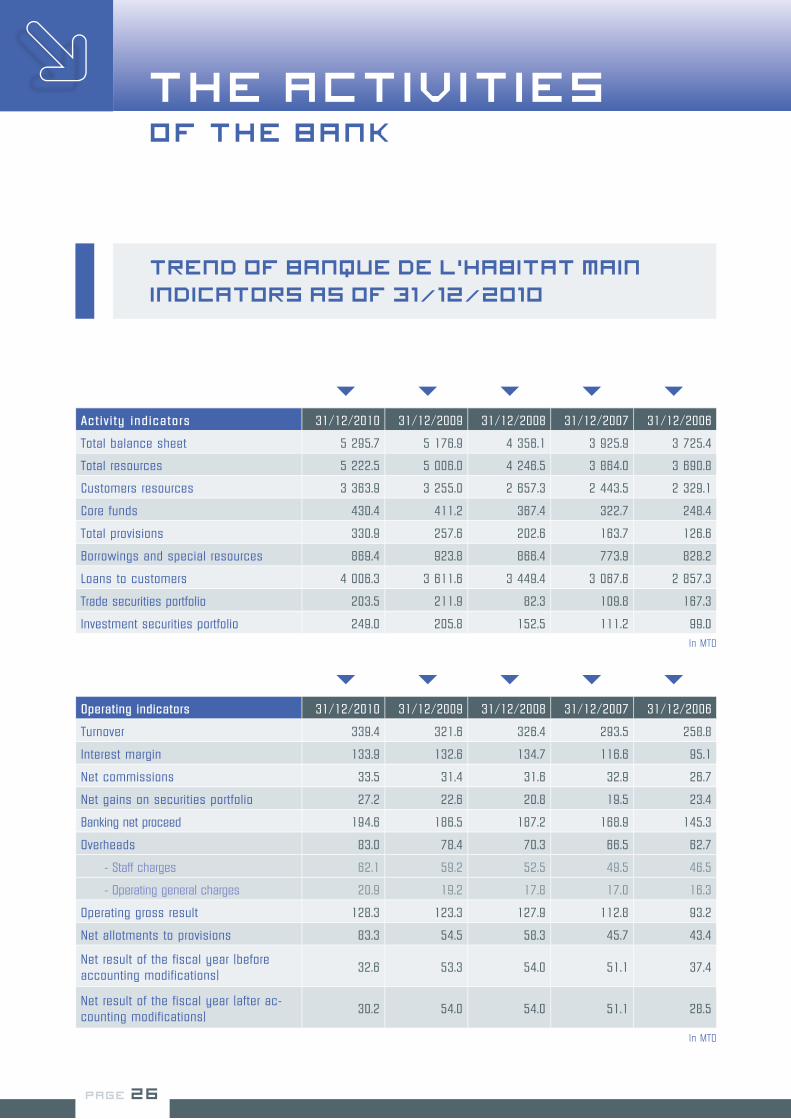
Total balance sheet 5 295.7 5 176.9 4 356.1 3 925.9 3 725.4
Total resources 5 222.5 5 006.0 4 246.5 3 864.0 3 690.8
Customers resources 3 363.9 3 255.0 2 657.3 2 443.5 2 329.1
Core funds 430.4 411.2 367.4 322.7 248.4
Total provisions 330.9 257.6 202.6 163.7 126.6
Borrowings and special resources 869.4 923.8 866.4 773.9 828.2
Loans to customers 4 006.3 3 611.6 3 449.4 3 067.6 2 857.3
Trade securities portfolio 203.5 211.9 82.3 109.8 167.3
Investment securities portfolio 249.0 205.8 152.5 111.2 99.0
Operating indicators 31/12/2010 31/12/2009 31/12/2008 31/12/2007 31/12/2006
Turnover 339.4 321.6 326.4 293.5 258.8
Interest margin 133.9 132.6 134.7 116.6 95.1
Net commissions 33.5 31.4 31.6 32.9 26.7
Net gains on securities portfolio 27.2 22.6 20.8 19.5 23.4
Banking net proceed 194.6 186.5 187.2 168.9 145.3
Overheads 83.0 78.4 70.3 66.5 62.7
- Staff charges 62.1 59.2 52.5 49.5 46.5
- Operating general charges 20.9 19.2 17.8 17.0 16.3
Operating gross result 128.3 123.3 127.9 112.8 93.2
Net allotments to provisions 83.3 54.5 58.3 45.7 43.4
Net result of the fiscal year (before accounting modifications)
32.6 53.3 54.0 51.1 37.4
Net result of the fiscal year (after ac-counting modifications)
30.2 54.0 54.0 51.1 28.5
Trend of Banque de l’Habitat main
indicators as of 31/12/2010
In MTD
In MTD

THE ACTIVITIESOF THE BANK
THE ACTIVITIES OF THE BANK • ANNUAL REPORT 2010
PAGE 26 PAGE 27
Rat ios 31/12/2010 31/12/2009 31/12/2008 31/12/2007 31/12/2006
• PROFITABILITY RATIOS
Net profit / Core funds (ROE) 7.57% 12.95% 14.70% 15.85% 11.47%
Net profit / Total assets (ROA) 0.62% 1.03% 1.24% 1.30% 0.76%
Banking Net proceeds / Total balance sheet
3.68% 3.60% 4.30% 4.30% 3.90%
Banking Net proceeds / turnover 57.34% 57.99% 57.34% 57.57% 56.12%
Banking Net proceeds / Total loans 4.86% 5.16% 5.43% 5.51% 5.08%
• OPERATING RATIOS
Encashed commissions / staff costs 63.00% 59.20% 66.68% 71.38% 62.33%
Operating ratios(Overheads / Banking net proceeds)
42.63% 42.03% 37.57% 39.38% 43.18%
Net commissions / Banking net proceeds
17.19% 16.81% 16.88% 19.45% 18.39%
Staff costs / Banking net proceeds 31.91% 31.74% 28.07% 29.31% 31.99%
• STRUCTURE RATIOS
Loans to customers/ Deposits to customers 119.10% 110.95% 129.81% 125.54% 122.68%
• REGULATORY RATIOS
Cooke ratio 9.95% 10.16% 10.44% 11.36% 8.17%
Liquidity ratio 111.94% 129.55% 114.06% 115.0% 123.13%
• NPL COVERAGE 68.9% 70.0% 63.5% 72.3% 71.2%
NPL / Total commitments 10.8% 8.7% 8.3% 7.3% 7.7%
Resources costs 3.27% 3.46% 4.15% 4.11% 4.0%
Uses yield 6.08% 6.48% 7.49% 7.17% 6.9%
THE ACTIVITIESOF THE BANK
THE ACTIVITIES OF THE BANK • ANNUAL REPORT 2010
PAGE 28 PAGE 29
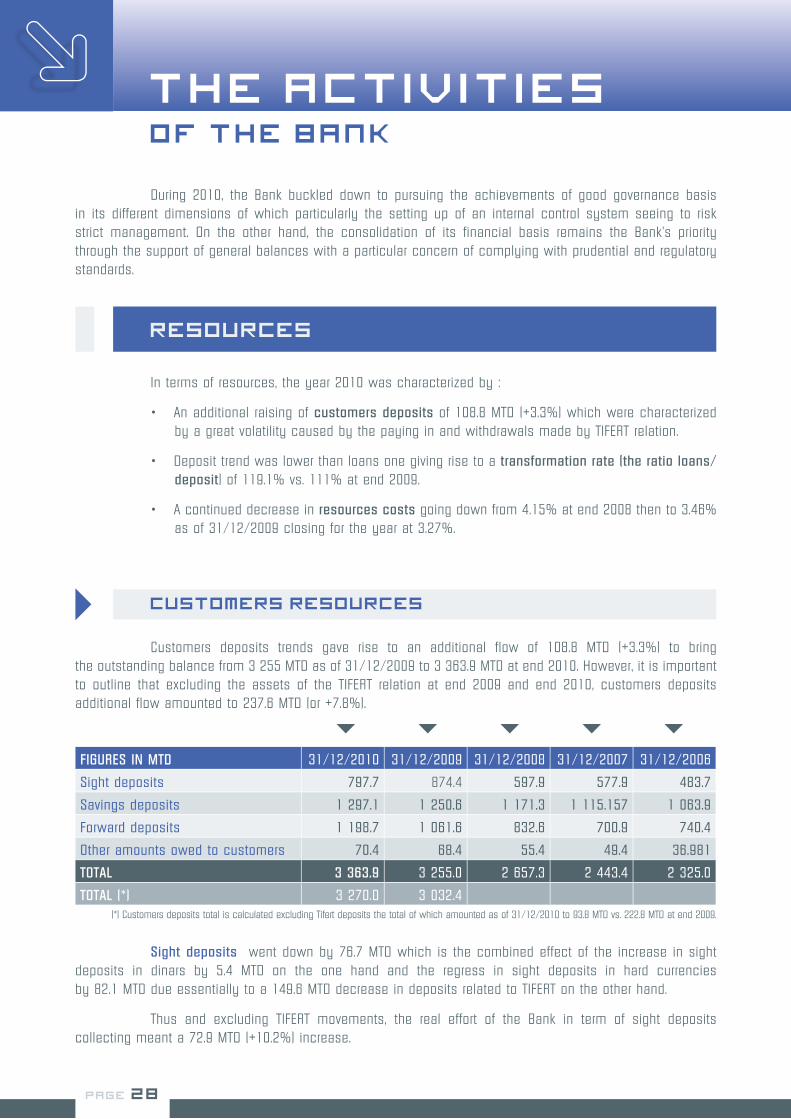
In terms of resources, the year 2010 was characterized by :
An additional raising of • customers deposits of 108.8 MTD (+3.3%) which were characterized by a great volatility caused by the paying in and withdrawals made by TIFERT relation.
Deposit trend was lower than loans one giving rise to a • transformation rate (the ratio loans/ deposit) of 119.1% vs. 111% at end 2009.
A continued decrease in • resources costs going down from 4.15% at end 2008 then to 3.46% as of 31/12/2009 closing for the year at 3.27%.
Resources
Customers deposits trends gave rise to an additional flow of 108.8 MTD (+3.3%) to bring the outstanding balance from 3 255 MTD as of 31/12/2009 to 3 363.9 MTD at end 2010. However, it is important to outline that excluding the assets of the TIFERT relation at end 2009 and end 2010, customers deposits additional flow amounted to 237.6 MTD (or +7.8%).
Sight deposits went down by 76.7 MTD which is the combined effect of the increase in sight deposits in dinars by 5.4 MTD on the one hand and the regress in sight deposits in hard currencies by 82.1 MTD due essentially to a 149.6 MTD decrease in deposits related to TIFERT on the other hand.
Thus and excluding TIFERT movements, the real effort of the Bank in term of sight deposits collecting meant a 72.9 MTD (+10.2%) increase.
(*) Customers deposits total is calculated excluding Tifert deposits the total of which amounted as of 31/12/2010 to 93.8 MTD vs. 222.8 MTD at end 2009.
Customers resources
FIGURES IN MTD 31/12/2010 31/12/2009 31/12/2008 31/12/2007 31/12/2006
Sight deposits 797.7 874.4 597.9 577.9 483.7
Savings deposits 1 297.1 1 250.6 1 171.3 1 115.157 1 063.9
Forward deposits 1 198.7 1 061.6 832.6 700.9 740.4
Other amounts owed to customers 70.4 68.4 55.4 49.4 36.981
TOTAL 3 363.9 3 255.0 2 657.3 2 443.4 2 325.0
TOTAL (*) 3 270.0 3 032.4
During 2010, the Bank buckled down to pursuing the achievements of good governance basis in its different dimensions of which particularly the setting up of an internal control system seeing to risk strict management. On the other hand, the consolidation of its financial basis remains the Bank’s priority through the support of general balances with a particular concern of complying with prudential and regulatory standards.

THE ACTIVITIESOF THE BANK
THE ACTIVITIES OF THE BANK • ANNUAL REPORT 2010
PAGE 28 PAGE 29
Savings deposits continued their upward trend but at a lesser pace than the one of 2009, progressing by 46.5 MTD (+3.7%) vs. 79.3 MTD (+6.8%) in 2009.
Increasing by 50.2 MTD free savings deposits remain the exclusive boost of savings deposits which were impacted by the downward trend of housing savings deposits (-6.7 MTD). As for Eljadid savings deposits and studies savings deposits, they went up respectively by 1.5 MTD and 1.4 MTD.
Maturities deposits i l lustrated a 137 MTD trend favored by a progress of forward deposits by 186.8 MTD against a decrease in deposit certificates by 52 MTD.
TREND OF CUSTOMERS DEPOSITS 2006-2010 :
2 32
5.0
2 44
3.5
2 65
7.3
3 25
5.0
3 36
3.9
3
032.
4
3
270.
0
2 000
2 400
2 800
3 200
3 600
2006 2007 2008 2009 2010
Customers deposits
deposits excluding TIFERT
- Figures in MTD -
CUSTOMERS RESOURCES ADDITIONAL FLOWS IN 2010 :
Sight deposit
Savings deposits
Maturities deposits
- Figures in MTD -
-76.7
46.5
137.0
- Figures in MTD -
STRUCTURE OF CUSTOMERS DEPOSITS AS OF 31/12/2010 :
Saving deposits
Maturities deposits
24%
40%
36%
Sight deposits

THE ACTIVITIESOF THE BANK
THE ACTIVITIES OF THE BANK • ANNUAL REPORT 2010
PAGE 30 PAGE 31
TREND OF CUSTOMERS DEPOSITS 2006-2010 :
Borrowings and special resources
Core funds
As for borrowings , 2010 was characterized by a reimbursement pace that was higher than the one of encashment; in effect the Bank made the following paying out:
The first portion of a subordinated loan of 14 MTD.•
The whole last year’s borrowing from Nefzoua clinic (4.6 MTD)•
Maturities regarding first lines pertaining to ADB borrowing (3.5 MTD), EIB (0.6 MTD) and FDA (0.9 MTD).•
The second lines pertaining to borrowings from ADB (11.7 MTD) and EIB (0.9 MTD).•
The third line of EIB borrowings (2.6 MTD).•
And the second portion of HG 004C borrowing (0.4 MTD)•
On the other hand and dur ing 2010, the sole drawing is the f i f th of E IB bor rowing for an amount of 7 MTD.
Core funds reached 430.4 MTD vs. 411.2 MTD a year before meaning a consolidation of 19.1 MTD (+4.7%) led mainly by the strengthening of reserves by 43 MTD.
Taking advantage of provisions reinforcement by 73.3 MTD (+28.4%), these resources went up by 24% that is +89.2 MTD with reserved agios contribution by 12.4 MTD (+17.8%).
Other resources
2006 2007 2008 2009 2010
Savings deposits
Maturities deposits
Sight deposits
1063.9
1115.5
1171.3 1250.6
1297.1
740.4
700.9
832.6 1061.6 1198.7
483.7
578.0
597.9
874.4
797.7
- Figures in MTD -

THE ACTIVITIESOF THE BANK
THE ACTIVITIES OF THE BANK • ANNUAL REPORT 2010
PAGE 30 PAGE 31
Provisions
Reserved agios
126.
6 163.
7 202.
6
257.
6
330.
9
59.8
65.5
64.2
69.7
82.1
2006 2007 2008 2009 2010
- Figures in MTD -
At the level of uses, the year 2010 was marked by:
Intensifying the Bank’s intervention in financing the economy which meant an additional flow • going up from 284.6 MTD (7.4%) in 2009 to 527.6 MTD (+12.7%) in 2010.
Diversifying the activity while maintaining a structure that supports the predominance of real • estate loans (prefinancing and buyers) the outstanding balance of which accounts for 48.2% of productive claims.
THE USES
Accounting for the dominating item of financing the economy, loans on core funds went up by 487 MTD, more than the double of achievements at the end of 2009 (+ 227.6 MTD).
Securities portfolio rose by 49.1 MTD fed by the increase of participation portfolio by 32.3 MTD of which 21.7 MTD coming to the Bank’s additional participation in the capital of Foreign Tunisian Bank (former UTB). The Bank also invested 12.8 MTD in 2010 in its subsidiary SIM-SICAR.
Loans on special resources pursued their 2009 decrease (-0.9 MTD) going down by 8.6 MTD.
These trends combining generated a volume of financing the economy going up by 527.6 MTD closing for the year 2010 at 4 680.1 MTD.
Financing the economy

THE ACTIVITIESOF THE BANK
THE ACTIVITIES OF THE BANK • ANNUAL REPORT 2010
PAGE 32 PAGE 33
STRUCTURE OF PRODUCTIVE CLAIMS IN 2010 :
37 %
8 %
11 %
12 %
32 %
Buyers real estate loans
Consumer loans
Loans to individuals
Loans to real estate property developers
Customers debtor accounts
66%
Crédits Epargne Eljadid
Crédits Epargne Logement
Crédits Directs
32%
2%
FIGURES IN MTD 31/12/2010 31/12/2009 31/12/2008 31/12/2007 31/12/2006
Total loans/core funds 3 973.9 3 486.8 3 259.2 2 851.7 2 504.6
Customers debtors accounts 299.7 267.1 297.2 235.9 195.9
Loans to individuals 444.0 385.8 363.9 323.5 226.6
Consumer loans 1 162.4 941.4 834.8 561.3 417.3
Loans to real estate property developers
424.7 326.3 255.5 267.6 254.2
Loans to real estate buyers 1 349.6 1 321.8 1 272.1 1 224.9 1 195.4
Total produtives claims 3 680.4 3 242.5 3 023.4 2 613.2 2 289.4
Total undue payments 293.5 244.3 235.8 238.6 215.2
Total loans / special resources 419.4 428.0 428.9 423.6 418.2
Total loans to customers (1) 4 393.3 3 914.8 3 688.1 3 275.4 2 922.8
Total securities portfolio (2) 286.8 237.7 179.8 132.2 119.0
Financing of the economy(1)+(2) 4 680.1 4 152.5 3 867.9 3 407.6 3 041.8
The following table shows the trend of financing the economy during the period 2006-2010 :
TREND OF FINANCING THE ECONOMY AND PRODUCTIVE CLAIMS 2006-2010 :
4500
4000
3500
3000
2500
2000
1500
2006 2007 2008 2009 2010
4680
.1
3143
.5 3407
.7 3867
.7 4152
.5
Productive claimsFinancing of the economy
2364
.5
2613
.2 3023
.4
3242
.5 3680
.4
- Figures in MTD -

THE ACTIVITIESOF THE BANK
THE ACTIVITIES OF THE BANK • ANNUAL REPORT 2010
PAGE 32 PAGE 33
Debtor accounts were characterized
by a non linear trend. In effect during the first half,
these claims went up by 28.6 MTD then
by 23.5 MTD during their third quarter closing for
the last three months at a downward trend (-18.5
MTD). Consequently, debtor accounts closed for
the year 2010 at a 32.6 MTD increase bringing
their outstanding balance to 299.7 MTD against
267.1 MTD a year before.
TREND IN DEBTOR ACCOUNTS(IN OUTSTANDING BALANCE AND IN FLOWS) 2006-2010 :
2006 2007 2008 2009 2010
400
300
200
100
0
80.0
60.0
40.0
20.0
0.0
-20.0
-40.0
177.
7
235.
9
297.
2
267.
1
299.
7
39.4
58.2
61.3
-30.
0
32.6
- Figures in MTD -
Outstanding balance Additional flow
Loan to customers
Personal loans were characterized by
a new boost progressing by 58.2 MTD, an additional
flow exceeding the registered amounts in 2009
and 2008 (+49.9 MTD). This boost was led mainly by
the trend in medium term loans rising by 98.8 MTD
partially slowered by consumer loans (-43.2 MTD).
Loans intended to cars purchases went up
by 2.6 MTD.
Thus, the outstanding balance rose by
15.1% to 444 MTD at end 2010.
TREND IN PERSONAL LOANS(IN OUTSTANDING BALANCE AND IN FLOWS) 2006-2010
2006 2007 2008 2009 2010
500
400
300
200
100
80.0
70.0
60.0
50.0
40.0
30.0
20.0
Outstanding balance Additional flow
259.
1
335.
9
363.
9
385.
8 444.
0
76.8
69.0
28.0
21.9
58.2
- Figures in MTD -
Almost all forms of loans showed a double digit positive variation with a net acceleration of pace
trend. Thus productive claims rose by 437.9 MTD corresponding to 13.5% increase against 7.2% in 2009.

THE ACTIVITIESOF THE BANK
THE ACTIVITIES OF THE BANK • ANNUAL REPORT 2010
PAGE 34 PAGE 35
Short term consumer loans showed
an 82.2 MTD increase against a 4.6 MTD decrease
a year before. The outstanding balance registered
a 17.6% increase bringing it to 549.9 MTD as of
31/12/2010.
Medium term consumer loans
progressed at an annual average rate of 28%;
the outstanding balance having increased from
225 MTD as of 31/12/2006 to 607 MTD
at end 2010.
In 2010, the additional flow amounted
to 136.8 MTD
600
500
400
300
200
100
200
100
300
400
500
600
Outstanding balance
70.5
62.5
166.
2
-4.6
82.1
-10
10
30
50
70
90
110
130
150
170
2006 2007 2008 2009 2010
- Figures in MTD -
additional flow
243.
6
306.
1
472.
3
467.
7
549.
8
TREND IN SHORT TERM CONSUMER LOANS (IN OUTSTANDING BALANCE AND IN FLOWS) 2006-2010
225.
0
252.
2
358.
9
470.
2 607.
0
44.0
27.3
106.
6
111.
3
136.
8
20.0
40.0
60.0
80.0
100.0
120.0
140.0
160.0
100
200
300
400
500
600
2006 2007 2008 2009 2010
- Figures in MTD -
Outstanding balance additional flow
TREND IN MEDIUM TERM CONSUMER LOANS (IN OUTSTANDING BALANCE AND IN FLOWS) 2006-2010
Prefinancing loans registered the highest growth rate of productive claims (+30.1%) going
up by 98.4 MTD feeding thus these claims total increase by 24%.
This growth is favored by a released package amounting to 179.9 MTD up by 27.4% compared
to the one used in 2009. Private real estate providers absorbed 78.3% of this package, an amount
of 140.8 MTD. Releasings in favor of public real estate providers came in at 39.1 MTD against 21.6 MTD
in 2009 showing an 81% increase.
As for authorizations, loans granted to real estate providers totaled 251.1 MTD intended
to the achievement of 3 672 lodgings against 3 251 in 2009.
THE ACTIVITIESOF THE BANK
THE ACTIVITIES OF THE BANK • ANNUAL REPORT 2010
PAGE 34 PAGE 35
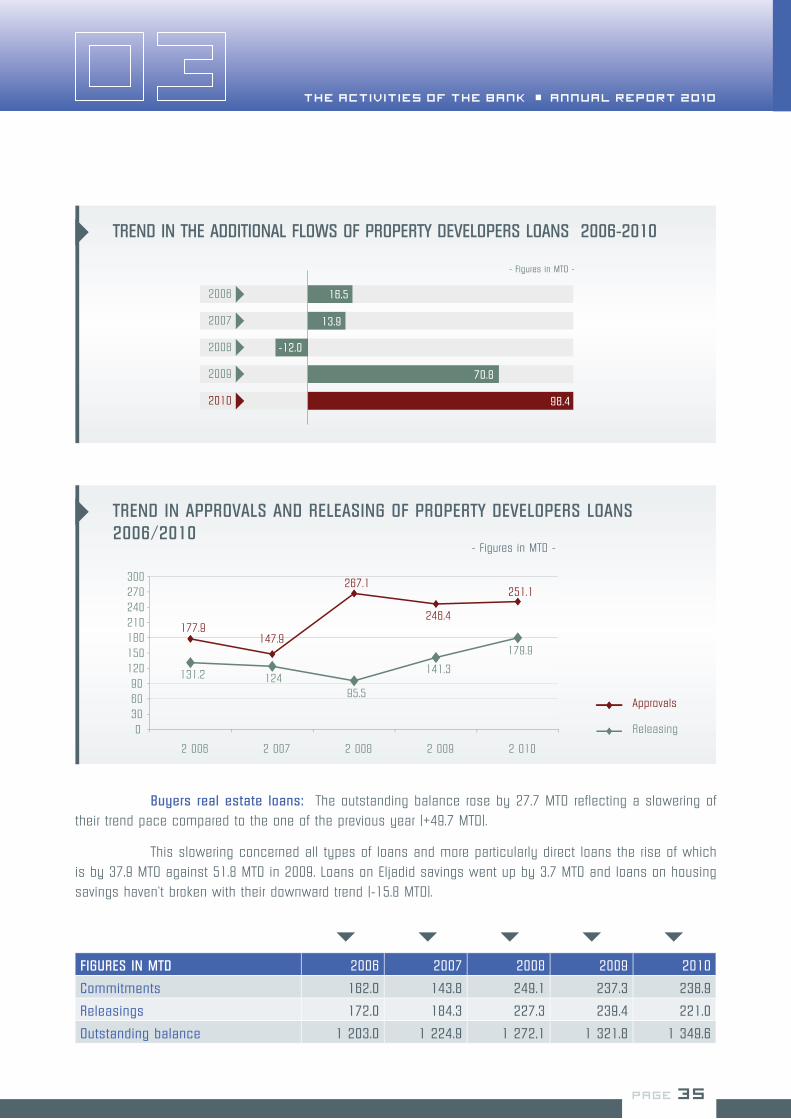
TREND IN THE ADDITIONAL FLOWS OF PROPERTY DEVELOPERS LOANS 2006-2010
16.5
13.9
-12.0
70.8
98.4
2006
2007
2008
2009
2010
- Figures in MTD -
TREND IN APPROVALS AND RELEASING OF PROPERTY DEVELOPERS LOANS 2006/2010
177.9 147.9
267.1
246.4
251.1
131.2 124 95.5
141.3
179.9
0 30 60 90
120 150 180 210 240 270 300
2 006 2 007 2 008 2 009 2 010
Approvals
Releasing
- Figures in MTD -
Buyers real estate loans: The outstanding balance rose by 27.7 MTD reflecting a slowering of
their trend pace compared to the one of the previous year (+49.7 MTD).
This slowering concerned all types of loans and more particularly direct loans the rise of which
is by 37.9 MTD against 51.8 MTD in 2009. Loans on Eljadid savings went up by 3.7 MTD and loans on housing
savings haven’t broken with their downward trend (-15.8 MTD).
FIGURES IN MTD 2006 2007 2008 2009 2010
Commitments 162.0 143.8 249.1 237.3 238.9
Releasings 172.0 184.3 227.3 239.4 221.0
Outstanding balance 1 203.0 1 224.9 1 272.1 1 321.8 1 349.6

THE ACTIVITIESOF THE BANK
THE ACTIVITIES OF THE BANK • ANNUAL REPORT 2010
PAGE 36 PAGE 37
STRUCTURE OF HOUSING LOANS
Y E A R 2 0 0 6
Y E A R 2 0 1 0
Eljadid savings loans 2%
Direct loans 66%
Housing savings loans 32%
Direct loans 70%
Eljadid savings loans 4%
Housing savings loans 26%
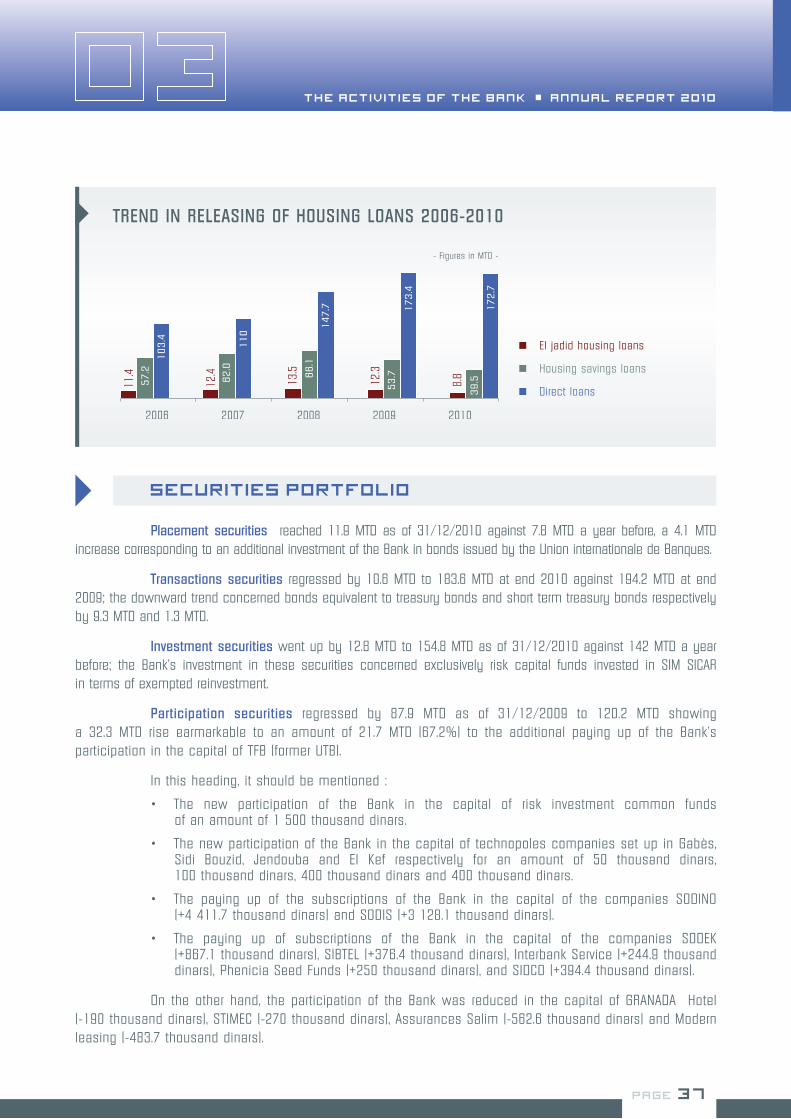
Releasing went down by 18.4 MTD of which 14.2 MTD coming to the released amount in favor of housing savings loans.
At a lesser extent, releasings regarding Eljadid housing savings went down by 3.5 MTD, on the other hand, releasings in favor of direct loans almost stagnated at the 2009 same level closing for the year 2010 with a package of 172.7 MTD.
FIGURES IN MTD
RELEASINGS 2006 2007 2008 2009 2010
Loans/ housing savings 57.2 62.0 66.1 53.7 39.5
Direct loans 103.4 110.0 147.7 173.4 172.7
Loans/ Eljadid savings 11.4 12.4 13.5 12.3 8.8
In 2010, the Bank granted 5 754 housing loans to private individuals of which 1 406 loans on housing savings, 4 028 direct loans and 320 loans on Eljadid resources. The total package of these approvals amounted to 238.9 MTD against 237.2 MTD a year before.
788.8 804.5 844.7
896.5
934.4
386.3 381 376.4 363.6
347.8
600
650
700
750
800
850
900
950
1 000
2006 2007 2008 2009 2010
Direct loans
Housing savings loans
- Figures in MTD -
250
300
350
400
450
500
550
600
TREND OF THE OUTSTANDING BALANCE OF HOUSING SAVINGS LOANS AND DIRECT LOANS 2006-2010
THE ACTIVITIESOF THE BANK
THE ACTIVITIES OF THE BANK • ANNUAL REPORT 2010
PAGE 36 PAGE 37
TREND IN RELEASING OF HOUSING LOANS 2006-2010
11.4
12.4
13.5
12.3
8.8
57.2
62.0
66.1
53.7
39.5
103.4
110 1
47.7
173.4
172.7
El jadid housing loans
Housing savings loans
Direct loans
2006 2007 2008 2009 2010
- Figures in MTD -
Placement securities reached 11.9 MTD as of 31/12/2010 against 7.8 MTD a year before, a 4.1 MTD increase corresponding to an additional investment of the Bank in bonds issued by the Union internationale de Banques.
Transactions securities regressed by 10.6 MTD to 183.6 MTD at end 2010 against 194.2 MTD at end 2009; the downward trend concerned bonds equivalent to treasury bonds and short term treasury bonds respectively by 9.3 MTD and 1.3 MTD.
Investment securities went up by 12.8 MTD to 154.8 MTD as of 31/12/2010 against 142 MTD a year before; the Bank’s investment in these securities concerned exclusively risk capital funds invested in SIM SICAR in terms of exempted reinvestment.
Participation securities regressed by 87.9 MTD as of 31/12/2009 to 120.2 MTD showing a 32.3 MTD rise earmarkable to an amount of 21.7 MTD (67.2%) to the additional paying up of the Bank’s participation in the capital of TFB (former UTB).
In this heading, it should be mentioned :
The new participation of the Bank in the capital of risk investment common funds • of an amount of 1 500 thousand dinars.
The new participation of the Bank in the capital of technopoles companies set up in Gabès, • Sidi Bouzid, Jendouba and El Kef respectively for an amount of 50 thousand dinars, 100 thousand dinars, 400 thousand dinars and 400 thousand dinars.
The paying up of the subscriptions of the Bank in the capital of the companies SODINO • (+4 411.7 thousand dinars) and SODIS (+3 128.1 thousand dinars).
The paying up of subscriptions of the Bank in the capital of the companies SODEK • (+867.1 thousand dinars), SIBTEL (+376.4 thousand dinars), Interbank Service (+244.9 thousand dinars), Phenicia Seed Funds (+250 thousand dinars), and SIDCO (+394.4 thousand dinars).
On the other hand, the participation of the Bank was reduced in the capital of GRANADA Hotel (-190 thousand dinars), STIMEC (-270 thousand dinars), Assurances Salim (-562.6 thousand dinars) and Modern leasing (-483.7 thousand dinars).
Securities portfolio

THE ACTIVITIESOF THE BANK
THE ACTIVITIES OF THE BANK • ANNUAL REPORT 2010
PAGE 38 PAGE 39
Gross fixed assets totaled 117 MTD at end 2010 against 107 MTD as of 31/12/2009 corresponding to a 10 MTD increase resulting mainly from increases in the headings equipment and office furniture (+3.4 MTD) and lay out, fitting up and installations (+1.5 MTD). Amounts regarding plots of land and computer softwares went up respectively by 1 MTD and 0.6 MTD.
Fixed assets
Undue payments and matters in dispute
The overall volume of undue payments as of 31/12/2010 went up by 49.1 MTD of which 62% (+30.2 MTD) coming to claims in dispute. At a lesser extent, undue payments regarding consumer and industrial loans worsened by 10 MTD.
ASSETS QUALITY
Collection
Non performing loans
Efforts made by the Bank in 2010 in order to reduce the volume of undue payments as of 31/12/2009 helped to recover 71.1 MTD, a 29.1% rate of undue payments resumption. Recoveries on unsafe claims regarding prefinancing loans amounted to 7.3 MTD.
The works of classifying the Bank’s commitments taking into account those related to Ben Ali and Trabelsi families the amount of which comes in at 69.5 MTD show a total NPL of 550.3 MTD.
NPL portfolio related to consumer, industrial and prefinancing loans shows a volume of 473.4 MTD. Classified claims on loans to private individuals and housing loans to buyers amount respectively to 9.5 MTD and 67.4 MTD.
TREND IN UNDUE PAYMENTS 2006-2010
3.7 5.7 7.9 9.8 13
.4
51.3
54.7
55.5
55.4
60.7
36.4
38.1
49.5
51.2
61.2
150.
9
140.
0
122.
8
127.
9 158.
2
Undue payments/ personal loans
Undue payments/ housing loans
Undue payments/ consumer and industrial loans
Claims in dispute2006 2007 2008 2009 2010
- Figures in MTD -

THE ACTIVITIESOF THE BANK
THE ACTIVITIES OF THE BANK • ANNUAL REPORT 2010
PAGE 38 PAGE 39
Thus, the rate of NPL with respect to the Bank’s total commitments accounts for 10.8%, the lowest rate of public banks below the estimated 13.2% of the sector’s rate.
The trend in NPL during the last five years is illustrated in the following table:
FIGURES IN THOUSAND DINARS 31/12/2006 31/12/2007 31/12/2008 31/12/2009 31/12/2010
Class 2 38 352 34 494 101 458 72 209 49 161
Class 3 13 141 19 367 38 681 74 020 137 085
Class 4 210 384 227 752 224 803 276 396 364 041
TOTAL 261 877 281 613 364 969 422 625 550 287
FIGURES IN MTD 31-12-2006 31-12-2007 31-12-2008 31-12-2009 31-12-2010
Provisions 126.593 138.1 167.4 226.077 297.218
Provisions + Reserved charges 186.369 203.6 231.7 295.782 379.328
Provisions + Reserved charges / Classified claims
71.17% 72.28% 63.50% 70% 68.9%
As for risks coverage, the Bank pursued its provisions consolidation effort and the coverage rate comes in at 68.9%.
TREND IN CLASSIFIED CLAIMS/RISK COVERAGE RATE 2006-2010
261.
9
281.
6
365.
0
422.
6
550.
3
71.2
%
72.3
%
63.5
%
70.0
%
68.9
%
60%
65%
70%
75%
100
150
200
250
300
350
400
450
500
550
2006 2007 2008 2009 2010
- Figures in MTD -
Classified claims Coverage rate

THE ACTIVITIESOF THE BANK
THE ACTIVITIES OF THE BANK • ANNUAL REPORT 2010
PAGE 40 PAGE 41
During 2010, the Bank’s activity generated a banking net proceed of 194.6 MTD improving by 8.1 MTD (+4.4%) against 0.6 MTD decrease in 2009. All these headings participated at different degrees to this improvement; the interest margin progressed by 1.4 MTD, net commissions by 2.1 MTD and net gains on securities portfolio contributed to this improvement by 57.3% with a 4.7 MTD strengthening.
Operating charges totaled 83 MTD against 78.4 MTD a year before, up 4.6 MTD of which 2.9 MTD ascribable to staff costs; the general operating charges went up by 1.7 MTD.
Thus, Gross operating result strengthened by 5.1 MTD (+4.1%) to 128.3 MTD.
Having earmarked an additional net allocation for provisions of 28.7 MTD, the Bank registered a net result of 30.2 MTD.
BANK’S RESULTS
STATEMENT OF RESULT 2010 2009 2008 2007 2006
Interest margin 133.9 132.6 134.7 116.6 95.1
Net commissions 33.5 31.4 31.6 32.9 26.7
Net gains on securities portfolio 27.2 22.6 20.8 19.5 23.4
Net banking proceed 194.6 186.5 187.2 168.9 145.3
Banking operating other proceeds 16.7 15.1 11.0 10.4 10.7
Staff costs 62.1 59.2 52.5 49.5 46.5
General operating charges 20.9 19.2 17.8 17.0 16.3
Gross operating result 128.3 123.3 127.9 112.8 93.2
Allocations for provisions 72.8 55.6 52.1 41.4 38.8
Allocations for amortization 4.3 2.9 2.6 2.5 2.5
Allocations for provisions / Investment portfolio
10.5 -1.1 6.1 4.3 4.6
Operating result 40.7 65.8 67.07 64.6 47.4
Gains / ordinary elements 0.1 0.0 0.4 0.1 0.1
Loss / ordinary elements 0.3 0.0 0.00 0.0 0.00
Before tax result 40.6 65.8 67.4 64.7 47.4
Tax on profit 8.0 12.5 13.4 13.6 9.9
Effects of accounting modifications -2.4 0.8 0.000 0.0 -8.9
Net result of the fiscal year 30.2 53.3 53.9 51.1 28.5
At end 2010, banking intermediation activity displayed a 1.4 MTD progress showing a net margin of 133.9 MTD against 132.6 MTD a year before. Interest margin was characterized mainly by an increase in financial intermediation margin by 7.5 MTD slowered in part by margin on transactions with financial establishments of 3.5 MTD.
Interest margin
Figures in MTD
THE ACTIVITIESOF THE BANK
THE ACTIVITIES OF THE BANK • ANNUAL REPORT 2010
PAGE 40 PAGE 41
The increase in financial intermediation margin is generated by the revival in the income of operations with customers with an 8.6 MTD progress against a 5.3 MTD decrease in 2009. Moreover, related charges reversed their trend from -4.4 in 2009 to +1.2 MTD in 2010.
The drop in the margin on operations with financial establishments is also explained by the drop in proceeds by 1.6 MTD following the drop in Bank’s deposits at these establishments by 48 MTD as well as by the 1.8 MTD increase in charges resulting from the 53 MTD rise in the latter assets at the Bank.
Thanks to a much more important trend in collected commissions (+4.1 MTD) than the one of incurred commissions (+2 MTD), net commissions went up by 2.1 MTD to 33.5 MTD allowing to cover the wage bill by 53.9% vs. 53% in 2009.
Net commissions
Net gains on securities portfolio
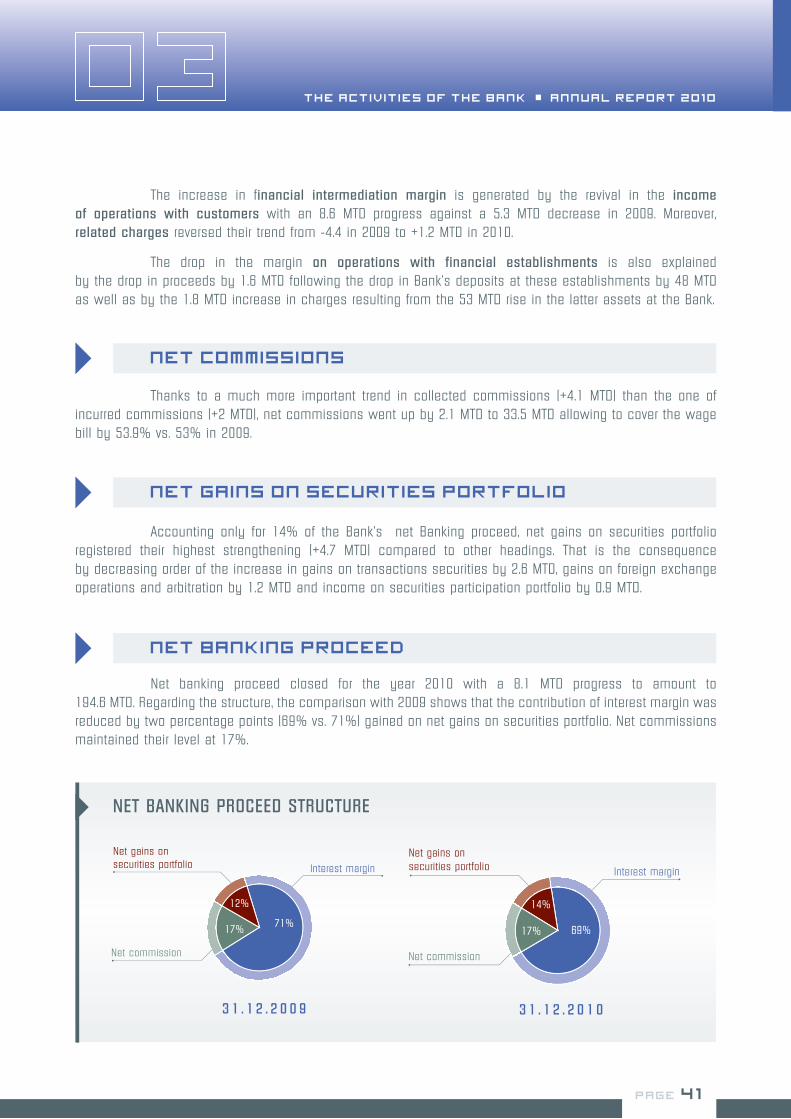
Accounting only for 14% of the Bank’s net Banking proceed, net gains on securities portfolio registered their highest strengthening (+4.7 MTD) compared to other headings. That is the consequence by decreasing order of the increase in gains on transactions securities by 2.6 MTD, gains on foreign exchange operations and arbitration by 1.2 MTD and income on securities participation portfolio by 0.9 MTD.
NET BANKING PROCEED STRUCTURE
3 1 . 1 2 . 2 0 0 9
Net commission
Interest margin
Net gains on securities portfolio
12%
71%17%
70%
Net commission
Interest margin
Net gains on securities portfolio
14%
17% 69%
3 1 . 1 2 . 2 0 1 0
Net banking proceed closed for the year 2010 with a 8.1 MTD progress to amount to 194.6 MTD. Regarding the structure, the comparison with 2009 shows that the contribution of interest margin was reduced by two percentage points (69% vs. 71%) gained on net gains on securities portfolio. Net commissions maintained their level at 17%.
Net banking proceed

THE ACTIVITIESOF THE BANK
THE ACTIVITIES OF THE BANK • ANNUAL REPORT 2010
PAGE 42 PAGE 43
2010 2009 2008 2007 2006
Net banking proceed/total loans 4.86% 5.16% 5.42% 5.5% 5.08%
Staff costs/net banking proceed 31.91% 31.74% 28.07% 29.31% 31.99%
Overheads/net banking proceed 42.63% 42.03% 37.57% 39.38% 43.18%
NBP / staff (thousand dinars) 104.9 100.5 100.5 89.7 76.4
Gross operating result
Overheads
With an 8.6 MTD improvement in net banking proceed and 1.5 MTD increase in other products of banking operating absorbed in part by the 4.6 MTD rise in overheads, the gross operating result went up by 5.1 MTD closing for the year 2010 at 128.3 MTD.
Overheads rose by 6% from 78.4 MTD in 2009 to 83 MTD at end 2010, up by 4.6 MTD vs. 8 MTD a year before. This rise is ascribable to the wage bill by 2.9 MTD (+4.9%); as for operating overheads, they rose by 1.7 MTD (+9%).
FIGURES IN MTD 2010 2009 2008 2007 2006
Net bankig proceed 194 .6 186 .5 187.2 168.9 145.3
Other operating proceeds 16.7 15.1 11.0 10.4 10.6
Staff costs 62.1 59.2 52.5 49.5 46.5
overall operating charges 20.9 19.2 17.9 17.0 16.2
Operating gross result 128.3 123.3 127.9 112.8 93.2
TREND IN NET BANKING PROCEED AND OPERATING GROSS RESULT 2006-2010
93.2
112.
8
127.
9
123.
3
128.
3
220
200
180
160
140
120
100
80
60
145.3
168.9
187.2
186.5
194.6
2006 2007 2008 2009 2010
Operatinggrossresult
Netbankingproceed
220 - Figures in MTD -
The contribution of each agent kept on improving from 100.5 thousand dinars at end 2009 to 104.9 thousand dinars at end 2010.
THE ACTIVITIESOF THE BANK
THE ACTIVITIES OF THE BANK • ANNUAL REPORT 2010
PAGE 42 PAGE 43
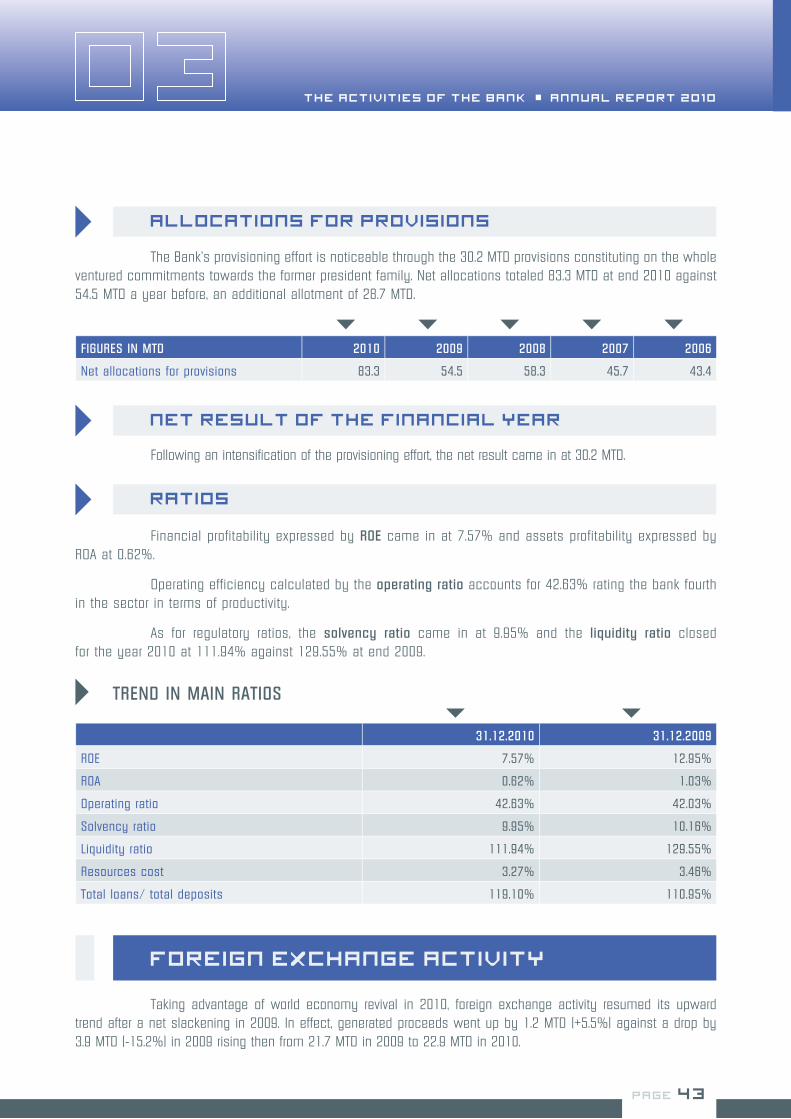
The Bank’s provisioning effort is noticeable through the 30.2 MTD provisions constituting on the whole ventured commitments towards the former president family. Net allocations totaled 83.3 MTD at end 2010 against 54.5 MTD a year before, an additional allotment of 28.7 MTD.
Allocations for provisions
FIGURES IN MTD 2010 2009 2008 2007 2006
Net allocations for provisions 83.3 54.5 58.3 45.7 43.4
Following an intensification of the provisioning effort, the net result came in at 30.2 MTD.
Net result of the financial year
Financial profitability expressed by ROE came in at 7.57% and assets profitability expressed by ROA at 0.62%.
Operating efficiency calculated by the operating ratio accounts for 42.63% rating the bank fourth in the sector in terms of productivity.
As for regulatory ratios, the solvency ratio came in at 9.95% and the liquidity ratio closed for the year 2010 at 111.94% against 129.55% at end 2009.
TREND IN MAIN RATIOS
31.12.2010 31.12.2009
ROE 7.57% 12.95%
ROA 0.62% 1.03%
Operating ratio 42.63% 42.03%
Solvency ratio 9.95% 10.16%
Liquidity ratio 111.94% 129.55%
Resources cost 3.27% 3.46%
Total loans/ total deposits 119.10% 110.95%
Ratios
Taking advantage of world economy revival in 2010, foreign exchange activity resumed its upward trend after a net slackening in 2009. In effect, generated proceeds went up by 1.2 MTD (+5.5%) against a drop by 3.9 MTD (-15.2%) in 2009 rising then from 21.7 MTD in 2009 to 22.9 MTD in 2010.
FOREIGN EXCHANGE ACTIVITY

THE ACTIVITIESOF THE BANK
THE ACTIVITIES OF THE BANK • ANNUAL REPORT 2010
PAGE 44 PAGE 45
In 2010, the dealing room made the most important progress (+0.8 MTD) feeding the total increase
in proceeds generated by foreign exchange activity by almost 70%. At a lesser extent, foreign exchange
and transfer operations showed a slight progress by 0.3 MTD to 2.6 MTD.
On the other hand, income from external trade transactions almost stabilized at 3.6 MTD.
The following table shows the trend in proceeds related to foreign exchange different activities :
FIGURES IN THOUSAND DINARS 31/12/2010 31/12/2009 Variation 12.10/12.09
Foreign exchange and transfers 2 552 2 247 305 13.6%
Transfers 1 981 1 650 331 20.1%
Payment means 572 598 - 26 -4.3%
External trade 3 574 3 609 - 35 -1.0%
Import documentary credit 2 459 1 919 540 28.2%
Import documentary remittances 264 397 - 133 -33.5%
Export documentary credits 481 750 - 269 -35.9%
Export documentary remittances 370 543 - 173 -31.9%
Dealing room in currencies 16 258 15 434 824 5.3%
Cash foreign exchange 7 561 6 902 659 9.5%
Forward foreign exchange 4 111 3 728 383 10.3%
Money market in currencies 4 586 4 804 - 218 -4.5%
Foreign exchange bureau 545 440 105 23.8%
General total 22 929 21 731 1 199 5.5%
In terms of issue, the Bank’s effort in 2010 meant the creation of 30 082 cards against 26 859
cards in 2009, up by 12%.
On the other hand, the total value of cards in circulation regressed slightly from 161 728 at end
2009 to 156 688 as of 31/12/2010 following essentially the increase in cards cancelling pace which reached
37 536 against 21 000 in 2009 and 10 000 in 2008.
Re fe r red to the ove ra l l number o f accounts , the number o f ca rds obta ins a ra te o f
coverage of 66.3 %.
MONETICS
Issue of banking cards
In spite of the decrease in cards, the overall operating volume made by BH cards holders grew
substantially compared to 2009, rising by 6% in number and 11% in amount to reach 5 217 thousand
operations for a 654 thousand dinars turnover.
Operating volume of BH cards
THE ACTIVITIESOF THE BANK
THE ACTIVITIES OF THE BANK • ANNUAL REPORT 2010
PAGE 44 PAGE 45
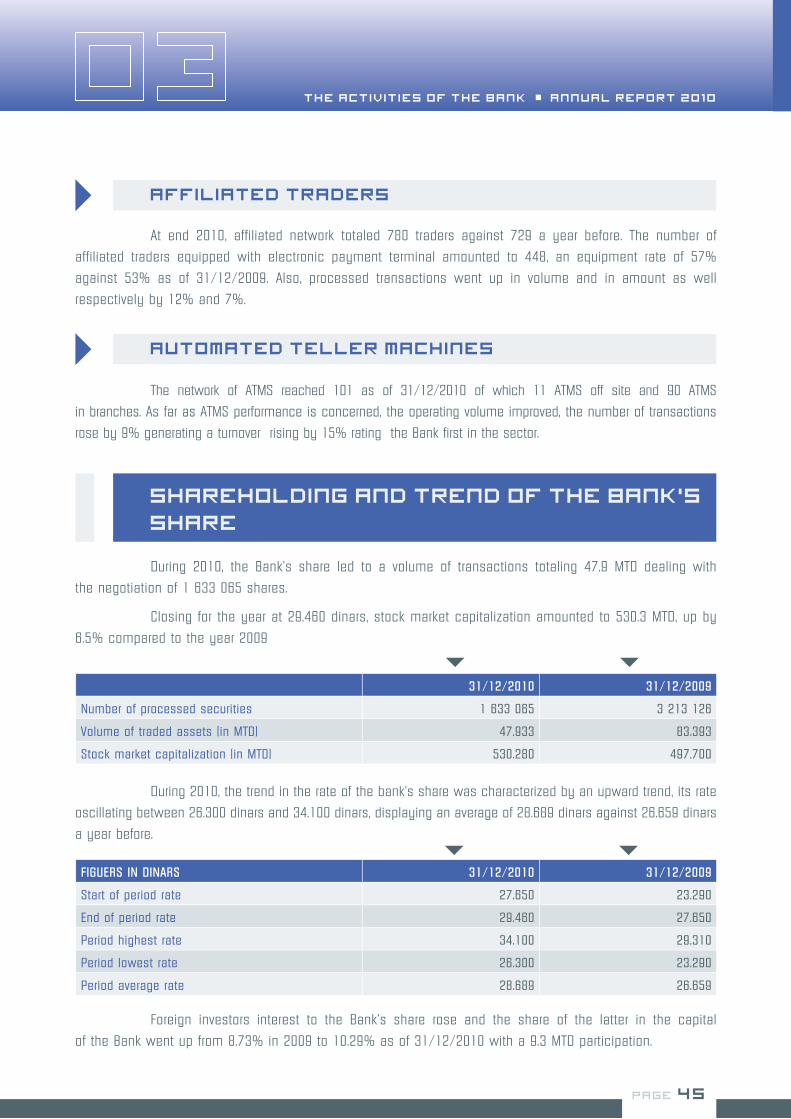
At end 2010, affiliated network totaled 780 traders against 729 a year before. The number of
affiliated traders equipped with electronic payment terminal amounted to 448, an equipment rate of 57%
against 53% as of 31/12/2009. Also, processed transactions went up in volume and in amount as well
respectively by 12% and 7%.
The network of ATMS reached 101 as of 31/12/2010 of which 11 ATMS off site and 90 ATMS
in branches. As far as ATMS performance is concerned, the operating volume improved, the number of transactions
rose by 9% generating a turnover rising by 15% rating the Bank first in the sector.
Affiliated traders
Automated Teller machines
During 2010, the Bank’s share led to a volume of transactions totaling 47.9 MTD dealing with
the negotiation of 1 633 065 shares.
Closing for the year at 29.460 dinars, stock market capitalization amounted to 530.3 MTD, up by
6.5% compared to the year 2009
SHAREHOLDING AND TREND OF THE BANK’S
SHARE
31/12/2010 31/12/2009
Number of processed securities 1 633 065 3 213 126
Volume of traded assets (in MTD) 47.933 83.393
Stock market capitalization (in MTD) 530.280 497.700
During 2010, the trend in the rate of the bank’s share was characterized by an upward trend, its rate
oscillating between 26.300 dinars and 34.100 dinars, displaying an average of 28.689 dinars against 26.659 dinars
a year before.
Foreign investors interest to the Bank’s share rose and the share of the latter in the capital
of the Bank went up from 8.73% in 2009 to 10.29% as of 31/12/2010 with a 9.3 MTD participation.
FIGUERS IN DINARS 31/12/2010 31/12/2009
Start of period rate 27.650 23.290
End of period rate 29.460 27.650
Period highest rate 34.100 29.310
Period lowest rate 26.300 23.290
Period average rate 28.689 26.659


ASSESSMENT
OF UNDERTAKEN
ACTIONS IN 2010
PAGE 47

PAGE 48
ASSESSMENT OF UNDERTAKEN ACTIONS IN 2010
ASSESSMENT OF UNDERTAKEN ACTIONS IN 2010 • ANNUAL REPORT 2010
The Banque de l’Habitat has always pursued its efforts in order to consolidate its results, improve
its services quality and reinforce its market share.
In 2010, these efforts have been materialized through a set of actions:
In the framework of extending its branches network and in order to be closer to its customers and to
ensure better services quality to its customers, the Bank opened 4 new sales points in 2010 bringing to 93
the number of sales points. These are Bizerte Erraouabi, Moulares, Korba and Northern Urban Centre in Tunis.
The Bank has also fit out 3 sales points: Charguia, Bizerte Thâalbi and Hammamet.
As for sales points transfer, they concerned Sfax Jadida, Kram and Ben Arous that are being fit out.
Finally, the Bank opened two foreign exchange bureau at Hammamet Enfidha airport.
In the second half 2010, the Bank experienced a major event namely the transfer to the new
head office in Avenue Mohamed V while maintaining the operating continuity of its services and its informatics
infrastructures.
This great achievement experienced by the site, infrastructure, functionality and modernity
of the head off ice wil l contr ibute to improve working condit ions and the qual i ty of offer ing services
and the influence of the Bank.
In the framework of diversifying and developing bank insurance products and in order to offer to
its customers a range of comprehensive and personalized product, the Bank finalized in 2010 the prerequisites
of the starting up of its new products “Dhamen Epargne retraite” (Guaranteeing retirement savings)
that is expected to be put on the market in the first quarter 2011.
COMMERCIAL DEVELOPMENT
OPENING AND TRANSFER OF SALES POINTS
BANK INSURANCE DEVELOPMENT
TRANSFER OF THE HEAD OFFICE KHEIREDDINE PACHA
TO THE NEW HEAD OFFICE IN AVENUE MOHAMED V

PAGE 49
ASSESSMENT OF UNDERTAKEN ACTIONS IN 2010
ASSESSMENT OF UNDERTAKEN ACTIONS IN 2010 • ANNUAL REPORT 2010
With the objective of getting further close to its customers, the Bank pursued in 2010
the development of d istance serv ices mainly the package mobi le banking that wi l l be put on
the market in 2011.
This new package mobile banking will help customers carry out account management through
mobile phone.
Besides communications campaigns intended to residents and Tunisians living abroad, the Bank
participated to the following actions:
Carthage 2010 exhibition.•
Creation and technological development of business exhibition 2010.•
Sitap 2010 exhibition•
Lunch-debate with property developers.•
It is a retirement savings contract in favor of the Bank’s customers wishing to constitute
an additional retirement in the form of capital or life annuity.
It should be noted that the advantages of this product focus on:
The deduction from taxable income of the subscriptions paid with respect to the contract •
in the limit of regulatory ceilings.
The capitalization of net subscriptions at the minimum guaranteed rate with a profit making •
participation calculated on the basis of Salim insurance financial results.
Exemption of management and acquisition fees during the first year of subscription.•
Development of products and services
tied to new technologies
Participation to fairs exhibitions
and advertisement campaigns

PAGE 50 PAGE 51
ASSESSMENT OF UNDERTAKEN ACTIONS IN 2010
ASSESSMENT OF UNDERTAKEN ACTIONS IN 2010 • ANNUAL REPORT 2010
In the framework of applying the circular of the Central Bank of Tunisia n°19/2006 of November
28, 2006 regarding internal control, it has been decided to create three committees during 2010 :
Security committee:• It is in charge of validating and approving the security policy of banking
operations as well as the follow up of security procedures and means to be implemented.
It sees to the integration of security concepts in the bank operating.
Risk committee:• It is in charge of ensuring that the risks generated by the activity of the
bank and its subsidiaries notably in the field of credit, market, the global rate of interests,
liquidity, settlement as well as operating risks are identified, covered and compatible with
profitability policies and objectives set by the executive board.
Risk technical committee:• It is in charge of identifying, analyzing and supervising risks
generated by the Bank activity in the field of credit, market, global rate of interests, liquidity,
settlement as well as operating risks.
During March 2010, the Bank implemented the organization chart started in 2007 through
the nomination of managers of submanagement and departments.
In order to improve the quality of its services, the Bank has :
Updated the memorandum dealing with the missions and attributions of the sales point •
director.
Implemented the position of sales point controller.•
ORGANIZATIONAL
AND PROCEDURAL ACTIONS
Organization Chart of the Bank
Creation of committees in the framework of
the setting up of an internal control system
Updating missions and attributions of sales
points.
PAGE 50 PAGE 51
ASSESSMENT OF UNDERTAKEN ACTIONS IN 2010
ASSESSMENT OF UNDERTAKEN ACTIONS IN 2010 • ANNUAL REPORT 2010
In the framework of its mission, the body of compliance control carried out the following
actions in 2010 :
Identifying the situations of non compliance thanks to collected information from reports of •
the General supervision and internal audit following missions carried out in different
departments.
Follow up of auditors recommendations related to the fiscal year 2009.•
Steering jointly with the legal department of operations of files preparation to be conveyed to •
the National authority for the protection of personal data (INPDCP) pursuant to law 2004-63
of July 27, 2004 and subsequent decrees 3003-2007 and 3004-2007.
Widening conditions of granting loans to individuals by reconsidering management rules •
and granting consumer loans to individuals.
Decentralizing the issue of mortgage release on loans to individuals specifically those related •
to loans to individuals having financed non professional needs.
Decentralizing files processing of FOPROLOS loans•
Setting up the processing of “Dhamen Finance” through the setting of intervention conditions •
of the Fund of guaranteeing exports financing prior to shipment in the collection of loans
prefinancing exports with respect to the non carrying out of exporting business production.
Compliance control
Implementing operations control
at the level of sales points

PAGE 52 PAGE 53
ASSESSMENT OF UNDERTAKEN ACTIONS IN 2010
ASSESSMENT OF UNDERTAKEN ACTIONS IN 2010 • ANNUAL REPORT 2010
Starting the setting up of 24 hours
electronic clearing
INFORMATION SYSTEM
The 24 H electronic clearing version regarding the transfer value has started since •
November 22, 2010.
The 24H electronic clearing version regarding the standing order value has started •
December 13, 2010.
The 24H electronic clearing version regarding the inter branch transfer value has started since •
December 13, 2010.
Processing and reporting on loans granting to individuals to the central Bank of Tunisia:
A procedure memorandum on the operating of loans to individuals unit through the system of
units of data exchange and its relation with the Central Bank of Tunisia has been set up.
The unit of loans to individuals processes the risks incurred by lending institutions
on private individuals.
After 4 months of centering the project, the Bank started adapting and delivering the solution.
This stage started on July 1, 2010. The achievement requires 10 months (validation delays of works
by the Bank excluded). It consists in achieving adaptations arising from the centering stage as well
as the parameters of core banking and its integration to current profession applications.
This operation was stopped in November 2010 in the framework of the former project of merging
Banque de l’Habitat with the Société Tunisienne de Banque.
Banking core
Progress report on the setting up of units
of data exchange with the Central Bank of
Tunisia

PAGE 52 PAGE 53
ASSESSMENT OF UNDERTAKEN ACTIONS IN 2010
ASSESSMENT OF UNDERTAKEN ACTIONS IN 2010 • ANNUAL REPORT 2010
HUMAN RESOURCES AND TRAINING
Concerned with better serving its customers, the Bank initiated :
The training of its sales points staff through diversified actions on many topics of banking •
practices.
The rationalization of human resources allocation at the level of sales points through •
the assignment of positions according to the sales point category. The use of resources new
employment when opening new sales points.
In the framework of applying law n°2003-75 of December 10, 2003 related to the support of
international efforts combating terrorism and money laundering, the set up of the organization memorandum
was repealed in order to ensure better actions of detecting unusual or suspicious operations.
Combating money laundering


FUTURE
PROSPECTS
PAGE 55

PAGE 56 PAGE 57
FUTUREPROSPECTS
FUTURE PROSPECTS • ANNUAL REPORT 2010
Human resources and training
The year 2011 looks like an exceptional year taking into account the economic, social and political situation: The Bank aware of its role of financing the economy is going to keep on improving its financial performance and consolidating its position in the banking sector.
Thus, the Bank is going to pursue its development through the consolidation of its core trade and the improvement of its services quality .
At the level of resources and more particularly customers resources, the Bank targets raising less costly resources.
The Bank sees to accompany its relations in developing their activities and deploy its commercial activity in cohesion with national policy financing of jobs creating projects.
Collection continues to appear amongst the Bank’s priorities taking into account its impact on its liquidity and profitability through the adoption of a sustained collection policy while being available to customers. The Bank ensures the control of the level of unproductive claims and of the compliance with regulatory ratios in terms of coverage of classified claims and NPL which remain among its priorities.
In order to secure the success of these objectives, the Bank is going to undertake actions regarding the information system , organization , human resources as well as the upgrading of infrastructure development .
Taking into account its need of commercial development and the necessity for the Bank to reinforce and upgrade its human resources, the Bank is going to undertake on 2011 a recruitment scheme and a set of training actions.
These recruitments come within the scope of national policy in the field of employment.
On the other hand, the training actions will take into consideration the new trades.
Started in 2010, some projects of acquisitions and setting up of management systems of banking trades are going to take shape in 2011 :
The management of foreign exchange operation and the dealing room•
The management of combating money laundering•
The continued development of ATMS network of the renewal off cost of equipments•
The management of human resources•
The Bank’s central computer site•
Information system and
infrastructure

PAGE 56 PAGE 57
FUTUREPROSPECTS
FUTURE PROSPECTS • ANNUAL REPORT 2010
The development of the network
Products launching
Organization
The Bank intends to reinforce its presence throughout the Tunisian territory through
the development of the network with the opening of 10 new sales points.
On the other hand and in order to position oneself in the region while ensuring better conditions
of customers welcome and service, the Bank intends to upgrade some existing sales points.
The Bank aware of improving its risks management in all its kinds, is going to buckle down to
the optimization of internal controls and working procedures while ensuring an increased reactivity to
its customers needs.
In this regard, the Bank is going to pursue its policy through the adoption of some measures
for the reinforcement of prudential ratios, the setting up and/ or optimization of tools of internal control
and risks supervision.
Through the launching of a Gold Card intended to top of the range customers and targeting
a niche of customers with adapted services to their needs. In effect, this product will have many advantages
in terms of ceilings and insurance and assistance package.
The Bank is going to keep on its strategy of diversifying products of Bank insurance to •
ensure to its customers an overall and personalized better offer.
Thus, the Bank intends to put on the market its new product “Dhamen Epargne retraite”
(ensuring retirement savings).
The Bank sticks the national strategy aiming at facilitating services access through new •
technologies with the setting up of a package of products and services helping its customers
getting a multi channel banking space using communications and technologies information.
Mobile banking service is on top of these products allowing customers to carry out account
management operations through mobile phone.


FINANCIAL
STATEMENTS
PAGE 59
PAGE 60 PAGE 61
FINANCIAL STATEMENTS
FINANCIAL STATEMENTS • ANNUAL REPORT 2010
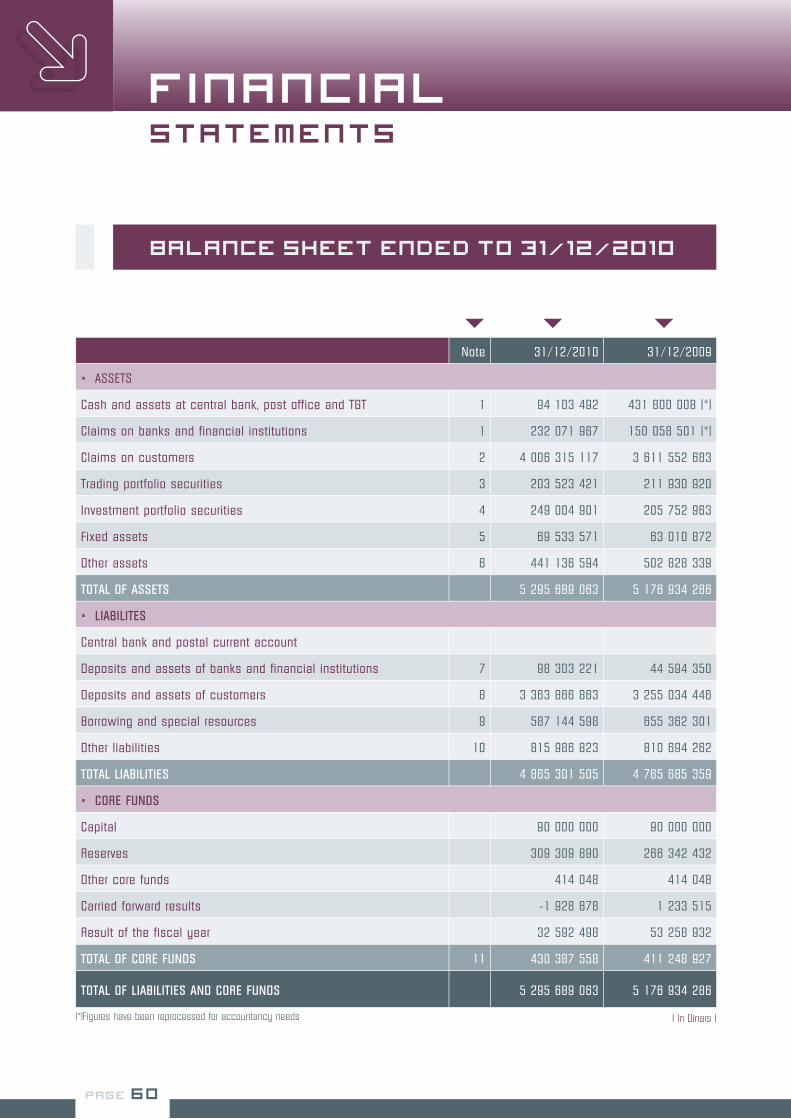
Balance Sheet Ended to 31/12/2010
Note 31/12/2010 31/12/2009
• ASSETS
Cash and assets at central bank, post office and TGT 1 94 103 492 431 800 008 (*)
Claims on banks and financial institutions 1 232 071 967 150 058 501 (*)
Claims on customers 2 4 006 315 117 3 611 552 683
Trading portfolio securities 3 203 523 421 211 930 920
Investment portfolio securities 4 249 004 901 205 752 963
Fixed assets 5 69 533 571 63 010 872
Other assets 6 441 136 594 502 828 339
TOTAL OF ASSETS 5 295 689 063 5 176 934 286
• LIABILITES
Central bank and postal current account
Deposits and assets of banks and financial institutions 7 98 303 221 44 594 350
Deposits and assets of customers 8 3 363 866 863 3 255 034 446
Borrowing and special resources 9 587 144 598 655 362 301
Other liabilities 10 815 986 823 810 694 262
TOTAL LIABILITIES 4 865 301 505 4 765 685 359
• CORE FUNDS
Capital 90 000 000 90 000 000
Reserves 309 309 890 266 342 432
Other core funds 414 048 414 048
Carried forward results -1 928 878 1 233 515
Result of the fiscal year 32 592 498 53 258 932
TOTAL OF CORE FUNDS 11 430 387 558 411 248 927
TOTAL OF LIABILITIES AND CORE FUNDS 5 295 689 063 5 176 934 286
( In Dinars )(*)Figures have been reprocessed for accountancy needs

PAGE 60 PAGE 61
FINANCIAL STATEMENTS
FINANCIAL STATEMENTS • ANNUAL REPORT 2010
CONTINGENT LIABILITIES Note 31/12/2010 31/12/2009
Guarantees and assets pledged as collateral security 12 383 687 525 349 133 418
A - Guarantees given to banks and financial institutions 51 140 530 79 421 169
B - Guarantees given to customers 332 546 995 269 712 249
Documentary credits 203 078 520 322 400 653
Assets pledged as collateral - -
TOTAL OF CONTINGENT LIABILITIES 586 766 045 671 534 071
• COMMITMENTS GIVEN
Financing commitment 12 1 281 761 958 1 353 237 768
A- Commitments given to banks and financial institutions - -
B- Commitments given to customers 1 281 761 958 1 353 237 768
Securities commitment 7 052 398 7 013 933
A- Equity participation not yet paid up 7 052 398 7 013 933
B- Securities to receive - -
TOTAL COMMITMENTS GIVEN 1 288 814 356 1 360 251 701
• COMMITMENTS RECEIVED
Financing commitment received 13 435 856 078 370 450 460
Guarantees received 14 75 105 074 66 890 876
A- Guarantees received from the state - -
B- Guarantees received from banks, financial institutions and insurance institutions
- -
C-Guarantees received from customers 75 105 074 66 890 876
( In Dinars )
Off Balance Sheet statement – Period Ended as of 31/12/2010

PAGE 62 PAGE 63
FINANCIAL STATEMENTS
FINANCIAL STATEMENTS • ANNUAL REPORT 2010
Profit and Loss Statement
(Period from January 1 to December 31, 2010)
BANKING OPERATING PROCEEDS Note 31/12/2010 31/12/2009
Interest and similar income 15 256 251 662 248 786 562
Commissions (in proceeds) 16 39 130 046 35 038 749
Gains on trading portfolio securities and financial operations 17 25 402 385 21 555 301
Investment portfolio income 18 1 829 574 1 020 594
TOTAL OF BANKING OPERATING PROCEEDS 322 613 667 306 401 206
BANKING OPERATING COSTS
Incurred interest and similar charges 19 122 312 961 116 210 660
Incurred commissions 5 673 134 3 683 850
TOTAL OF BANKING OPERATING CHARGES 127 986 095 119 894 510
NET BANKING PROCEED 194 627 572 186 506 696
Allocation for provisions and result of correction of assets on claims (off balance sheet an liabilities)
20 -72 781 808 -55 590 681
Allocation for provisions and result of correction of assets on investment portfolio
21 - 10 474 418 1 057 215
Other operating proceeds 22 16 657 379 15 131 977
Staff costs - 62 112 914 - 59 191 898
General operating charges - 20 859 228 - 19 189 012
Allocations for amortizing and privisions on fixed assets - 4 333 224 - 2 933 329
OPERATING RESULT 40 723 359 65 790 968
Balance in gain/ Loss arising from ordinary elements - 154 926 - 3 419
Corporate tax 23 7 975 935 12 528 617
RESULT OF ORDINARY ACTIVITIES 32 592 498 53 258 932
NET RESULT OF FISCAL YEAR 32 592 498 53 258 932
Effects of accounting modifications 24 - 2 371 325 774 926
RESULT AFTER ACCOUNTING MODIFICATIONS 30 221 173 54 033 858
(In Dinars)

PAGE 62 PAGE 63
FINANCIAL STATEMENTS
FINANCIAL STATEMENTS • ANNUAL REPORT 2010
Cash flow table
(Period from January 1 to December 31, 2010)
Note 31/12/2010 31/12/2009
• OPERAT ING ACT IV I T I ES
Encashed operating banking proceeds 308 427 310 283 904 578
Paid out operating banking charges - 126 611 638 - 121 910 475
Loans granted to banking and financial institutions 1 022 615 -13 677 104
Deposits/ withdrawals at other financial institutions 52 142 200 297 900
Loans and advances/ reimbursement loans and advances at customers - 483 691 151 - 230 434 313
Deposits/withdrawals of customers 106 717 414 596 486 408
Investment securities 4 000 000 5 275 020
Paid in amounts to staff and miscellaneous creditors -79 836 883 54 475 494
Encashed amounts of miscellaneous debtors 78 530 002 -135 513 982
Other cash flow arising from operating activities - 3 736 514 6 258 144
Tax on profits -12 528 617 -13 454 558
NET CASH FLOW FROM OPERATING ACTIVITIES -155 565 262 431 707 112
• INVESTMENT ACT IV I T I ES
Encashed interest and dividend on investment portfolio 1 829 574 1 020 594
Acquisitions/ sales on investment portfolio -45 055 446 -52 556 469
Acquisitions/ sales on fixed assets -10 016 880 - 9 442 083
NET CASH FLOW FROM INVESTMENT ACTIVITIES - 53 242 752 - 60 977 958
• F INANC ING ACT IV I T I ES
Issue of shares - -
Issue of borrowings -31 271 598 44 234 485
Increase/ decrease of special resources -26 010 699 7 355 214
Paid in dividends -11 700 000 -10 819 383
NET CASH FLOW FROM FINANCING ACTIVITIES - 68 982 297 40 770 316
Impact of exchange rate variations on liquidity 9 980 371 8 827 067
Net variations of liquidity and liquidity equivalent during the period - 267 809 940 420 326 537
Liquidity and liquidity equivalent at the start of the period 693 706 668 273 380 131
LIQUIDITY AND LIQUIDITY EQUIVALENT AT END OF PERIOD 25 425 896 728 693 706 668
(In Dinars)

PAGE 64 PAGE 65
FINANCIAL STATEMENTS
FINANCIAL STATEMENTS • ANNUAL REPORT 2010
REPORT ON FINANCIAL STATEMENTS
GENERAL AND SPECIAL REPORTS OF THE AUDITORS FISCAL YEAR ENDED DECEMBER 31, 2010
Dear shareholders of the Banque de l’Habitat
As auditors of the “Banque de l’Habitat - BH” and pursuant to the mission which was entrusted to us by your General Assembly, we present to you our general report on the control of the Bank’s financial statements as of December 31, 2010 as well as the special report provided for by article 29 of law n°2001 – 65 of July 10, 2001 related to lending institutions and articles 200 and 475 of the code of commercial companies.
1. We have audited the enclosed financial statements of the “Banque de l’Habitat” including the balance sheet, the statement of result, the statement of off balance sheet commitments, the statement of liquidity flows and notes containing a summary of main accounting methods and other explanatory notes regarding the fiscal year January 1, 2010 to December 31, 2010.
The enclosed financial statements covering the period January 1 to December 31, 2010 show a net total balance sheet of 5 295 689 thousand dinars and a net profit of 30 221 thousand dinars. This result is made up taking into account :
A 72 782 thousand dinar allocation for provisions and result of corrections of assets • on claims off balance sheet and assets.
A 10 474 thousand dinar allocation for provisions and result of corrections of assets • on investment portfolio.
• A 7 976 thousand dinar corporate tax.
2. The management of the Bank is responsible for the preparation and fair presentation of these financial statements pursuant to business accounting system in Tunisia and prudential regulation of the Central Bank of Tunisia. This responsibility includes the design, setting up and follow up of an internal control related to the preparation and fair presentation of financial statements that don’t include significant anomalies and don’t result from fraud or errors, as well as the determination of reasonable accounting assessments in such a case.
Responsibility of the management
GENERAL REPORT

PAGE 64 PAGE 65
FINANCIAL STATEMENTS
FINANCIAL STATEMENTS • ANNUAL REPORT 2010
4. In the framework of our audit, we considered internal control procedures applied to the Bank’s operations including those related to accounting disclosure processing and financial statements preparation.
Though this consideration, we noticed inadequacies at the level of the Bank’s internal control. These inadequacies as mentioned in our report on assessing internal control system and our report on risks evaluation and which are integral part of the current report, result mainly from an inadequacy of control procedures including accounting controls of information system and information security.
In this framework, our works were restricted by :
Inadequacies in the procedures of control and accounting justification of some accounts of • which mainly classified claims, interest collected in advance on loans to customers as well as monetics suspending accounts and some accounts that were not provisioned for risks by the Bank.
It is also the case for fixed assets accounts that have not been put together in the absence of stock taking.
3. Our responsibility is to express our opinion on these financial statements based on our audit. We have carried out our audit according to the standards of the profession applied in Tunisia as well as to the reference terms for auditing accounts subject of the note of the Central Bank of Tunisia n°93 – 23 of July 30, 1993.
These standards require that we comply with ethics rules and plan and carry out the audit to obtain a reasonable insurance that the financial statements don’t include significant anomalies.
An audit involves implementing procedures in order to get convincing features concerning the amounts and disclosures in the financial statements. The selection of procedures is matter of the auditor assessment as well as the evaluation of the risk that the financial statements contain significant anomalies arising from fraud or errors.
When assessing the risk, the auditor takes into account the internal control into force in the entity related to the preparation and fair presentation of financial statements in order to define appropriate audit procedures and not to express an opinion on the efficiency of the entity’s internal control. An audit contains also the evaluation of the appropriate character of selected accounting methods and the reasonable character of accounting assessments made by the management as well as the evaluation of the overall presentation of financial statements. We believe that the works that we have carried out in this framework constitute a reasonable basis to support our opinion.
Responsibility of auditors
Justification of the opinion
PAGE 66 PAGE 67
FINANCIAL STATEMENTS
FINANCIAL STATEMENTS • ANNUAL REPORT 2010
Moreover, and as indicated in the notes related to financial statements n°2 - 9 and 10, the accounts related to special funds and budgetary funds management should be justified and put together with debtor entities. These are the advance to SNIT for the repurchase of properties belonging to foreigners as well as the accounts tied to the convention related to the national programme of rudimentary lodgings resorption (PNRLR).
Regarding the evaluation of commitments on customers, we have noticed that some guarantee • assets have been selected by the Bank without stock taking these guarantees and without being supported by copies of corresponding registrations and recent expertise reports pursuant to the regulation into force. Thus for some customers, the Bank doesn’t have any certified financial statements and external ratings to assess the financial situation of these customers.
In the absence of information availability, the eventual impact of works of justification of these accounts as well as guarantees stock taking and the taking into account of financial data to evaluate some customers commitments or the features of the Bank’s financial statements has not been determined by our staff at the date of issue of this report.
5. The Bank enters charges related to retirement allowances only at the moment of real retirement. Thus, it is not proceeded to the recording of provisions for retirement allowances related to commitments arising from the collective agreement that provides for an allowance of six times the last salary given to the employee and which is evaluated on the basis of the linear joining method pursuant to the international standard IAS 19 “Staff benefits” at 8 821 thousand dinars.
6. Charges related to provisions for paid leave are entered only in the limit of 30 days. Thus, provisions for paid leaves are underestimated up to the number of days exceeding this limit that is for an amount of 1 677 thousand dinars.
7. The Bank was subject to a tax control during 2010 for the period 2006 to 2009. The results of this control were not made available to us and no provision for tax risk has been recorded in the Bank’s accounts.
8. In our opinion and subject to the above outlined points, the financial statements are regular and present fairly the financial situation of the Bank as well as its operations results and liquidity flows for the period ended December 31, 2010 pursuant to accounting principles generally accepted in Tunisia.
Without questioning the opinion expressed above, we draw your attention on the following :
1. As indicated in the note n°2 related to financial statements, the appreciation and evaluation of risks on the commitments of some entities showing signs of financial difficulties turn out to be at the date of issue of the current report essentially tied to discussions to be started and plans and restructuring programmes of these entities and their setting up.
Opinion
Remarks paragraph

PAGE 66 PAGE 67
FINANCIAL STATEMENTS
FINANCIAL STATEMENTS • ANNUAL REPORT 2010
2. As indicated in the note related to financial statements “Note n°11 – core funds”, the Bank proceeded during 2010 to some errors corrections. These corrections meant a decrease in core funds up to 2 371 thousand dinars recorded in opening core funds for an amount of 1 554 thousand dinars and the recording of reserved charges for an amount of 817 thousand dinars dating back to the fiscal year 2009.
The fiscal year 2009 financial statements presented on a comparative basis have not been reprocessed to take into account the mentioned above adjustments.
3. As indicated in the note related to financial statements n°26 “events subsequent to the closing date” and in the current context of social, economic and political situation in Tunisia, we draw your attention that the level of commitments granted to entities belonging to members and relatives of the family of the former president, following the perimeter set by the Central Bank of Tunisia, estimated at 231.5 MTD of which 69.5 MTD are classified as of December 31, 2010. These commitments are covered by provisions up to 30.9 MTD taking into account guarantees estimated by the Bank. Most of these entities are nowadays managed by a receiver.
We think that these events would have a possible impact on the situation of the Bank and the quality of its assets. At the date of issue of the current report, the impact on the Bank’s financial statements can’t be determined.
SPECIFIC VERIFICATIONS
4. Pursuant to the provisions of articles 201 and 266 of the code of commercial entities and excluding the elements expressed above, we have not any other comments to convey on the fairness of the financial statements that are in accordance with the accounting data contained in the report of the executive board on the management of the fiscal year 2010.
5. Applying article 3 (new) of law n°94 – 117 of November 14, 1994 as modified by law n°2005 – 96 of October 18, 2005, dealing with the reorganization of capital market, we verified internal control procedures related to accounting data processing and financial statements preparation. Through this verification we noticed inadequacies that we raised in our reports on internal control and in this current report.
6. On the other hand, and applying the provisions of article 19 of decree n° 2001 – 2728 of November 20, 2001, we proceeded to necessary verifications and we haven’t any comments to convey on the compliance of book keeping of securities issued by the entity with the regulation into force.
On behalf of Generale d’Audit et Conseil On behalf of Management Conseil Mr Chiheb GHANMI Mr Chérif BEN ZINA

PAGE 68 PAGE 69
FINANCIAL STATEMENTS
FINANCIAL STATEMENTS • ANNUAL REPORT 2010
REGULATED AGREEMENTS
Implementing provisions of articles 200 and 475 of the code of commercial companies and 29 of law n° 2001 – 65 of July 10, 2001 related to lending institutions, we bring to your attention that the Bank carried out the following operation during 2010.
Three party agreement between the ministry of equipment and habitat, the “Banque de l’Habitat” and the ministry of finance signed on May 6, 2010.
The files related to subsidies granted by the National Fund of improving habitat to private individuals or local communities are submitted, processed and granted by the departments of the ministry of equipment and habitat which are in charge of conveying the final list approved by the ministry of equipment and habitat to the Banque de l’Habitat for the setting up.
The FNAH subsidies are granted to private owners, local communities, national solidarity fund, entities or specialized institutions in the field of urban restoration and renovation (decree n° 2007 – 534).
The ceiling of the subsidy amount is limited nowadays to 1000 dinars.
The subsidy amount is released in two portions
Attached service : business center.
Signed agreements during the fiscal
year 2010
SPECIAL REPORT OF AUDITORS
Implementing provisions of article 29 of law n° 2001 – 65 of July 10, 2001 related to lending institutions and articles 200 and following and 475 of the code of commercial companies, we have the honor to bring to your attention to agreements provided for by the aforesaid articles which have been carried out or remain into force during the fiscal year 2010.
Our responsibility is to ascertain that authorization and approval procedures of these agreements have been respected and fairly entered in the financial statements.
It is not for us to look for the possible existence of such agreements or operations but to inform you, on the basis of data conveyed to us and data arising from our audit procedures, about their essential characteristics and procedures without having to express ourselves on their usefulness and validity. It is for you to assess the interest tied to the signing up of these agreements and the carrying out of these operations in order of their approval.

PAGE 68 PAGE 69
FINANCIAL STATEMENTS
FINANCIAL STATEMENTS • ANNUAL REPORT 2010
The accounts generate neither charges nor interest (debtor charges, creditor charges).
In remuneration of its management, the Bank charges 1% on subsidies releasing 2% on loans releasings and 3% on collected amounts
Pursuant to the provisions of articles 200 and 475 of the code of commercial companies and 29 of the law n° 2001-65 of July 10, 2001 related to lending institutions, we bring to your attention that the conventions signed by the Bank and the people targeted by these articles continue to produce their effects in 2010.
a) A convention signed with SIFIB (subsidiary of the bank) on raising, investing and managing the 70 MTD debenture loan issued over 7 years with 2 years of exemption at the following conditions:
• Raising: 20 KDT• Investment: 0,2 % flat on the issue amount• Management: 0,2 % on the due remaining amount
b) A convention signed with SIFIB ( a subsidiary of the Bank) for the keeping of the ledger of shareholding of the Banque de l’Habitat for an annual amount of 50 KDT (VAT not included).
c) A convention of agent has been signed between SICAV BH Placement and BH Obligataire since 1994. The commissions invoiced by the bank amount to one thousand dinars for each one of them.
d) Twelve conventions have been signed by the bank since 1998 and make available capital risk funds to SIM SICAR. These conventions still into force expect a 1.5% remuneration of the amount of managed assets to SICAR. The amount of the commission related to the fiscal year 2010 amounts to 650 KDT.
e) A guarantee convention of the bank against the risks death and disablement, partial or total of its customers before paying back loans that have been granted to them was signed with the Tunisian Company of Life Insurance and capitalisation « SALIM ». This convention provides for a profit making participation in favor of the bank of 70%. This participation amounted to 4 436 KDT in 2010.
f) The following conventions with the Tunisian State continue to produce their effects in 2010 :
01. Convention for the management of the fund promoting social housing for solaryearners (FOPROLOS)
02. Convention related to the national programme for rudimentary lodgings rersorption (PNRLR)
03. Convention for the fourth urban development project
04. Convention for the programme of cleaned plots and self construction (US-AID HG 004B).
05. Convention related to the third urban project
06. Convention of rehabilitation of EL HAFSIA
07. Convention related to the second urban development project
Agreements signed during previous fiscal
years which keep on producing effects in 2010

PAGE 70 PAGE 71
FINANCIAL STATEMENTS
FINANCIAL STATEMENTS • ANNUAL REPORT 2010
Managers remunerations are set by the Executive Board decision. Remunerations of managers are defined as follows :
Executive Board members are remunerated by directors fees determined by the Board and submitted to the General Assembly approval. In 2010, the amount of directors fees allocated to directors amounted to 68 750 TD with respect to the Bank and 9 300 TD with respect to subsidiaries
The remuneration of the Chairman and managing director was set by a decision of the Prime ministry and the ministry of finance. It is made up of:
1. Gross annual salary of 80 670 TD.
2. Benefits in kind amounting to a gross amount of 7 209 TD and including:A company car • A monthly quota of 500 litres of petrol• Telephone invoice•
The remuneration of the managing director assistant in charge of facility management was set by the Executive Board. It is made up of:
1. A gross annual salary of 29 722 TD
2. Benefits in kind amounting to a gross amount of 7 635 TD and including:
A company car•
A monthly quota of 400 litres of petrol•
3. Annual bonus of a gross amount of 12 263 TD.The managing director assistant in charge of facility management has been designatedduring May 2010.
On behalf of Generale d’Audit et Conseil On behalf of Management Conseil Mr Chiheb GHANMI Mr Chérif BEN ZINA
Duties and commitments vis A vis
managers
08. Convention for the programme of reconstructing lodgings in favor of victims of flooding (PRLSI).
09. Convention for the management of housing savings regime
10. Convention for the management of the fund to promote industrial development (FOPRODI)
11. Convention for the management of the fund to promote handicraft and small trades ( FONAPRA).
12. Convention for financing projects that are in keeping with the framework of the mechanism of the fund of cleaning up.(FODEP)
13. The convention signed with SIFIB (Subsidiary of the Bank) for raising, investing and managing the BH 2009 debenture loan issued for 100 MTD over 15 years with two years of exemption.
14. A purchase convention of a building in Lac Nord Tunis owned by Modern Leasing, a subsidiary of the Bank.

PAGE 70 PAGE 71
FINANCIAL STATEMENTS
FINANCIAL STATEMENTS • ANNUAL REPORT 2010
Notes related to financial
statements as of December 31, 2010
The Banque de l’Habitat financial statements are worked out and presented pursuant to accounting principles generally accepted in Tunisia notably the general accounting standard n°01 of December 30, 1996 and banking accounting standards (NCT 21 to 25) applicable starting January 1, 1999 and the Central Bank of Tunisia rules enacted by circular n°91-24 of December 17, 1991 as modified by circulars n° 99-04 and n°2001-12.
However, loans on special resources for which the bank incurs no risk have been deducted from special resources related to liabilities. The surplus of special resources that are not yet used is included in the heading PA5 “other liabilities” instead of the heading PA4 “borrowings and special resources” .
Presentation of the headings assets
The heading AC1 totaled as of 31/12/2010 an amount of 431 800 008 dinars which underwent a method change explained essentially by a reclassification of loans accounts at the Central Bank of Tunisia from the heading AC2 to the heading AC1 for an amount of 310 917 752 dinars. This reclassification was carried out for a better presentation of financial statements pursuant to the sector related banking accounting standard NC21.
REFERENTIAL OF FINANCIAL STATEMENTS WORKING
OUT AND PRESENTATION
(Figures are expressed in TD: Tunisian Dinars)
The Banque de l’Habitat financial statements are worked out on the basis of calculating heritage
elements at historical cost.
Rules of taking into account commitments
Commitments of the Bank are posted in off balance sheet as soon as they are taken out and transferred to balance sheet as funds are released for their face value, deducted interest included for short term loans.
Irrecoverable commitments having been the subject of a court decision followed by an insolvency minute as well as commitments having been the subject of giving up are posted in loss.
Rules of assessing commitments and determining provisions on suspicious commitments
Calculating basis

PAGE 72 PAGE 73
FINANCIAL STATEMENTS
FINANCIAL STATEMENTS • ANNUAL REPORT 2010
The classification of real estate property developers is carried out pursuant to the provisions of the circular of the Central Bank of Tunisia n°91 – 24 of December 17, 1991 based notably on the criteria of undue payments precedence to determine the class of real estate property developer and by applying the rule of contagion.
However, taking into account the specifities of the sector and real estate property developers, adaptations have been carried out on applying criteria provided for by the above mentioned circular at the following levels :
Rule of classifying by project
The selected classifying method is the project by project classifying method to determine respective classes and calculate provisions.
The real estate property developer as an overall relation is then classified with respect to the highest class among the classes of his different projects but without applying the rules of contagion for calculating the overall provision on the real estate property developer which remains calculated with respect to the class and the accepted guarantees for each project.
However, the rule contagion for calculating the provision for the real estate property developer all projects becomes applicable when the latter is subject to collective judiciary procedures such as bankruptcy, winding up arrangement, friendly arrangement or liquidation. The real estate property developer and all his projects will get through contagion the maximal class.
Projects classifying criteria
In order to apply the by project classifying method a number of criteria already provided for by the circular of the Central Bank of Tunisia 91 – 24 of December 17, 1991 have been selected while carrying out adaptations linked to the sector of real estate promotion.
In order to classify a project as suspicious, these criteria are based on the following :
Non compliance with the initially expected progress of the project•
An imbalance of the financial balance sheet of the project updated as of December 31 on • the basis of the trading situation drawn up by the department of settlements and balancing
An expertise showing the non compliance of works or their progress•
An overall financial situation of the real estate property developer in deterioration as arising • from the financial statements
The precedence of undue payments•
The details related to the precedence of undue payments used as reference for the automatic determining of classes are as follows :
Class «0» • : a project remains classified in class « o » when the delay that separates the maturity date of the prefinancing loan contract from the date of entry of financial statements doesn’t exceed 180 days (six months) before occurance of the final liquidation. This delay corresponds to the delay of the trading achievement that the Bank grants to the proprety developer. This delay is deducted starting from the maturity date of the mortgage loan contract and excluding aditional clauses .
Real estate property developers : classification criteria

PAGE 72 PAGE 73
FINANCIAL STATEMENTS
FINANCIAL STATEMENTS • ANNUAL REPORT 2010
Class «1» :• a project is classified in class « 1» when the delay of non settlement of the prefinancing loan exceeds at the date of entry of the financial statements, the 180 days but not exceeding the 270 days (between 6 and 9 months). This delay is deducted starting from the maturity date of the mortgage loan contract and excluding additional clauses.
Class «2» :• a project is classified in class «2» when the delay of non settlement of the prefinancing loan exceeds at the date of entry of the financial statements, the 270 days but not exceeding the 450 days (between 9 and 15 months). This delay is deducted starting from the date of maturity of the mortgage loan contract and excluding additional clauses.
Class «3» :• a project is classified in class «3» when the delay of non settlement of the prefinancing loan exceeds at the date of entry of the financial statements, the 450 days but not exceeding the 720 days (between 15 and 24 months). This delay is deducted starting from the date of maturity of the mortgage loan contract and excluding additional clauses.
Class «4» :• a project is classified in class «4» when the delay of non settlement of the prefinancing loan exceeds at the date of entry of the financial statements, the 720 days (beyond 2 years). This delay is deducted starting from the date of maturity of the mortgage loan contract and excluding additional clauses.
Class «5» :• a project or a property developer is classified in Class «5» when he is subject of matters in dispute and whatever the precedence of the undue payment.

PAGE 74 PAGE 75
FINANCIAL STATEMENTS
FINANCIAL STATEMENTS • ANNUAL REPORT 2010
Rules of taking into interest and commissions on commitments
Interests on commitments are entered as they are incured and are tied to adequate period by assignment.
At each accounting date, interests that are incurred and not falling due are entered in the accounts of corresponding assigned claims by the counterpart of a result account.
Interests encashed in advance are entered in the appropriate regularization accounts and are subject of assignment to the adequate periods.
Interests on loans granted by the bank and remaining undue for a period of more than 90 days are systematically reserved whether they concern non performing loans or not and this applies to industrial and consumer loans as well as housing loans.
Interests on frozen current accounts are also reserved pursuant to the circular of the Central Bank of Tunisia n° 91-24 of December 17,1991 as modified by circular n° 99-04 of March 19, 1999. Interest on prefinancing loans are reserved starting from the moment when related projects are classified.
Entering reserved interest in the result is carried out when really encashed. Interest on consolidated claims are entered in results only when they are encashed.
Entering commissions having the nature of interest into the accounts complies with the same rules as those applicable to entering interest and other commissions are entered as soon as they are achieved.
Entering securities portfolio and related income into the accounts
The bank classifies these securities into 4 categories :
• Transactions securities that are noticeable by two criteria :
- their possession short duration that has to be limited to 3 months
- the liquidity of their market
These securities include notably treasury bonds.
• Placement securities are purchased securities with the intention of possessing them during a period of more than three months except for fixed income securities that the establishment intends to keep till maturity and which comply with investment securities definition.
• Investment securities are securities that the bank has the firm intention to possess, in principle, till their maturity and for which enough means are required to materialize this intention. These securities include funds made up of tax exemption and entrusted to venture capital investment companies (SICAR) for management pursuant to a management convention.
• Participation securities include shares the durable possession of which is deemed useful to the bank’s activity allowing or not to exert a noteworthy influence, a joint control or an exclusive control on the issuing company.
Securities are posted at the purchasing price, costs and charges excluded. Participation securities selling is entered at the date of securities ownership transfer.

PAGE 74 PAGE 75
FINANCIAL STATEMENTS
FINANCIAL STATEMENTS • ANNUAL REPORT 2010
Subscribed and non paid-up participations are recorded as off balance sheet commitments for their issue value and transferred to the balance sheet at the date of discharge.
Dividends on securities obtained by the bank are taken into account in the result of the fiscal year as soon as their distribution has been officially approved.
Listed securities are reevaluated by reference to stock market rates.
Participation securities evaluation at the date of settlement is made by reference to usage value and leads to provisions constituting to cover loss in values eventually drawn and which take on a durable character.
The evaluation of unlisted securities is made by reference to the corrected mathematical value (taking into account the updated value of the heritage of the issuing company) at the most recent date.
Except for transactions securities for which gains or losses in value are directly entered in the result of the fiscal year, only losses in value on other categories of securities are subject to provisions.
Gains in values on retroceded securities in the frame-work of funds given for management are taken into account in the result of the fiscal year since they are incurred and insofar as reasonable insurance regarding their encashment exists.
Entering resources and related charges into the accounts
Received financing commitments are entered off balance sheet as they are concluded and transferred to the balance sheet as soon as drawings are effected.
Interests and commissions of exchange coverage on borrowings are posted among charges as they are incurred.
Portfolio encashment and account due for payment securities after encashment
Securities remitted by customers for encashment are posted at the level of accounts of portfolio for encashment and accounts of due for payment securities after encashment. At the date of settlement; only the balance between the portfolio for encashment and the accounts securities due for payment are entered at the level of financial statements.
Foreign exchange operations
Operations in foreign currencies are converted at the settlement accounting date at the average rate published by the Central Bank of Tunisia for each currency. Yielded foreign exchange differences with respect to conventional rates that had been used to enter these operations are posted in the accounts of foreign exchange adjustment of the balance sheet.
The bank’s foreign exchange result is made up of the result on market operations (cash and forward foreign exchange) provided by the daily reevalutaion of foreign exchange positions pursuant to the application of the foreign exchange rate of the end of the working day.
Others
Carried forward charges are entered among other assets insofar as they have a positive impact on subsequent fiscal years. They are resorbed over three years on the basis of the study having justified their posting in the assets.
N.B : Details of explanatory notes related to financial statements are available at the level of auditors
special and general reports on the official websites of the financial market council and Tunisia stock market.


PAGE 77
MANAGEMENT
REPORT OF
THE GROUP BANQUE
DE L’HABITAT
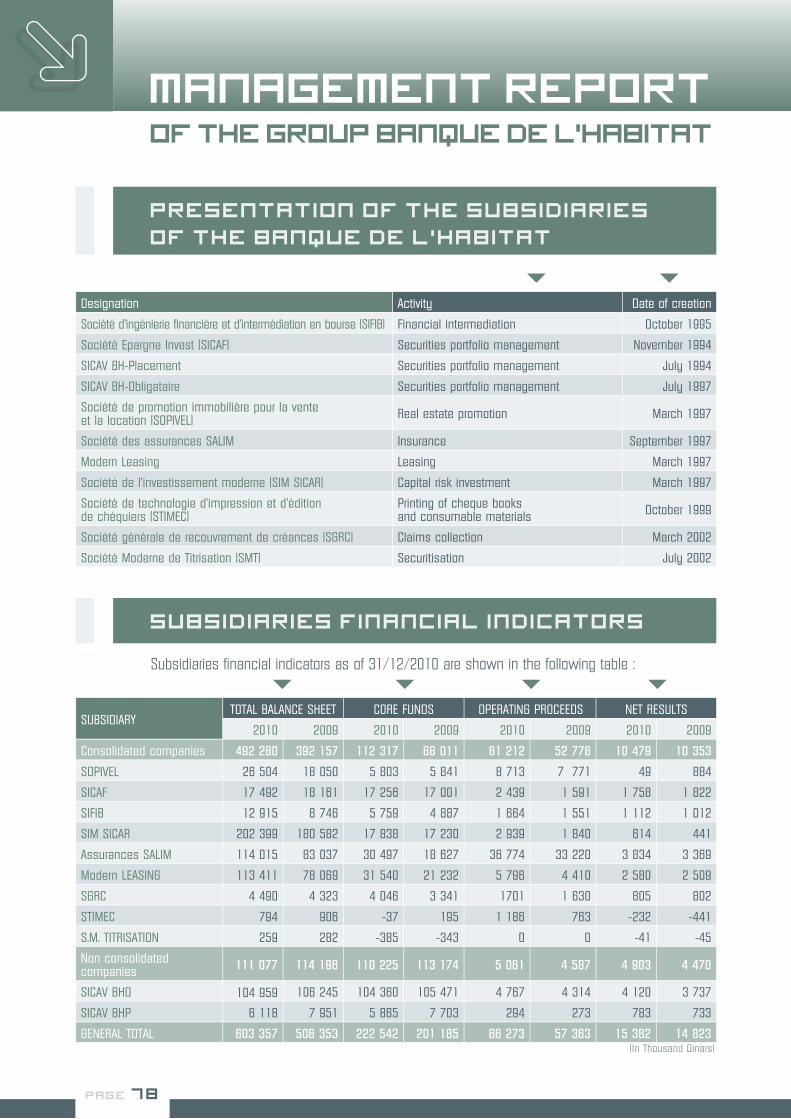
PAGE 78 PAGE 79
MANAGEMENT REPORT OF THE GROUP BANQUE DE L’HABITAT
MANAGEMENT REPORT OF THE GROUP BANQUE DE L’HABITAT • ANNUAL REPORT 2010
Presentation of the subsidiaries
of the Banque de l’Habitat
Designation Activity Date of creation
Société d’ingénierie financière et d’intermédiation en bourse (SIFIB) Financial intermediation October 1995
Société Epargne Invest (SICAF) Securities portfolio management November 1994
SICAV BH-Placement Securities portfolio management July 1994
SICAV BH-Obligataire Securities portfolio management July 1997
Société de promotion immobilière pour la venteet la location (SOPIVEL) Real estate promotion March 1997
Société des assurances SALIM Insurance September 1997
Modern Leasing Leasing March 1997
Société de l’investissement moderne (SIM SICAR) Capital risk investment March 1997
Société de technologie d’impression et d’éditionde chéquiers (STIMEC)
Printing of cheque booksand consumable materials October 1999
Société générale de recouvrement de créances (SGRC) Claims collection March 2002
Société Moderne de Titrisation (SMT) Securitisation July 2002
SUBSIDIARYTOTAL BALANCE SHEET CORE FUNDS OPERATING PROCEEDS NET RESULTS
2010 2009 2010 2009 2010 2009 2010 2009
Consolidated companies 492 280 392 157 112 317 88 011 61 212 52 776 10 479 10 353
SOPIVEL 26 504 18 050 5 803 5 841 8 713 7 771 49 884
SICAF 17 492 18 161 17 256 17 001 2 439 1 591 1 758 1 822
SIFIB 12 915 8 746 5 759 4 887 1 664 1 551 1 112 1 012
SIM SICAR 202 399 180 582 17 838 17 230 2 939 1 840 614 441
Assurances SALIM 114 015 83 037 30 497 18 627 36 774 33 220 3 834 3 369
Modern LEASING 113 411 78 069 31 540 21 232 5 796 4 410 2 580 2 509
SGRC 4 490 4 323 4 046 3 341 1701 1 630 805 802
STIMEC 794 906 -37 195 1 186 763 -232 -441
S.M. TITRISATION 259 282 -385 -343 0 0 -41 -45
Non consolidated companies 111 077 114 196 110 225 113 174 5 061 4 587 4 903 4 470
SICAV BHO 104 959 106 245 104 360 105 471 4 767 4 314 4 120 3 737
SICAV BHP 6 118 7 951 5 865 7 703 294 273 783 733
GENERAL TOTAL 603 357 506 353 222 542 201 185 66 273 57 363 15 382 14 823
Subsidiaries financial indicators as of 31/12/2010 are shown in the following table :
Subsidiaries financial indicators
(In Thousand Dinars)

PAGE 78 PAGE 79
MANAGEMENT REPORT OF THE GROUP BANQUE DE L’HABITAT
MANAGEMENT REPORT OF THE GROUP BANQUE DE L’HABITAT • ANNUAL REPORT 2010
The activity of the subsidiaries of the Banque de l’Habitat in 2010 was characterised by a remarkable trend of all financial indicators, thus :
The turnover of all subsidiaries in the consolidated perimeter progressed from 52 776 thousand dinars in 2009 to 61 212 thousand dinars in 2010, up by 16%.
Core funds registered a net improvement moving from 88 011 thousand dinars in 2009 to 112 317 thousand dinars in 2010, up by 27.6%
Net results registered a slight increase progressing from 10 353 thousand dinars at end 2009 to 10 479 thousand dinars at end 2010.
For consolidated companies
In spite of the decrease in the remuneration rate of claims securities and monetary placement, the Bank’s non consolidated companies (SICAV BHO and SICAV BHP) benefited from stock market revival and registered the following results :
Net managed assets of 110 225 thousand dinars in 2010 against 113 174 thousand dinars in 2009 down by 3% due to the drop in the number of parts making up the capital of two SICAVs
Turnover trend that reached 5 061 thousand dinars in 2010 against 4 587 thousand dinars in 2009, up by more than 10%.
Decrease in distributable sums regressing from 4 529 thousand dinars in 2009 to 4 217 thousand dinars in 2010, down by 7%.
For non consolidated companies
Main established facts by subsidiary
Consolidated companies
ASSURANCES SALIM
Backed by the success of its introduction on the stock market, the SALIM Assurances company pursued its progressing steadily as shown by the following indicators:
The net result went up by 20.4% from 3.4 MTD in 2009 to 3.8 MTD in 2010
The overall turnover went up by 10.7% reaching 36 774 thousand dinars against 33 320 thousand dinars in 2009.
- The life insurance turnover amounted to 17 856 thousand dinars in 2010 against 15 624 thousand dinars in 2009, up by 14.28%.
- The non life insurance turnover amounts to 18 918 thousand dinars in 2010 against 17 595 thousand dinars in 2009, up by 7.52%.

PAGE 80 PAGE 81
MANAGEMENT REPORT OF THE GROUP BANQUE DE L’HABITAT
MANAGEMENT REPORT OF THE GROUP BANQUE DE L’HABITAT • ANNUAL REPORT 2010
These results reinforce the subsidiary’s position in the sector. The Company’s future is promising after its introduction on the stock market which will help it start a new level of evolution.
MODERN LEASING
For this company the fiscal year 2010 was essentially marked by :
The achievement of excellent performance in spite of less favorable context affected by increased competition at the level of leasing sector. This performance is summarized in the following:
A production level equal to 72.6 MTD exceeding by 21% the 2010 objectives set at 60 MTD. Thus • modern leasing:
- Approved 1 848 financing demands for a 117 MTD package concerning all sectors of the economy against 1 298 financing demands and 65.3 MTD approvals as of 31/12/2009, up 179%
- Made funds available for an amount of 72.6 MTD against 48.3 MTD in 2009, a 150% improvement. This gave rise to leasing gross income of 8.49 MTD vs. 6.58 MTD as of 31/12/2009.
Leasing net income going up by 27.47% accounting for a gross yield rate of the outstanding balance • of 9.24% against 10.36% as of 31/12/2009. This decrease is due mainly to the decrease in applied rates.
Net financial proceeds rose from 89 thousand dinars as of 31/12/2009 to 104 thousand dinars as of • 31/12/2010, up 15.86%.
A net result reaching 2 580 thousand dinars during 2010 against 2 509 thousand dinars during • the previous fiscal year.
A closing of the stock market introduction operation with a demand equal to 23 times the offer. This operation was carried out through an increase of the capital of the company by 5 MTD, the issue of one million new shares amounting to 5 TD face value at the price of 8.5 TD each.
Improvement of assets quality: in effect the rate of NPL regressed from 9.26% at end 2009 to 5.40% end 2010 against a 7% forecasting level.
Reinforcing customers proximity and continuing network spreading with the opening of two branches in Sfax and Sousse.
SICAF EPARGNE INVEST
Taking profit of stock market revival where the reference index Tunindex went up by more than 19%, the SICAF Epargne Invest resumed registering good results exceeding the 2009 management indicators. Thus the fiscal year 2009 was marked by:
Achieving a gain in value in securities selling for 1 870 493 dinars against 812 958 dinars in the previous year up by more than 130% thanks to securities portfolio targeted and steady turnover. Consequently, the turnover rose from 1 591 502 TD as of 31/12/2009 to 2 438 899 TD as of 31/12/2010, up by 53%.

PAGE 80 PAGE 81
MANAGEMENT REPORT OF THE GROUP BANQUE DE L’HABITAT
MANAGEMENT REPORT OF THE GROUP BANQUE DE L’HABITAT • ANNUAL REPORT 2010
A net profit of 1 758 thousand dinars against a net result of 1 822 thousand dinars as of 31/12/2009, a slight decrease of 3.5% due mainly to the increase in provisions for listed securities depreciations. These provisions which rose by 986 thousand dinars in 2009 amount to 304 thousand dinars as of 31/12/2010.
Core funds totaled 17 256 thousand dinars at the end of the fiscal year against 17 001 thousand dinars a year before, up 1.5%.
The company’s VCN appreciation by 1.5% compared to the previous year and 15% with respect to the face value (It is higher than the face value by 1.504 dinars (VCN 2010= 11.504 TD - VCN 2009= 11.334 TD - VN = 10 TD).
SIM SICAR
SIM SICAR registered good results in 2010 :
A net result as of 31/12/2010 amounting to 614 thousand dinars against 441 thousand dinars as of 31/12/2009, up by almost 40%. This is the best performance of the group in terms of net result progress.
Operating proceeds coming in at 2 939 thousand dinars against 1 840 thousand dinars as of 31/12/2009 up 1098 thousand dinars (59.7%) explained mainly by the improvement in management commissions (138 thousand dinars), recovery of provisions (541 thousand dinars), retrocession proceeds (235 thousand dinars) and net gains in value on the sale of shares on stock market (110 thousand dinars).
The decrease with respect to forecasting result is due to constituted provisions on the participation FARHAT RESORT.
SIFIB BH
In 2010 SIFIB BH activity was characterized by :
The success of the introduction on the stock market through public subscription of two companies of the group Banque de l’Habitat namely Salim Assurances and the company Modern Leasing.
The carrying out of a volume of transactions on the main market of 160.5 MTD against 120.6 MTD in 2009, up 33%. This trend is close to the market one.
The regress of the volume of off list market by 47% from 7.24 MTD to 4.9 MTD.
The transfer to the new head office situated in the northern urban centre in the building of Assurances Salim likely to increase the company’s influence.
PAGE 82 PAGE 83
MANAGEMENT REPORT OF THE GROUP BANQUE DE L’HABITAT
MANAGEMENT REPORT OF THE GROUP BANQUE DE L’HABITAT • ANNUAL REPORT 2010
The SIFIB BH took profit of financial market revival and the ensuing stock market increase to register an important performance at the level of its management indicators, thus :
Operating income rose by 7% to 1664 thousand dinars against 1 551 thousand dinars in 2009.•
Net result amounted to 1 112 thousand dinars against 1 012 thousand dinars a year before, up by • 8.12%.
Core funds totaled 5 759 thousand dinars at the end of the year against 4 887 thousand dinars • a year before, up 18%.
Appreciation of the company VCN by 18% compared to 2009 and by 92% compared to face value • (VCN 2010=191.964 TD - VCN 2009 =162.889 TD- VN =100 TD).
SOPIVEL
For SOPIVEL the year 2010 was follows :
In terms of results :
SOPIVEL turnover regressed from 2 665 thousand dinars in 2009 to 324 thousand dinars as of 31/12/2010, down by almost 88%. This is explained by :
The non completion of a project of constructing an industrial building in the industrial zone in Zriba • and consequently the 4 MTD turnover has not been entered.
The non completion of a project of constructing in Sousse a building intended to hold offices and its • foundations have been changed to deep foundations.
SOPIVEL operating proceeds rose from 7 771 thousand dinars in 2009 to 8 713 thousand dinars in 2010 due to the variation of finished products stocks and outstanding of 3 748 thousand dinars
SOPIVEL registered an operating result of 676 thousand dinars, down by 51% compared to the 1 396 thousand dinars as of 31/12/2009.
Consequently, this subsidiary registered a net result of 50 thousand dinars against 884 thousand dinars a year before.
In terms of activity :
A completion of the project of building the new premises of the faculty of economic sciences and management in El Mourouj which became Tunis Business School.
The pursuit of the trading of residence El Hnaya in Bardo.
Getting the authorization of building residential area in El Mrezgua in the governorate of Nabeul.
Preparation of studies related to projects in Manouba, Sfax, El Mghira, lac and jardins de Carthage.
Resuming a project carried out by SPRIC in Daouer Hicher.
Starting the works related to the construction of a building intend to hold offices in Sousse.
SOPIVEL outlook apart from this year context is promising and inclines to consider its introduction on the stock market to provide it with a new dimension in the real estate sector in accordance with the Bank expectations.
PAGE 82 PAGE 83
MANAGEMENT REPORT OF THE GROUP BANQUE DE L’HABITAT
MANAGEMENT REPORT OF THE GROUP BANQUE DE L’HABITAT • ANNUAL REPORT 2010
SGRC
The SGRC registered a consolidation of its net result rising from 802 thousand dinars as of 31/12/2009 to 805 thousand dinars as of 31/12/2010.
Also, this company’s turnover went up by 4% from 1 630 thousand dinars at the end of 2009 to 1 701 thousand dinars as of 31/12/2010.
The proceeds of the company arise mainly from collection for own account.
It should be noted that during 2010 no claim acquisition from the Bank has been carried out.
The p lu ra l i ty o f acqu i red f i les as o f 31/12/2009 amounts to 278 f i les fo r a face va lue of 126 586 thousand dinars for an acquisition cost of 3 209 thousand dinars.
The company collected during 2010 the amount of 1 505 thousand dinars with respect to claims face value sold by the Bank against 1 472 thousand dinars in the previous year, up by 2.25%.
STIMEC
STIMEC main facts during this fiscal year are the following:
Core funds were down by 119% from 195 thousand dinars in 2009 to -37 thousand dinars in 2010.
Turnover rose by 55% from 763 thousand dinars in 2009 to 1 186 thousand dinars in 2010 which are encouraging signs for this company.
Consequently the net result improved by 40% but showing still a deficit -232 thousand dinars in 2010 against -441 thousand dinars in 2009.
SM TITRISATION & BM TECHNOLOGIES
The net result of SM TITRATISATION the output which is nowadays reduced remained statutory with a deficit of 42 thousand dinars against -45 thousand dinars of 31/12/2009.
For BM Technologies the year 2009 was characterized by the completion of its liquidation decided by the ordinary general assembly on February 21, 2008.

PAGE 84 PAGE 85
MANAGEMENT REPORT OF THE GROUP BANQUE DE L’HABITAT
MANAGEMENT REPORT OF THE GROUP BANQUE DE L’HABITAT • ANNUAL REPORT 2010
SICAV BHO
During 2010, the activity of SICAV BHO was marked mainly by the improvement in the positioning of SICAV BHO in terms of yield compared to its peers. In effect, out of 26 open end investment companies in Tunis, BHO is ranked 6th while it was 15th a year before. This performance is due notably to :
Developing the assets of SICAV following the close collaboration of the manager and the Bank’s network which made an effort of heightening the customers awareness.
A better display of liquidities arising from the reimbursements of various raised securities.
A judicious choice of subscriptions to placements in the form of debenture loans.
A better flexibility of placements open at the Bank through preferential rates with the possibility of making available placed funds in case of repurchase by the shareholders which boosted the portfolio yield.
SICAV BHO performance is summarized as follows:
Net assets amounting to 104 359 890 dinars at end 2010 against 105 471 437 dinars as of 31/12/2009, a slight 1% decrease due to the decrease in the number of parts making up the capital of SICAV BHO.
The selling off value of SICAV BHO came in at 102.673 TD as of 31/12/2010 following distribution of dividends with respect to 2009 amounting to 4.088 TD with a yield rate of 3.79% against 3.94% as of 31/12/2009. This drop is due essentially to the decrease in interest rates.
Placement net income rose by 10.5% from 4 314 101 TD as of 31/12/2009 to 4 766 680 TD as of 31/12/2010.
For open end investment companies which were not selected for consolidation, the fiscal year
2010 was marked by an important increase of 48% of the reference index Tunindex. This euphoria
on the stock market arises from a surplus of liquidity emanating from the private sectur following
the decrease in trade transactions and the drop in investments arising from the slowdown of the economy.
This led the Central Bank of Tunisia to reduce its key rate and money market rate which gave rise
to a reorientation of savings to the financial market becoming thus more remunerating
than monetary placements.
Thus, Tunidex had a positive effect on the appreciation of the rates of most listed securities
and consequently stock market capitalization, rose by 47% from 8 301 MTD in 2009 to 12 221 MTD 2010.
Non consolidated companies

PAGE 84 PAGE 85
MANAGEMENT REPORT OF THE GROUP BANQUE DE L’HABITAT
MANAGEMENT REPORT OF THE GROUP BANQUE DE L’HABITAT • ANNUAL REPORT 2010
SICAV BHP
During 2010, the activity of SICAV BHP was marked by :
The dynamic and targeted rotation of SICAV BHP portfolio allowing thus the encashment of maximum dividends without affecting the yield of the selling off value.
The new display of liquidities arising from dividends and selling of shares of securities portfolio.
The participation to different introductions on stock market SALIM, Carthage Cement, Ennakel Auto, Modern Leasing.
Out of 17 mixed OPCVM, SICAV BHP maintained its positioning in term of the yield of the selling off value ranking 7th.
SICAV BHP performance at the end of 2010 is as follows :
The selling off value of SICAV BHP went up slightly by 4% rising from 49.430 dinars as of 31/12/2009 to 51.583 dinars as of 31/12/2010 following dividend distribution of 2.116 TD with respect to 2009 fiscal year providing thus a net yield rate of 8.64%. This trend is due to the appreciation of the stock market price of most listed companies.
The company net assets went down by 24% from 7 702 967 TD as of 31/12/2009 to 5 865 043 TD as of 31/12/2010 due essentially to the decrease in the number of parts making up the capital of SICAV BHP which regressed from 155 835 parts as of 31/12/2009 to 113 702 parts as of 31/12/2010.
Placement total income went up by 8% from 272 971 TD as of 31/12/2009 to 293 655 TD as of 31/12/2010.
Operating result amounts to 237 034 TD against 235 890 dinars as of 31/12/2009.
Distributable sums amount to 228 666 TD against 329 876 TD during the same period in 2009, down by 31% due to the decrease in monetary placements income by 61% and the increase in other charges by 51.83%.
Taking into account the performance of 2010, the dividend by share will register a 5% slowdown and amount to 2.012 dinars against 2.116 dinars during the previous year.
The operating result rose by 10.22% to 4 149 776 TD against 3 764 933 dinars as of 31/12/2009.
Distributable amounts reached 3 987 815 TD against 4 199 272 TD in 2009, down by 5% due to the downward trend of rates.
Dividend by share should be 3.915 dinars by share against 4.088 dinars by share a year before, regressing by 4% due to the decrease in the interest rate of different issues and monetary placements.


CONSOLIDATED
FINANCIAL
STATEMENTS
PAGE 87

PAGE 88 PAGE 89
CONSOLIDATEDFINANCIAL STATEMENTS
CONSOLIDATED FINANCIAL STATEMENTS • ANNUAL REPORT 2010
Consolidated Balance
Sheet as of 31/12/2010
(Unité : en Dinars)
NOTE 31/12/2010 31/12/2009
ASSETS
Cash and balances at central bank, post office and TGT 94 105 478 431 802 531(*)
Claims on banks and financial institutions 159 277 763 68 760 264(*)
Claims on customers 1 3 998 259 023 3 608 780 290
Trading portfolio 2 277 902 038 290 612 354
Investment portfolio 197 339 331 166 546 486
Equity consolidated securities 46 297 353 17 890 488(*)
Other investment securities 151 041 978 148 655 998
Fixed assets 154 695 172 167 285 969
Other assets 569 928 127 576 603 734
TOTAL OF ASSETS 5 451 506 932 5 310 391 628
LIABILITIES
Central bank of Tunisia, CCP
Deposits and assets of banks and financial institutions 98 303 221 44 289 948
Customers assets and deposits 3 337 910 664 3 247 890 442
Borrowing and special ressources 832 406 348 688 867 703
Other liabilities 684 231 546 879 526 564
TOTAL LIABILITIES 4 952 851 779 4 860 574 657
CORE FUNDS
Capital 89 766 000 87 426 000
Consolidated reserves 4 312 871 478 275 440 627
Consolidated result 5 40 630 803 55 452 733(*)
Minority interests 3 55 386 872 31 497 611
TOTAL OF CORE FUNDS 498 655 153 449 816 971
TOTAL OF LIABILITIES AND CORE FUNDS 5 451 506 932 5 310 391 628
(In Dinars)(*)Figures have been reprocessed for accountancy needs

PAGE 88 PAGE 89
CONSOLIDATEDFINANCIAL STATEMENTS
CONSOLIDATED FINANCIAL STATEMENTS • ANNUAL REPORT 2010
CONTINGENT LIABILITIES 31/12/2010 31/12/2009
Guarantees and assets pledged as collateral security 359 836 280 362 950 173
A - Guarantees given to banks and financial institutions 51 140 530 79 421 169
B - Guarantees given to customers 308 695 750 283 529 004
Documentary credits 203 078 520 322 400 653
Assets pledged as collateral - -
TOTAL OF CONTINGENT LIABILITIES 562 914 800 685 350 826
COMMITMENTS GIVEN
Financing commitment given 1 281 761 959 1 373 929 555
A - Commitments given to banks and financial institutions - -
B - Commitments given to customers 1 281 761 959 1 373 929 555
Securities commitment 7 052 398 7 013 933
A - Equity participation not yet paid up 7 052 398 7 013 933
B - Securities to receive - -
TOTAL OF GIVEN COMMITMENT 1 288 814 357 1 380 943 488
COMMITMENTS RECEIVED
Financing commitment received 435 856 078 370 450 460
Guarantees received 75 105 074 66 890 876
A - Guarantees received from the state - -
B - Guarantees received from banks, financial institutions and insurance institutions
- -
C - Guarantees received from customers 75 105 074 66 890 876
Statement of Consolidated Off-Balance
Sheet Commitments as of 31/12/2010
(In Dinars)

PAGE 90 PAGE 91
CONSOLIDATEDFINANCIAL STATEMENTS
CONSOLIDATED FINANCIAL STATEMENTS • ANNUAL REPORT 2010
Consolidated Profit and loss
statement (Period 01-01 as of 31-12-2010)
BANKING OPERATING PROCEEDS NOTE 31/12/2010 31/12/2009
Interest and similar income 255 108 782 247 400 251
Commissions (in proceeds) 43 667 857 40 414 823
Gains and loss/ Profits from trading portfolio and financing operations 26 828 505 22 781 314
Income from investment portfolio 1 099 046 1 916 984
TOTAL OF BANKING OPERATING PROCEEDS 326 704 190 312 513 372
BANKING OPERATING COSTS
Incurred interest and similar charges 122 197 097 116 863 042
Incurred commissions 6 598 338 3 757 138
TOTAL OF BANKING OPERATING COSTS 128 795 435 120 620 180
NET BANKING PROCEEDS 197 908 755 191 893 192
Allocation for provisions and result of correction of assets on claims (off balance sheet and liabilities)
-76 613 554 -58 796 121
Allocation for provisions and result of correction of assets on investement portfolio
-964 598 2 477 904
Other operating proceeds 66 244 905 55 433 257
Staff costs -65 980 814 -61 348 570
General operating costs -69 792 995 -52 236 239
Allocation for amortization and result of corrections of fixed assets -5 403 096 -3 831 627
OPERATING RESULT 45 398 603 73 591 796
Profits/losses from ordinary items 1 905 152 2 871 885
Participation in results of companies under equity method 5 -180 126 -106 979(*)
Goodwill 5 1 224 504 -1 355 025(*)
Corporate tax -1 808 749 -14 412 922
Minority share 3 -5 908 581 -5 136 022
Result of ordinary activities 40 630 803 55 452 733
FINANCIAL YEAR NET RESULT 5 40 630 803 55 452 733(*)
Accounting modifications effects 7 -2 371 325 752 763
RESULTS AFTER ACCOUNTING MODIFICATIONS 38 259 478 56 205 496
(In Dinars)(*)Figures have been reprocessed for accountancy needs

PAGE 90 PAGE 91
CONSOLIDATEDFINANCIAL STATEMENTS
CONSOLIDATED FINANCIAL STATEMENTS • ANNUAL REPORT 2010
31/12/2010 31/12/2009
OPERATING ACTIVITIES
Encashed operating banking proceeds 318 988 565 304 869 521
Paid out operating banking charges -127 270 858 -122 283 886
Loans granted to banking and financial institutions -1 022 615 -13 677 104
Deposits/ withdrawals at other financial institutions -51 884 463 297 900
Loans and advances/ reimbursement loans and advances from customers -460 819 118 -214 218 617
Deposits/withdrawals of customers 87 860 689 619 464 612
Investment securities 13 618 179 10 741 803
Paid in amounts to staff and miscellaneous creditors -75 526 601 -258 651 905
Encashed amounts of miscellaneous debtors -64 648 334 238 791 955
Other cash flow arising from operating activities 36 730 002 4 010 205
Tax on profits -1 808 749 -14 412 922
NET CASH FLOW FROM OPERATING ACTIVITIES -325 783 303 554 931 562
INVESTMENT ACTIVITIES
Encashed interest and dividend on investment portfolio 1 099 046 1 916 984
Acquisitions/ sales on investment portfolio -32 000 766 -85 803 216
Acquisitions/ sales on fixed assets 8 918 230 -97 312 669
NET CASH FLOW FROM INVESTMENT ACTIVITIES -347 766 793 373 732 661
FINANCING ACTIVITY
Issue of shares - -
Issue of borrowings and special resources 143 799 395 49 844 787
Paid in dividends -11 572 743 -10 672 743
NET CASH FLOW FROM FINANCING ACTIVITIES -215 540 141 412 904 705
Impact of exchange rate variations on liquidity 10 335 404 8 725 412
Net variations of liquidity and liquidity equivalent during the period -205 204 737 421 630 117
Liquidity and liquidity equivalent at the start of the period 760 416 794 338 786 677
LIQUIDITY AND LIQUIDITY EQUIVALENT AT END OF PERIOD 555 212 057 760 416 794
CONSOLIDATED CASH FLOW TABLE(Period 01-01 as of 31/12/2010)
(In Dinars)
PAGE 92 PAGE 93
CONSOLIDATEDFINANCIAL STATEMENTS
CONSOLIDATED FINANCIAL STATEMENTS • ANNUAL REPORT 2010
Responsability of the management
Responsibility of the auditors
2. The Bank’s management is responsible for the working out and the fair presentation of these financial statements pursuant to the accounting system of companies in Tunisia and the prudential regulation of the Central Bank of Tunisia. This responsibility includes the design, setting up and the follow up of an internal control related to the working out and fair presentation of consolidated financial statements that are free of material misstatements due to fraud or errors as well as determining reasonable accounting estimates in such circumstance.
3. Our responsibility is to express an opinion on these consolidated financial statements based on our audit. We have carried out our audit according to audit standards that are applied in Tunisia and in pursuance of reference terms for auditing accounts subject of the note of the Central Bank of Tunisia n°93-23 of July 30, 1993. These standards require that we comply with rules of ethics and plan and carry out the audit to obtain a reasonable guarantee that the consolidated financial statements are free of material misstatements.
An audit implies the setting up of procedures in order to collect audit evidence about the conveyed amounts and disclosures in the financial statements. The selection of procedures is our responsibility as well as the risk assessment that the financial statements are free of material misstatements whether due to fraud or errors.
Auditors report on consolidated financial statements Fiscal year ended December 31, 2010
Dear shareholders of the Banque de l’Habitat,
As auditors of « the Banque de l’Habitat –BH » and in carrying out the mission entrusted to us by your General Assembly, we present to you our report on the consolidated financial statements of the group « BH » made up as of December 31, 2010.
Report on financial statements
1. We have audited the enclosed consolidated financial statements of the group « Banque de l’Habitat » including the balance sheet, the statement of results, the statement of off balance sheet commitments, the statement of cash flow and the notes containing a summary of main accounting methods and other explanatory notes for the fisal year January 1, 2010 till December 31, 2010.
Consolidated financial statements of the group Banque de l’Habitat as of 31/12/2010 as attached to the current report show core funds of 498 655 thousand dinars including the profit of the fiscal year amounting to 38 259 thousand dinars.

PAGE 92 PAGE 93
CONSOLIDATEDFINANCIAL STATEMENTS
CONSOLIDATED FINANCIAL STATEMENTS • ANNUAL REPORT 2010
Justifying our opinion
4. In the framework of our auditing the parent company, we examined the internal control procedures applicable to the Bank’s operations including those related to the processing of accounting information and preparation of financial statements.
We were able through this verification, to notice inadequacies at the level of the Bank’s internal control. These inadequacies as mentioned in our assessment report on internal control system and our report on risks evaluation of the parent company and which constitute an integral part of the current report arise mainly from internal control procedures inadequacy to the information system and informatics securities.
In this framework, our works were restricted by :
Inadequacies in the procedures of control and accounting justification of some accounts of • which mainly classified claims, interest collected in advance on loans to customers as well as monetics suspending accounts of some accounts that were not provisioned for risks by the Bank.It is also the case for fixed assets accounts that have not been put together in the absence of stock taking.
Moreover, some accounts related to the management of special funds and budgetary funds should be justified and put together with debtors entities. These are notably the advance to SNIT for the repurchase of properties belonging to foreigners as well as accounts tied to the convention related to the national programme of rudimentary lodgings resorption (PNRLR).
Regarding the evaluation of commitments on customers, we have noticed that some • guarantee assets have been selected by the Bank without stock taking these guarantees and without being supported by copies of corresponding registrations and recent expertise reports pursuant to the regulation into force. Thus, for some customers, the Bank doesn’t have any certified financial statements and external rating to assess these customers financial situation.
In the absence of information availability, the eventual impact of the works of justification of these accounts as well as guarantees stock taking and the taking into account of financial data to assess some customers commitments on the Bank’s financial statements features, has not been determined by our staff at the date of issue of this report.
We have taken into amount, when assessing the risk, the internal control into force in the entity related to the working out and the fair presentation of the financial statements in order to define appropriate audit procedures in the circumstances and not for the objective to express an opinion on the effectiveness of the latter. An audit includes also the appreciation of the appriopriateness of selected accounting methods and the reasonableness of accounting estimates made by the management as well as the appreciation of the combined presentation of financial statements. We think that the carried out works in this framework constitute a reasonable basis to support our audit.

PAGE 94 PAGE 95
CONSOLIDATEDFINANCIAL STATEMENTS
CONSOLIDATED FINANCIAL STATEMENTS • ANNUAL REPORT 2010
Opinion
12. In our opinion and taking into account what has been mentioned above and subject to the points outlined above, the consolidated financial statements are regular and present fairly the financial situation of the group “Banque de l’Habitat’ as well as the result of their operations and cash flow for the fiscal year ended December 31, 2010 pursuant to accounting principles generally accepted in Tunisia.
5. The parent company enters charges related to allowances for retirement only at the moment of retirement. Thus, it is not proceeded to the recording of provisions for retirement allowances related to commitments arising from collective agreement that provides for an allowance of six times the last salary granted to the employee and which is evaluated on the basis of the linear joining method pursant to the international standard IAS 19 “Staff benefits” at 8 821 thousand dinars.
6. Charges related to provisions for paid leave are entered only in the limit of 30 days. Thus, provisions for paid leave are underestimated up to the number of days exceeding this limit. Thus, provisions for paid leaves are underestimated up to the number of days exceeding this limit that is for an amount of 1677 thousand dinars.
7. As detailed in the notes on financial statements, we have not received the financial statements of some companies of the consolidated perimeter. Moreover we have identified some spreads between the conveyed financial statements and the corresponding consolidation bundles.
8. The parent company was subject to a tax control during 2010 covering the period 2006-2009. This control’s results haven’t been made available to us and no provisions for tax risk has been recorded in the bank’s accounts.
9. Contrary to the provisions of article 471 of the code of commercial companies, we haven’t received the auditors special and general reports on some subsidiaries included in the consolidated perimeter.
10. In spite of the control carried out on the companies SICAV BHO and BHP, these companies were not integrated in the consolidation perimeter of the group BH.
11. The precessing of claims sold by BH to its subsidiary SGRC is conveyed only by the elimination of converse operations. Claims as they appear at the level of SGRC accounts have been integrated at the level of consolidated financial statements. No homogenization reprocessing to enter the claims at their economic level has been carried out.

PAGE 94 PAGE 95
CONSOLIDATEDFINANCIAL STATEMENTS
CONSOLIDATED FINANCIAL STATEMENTS • ANNUAL REPORT 2010
Remarks paragraph
Without questionning the opinion expressed above, we draw your attention on the following :
1. As indicated in the note n°1 related to financial statements, the appreciation and evaluation of risks on commitments of some companies and public entities showing financial difficulties signs turn out at the date of issue of this current report to be essentialy tied to the negotiations to be started and the restructuring programmes of these entities and their setting up.
2. As indicated in the note related to financial statements « Note n°7 – core funds » the parent company proceeded during 2010 to some mistakes corrections: These corrections meant a decrease in core funds up to 2 371 thousand dinars entered in opening core funds and concern previous depreciation on managed funds for an amount of 1 554 thousand dinars and reserved charges entry for an amount of 817 thousand dinars which date back to 2009.
The 2009 financial statement presented for comparison purposes have not been reprocessed to take into account the above mentionned adjustments.
3. As indicated in the note related to financial statements n°6 “subsequent events to the closing date” and in the current context of social, economic and political trends in Tunisia, we bring to your attention that the level of commitments granted to companies belonging to members and relatives of the family of the former president following the perimeter set by the Central Bank of Tunisia, is evaluated at 231.5 MTD of which 69.5 MTD are classified as of 31/12/2010. These commitments are covered by provisions up to 30.9 MTD including guarantees assessed by the Bank. Most of these companies are nowadays managed by a receiver.
We think that these events would have an eventual impact on the parent company situation and on the quality of its assets. At the date of issue of this current report, the impact on the Bank’s financial statements can’t be determined.
Specific verifications
We have carried out specific verifications provided for by the law pursuant to audit standards applicable in Tunisia.
Based upon our verification, we haven’t noticed any significant incoherence in the accounting data in the executive board report on the management of the group related to the fiscal year that can contradict the consolidated financial statements of the group “Banque de l’Habitat“ closed as of December 31, 2010.
On behalf of Generale d’Audit et Conseil On behalf of Management Conseil
Mr Chiheb GHANMI Mr Chérif BEN ZINA
PAGE 96 PAGE 97
CONSOLIDATEDFINANCIAL STATEMENTS
CONSOLIDATED FINANCIAL STATEMENTS • ANNUAL REPORT 2010
Note 1. Referential of working out
and presentation of consolidated
financial statements
The consolidated financial statements of the group Banque de l’Habitat are worked out and presented pursuant to accounting principles generally accepted in Tunisia notably the general accounting standard n°1 of December 30, 1996 and the banking accounting standards (NCT 21 to 25) applicable since January 1, 1999 as well as the standards (NCT 35 to 39) related to consolidation and the rules of the Central Bank of Tunisia enacted by circulars n°91-24 of December 17, 1991 as modified by circulars n°99-04 and n°2001-12.
Notes related to consolidated financial statementsas of December 31, 2010 (Figures are expressed in thousand dinars)
Presentation of assets headings
The heading AC1 totaled 431 800 008 dinars as of 31/12/2010 and has undergone a method change that is explained mainly by a reclassification of accounts of loans at the heading AC1 for an amount of 310 917 752 dinars.
This reclassification has been carried out to provide better presentation of financial statements pursuant to the banking accounting standard NC 21.
Deffered taxation is processed pursuant to financial information international standard IAS 12.
All subsidiaries controled exclusively by the Banque de l’Habitat are consolidated through an overall integration whatever their activity sector.
The associated company under the influence of the Banque de l’Habitat is henceforth equity consolidated company.
Financial statements of consolidated companies are reprocessed to make them compliant with rules of accounting, assessment and presentation of the group Banque de l’Habitat. Accounting principles and assessment rules pertaining to non banking activities have been maintained in the consolidated accounts of the group Banque de l’Habitat.
Presentation of summary consolidated
financial statements
The presentation of consolidated financial statements of the group « Banque de l’Habitat » complies with NC21 standard related to the presentation of banking establishments financial statements.

PAGE 96 PAGE 97
CONSOLIDATEDFINANCIAL STATEMENTS
CONSOLIDATED FINANCIAL STATEMENTS • ANNUAL REPORT 2010
Income generated by subsidiaries not operating in the financial services sector appear in the heading “other operating proceeds”.
Assets other than tangible fixed assets and intangible fixed assets as well as liabilities of subsidiaries operating in the non financial sector are no longer distinguished as current and non current elements and are respectively presented under the sub heading “other assets” and “other liabilities”
Perimeter, method and rules of
consolidation
Perimeter
Consolidated accounts are worked out from individual accounts of the Banque de l’Habitat, all subsidiaries controled by the latter and the associated company.
Methods of consolidation
Consolidated companies through overall integration
Companies that are exclusively controled by the group are consolidated through overall integration including those having a different structure of accounts.
The group has an exclusive control over a subsidiary when it is able to manage the operational and financial policies of a subsidiary in order to take advantage of its activities.
This control results :
Either from holding directly or indirectly the majority of voting rights in the consolidated • company.
Either from the designation of the majority of members of the board, management • or surveillance.
Either from the right to exert a dominating influence on a subsidiary pursuant to a contract • or a statutory provision.
The control is presumed to exist, when a company holds directly or indirectly at least 40% of voting rights in a company and no other associate holds a portion higher that its one.
The overall integration method was applied pursuant to the following approach :
The individual financial statements of the parent company and its subsidiaries are combined • l ine by line by additionning the similar lines of assets, liabilities, core funds, proceeds and charges.
Converse operations between the companies of the group are eliminated in a balanced way.•

PAGE 98 PAGE 99
CONSOLIDATEDFINANCIAL STATEMENTS
CONSOLIDATED FINANCIAL STATEMENTS • ANNUAL REPORT 2010
Minority interest in the net result of consolidated subsidiaries of the fiscal year is identified • and deducted from the group result in order to obtain the net result attributable to the owners of the parent company.
The accounting value of the participation of the group in each subsidiary and the share of • the group in the core funds are eliminated to determine consolidated reserves and the share of minority holders in reserves.
The processing of the claims sold by the Bank to its subsidiary SGRC is shown by the elimination of the claims as they appear at the level of SGRC accounts.
Equity consolidated companies
Companies under considerable influence are equity consolidated companies. The considerable influence results from the power to participate to a company financial and operational policies without holding its control. The considerable influence may notably result from a representation in the surveillance or executive boards, the participation in strategic decisions, the existence of important inter companies operations, the switch of management staff, and technical dependency ties.
The considerable influence on financial and operational policies is presumed when the group holds directly or indirectly a portion corresponding to 20% of voting rights in this company.
The following steps are applied to equity consolidated companies :
Reprocessing core funds of the equity consolidated company through the elemination of • converse operations having an impact on its results or its reserves.
Entering the share of the group in the core funds of the equity consolidated company in an • assets heading entitled « equity consolidated securities ».
Eliminating the participation of the group in the equity consolidated company by the share • of the group in core funds and entering the difference in the consolidated result in the heading “share in the results of equity consolidated companies” while taking into account the effects on consolidated reserves.

PAGE 98 PAGE 99
CONSOLIDATEDFINANCIAL STATEMENTS
CONSOLIDATED FINANCIAL STATEMENTS • ANNUAL REPORT 2010
Should, according to the method of equity consolidation, the quota of the Bank, the consolidating company, be in the results showing a deficit of an associated company equal or higher than accounting value of participation, the Bank stops habitually taking into account its quota in the losses to occur. The participation is then presented for a nil value.The additional losses are provisioned insofar as the company under equity consolidation assumed its commitments or made payments on behalf of the company under equity consolidation in order to fulfill the commitments of the latter that the Bank guaranteed or for which the bank is involved whatever the means.
Consolidation rules
Securities acquisition cost, acquisition spread and evaluation spread
Securities acquisition cost
Securities acquisition cost is equal to the amount of the remuneration remitted by the seller to the buyer increased by costs considered significative directly ascribable to the acquisition net of the corresponding tax saving.
Acquisition spread
Acquisition spread corresponding to the difference between the acquisition cost of securities and the evaluation of assets and liabilities of the acquired company are linearly amortized over a period that can’t exceed twenty years specifically defined in the particular conditions for each acquisition.
When data are available, acquisition spreads are identified and entered in assets according to the case either in intangible fixed assets for globally integrated subsidiaries or in equity consolidated securities for other companies.
Evaluation spreads
Evaluation spreads corresponding to the differences between the entry value reestimated in the consolidated balance sheet of assets, liabilities of the acquired company and the accounting value of these elements are entered according to common rules applicable to corresponding elements.
Interest percentage variation in a consolidated company
The increase in interest percentage held in a company included in the consolidation perimeter gives rise to the entry of an additional acquisition spread amortized according to the above mentioned rules. The decrease in interest percentage in a company remaining consolidated gives rise to an additional amortization of the acquisition spread.
Converse operations
Converse accounts as well as proceeds and charges resulting from operations belonging to the group and having a significative influence on consolidated financial statements are eliminated when they concern entities subject to an overall or proportional integration.

PAGE 100 PAGE 101
CONSOLIDATEDFINANCIAL STATEMENTS
CONSOLIDATED FINANCIAL STATEMENTS • ANNUAL REPORT 2010
Current taxes
The group BH companies are submitted to corporate tax according to rules and rates into force
in each activity sector.
Deferred taxes
Deferred taxes are entered ever since a temporal difference is noticed between assets
and liabilities accounting values appearing on the balance sheet and respective tax bases when these
differences have an impact on future tax payments.
Deferred taxes are calculated on the basis of the voted or virtually voted tax which would be
into force at the moment when the temporal difference will be reserved. At the moment of a tax rate change,
the corresponding effect is entered in the result account in the heading “deferred tax charge”.
Net deferred tax assets are taken into account only when it is likely that the consolidated company
has a recuperation outlook over a determined future.
Deferred taxes are determined at the level of each tax entity and are not subject
to any updating.
The perimeter of consolidation includes 11 companies as of December 31, 2009 : 10 consolidated
by overall integration and a new company UTB under equity consolidation method.
The consolidation perimeter of consolidated financial statements was determined pursuant to
provisions of accounting standards NC 35 to NC 37 and to the provisions of the code of commercial
companies ruling groups of companies.
Thus selected companies in the consolidation perimeter, the interest precentage as well as their
consolidation methods are as follows :
Tax on result
Perimeter of consolidation

PAGE 100 PAGE 101
CONSOLIDATEDFINANCIAL STATEMENTS
CONSOLIDATED FINANCIAL STATEMENTS • ANNUAL REPORT 2010
Subsidiaries Financial statements Auditor’s report
Banque de l’Habitat (parent company) Yes Yes
Modern leasing Yes Yes
SIM SICAR Yes Yes
SICAF BHEI Yes Yes
SIFIB Yes Yes
Société Générale de Recouvrement des Créances Yes Yes
Société moderne de Titrisation No No
SOPIVEL Yes Yes
Assurances SALIM Yes Yes
STIMEC Yes Yes
UTB No No
Consolidated financial statements are entered as of 31/12/2010 taking into account audited financial statements and audit reports are as follows :
HeadingInterest percentage
Consolidation method2010 2009
Banque de l’Habitat (parent company) 97.74% 97.42% Overall integration
Modern leasing 44.92% 58.52% Overall integration
SIM SICAR 51.99% 52.87% Overall integration
SICAF BHEI 52.47% 51.36% Overall integration
SIFIB 61.56% 61.35% Overall integration
Société Générale de Recouvrement des Créances 75.80% 78.42% Overall integration
Société moderne de Titrisation 35.29% 36.57% Overall integration
SOPIVEL 79.37% 78.79% Overall integration
Assurances SALIM 31.30% 44.14% Overall integration
STIMEC 42.46% 44.12% Overall integration
UTB 43.41% 32.38% Equity consolidated
N.B : Explanatory notes of consolidated financial statements are available at the level of the auditors report on Group « Banque de l’Habitat » consolidated financial statements.


PAGE 103
Resolutions

PAGE 104 PAGE 105
Resolutions Resolutions • ANNUAL REPORT 2010
ORDINARY GENERAL ASSEMBLY
ADOPTED RESOLUTIONS (FISCAL YEAR 2010)
The Annual Ordinary General Assembly having considered the Executive board report (on the individual financial situation and the consolidated financial situation) and after having listened to the reading of the auditors reports on the individual financial statements and the consolidated financial statements for the fiscal year 2010 approves the report of the Executive board as well as the individual financial statements and the consolidated financial statements as of December 31, 2010.
This resolution was adopted unanimously.
The Annual Ordinary General Assembly after having listened to the reading of the auditors special report on the fiscal year 2010 approves the regulated conventions provided for by articles 200 and 475 of the code of commercial companies and article 29 of law related to lending institutions.
This resolution was adopted unanimously.
Following the first two resolutions, the General Assembly gives the directors full discharge and without reserve for the management of 2010 fiscal year.
This resolution was adopted unanimously.
First resolution
Second resolution
Third resolution

PAGE 104 PAGE 105
Resolutions Resolutions • ANNUAL REPORT 2010
Pursuant to reservations outlined in the auditors report notably reservation n°7 about provisions for tax risk, the distribution of net profits of fiscal year 2010 is as follows :
Heading AMOUNT 31/12/2009 AMOUNT 31/12/2010
Net profit 53 258 932.592 32 592 498.284
Carried forward 22 325.465 6 183.780
Accounting modifications 774 925.723 - 2 371 324.739
First balance 54 056 183.780 30 227 357.325
Dividend and super dividend 11 700 000.000 0.000
Second balance 42 356 183.780 30 227 357.325
Social fund 850 000.000 850 000.000
Third balance 41 506 183.780 29 377 357.325
Amount allocated for extraordinary reserves 41 500 000.000 0.000
Amount for exempted reinvestments 0.000 16 951 341.000
Reserve for general bankings risks 0.000 12 420 000.000
Fourth balance 6 183.780 6 016.325
Carried forward 6 183.780 6 016.325
Balance 0 0
The General Assembly approves the nomination of :
Mr. Abdelaziz Mahfoudhi as director representing the State in the Executive board of the Bank substituting Mrs Souhir Taktak following letter of the Ministry of Finance n°110519-02 of May 30, 2011 for a three year period.
Mr. Nabil Ajroud as director representing the State in the Executive board of the Bank substituting Mr Habib Toumi following letter of the Ministry of Finance n°110613-02 of June 17, 2011 for a three year period.
Their terms expires at the end of the Ordinary General Assembly which will have to rule on the accounts
of 2013 fiscal year.
This resolution was adopted unanimously.
This resolution was adopted by majority decision.
Fourth resolution
Fifth resolution

PAGE 106 PAGE 107
Resolutions Resolutions • ANNUAL REPORT 2010
The General Assembly renews the term of the following private directors :
Mr. Néjib Ben Laaroussi Marzougui.
Mr. Mohamed Sadok Ben Mohamed Driss.
Mr. Adel Zarrouk.
for a three year period expiring at the end of the Assembly which will have to rule on 2013 fiscal year results.
This resolution was adopted unanimously.
The Ordinary General Assembly sets the annual amounts of directors fees to be distributed to Executive board members at five thousand dinars per director.
This resolution was adopted unanimously.
The General Assembly approves the issue of a debenture loan and/or subordinated one of 150 MTD in one or more portion in a maximum delay of three years.
The Executive board has a mandate to set the characteristics and conditions (dates, duration, rates and issue procedures) following financial market situation.
This resolution was adopted unanimously.
The General Assembly approves the renewal of the term of :
Fawzia Moussa Saayid.
Jalel Chouihi.
Ettajouri Fatnassi.
As directors representing the State, their terms expiring at the end of the ordinary general assembly which will have to rule on the accounts of 2013 fiscal year .
This resolution was adopted unanimously.
Sixth resolution
Seventh resolution
Eighth resolution
Ninth resolution

PAGE 106 PAGE 107
Resolutions Resolutions • ANNUAL REPORT 2010
The Banque de l’Habitat shareholders General Assembly authorizes the intervention on the security BH in order to regulate its price on the stock market to be carried out over a maximum three year period.
The Executive Board has a mandate to set the modalities of this operation pursuant to the regulations into force through the setting of its minimum and maximum price etc...according to the stock market situation.
This resolution was adopted by majority decision.
To carry out procedures of deposit, legal publications and others, full powers are granted to the holder of an extract or a copy of the minutes of the current Ordinary General Assembly.
This resolution was adopted unanimously.
Tenth resolution
Eleventh resolution

C o n c e p t i o n g r a p h i q u e :