Embed Size (px)
Citation preview

4.5 Graphs of Sine and Cosine Functions
To graph the sine or cosine function by hand, you need to know the five key points for one period
0,2 . We can find these points by examining the unit circle and “unraveling” it into a linear graph.
Example: The development of siny x and cosy x .
Definition of Amplitude of Sine and Cosine Curves – The amplitude of siny a x and cosy a x
represents half the distance between the maximum and minimum values of the function and is given by
Amplitude = a .
Period of Sine and Cosine Functions – Let b be a positive real number. The period of siny a bx and
cosy a bx is given by Period =2
b
.
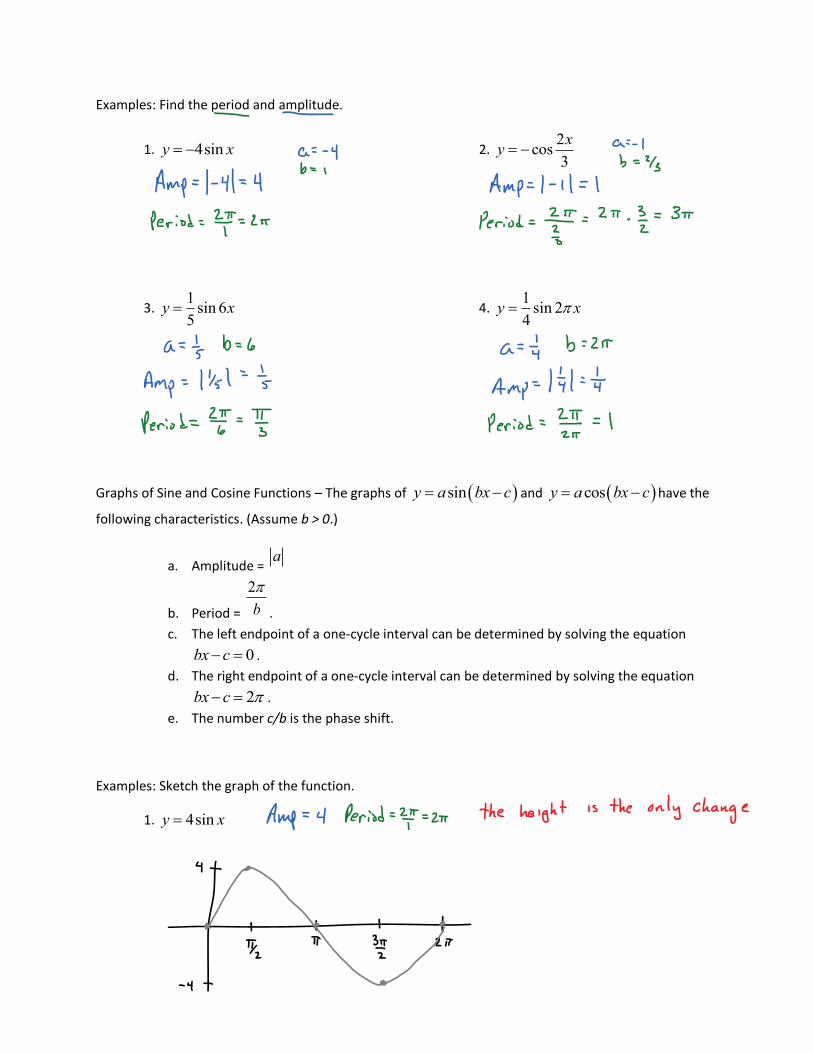
Examples: Find the period and amplitude.
1. 4siny x 2. 2
cos3
xy
3. 1sin 65
y x 4. 1sin 24
y x
Graphs of Sine and Cosine Functions – The graphs of siny a bx c and cosy a bx c have the
following characteristics. (Assume b > 0.)
a. Amplitude = a
b. Period =
2
b
.
c. The left endpoint of a one-cycle interval can be determined by solving the equation
0bx c .
d. The right endpoint of a one-cycle interval can be determined by solving the equation
2bx c .
e. The number c/b is the phase shift.
Examples: Sketch the graph of the function.
1. 4siny x
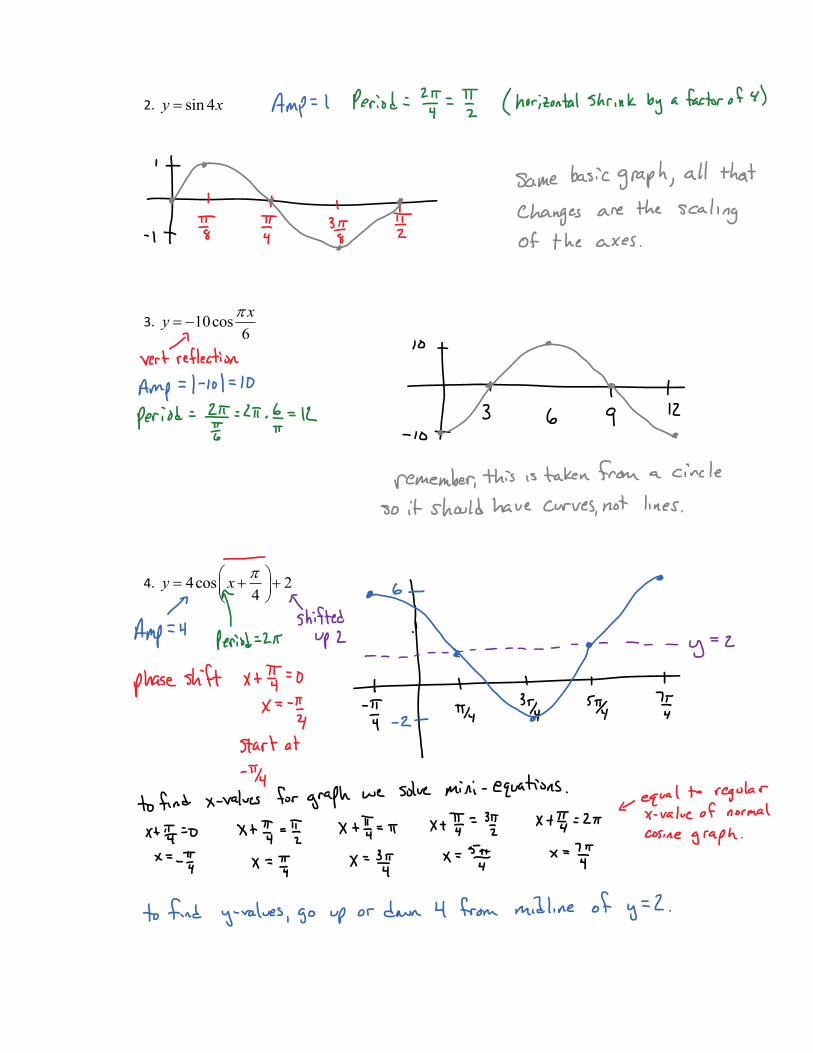
2. sin 4y x
3. 10cos6
xy
4. 4cos 24
y x

Examples: Describe the sequence of transformations from the parent functions.
1. sin 2g x x
2. 1 cosg x x
3. 4 sin 3g x x
Examples: When tuning a piano, a technician strikes a tuning fork for the A above middle C and sets up a
wave motion that can be approximated by 0.001sin880y t , where t is the time (in seconds).
(a) What is the period of the function?
(b) The frequency f is given by 1/f p . What is the frequency of the note?
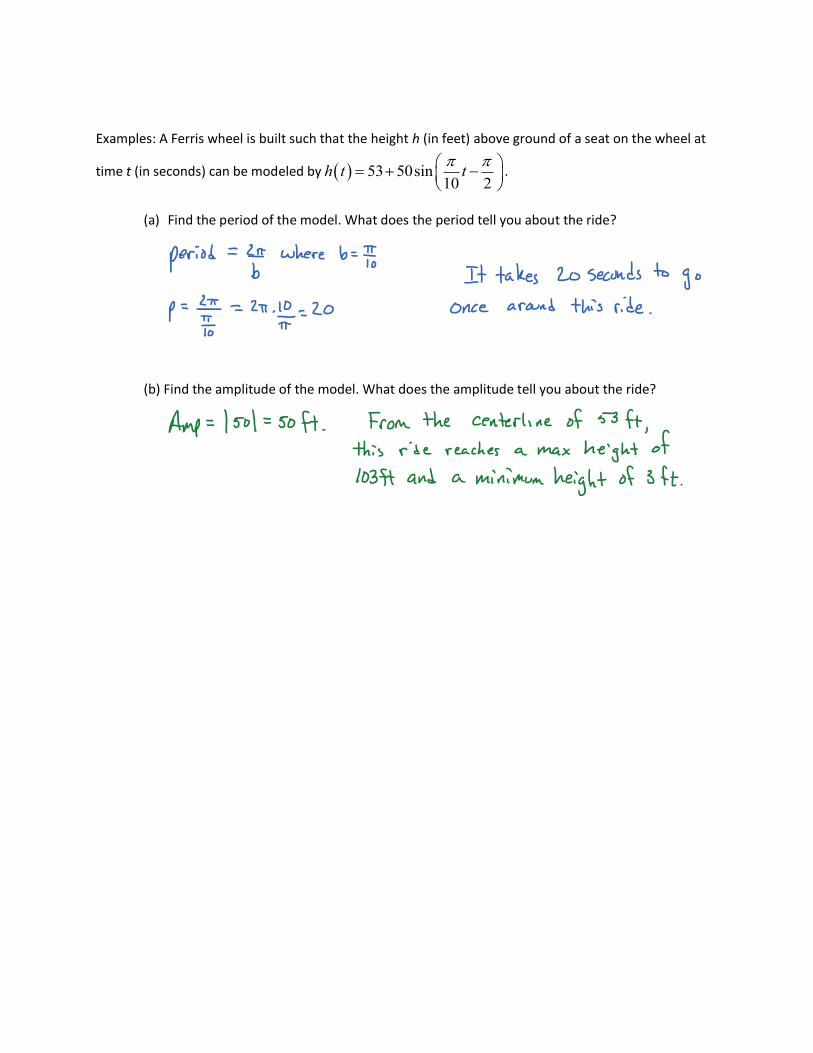
Examples: A Ferris wheel is built such that the height h (in feet) above ground of a seat on the wheel at
time t (in seconds) can be modeled by 53 50sin10 2
h t t
.
(a) Find the period of the model. What does the period tell you about the ride?
(b) Find the amplitude of the model. What does the amplitude tell you about the ride?