Embed Size (px)
Citation preview
CENTER FOR DRUG EVALUATION AND RESEARCH
APPLICATION NUMBER:
022200Orig1s000
CLINICAL PHARMACOLOGY AND BIOPHARMACEUTICS REVIEW(S)

NDA 22-200, Resubmssion Bydureon (Exenatide LAR Once Weekly)
Page 1 of 44
OFFICE OF CLINICAL PHARMACOLOGY REVIEW
NDA: 22-200 Submission Date(s): 07/28/2011
Brand Name BYDUREON®
Generic Name Exenatide LAR
Reviewer Manoj Khurana, Ph.D.
Team Leader Jayabharathi Vaidyanathan, Ph.D. (Acting)
OCP Division Clinical Pharmacology -2
OND division Metabolic and Endocrine Products
Sponsor Amylin Pharmaceuticals, Inc.
Submission Type; Code Resubmission/Class 2
Formulation; Strength(s) 2 mg subcutaneous injection; Once weekly
Indication BYDUREON® is indicated as adjunctive therapy to improve glycemic control in patients with type 2 diabetes mellitus
1. EXECUTIVE SUMMARY ....................................................................................... 2 1.1 RECOMMENDATIONS .......................................................................................... 2 1.2 PHASE IV COMMITMENTS ........................................................................................ 2 1.3 SUMMARY OF IMPORTANT CLINICAL PHARMACOLOGY FINDINGS.......................... 2
2. QBR................................................................................................................................ 3 2.1 GENERAL ATTRIBUTES............................................................................................... 3 2.2 CLINICAL PHARMACOLOGY QUESTIONS ................................................................. 5 2.3 ANALYTICAL SECTION ............................................................................................. 10
3. DETAILED LABELING RECOMMENDATIONS................................................ 12
4. APPENDIX.................................................................................................................. 17 4.1 PROPOSED LABELING.......................................................................................... 17
Reference ID: 3053760

NDA 22-200, Resubmssion Bydureon (Exenatide LAR Once Weekly)
Page 2 of 44
1. Executive Summary
Bydureon (exenatide LAR or exenatide once weekly) is a subcutaneously (SC) injectable extended-release formulation of exenatide proposed to be given once weekly (QW) and contains the same active ingredient as the approved Byetta. Byetta (exenatide) injection is approved in the United States as an adjunct to diet and exercise to improve glycemic control in adults with type 2 diabetes mellitus. The exenatide once weekly/LAR formulation consists of biodegradable polymeric microspheres that entrap exenatide and provide extended release. The microspheres are composed of exenatide and are incorporated into a matrix of poly-(D,L-lactide-co-glycolide) (PLG), a biodegradable polymer. 1.1 RECOMMENDATIONS The Office of Clinical Pharmacology/Division of Clinical Pharmacology-2 (OCP/DCP-2) has reviewed the information from resubmission of NDA 22-200 for Bydureon (exenatide once weekly or exenatide LAR), and finds it acceptable. This recommendation and the labeling comments should be conveyed to the sponsor as appropriate.
1.2 PHASE IV COMMITMENTS None.
1.3 SUMMARY OF IMPORTANT CLINICAL PHARMACOLOGY FINDINGS This resubmission application is intended to address the deficiencies cited in the complete response letter dated 10/18/2010 and contains two clinical pharmacology studies, BCB112 (thorough QT study) and BCB113, a pilot IV infusion study (to identify appropriate continuous intravenous (IV) infusion parameters needed to achieve target plasma exenatide concentrations with acceptable tolerability in healthy subjects). In addition this application contains one Phase 3 clinical trial (Study BCB108) entitled “A Randomized, Open-Label, Parallel-Group, Comparator-Controlled, Multicenter Study to Evaluate the Glycemic Effects, Safety, and Tolerability of Exenatide Once Weekly in Subjects With Type 2 Diabetes Mellitus”, which compared the Amylin manufactured (commercial) Bydureon formulation (exenatide LAR once weekly) to Byetta (exenatide BID) for safety and efficacy. The following are the important clinical pharmacology findings:
• The BCB108 trial demonstrated that following the initiation of the treatment with Bydureon QW, maximal reduction in HbA1c is achieved by week 14 onwards.
• Bydureon QW provides better glycemic control in comparison to Byetta BID (Reader is referred to the Statistical Review for further details on claims of superiority).
• The exenatide exposure-response relationship for Bydureon from trial BCB108 (marketed formulation manufactured by Amylin) was comparable to that observed from data from the original NDA (Alkermes).
• The to-be-marketed formulation results in steady-state exenatide exposures, which are in similar range as that to the previously observed data. In addition, these observed exenatide exposures fall in the maximal response with regards to HbA1c reduction from baseline.
Reference ID: 3053760
(b) (4)

NDA 22-200, Resubmssion Bydureon (Exenatide LAR Once Weekly)
Page 3 of 44
2. QBR
2.1 GENERAL ATTRIBUTES
2.1.1 What pertinent regulatory background or history contributes to the current assessment of the clinical pharmacology of BydureonTM? The NDA for BydureonTM (exenatide LAR) injection was submitted on 05/05/2009. BydureonTM was proposed for use as an adjunct to diet and exercise in improving glycemic control in adults with type 2 diabetes mellitus. The Table 1 below summarizes the activities post original submission: Table 1. Relevant regulatory history post original NDA submission Date Activity March 12, 2010 FDA issued a complete response letter citing product quality deficiencies and
the need for a Risk Evaluation and Mitigation Strategy (REMS). April 22, 2010 A resubmission was received by FDA, which included complete responses to
the deficiencies identified in the March 12, 2010 action letter. April 12, 2010 FDA was made aware of a thorough QT study (tQT), which took place
between April 23, 2008, and July 21, 2008, that was required by Health Canada as part of a New Drug Submission for Byetta that was not conducted under a U.S. IND. FDA was not informed of these study results or concerns raised by Health Canada during its initial review of NDA 022200.
April 13, 2010 FDA notified sponsor that the completed results of tQT study, must be submitted for review with NDA 022200 due to concerns of QT prolongation raised by Health Canada
April 15 and May 13, 2010
Sponsor submitted the report and ancillary documents for Study GWCI , respectively to IND 057725
October 18, 2010
FDA issues another complete response letter notifying the sponsor that “Based on our review of Study GWCI, there was a significant concentration-QTc relationship for exenatide. This observation is concerning for NDA 022200 because the mean maximum concentration (Cmax) of exenatide achieved in this study was approximately half the maximum steady state concentration (Cmax,ss) observed for Bydureon after 2 mg administration. Furthermore, population PK analysis of patients with mild-to-moderate renal impairment receiving exenatide 2 mg once weekly revealed a 50-60% higher exposure in these patients compared to that in patients with normal renal function. In the absence of a positive control, QT data collected in your phase 3 study are not adequate to rule out small drug-induced QT changes. In contrast to Study GWCI, the intrinsic variability in the measurement of QT interval in the phase 3 trial is not well controlled and small drug-induced increases might not be detected. Furthermore, the number of patients with moderate impairment exposed to Bydureon in NDA 022200 is inadequate (n=10) to address this safety concern.
1. To address this deficiency, you will need to conduct a tQT study following treatment with exenatide at exposures comparable to those observed in renal impaired patients taking Bydureon. Prior to conducting the tQT study, the protocol should be submitted to the Agency for review.”, and
“In our original review of Study LAR-105 titled, "A Randomized, Open-Label, Multicenter Comparator-Controlled Study to Examine the Effects of Exenatide
Reference ID: 3053760

NDA 22-200, Resubmssion Bydureon (Exenatide LAR Once Weekly)
Page 4 of 44
Long-Acting Release on Glucose Control (HbA1c) and Safety in Subjects with Type 2 Diabetes Mellitus Managed with Diet Modification and Exercise and/or Oral Antidiabetic Medications", in NDA 022200, we noted that exenatide 2 mg once weekly resulted in a statistically significantly greater reduction in HbA1c compared to Byetta 10 mcg bid. The difference in adjusted mean change in HbA1c was -0.3 with an accompanying 95% CI of -0.5 to -0.1. However, this study did not evaluate the commercial drug product. Instead, a comparability substudy to LAR-105 titled LAR-105c, was conducted after Week 30 to compare clinical effectiveness between the investigational product and the commercial product. In this substudy, both investigational and commercial drug products increased HbA1c with greater deterioration in glycemic control observed with the commercial product. The average difference between the two products was 0.2 after 18 weeks of treatment with an accompanying 95% CI for this comparison of 0.0 to 0.3. The lower bound of this 95% CI raises concern that the commercial product may be less effective than the investigational product used in LAR-105. As a result, we cannot conclude that the commercial product will provide superior efficacy to the currently marketed Byetta from LAR-105.
2. We have recently been notified by you that the completed Study LAR-108 titled, "A Randomized, Open-Label, Parallel-Group, Comparator-Controlled, Multicenter Study to Evaluate the Glycemic Effects, Safety, and Tolerability of Exenatide Once Weekly in Subjects with Type 2 Diabetes Mellitus," has a similar study design to Study LAR-105 but employs the commercial drug product. The results of Study LAR-108 should be submitted with your tQT study to enable a more accurate evaluation of the efficacy of Bydureon and labeling of the safety and effectiveness of Bydureon.”
07/28/2011 Sponsor submitted a complete response to the action letter The sponsor submitted a complete response on 07/28/2011 addressing the deficiencies cited in October 18, 2010 action letter. The current resubmission contains the final study reports and data for the following additional trials:
Table 2. Trials for review under re-submission
Trial ID Title
BCB108 A Randomized, Open-Label, Parallel-Group, Comparator-Controlled, Multicenter Study to Evaluate the Glycemic Effects, Safety, and Tolerability of Exenatide Once Weekly in Subjects with Type 2 Diabetes Mellitus
BCB112 A Randomized, Three-Period, Placebo- and Positive-Controlled, Double-Blind, Crossover Study to Assess the Electrophysiological Effects of Exenatide at Therapeutic and Supratherapeutic Concentrations on the 12-Lead Electrocardiogram QT Interval in Healthy Subjects
BCB113 A Pilot Study to Identify Infusion Parameters for Intravenous Infusion of Exenatide for the Study of 12-Lead Electrocardiogram QT Intervals in Healthy Subjects
Sponsor claimed that trial BCB108 demonstrated that exenatide once weekly drug product manufactured by Amylin is comparable to exenatide once weekly manufactured
Reference ID: 3053760
NDA 22-200, Resubmssion Bydureon (Exenatide LAR Once Weekly)
Page 5 of 44
by Alkermes. From a pharmacokinetic perspective, exenatide concentrations with Amylin-manufactured drug product were within the known therapeutic range of exenatide once weekly, resulting in comparable glycemic control without any safety or tolerability issues with Amylin-manufactured exenatide once weekly drug product. The focus of this clinical pharmacology review was, therefore, to evaluate the exposure-efficacy relationship for BydureonTM in trial BCB108, in reference to that observed during the review of original NDA. The detailed evaluation of claims based on the tQT evaluation are documented in the review of tQT study BCB112 by Inter-disciplinary review team (IRT) of the Agency (see IRT Review in DAARTS dated 11/30/2011), only the key aspect from IRT’s review are captured in this review. For complete review of clinical pharmacology information from the original NDA, readers can refer to the Clinical Pharmacology Reviews in DAARTS, including the original review dated 01/22/2010 and subsequent addendum/memo dated 09/29/2010 and 10/14/2010. 2.2 CLINICAL PHARMACOLOGY QUESTIONS
2.2.1 What are the pharmacokinetic characteristics of BydureonTM and Byetta from Phase 3 Trial BCB108? Study BCB108 was an open-label, randomized, comparator-controlled study comparing BydureonTM (manufactured by Amylin) [exenatide LAR] and Byetta® (exenatide) in terms of safety, tolerability, and glucose control over 24 weeks. Eligible subjects were randomized to either Bydureon or Byetta group. Subjects subsequently received a 2-mg dose of Bydureon once weekly (QW) subcutaneously (SC) or Byetta 5 mcg SC twice daily (BID) for 4 weeks followed by Byetta 10 mcg SC BID for 20 weeks (Byetta group; as per the standard Byetta dosing). Sponsor personnel remained blinded to efficacy data (HbA1c and fasting plasma glucose concentrations) throughout the 24-week assessment period. Subjects returned to the study site at 1- to 6- week intervals for safety, efficacy, pharmacodynamic, anthropometric, and pharmacokinetic assessments. For Group A (Bydureon QW) subjects, blood samples for plasma exenatide concentration and serum antibodies to exenatide were collected pre-dose at each visit with the exception of Visit 3 (Week 1). For Group B (Byetta BID) subjects, blood samples were collected at Visit 7 (Week 20) only at -15 minutes, 1, 2, and 3 hours relative to study medication injection time for plasma exenatide concentration. The blood samples were also collected for assessment of serum antibodies to exenatide at Visit 2 (Day 1), Visit 6 (Week 14), and Visit 8 (Week 24/Study Termination) or Early Termination. The assessment for plasma exenatide concentration from exenatide BID treatment group was an addition to the study via an addendum after study initiation; hence, 31 subjects did not complete this assessment. Moreover, during the study, due to delay in delivery, samples from one shipment arrived at their destination completely thawed. The samples were outside of acceptable stability and were rejected for analysis at
This shipment included samples for 24 subjects from exenatide BID treatment group (all 4 samples at Visit 7) and 22 samples for exenatide QW arm (all from Visit 6).
Reference ID: 3053760
(b) (4)
NDA 22-200, Resubmssion Bydureon (Exenatide LAR Once Weekly)
Page 6 of 44
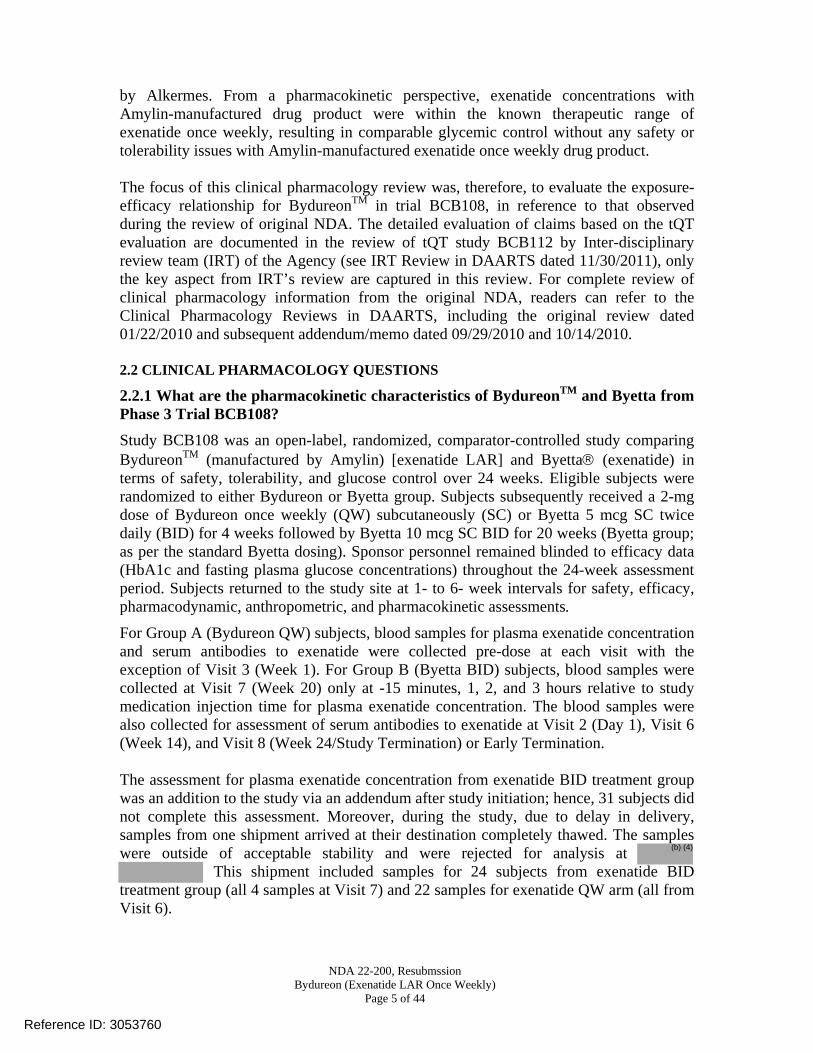
From Weeks 8 through 24, the median plasma exenatide concentration following exenatide once weekly remained relatively constant, indicating that steady-state concentration had been achieved (Figure 1). Figure 1 Median exenatide concentrations by time for the Bydureon Arm in the 24-week
Phase 3 confirmatory trial (BCB-108)
Between Weeks 14 and 24, the average steady state concentration (Css ave geometric mean [minimum, maximum]) from Trials BCB108 was 265.8 (40.0, 1765.0) pg/mL for Week 14 to Week 24 that was generally consistent with the observed Css ave in Study 2993LAR-105 (296.1 [12.0, 1542.8] pg/mL). Table 3. Plasma Exenatide Parameter Css ave: Descriptive Statistics [Population: PK Evaluable Subjects Receiving Exenatide QW (N = 71)]
Reference ID: 3053760

NDA 22-200, Resubmssion Bydureon (Exenatide LAR Once Weekly)
Page 7 of 44
For exenatide BID at Week 20, the geometric mean (10th, 90th) peak (Cmax) and total (AUC(0-3h)) plasma exenatide concentrations observed were 135.32 (45.6, 358.0) pg/mL and 301.48 (112.2, 829.5) pg*hr/mL, respectively (Table 4). There were 15 subjects, who did not have measurable plasma exenatide concentration, pre- and post-dose at visit 20. Therefore, these subjects were excluded from PK evaluable population and pharmacokinetic parameters were not calculated; this observable fact was not associated with any apparent explanation. The AUC assessment from this trial was partial in nature and utility of this metric is unknown with regards to exposure-response. The mean concentration and observed Cmax range is comparable to the established pharmacokinetic profile of 10 mcg Byetta BID at steady state. Table 4. Plasma Exenatide Parameters at Week 20: Descriptive Statistics [Population: PK Evaluable Subjects Receiving Exenatide BID (N = 46)]
2.2.2 What is the exposure-efficacy relationship for BydureonTM from Phase 3 Trial BCB108 and how does it compare to the previous Phase 3 data? The time course of HbA1c, the primary efficacy measure for glycemic control, by treatment arm is shown in the Figure 1 below. The data indicate that maximal reductions in HbA1c are achieved by Week 14 onwards.
Reference ID: 3053760

NDA 22-200, Resubmssion Bydureon (Exenatide LAR Once Weekly)
Page 8 of 44
Figure 2 Time course of HbA1c in the 24-week Phase 3 confirmatory trial (BCB-108)
Therefore, exentide exposure-response was evaluated using the pooled plasma exenatide concentration and corresponding HbA1c data from visits 14, 20 and 24 for the Bydureon treatment arm in Trial BCB108 (Figure 3a). The exposure-response trend from Trial BCB108 was compared with that observed from original NDA in Figure 3b (Trials LAR104, LAR105).
Reference ID: 3053760
NDA 22-200, Resubmssion Bydureon (Exenatide LAR Once Weekly)
Page 9 of 44
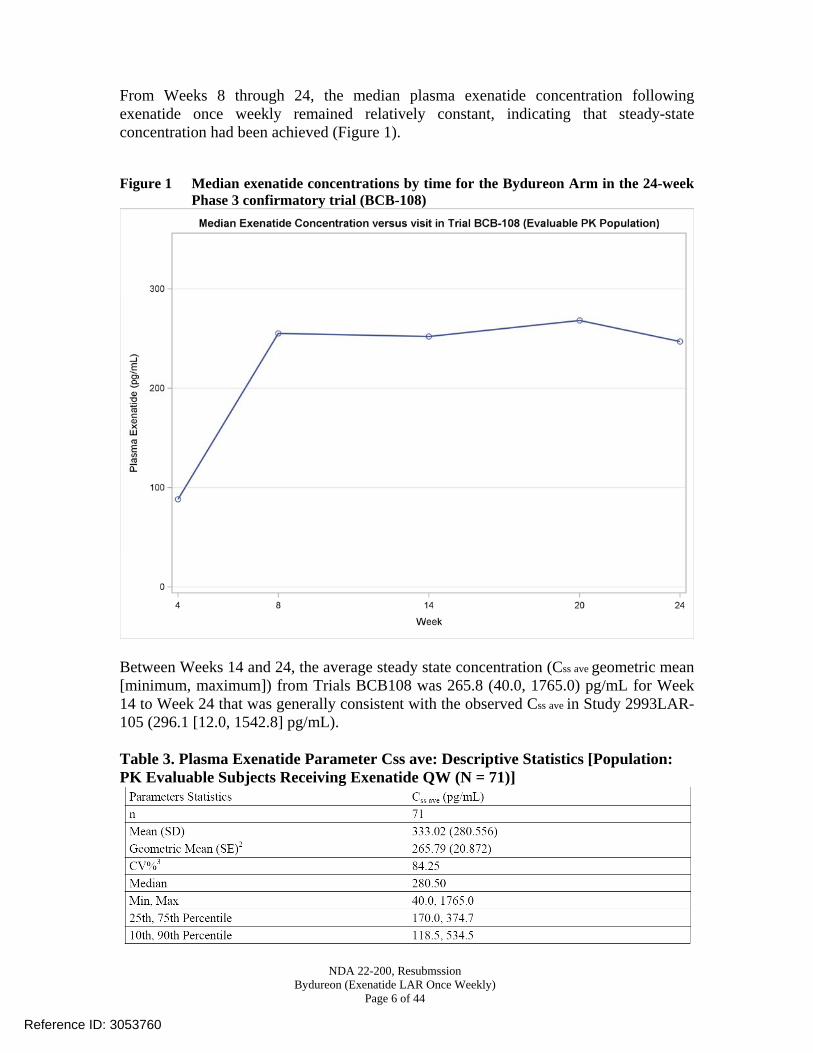
Figure 3 Exposure-HbA1c relationship in Phase 3 trial (BCB-108) is similar to that observed in original NDA review
(a) Exposure Response (Trial BCB108) (b) Exposure Response (Trials LAR-104, LAR-105)
Week 16-24 Mean HbA1c versus Median Exenatide Concentration by Quartiles (BCB-108)
5.5
6
6.5
7
7.5
8
8.5
9
0 150 300 450 600 750Exenatide Concentration (pg/mL)
HbA
1c (%
)
HbA1c data Week 16-2410% - 90% Conc. Range - 2.0 mg (BCB-108)
The exposure-response relationship was comparable between the new trial that used the to-be-marketed formulation manufactured by Amylin and that observed from data from the original NDA (Alkermes).
The to-be-marketed formulation results in steady-state exenatide exposures, which are in similar range as that to the previously observed data. In addition, these observed exenatide exposures fall in the maximal response with regards to HbA1c reduction from baseline.
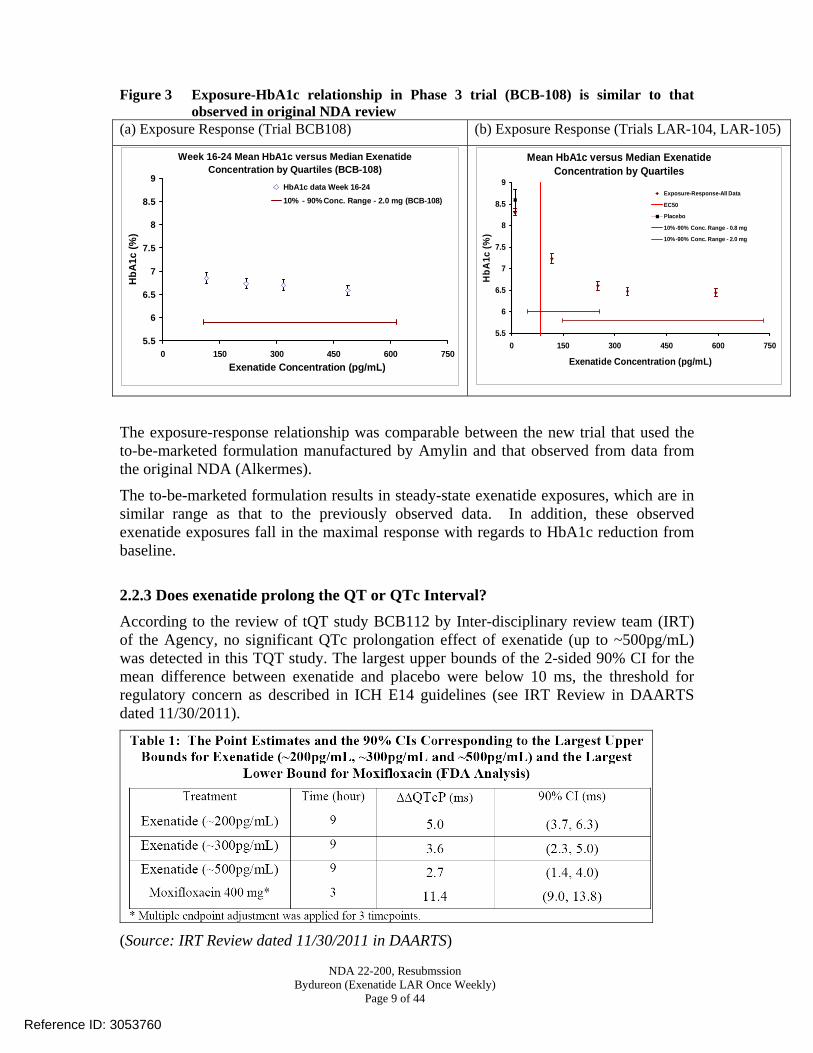
2.2.3 Does exenatide prolong the QT or QTc Interval? According to the review of tQT study BCB112 by Inter-disciplinary review team (IRT) of the Agency, no significant QTc prolongation effect of exenatide (up to ~500pg/mL) was detected in this TQT study. The largest upper bounds of the 2-sided 90% CI for the mean difference between exenatide and placebo were below 10 ms, the threshold for regulatory concern as described in ICH E14 guidelines (see IRT Review in DAARTS dated 11/30/2011).
(Source: IRT Review dated 11/30/2011 in DAARTS)
Mean HbA1c versus Median Exenatide Concentration by Quartiles
5.5
6
6.5
7
7.5
8
8.5
9
0 150 300 450 600 750
Exenatide Concentration (pg/mL)
HbA
1c (%
)
Exposure-Response-All Data
EC50
Placebo
10%-90% Conc. Range - 0.8 mg
10%-90% Conc. Range - 2.0 mg
Reference ID: 3053760

NDA 22-200, Resubmssion Bydureon (Exenatide LAR Once Weekly)
Page 11 of 44
against the concentration is performed and the concentrations of Exenatide in the samples are determined. The assay validation results are summarized in the table below: Table 5. Exenatide Assay Validation Summary
This analytical method was also used for analysis of samples from tQT study BCB112. Assay precision (%CV) for exenatide concentration measurements in BCB112 ranged from 5.3% to 5.7%, as assessed using quality control samples that ranged in concentration from 50 pg/mL to 375 pg/mL. In addition, a dilutional quality control sample prepared at 500 pg/mL and subjected to the same dilutions as used for study samples performed with assay precision of 6.2% CV.
Reference ID: 3053760
NDA 22-200, Resubmssion Bydureon (Exenatide LAR Once Weekly)
Page 12 of 44
3. Detailed Labeling Recommendations Recommendation: The Office of Clinical Pharmacology/Division of Clinical Pharmacology-2 (OCP/DCP-2) has following labeling recommendations for the revisions to sponsor’s proposed language based on the information reviewed under current supplement. [Note: The underlined blue text is the recommended revision and strikethrough text is the deletion] Reviewer’s Note: The changes recommended to the Clinical Pharmacology Section reflects our effort to separate general mechanism of action and the information on pharmacodynamic effect data that is evaluated in clinical studies, to make it consistent with other PLRs. These changes, if mutually agreed upon, would also apply to the Byetta label. Under Section 12 CLINICAL PHARMACOLOGY 12.1 Mechanism of Action Incretins, such as glucagon-like peptide-1 (GLP-1), enhance glucose-dependent insulin secretion and exhibit other antihyperglycemic actions following their release into the circulation from the gut. BYDUREON is a GLP-1 receptor agonist that enhances glucose-dependent insulin secretion by the pancreatic beta-cell, suppresses inappropriately elevated glucagon secretion, and slows gastric emptying.
The amino acid sequence of exenatide partially overlaps that of human GLP-1. Exenatide is a GLP-1 receptor agonist that has been shown to bind and activate the human GLP-1 receptor in vitro. This leads to an increase in both glucose-dependent synthesis of insulin and in vivo secretion of insulin from pancreatic beta cells, by mechanisms involving cyclic AMP and/or other intracellular signaling pathways. Exenatide promotes insulin release from pancreatic beta cells in the presence of elevated glucose concentrations.
Exenatide improves glycemic control by reducing fasting and postprandial glucose concentrations in patients with type 2 diabetes through the actions described below.
Reference ID: 3053760
(b) (4)

NDA 22-200, Resubmssion Bydureon (Exenatide LAR Once Weekly)
Page 13 of 44
12.2 Pharmacodynamics Exenatide improves glycemic control by reducing fasting and postprandial glucose concentrations in patients with type 2 diabetes through the actions described below.
Reference ID: 3053760
(b) (4)
(b) (4)
NDA 22-200, Resubmssion Bydureon (Exenatide LAR Once Weekly)
Page 15 of 44
Gastric emptying: Exenatide slows gastric emptying, thereby reducing the rate at which meal-derived glucose appears in the circulation.
Food intake: In both animals and humans, administration of exenatide has been shown to reduce food intake.
Fasting and Postprandial Glucose: BYDUREON decreases fasting plasma glucose within the first two weeks of initiation of therapy. When steady-state plasma concentrations of exenatide are achieved, decreased fasting glucose concentrations are maintained and postprandial glucose concentrations are also decreased [see Clinical Studies (14.1)].
Cardiac Electrophysiology
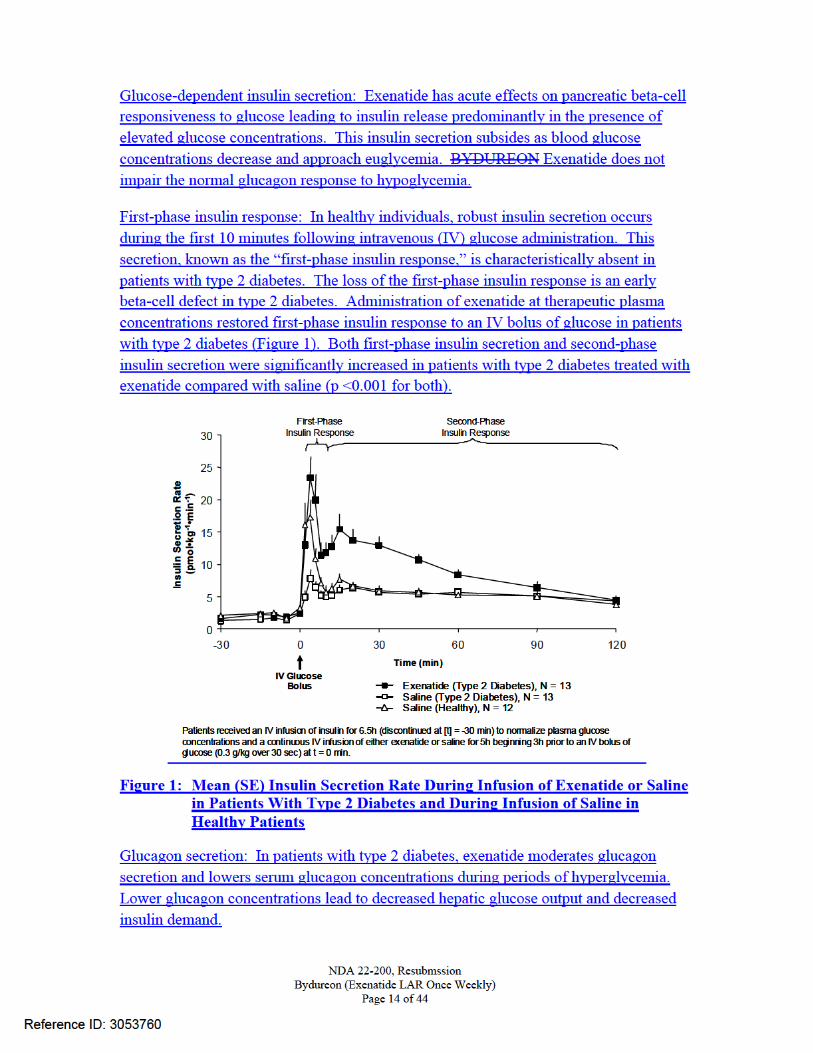
The effect of exenatide following an intravenous infusion on QTc interval was evaluated in a randomized, placebo- and active-controlled (moxifloxacin 400 mg) three-period cross over thorough QT study in 79 healthy subjects. The upper bound of the one sided 95% confidence interval for the largest placebo adjusted, baseline-corrected QTc based on population correction method (QTcP) was below 10 ms, the threshold for regulatory concern. In this study, the baseline corrected mean increase from placebo (90% CI) in heart rate associated with geometric mean exenatide concentrations of 253, 399 and 627 pg/mL was 12.3 (11.2, 13.5), 14.4 (13.2, 15.6) and 15.6 (14.3, 16.8) bpm, respectively.
12.3 Pharmacokinetics
Absorption:
A single dose of BYDUREON exhibits multiphasic release of exenatide over approximately 10 weeks, with an initial period representing rapid release of surface bound exenatide followed by a gradual release and 2 subsequent peaks at around week 2 and week 6-7, respectively, representing the hydration and erosion of the microspheres.
Following initiation of weekly administration of 2 mg BYDUREON, gradual increase in the plasma exenatide concentration is observed over 6 to 7 weeks. After 6 to 7 weeks,
Reference ID: 3053760
(b) (4)
(b) (4)

---------------------------------------------------------------------------------------------------------This is a representation of an electronic record that was signedelectronically and this page is the manifestation of the electronicsignature.---------------------------------------------------------------------------------------------------------/s/----------------------------------------------------
MANOJ KHURANA12/05/2011
JAYABHARATHI VAIDYANATHAN12/05/2011
Reference ID: 3053760
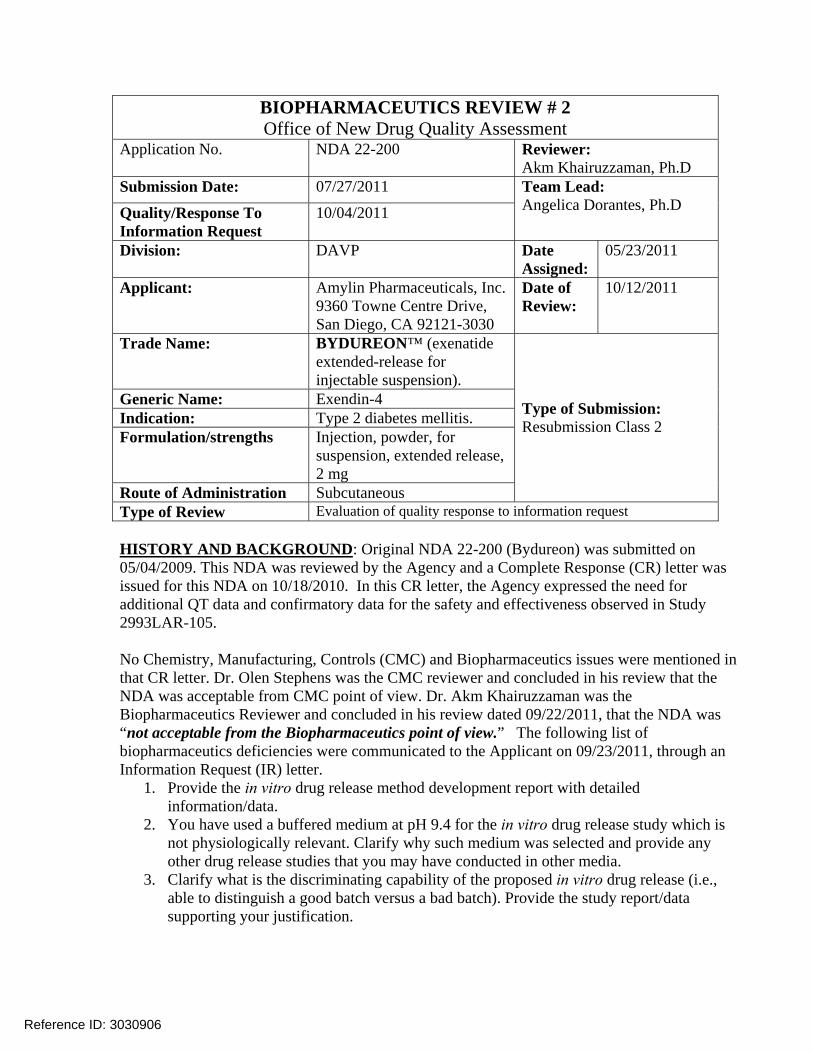
BIOPHARMACEUTICS REVIEW # 2 Office of New Drug Quality Assessment
Application No. NDA 22-200 Reviewer: Akm Khairuzzaman, Ph.D
Submission Date: 07/27/2011
Quality/Response To Information Request
10/04/2011 Team Lead: Angelica Dorantes, Ph.D
Division: DAVP Date Assigned:
05/23/2011
Applicant: Amylin Pharmaceuticals, Inc. 9360 Towne Centre Drive, San Diego, CA 92121-3030
Date of Review:
10/12/2011
Trade Name: BYDUREON™ (exenatide extended-release for injectable suspension).
Generic Name: Exendin-4 Indication: Type 2 diabetes mellitis. Formulation/strengths Injection, powder, for
suspension, extended release, 2 mg
Route of Administration Subcutaneous
Type of Submission: Resubmission Class 2
Type of Review Evaluation of quality response to information request HISTORY AND BACKGROUND: Original NDA 22-200 (Bydureon) was submitted on 05/04/2009. This NDA was reviewed by the Agency and a Complete Response (CR) letter was issued for this NDA on 10/18/2010. In this CR letter, the Agency expressed the need for additional QT data and confirmatory data for the safety and effectiveness observed in Study 2993LAR-105. No Chemistry, Manufacturing, Controls (CMC) and Biopharmaceutics issues were mentioned in that CR letter. Dr. Olen Stephens was the CMC reviewer and concluded in his review that the NDA was acceptable from CMC point of view. Dr. Akm Khairuzzaman was the Biopharmaceutics Reviewer and concluded in his review dated 09/22/2011, that the NDA was “not acceptable from the Biopharmaceutics point of view.” The following list of biopharmaceutics deficiencies were communicated to the Applicant on 09/23/2011, through an Information Request (IR) letter.
1. Provide the in vitro drug release method development report with detailed information/data.
2. You have used a buffered medium at pH 9.4 for the in vitro drug release study which is not physiologically relevant. Clarify why such medium was selected and provide any other drug release studies that you may have conducted in other media.
3. Clarify what is the discriminating capability of the proposed in vitro drug release (i.e., able to distinguish a good batch versus a bad batch). Provide the study report/data supporting your justification.
Reference ID: 3030906


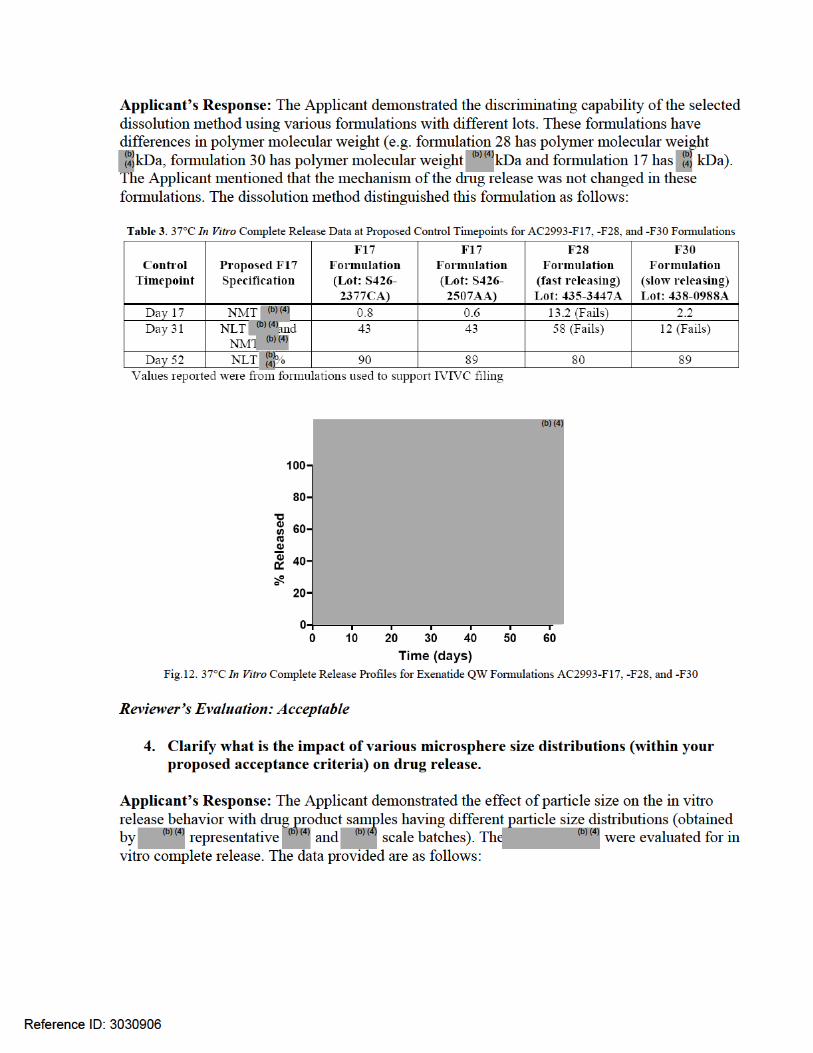

RECOMMENDATION: The Applicant’s responses for the Biopharmaceutics deficiencies included in the Information Requested Letter dated 09/23/2011 are acceptable. Therefore, from the Biopharmaceutics view point NDA 22-200 for BYDUREON™ (exenatide extended-release for injectable suspension) is recommended for approval. Akm Khairuzzaman, Ph.D. Angelica Dorantes, Ph.D. Biopharmaceutics Reviewer, ONDQA Biopharmaceutics Team Leader, ONDQA
Reference ID: 3030906
---------------------------------------------------------------------------------------------------------This is a representation of an electronic record that was signedelectronically and this page is the manifestation of the electronicsignature.---------------------------------------------------------------------------------------------------------/s/----------------------------------------------------
AKM KHAIRUZZAMAN10/19/2011Acceptable from Biopharmaceutics point of view.
ANGELICA DORANTES10/19/2011
Reference ID: 3030906
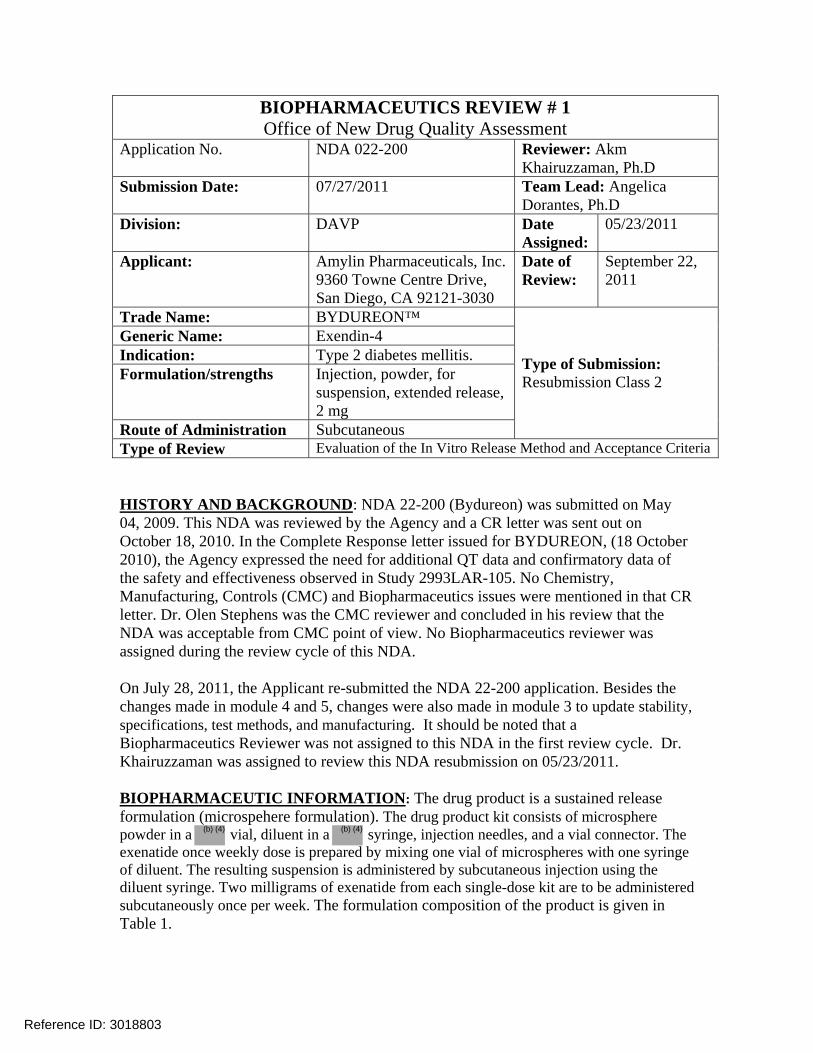
BIOPHARMACEUTICS REVIEW # 1 Office of New Drug Quality Assessment
Application No. NDA 022-200 Reviewer: Akm Khairuzzaman, Ph.D
Submission Date: 07/27/2011 Team Lead: Angelica Dorantes, Ph.D
Division: DAVP Date Assigned:
05/23/2011
Applicant: Amylin Pharmaceuticals, Inc. 9360 Towne Centre Drive, San Diego, CA 92121-3030
Date of Review:
September 22, 2011
Trade Name: BYDUREON™ Generic Name: Exendin-4 Indication: Type 2 diabetes mellitis. Formulation/strengths Injection, powder, for
suspension, extended release, 2 mg
Route of Administration Subcutaneous
Type of Submission: Resubmission Class 2
Type of Review Evaluation of the In Vitro Release Method and Acceptance Criteria HISTORY AND BACKGROUND: NDA 22-200 (Bydureon) was submitted on May 04, 2009. This NDA was reviewed by the Agency and a CR letter was sent out on October 18, 2010. In the Complete Response letter issued for BYDUREON, (18 October 2010), the Agency expressed the need for additional QT data and confirmatory data of the safety and effectiveness observed in Study 2993LAR-105. No Chemistry, Manufacturing, Controls (CMC) and Biopharmaceutics issues were mentioned in that CR letter. Dr. Olen Stephens was the CMC reviewer and concluded in his review that the NDA was acceptable from CMC point of view. No Biopharmaceutics reviewer was assigned during the review cycle of this NDA. On July 28, 2011, the Applicant re-submitted the NDA 22-200 application. Besides the changes made in module 4 and 5, changes were also made in module 3 to update stability, specifications, test methods, and manufacturing. It should be noted that a Biopharmaceutics Reviewer was not assigned to this NDA in the first review cycle. Dr. Khairuzzaman was assigned to review this NDA resubmission on 05/23/2011. BIOPHARMACEUTIC INFORMATION: The drug product is a sustained release formulation (microspehere formulation). The drug product kit consists of microsphere powder in a vial, diluent in a syringe, injection needles, and a vial connector. The exenatide once weekly dose is prepared by mixing one vial of microspheres with one syringe of diluent. The resulting suspension is administered by subcutaneous injection using the diluent syringe. Two milligrams of exenatide from each single-dose kit are to be administered subcutaneously once per week. The formulation composition of the product is given in Table 1.
Reference ID: 3018803
(b) (4) (b) (4)


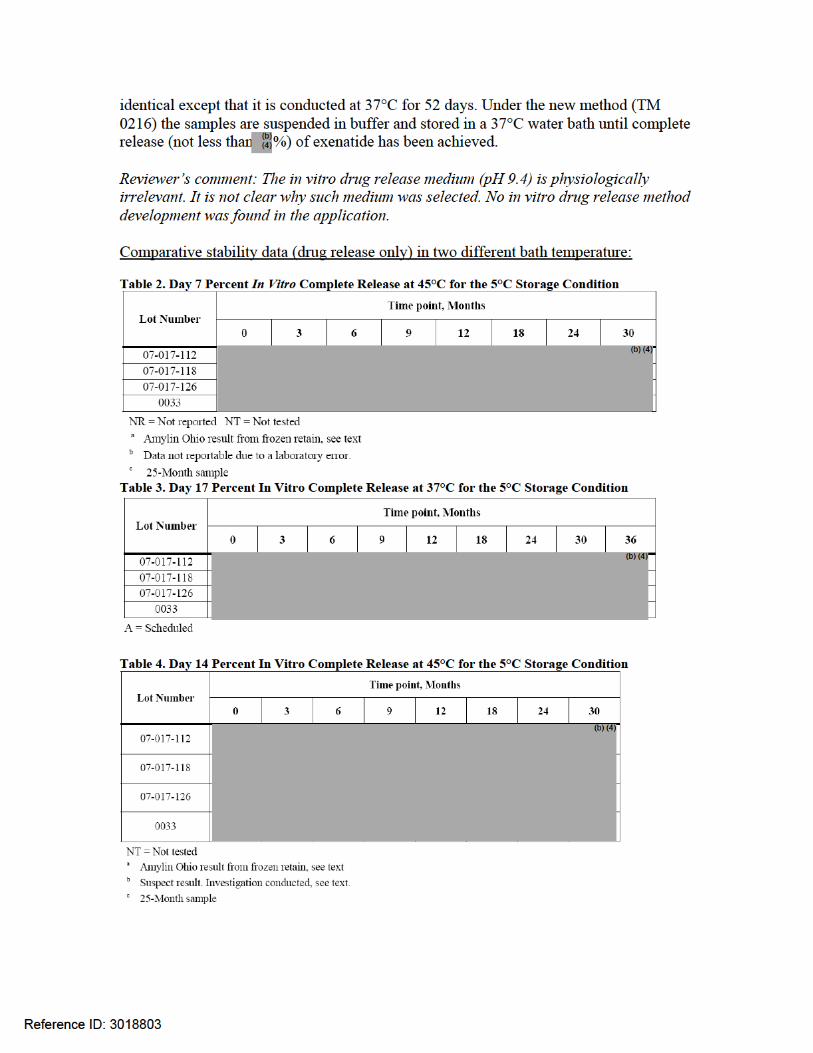

(iii) The newly proposed dissolution limits at Day 31 of NLT % and NMT % violates the ICH Q6 A guideline where a maximum total variability of 20% is allowed for an extended release formulation without the support of IVIVC.
RECOMMENDATION: NDA 22-200 cannot be approved from biopharmaceutics point of view until satisfactory responses to the following deficiencies are provided by the applicant:
1. Provide detailed in vitro drug release method development report. You have used a buffered medium at pH 9.4 for the in vitro drug release study which is not physiologically relevant. Clarify why such medium was selected and provide any other drug release studies that you may have conducted in other medium.
2. Clarify what is the discriminating capability of this in vitro drug release study to distinguish a good batch versus bad batch? Provide study report/data in support of your justification. What is the impact of various microsphere size distributions (within your proposed specification) on drug release?
3. The newly proposed dissolution limits at Day 31 of NLT % and NMT % violates the ICH Q6 A guideline where a maximum total variability of 20% is allowed for an extended release formulation without the support of IVIVC
Akm Khairuzzaman, Ph.D. Angelica Dorantes, PhD. Biopharmaceutics Reviewer, ONDQA Biopharmaceutics Team Leader, ONDQA
Reference ID: 3018803
(b) (4)
(b) (4)
(b) (4)
(b) (4)
---------------------------------------------------------------------------------------------------------This is a representation of an electronic record that was signedelectronically and this page is the manifestation of the electronicsignature.---------------------------------------------------------------------------------------------------------/s/----------------------------------------------------
AKM KHAIRUZZAMAN09/22/2011Biopharmaceutics deficiencies were identified; they need to be communicated to the applicant.
ANGELICA DORANTES09/22/2011
Reference ID: 3018803

1
CLINICAL PHARMACOLOGY MEMORANDUM NDA: 22-200 Drug: Bydureon (Exenatide extended release) Sponsor: Amylin Indication: Treatment of type 2 diabetes Reviewer: Jayabharathi Vaidyanathan, Ph.D. Team Leader: Sally Choe, Ph.D. Submission Date: 4/22/10 Memo Date: September 14, 2010 Background Bydureon NDA was submitted on May 4, 2009. A Complete Response (CR) was sent to the sponsor on March 12, 2010 mainly due to lack of a Risk Evaluation and Mitigation Strategy (REMS) and product quality issues. The application was acceptable from a Clinical Pharmacology perspective at that time and labeling comments were sent to the sponsor. Please refer to the Clinical Pharmacology review dated 1/22/10 for the original NDA 22-200 (Bydureon) and addendum dated 9/28/10 for details. The sponsor submitted a response to the deficiencies outlined in the previous action letter and the NDA was resubmitted on 4/22/10. During the first review cycle, QT interval prolongation was not identified to be an issue with Bydureon. The QT-IRT in a consult dated 12/17/2009 concluded that there are no apparent QT-prolonging effects of exenatide when administered as the extended release (Bydureon) or immediate release (Byetta) formulations. Their conclusion was based on the ECG data evaluated for study 2993LAR-105 and in a meta-analysis of studies 2993-112, 2993-113 and 2993-115. The QT-IRT also stated that small increases in the QTc interval (<10 ms) cannot be ruled out because a dedicated TQT study with positive and placebo controls was not conducted. A TQT study was not recommended for Bydureon at that time because it was incorrectly stated in the IRT review (dated 12/17/2009) that the average exposures achieved with Bydureon are lower than the approved formulation (Byetta). In fact, Bydureon exposure is higher than those achieved following administration of Byetta and according to ICH E14, a TQT study is applicable to a new route of administration/new formulation of an approved product if it results in significantly higher exposure.
2
In June 2010, DMEP received a telephone communication from Health Canada regarding thorough QT (TQT) study H80-EW-GWCI which was not conducted under a US IND and hence the results were not submitted to the FDA. Health Canada concluded that exenatide prolongs the QT and PR intervals and increases the heart rate. The Division advised the sponsor to submit the results of the TQT study. The sponsor submitted this study and the QT-IRT was consulted to conduct the review. Please refer to the IRT review dated 8/16/10 in DARRTS for details. The sponsor claims that the TQT study is a negative study and the positive correlation that was observed between plasma exenatide concentrations and changes from baseline in QTcF was mainly driven by subjects with exenatide concentrations less than 300 pg/mL. They indicated that patients whose concentrations were ≥ 400 pg/mL had QTcF changes below the regression line. Additionally ECG assessments in the Bydureon pivotal Phase 3 trial (LAR-105) did not show significant correlation between plasma exenatide concentrations and the change in QTcF intervals from baseline to Week 14 and Week 30 or early termination. The IRT concluded the followings in their review of the TQT study –
• “The TQT study results can only be applied for Byetta. No significant QT prolongation effect was detected in this TQT study. The largest upper bound of the 2-sided 90% confidence interval (CI) for the mean difference between exenatide 10 µg and placebo was below 10 ms, the threshold for regulatory concern as described in ICH E14 guidance. The largest lower bound of the two-sided 90% CI for the placebo-adjusted, baseline-corrected QTcF (∆∆QTcF) for moxifloxacin was greater than 5 ms, and the moxifloxacin profile over time is adequately demonstrated, indicating that assay sensitivity was established. Therapeutic dose of Byetta is adequate to represent the high clinical exposure scenario. Repeated twice daily dosing yields no substantial systemic accumulation of exenatide (half-life of approximately 2 hours after SC administration). No drug-drug interactions have been observed that would significantly increase exposure. Exenatide exposure in patients with mild to moderate renal impairment is similar to that of patients with normal renal function. Byetta should not be used in patients with severe renal impairment or end-stage renal disease.”
• “No definitive conclusion for the effect of Bydureon on QTc interval can be
drawn based on the TQT study for the following two reasons. o The mean maximum concentration (Cmax) of exenatide observed in the
TQT study is 208 pg/mL, which is half the steady state concentration following the therapeutic dose of Bydureon. In addition, following treatment with Bydureon, the clinical exposure of exenatide in patients with moderate renal impairment is expected to be 50-60% higher compared to that in patients with normal renal function.
o Bydureon may potentially cause QTc prolongation. The current TQT study indicated that exenatide appears to increase QTc interval in a concentration-dependant manner (P = 0.003). The projected upper bound

3
of 90% CI for QTc interval following steady state Cmax of exenatide using Bydureon may exceed 10 ms, given the caveat that the model predictions are mainly based on extrapolation.”
The ICH E14 guidance “Clinical Evaluation of QT/QTc Interval Prolongation and Proarrhythmic Potential for Non-Antiarrhythmic Drugs” states the following:
“While this document is concerned primarily with the development of novel agents, the recommendations might also be applicable to approved drugs when a new dose or route of administration is being developed that results in significantly higher exposure (i.e., Cmax or AUC)”.
Bydureon has higher exposure than Byetta and therefore according to the guidance, a TQT study will be needed. This TQT study should be conducted pre-marketing because the results of the Byetta TQT study showed a positive concentration-QTc relationship, indicating that patients taking Bydureon would have prolonged QT interval. Considering this information regarding the potential of QT prolongation by Bydureon, we disagree with the sponsor’s conclusion that there is no effect of Bydureon on QT interval. Although the ECG analysis of Phase 3 data did not detect a signal, these analyses are not sensitive as the TQT study to detect small increases in QT (e.g., 10 ms). Additionally as per the ICH guidance, the higher exposure of exenatide resulting from Bydureon qualifies for the need of a TQT study. Therefore, it is recommended that the sponsor characterize the QTc and other ECG interval changes following treatment with Bydureon. Due to the PK characteristics of Bydureon (e.g., its sustained release properties, delayed second peak), it is recommended that the TQT study be conducted with Byetta (exenatide immediate release). The sponsor should evaluate higher doses of Byetta to obtain exposures that are relevant to those obtained following administration of Bydureon. To note, based on original clinical pharmacology review for Byetta NDA, it appears that a dose range of 0.01 µg/kg to 0.4 µg/kg (or 28 µg in a 70 kg person) was evaluated in clinical studies with exenatide and the sponsor could potentially use a 28 µg dose to achieve concentrations (observed mean Cmax following single dose of Byetta 0.4 µg/kg was 572.83 pg/mL in study 2993-102) that can reach the levels seen in moderate renal impaired patients following administration of 2 mg dose of Bydureon (Average steady state concentration = 486 pg/mL).
Recommendations: The submission containing response to deficiencies in the CR letter for NDA 22-200 (Bydureon) was reviewed by the Office of Clinical Pharmacology/Division of Clinical Pharmacology-II (OCP/DCP-II) and based on the recent QT information it is found to be unacceptable. The following recommendation should be sent to the sponsor as appropriate.
It is recommended that the sponsor characterize the QTc and other ECG interval changes following treatment with Bydureon. Since the PK characteristics of Bydureon make it difficult to evaluate in a thorough QT (TQT) study, it is recommended that the TQT study can be conducted with Byetta at a higher dose (e.g., 28 µg), so that higher plasma exenatide concentrations are achieved. Prior to conducting the TQT study, the protocol should be submitted to the QT-IRT for review.

Reference ID: 2849403
---------------------------------------------------------------------------------------------------------This is a representation of an electronic record that was signedelectronically and this page is the manifestation of the electronicsignature.---------------------------------------------------------------------------------------------------------/s/----------------------------------------------------
JAYABHARATHI VAIDYANATHAN10/13/2010
CHRISTINE E GARNETT10/13/2010
SALLY Y CHOE10/13/2010
CHANDRAHAS G G SAHAJWALLA10/14/2010

1
CLINICAL PHARMACOLOGY ADDENDUM NDA: 22-200 Drug: Bydureon (Exenatide extended release) Sponsor: Amylin Indication: Treatment of type 2 diabetes Reviewer: Jayabharathi Vaidyanathan, Ph.D. Team Leader: Sally Choe, Ph.D. Submission Date(s): 4/22/10, 6/2/10 Memo Date: 8/30/10 Subject: Addendum to Clinical Pharmacology Review and Labeling Comments Bydureon NDA was submitted on May 4, 2009. A Complete Response was sent to the sponsor on 3/12/10 mainly due to lack of a Risk Evaluation and Mitigation Strategy (REMS) and product quality issues. The application was acceptable from a Clinical Pharmacology perspective and labeling comments were sent to the sponsor. Please refer to the Clinical Pharmacology review dated 1/22/10 for the original NDA 22-200 (Bydureon) for details. On 4/22/10, the sponsor submitted a response to the deficiencies outlined in the previous action letter. The sponsor accepted most of the recommended language pertaining to Clinical Pharmacology and also raised certain comments. This memo is to summarize the subsequent labeling discussions and response to sponsor’s comments. This memo also amends language regarding renal impaired patients that was in the original clinical pharmacology review dated 1/22/10. Amendment of Clinical Pharmacology Review: Page 5 under Renal Impairment: Current language: “No dose adjustment is proposed for mild and moderate renal impairment. It is contraindicated in severe and end stage renal impairment.” Amendment: “No dose adjustment is proposed for patients with mild and moderate renal impairment. It is proposed not to be used in patients with severe and end stage renal impairment.”

3
the initiation of Bydureon particularly where exposure can be increased as is seen in the patients with moderate renal impairment. There was no significant exposure change after administration of Byetta in moderate renal impaired patients as compared to normal renal function patients. Therefore, use of caution during Bydureon therapy rather than
is appropriate.
ADVERSE REACTIONS:
Most common (≥5%) and occurring more frequently than placebo in clinical trials: nausea, diarrhea, injection site pruritus, vomiting, constipation, headache, dyspepsia, fatigue, injection site erythema and hypoglycemia (5.3, 6.1).
Sponsor’s proposal on inclusion of increased INR statement in Adverse Reaction section:
The Sponsor proposes retaining the INR statement only within the Drug Interactions section. According to them, prescribers are most likely to seek this information within the Drug Interactions section of the label and state that including the statement within the Adverse Reaction section creates a duplication of information that places undue emphasis on the event.
FDA comment:
We concur with the sponsor’s proposal.
2 DOSAGE AND ADMINSITRATION 2.1 Recommended Dosing
Missed Dose
Changing Weekly Dosing Schedule
(b) (4)
(b) (4)
4
.
Sponsor’s proposal for changing weekly dosing schedule:
The sponsor has indicated that a single dose of BYDUREON gradually releases exenatide over approximately 10 weeks, variations in dose timing within a week will not meaningfully alter steady-state plasma concentrations of exenatide. The majority of the exenatide exposure from a single injection is observed between 4 and 10 weeks after administration with a peak observed at approximately 7 weeks. Weekly dosing results in slow accumulation until steady state is achieved in 6 to 7 weeks after which peak-to-trough ratios are low. If a patient was at steady state and were to administer two doses 1 day apart, peak plasma concentrations would increase approximately 10% -15%. This degree of variability in exenatide levels would not impact the safety and tolerability profile of BYDUREON. Thus, requiring a patient to
to resume their usual schedule after a missed dose or to set a new dosing schedule is not warranted.
FDA comment:
Based on the QT-IRT review dated 8/16/10, Bydureon may potentially cause QT prolongation. The TQT study indicated that exenatide appears to increase QTc interval in a concentration-dependant manner. Based on the concentration-response relationship, for each 100 pg/mL concentration of exenatide the predicted increase is about 2 ms. Therefore, potentially this may reach average increase of 10 ms for concentration of 500 pg/mL. For Byetta, this is not a concern, however for Bydureon this could be potentially a safety issue (for example, moderate renal impairment increases exposure by ~60% and with average steady-state concentration of 300 pg/mL, the levels in these patients can reach 500 pg/mL). Following administration of 2 doses on consecutive days, we do not expect the average steady-state concentration to change significantly, however, we cannot rule of the initial increase in peak concentration. Since the concern over the concentration relation to QT is raised, we recommend minimizing the cases where the exposure may increase. Therefore, we recommend to keep the weekly interval in case of missed dosing. 5.4 Renal Impairment
BYDUREON should not be used in patients with severe renal impairment (creatinine clearance < 30 mL/min) or end-stage renal disease and should be used with caution in patients with renal transplantation [see Use in Specific Populations (8.6)]. In patients with end-stage renal disease receiving dialysis, single doses of BYETTA 5 mcg were not well tolerated due to gastrointestinal side effects. Because BYDUREON may induce nausea and vomiting with transient hypovolemia, treatment may worsen renal function.
(b) (4)
(b) (4)
(b) (4)

5
renal impairment (creatinine clearance 30 to 50 mL/min) [see Use in Specific Populations (8.6) Clinical Pharmacology (12.3)]. BYDUREON has not been studied in patients with end-stage renal disease or severe renal impairment.
8.6 Renal Impairment BYDUREON is not recommended for use in patients with end-stage renal disease or severe renal impairment (creatinine clearance <30 mL/min) and should be used with caution in patients with renal transplantation.
(creatinine clearance 30 to 50 mL/min) [see Warnings and Precautions (5.4) and Clinical Pharmacology (12.3)].
12.3 Pharmacokinetics Renal Impairment BYDUREON has not been studied in subjects with severe renal impairment (creatinine clearance <30 mL/min) or end-stage renal disease receiving dialysis. Population pharmacokinetic analysis of renal impaired patients receiving 2 mg BYDUREON indicate that there is a 62% and 33% increase in exposure in moderate (N=10) and mild (N=56) renal impaired patients, respectively as compared to normal (N=84) renal function patients. Sponsor’s proposal regarding exposure in moderate renal impairment: The Sponsor's analysis of exenatide exposure in subjects with mild and moderate renal impairment indicated increases of respectively, when compared to those subjects with normal renal function. The Sponsor requested clarification of the derivation of the values the Agency included in text regarding this. FDA comment: The sponsor’s analysis % increase in moderate and mild renal impaired patients) is resulting from the median individual predicted exenatide steady-state concentration, while the Agency’s analysis (53% and 24% increase in exposure in moderate and mild renal impaired patients), was done using the mean observed steady-state exenatide concentration from one visit for each patient. On further internal discussion, it was agreed that use of the mean observed steady-state concentrations from all the visits is more appropriate and is indicated in the proposed language.
(b) (4)
(b) (4)
(b) (4)
(b) (4)
6
Drug Interactions On 9/17/10, the sponsor submitted a proposal for a minor correction to the Clinical Pharmacology, Drug Interaction, Oral Contraceptive language in the Byetta label (NDA 21-773). The existing language incorrectly cites a µg" dose of ethinyl estradiol. The actual dose was "30 µg" as noted in the clinical study report submitted to the Agency under NDA 021-773 on March 27, 2007. This change will also reflect in the Bydureon label. FDA comment: This proposal to correct the ethinyl estradiol dose from µg to 30 µg in the Clinical Pharmacology, Drug Interaction, Oral Contraceptive language is acceptable.
(b) (4)
(b) (4)

Reference ID: 2842454
---------------------------------------------------------------------------------------------------------This is a representation of an electronic record that was signedelectronically and this page is the manifestation of the electronicsignature.---------------------------------------------------------------------------------------------------------/s/----------------------------------------------------
JAYABHARATHI VAIDYANATHAN09/29/2010
SALLY Y CHOE09/29/2010
1
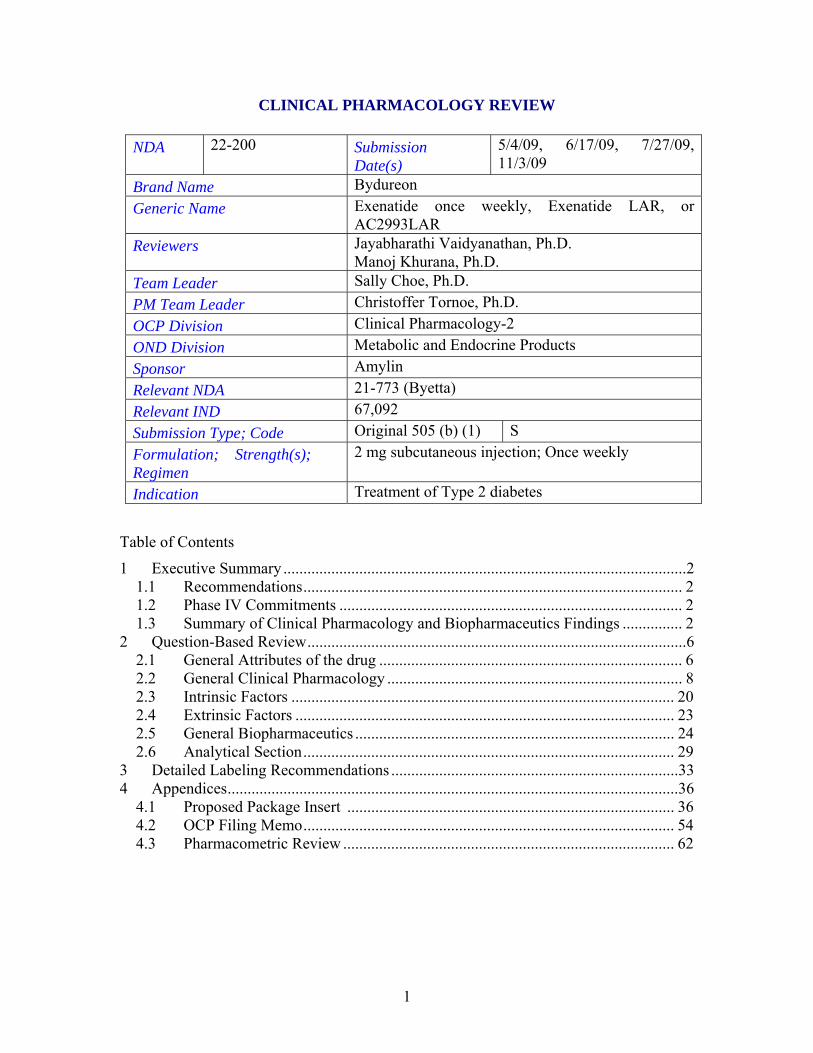
CLINICAL PHARMACOLOGY REVIEW
NDA 22-200 Submission Date(s)
5/4/09, 6/17/09, 7/27/09, 11/3/09
Brand Name Bydureon Generic Name Exenatide once weekly, Exenatide LAR, or
AC2993LAR Reviewers Jayabharathi Vaidyanathan, Ph.D.
Manoj Khurana, Ph.D. Team Leader Sally Choe, Ph.D. PM Team Leader Christoffer Tornoe, Ph.D. OCP Division Clinical Pharmacology-2 OND Division Metabolic and Endocrine Products Sponsor Amylin Relevant NDA 21-773 (Byetta) Relevant IND 67,092 Submission Type; Code Original 505 (b) (1) S Formulation; Strength(s); Regimen
2 mg subcutaneous injection; Once weekly
Indication Treatment of Type 2 diabetes Table of Contents
1 Executive Summary .....................................................................................................2 1.1 Recommendations............................................................................................... 2 1.2 Phase IV Commitments ...................................................................................... 2 1.3 Summary of Clinical Pharmacology and Biopharmaceutics Findings ............... 2
2 Question-Based Review...............................................................................................6 2.1 General Attributes of the drug ............................................................................ 6 2.2 General Clinical Pharmacology .......................................................................... 8 2.3 Intrinsic Factors ................................................................................................ 20 2.4 Extrinsic Factors ............................................................................................... 23 2.5 General Biopharmaceutics ................................................................................ 24 2.6 Analytical Section............................................................................................. 29
3 Detailed Labeling Recommendations ........................................................................33 4 Appendices.................................................................................................................36
4.1 Proposed Package Insert .................................................................................. 36 4.2 OCP Filing Memo............................................................................................. 54 4.3 Pharmacometric Review ................................................................................... 62

2
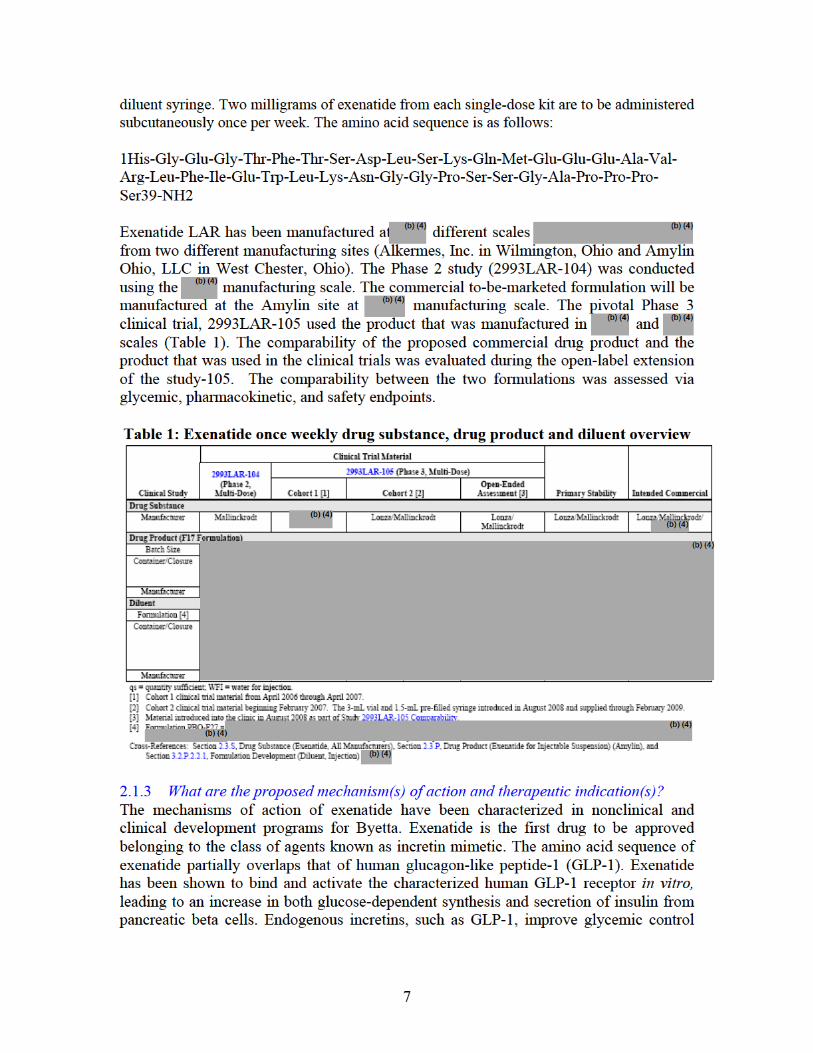
1 Executive Summary Bydureon is a subcutaneously (SC) injectable extended-release formulation of exenatide proposed to be given once weekly and contains the same active ingredient as the approved Byetta. Byetta (exenatide) injection is approved in the United States as an adjunct to diet and exercise to improve glycemic control in adults with type 2 diabetes mellitus. Byetta is administered twice daily (BID) at doses of 5 μg or 10 μg by subcutaneous (SC) injection. Byetta is administered within the 60-minute period before the morning and evening meals and primarily exerts its pharmacodynamic effects on glucose concentrations during the postprandial period of those meals. Bydureon is proposed to be administered once weekly at any time of the day, with or without meals. The proposed indication for Bydureon is similar to Byetta - As an adjunct to diet and exercise to improve glycemic control in adults with type 2 diabetes mellitus. 1.1 Recommendation The Office of Clinical Pharmacology / Division of Clinical Pharmacology-II (OCP/DCP- II) has reviewed NDA 22-200 for Bydureon (exenatide once weekly or exenatide LAR) and finds it acceptable provided that the Agency and the sponsor agree on the labeling. OCP briefing was held on 1/6/10. 1.2 Phase IV Commitments None 1.3 Summary of Important Clinical Pharmacology Findings The exenatide once weekly/LAR formulation consists of biodegradable polymeric microspheres that entrap exenatide and provide extended release. The microspheres are composed of exenatide and are incorporated into a matrix of poly-(D,L lactide-co-glycolide) (PLG), a biodegradable polymer that has been previously used in approved drug products. When injected into the subcutaneous space, the polymer biodegrades over time, resulting in an extended duration of peptide release. The clinical pharmacology of exenatide once weekly program utilizes susbstantial information from the approved Byetta (immediate release exenatide). Exenatide LAR has been manufactured at different scales ) from two different manufacturing sites (Alkermes, Inc. in Wilmington, Ohio and Amylin Ohio, LLC in West Chester, Ohio) during its development. The Phase 2 study (2993LAR-104) was conducted using the manufacturing scale. The pivotal Phase 3 clinical trial, 2993LAR-105 used product that was manufactured in and scales. These products were manufactured at the Alkermes site. The commercial to-be-marketed formulation will be manufactured at a different site, (Amylin site) at manufacturing scale.
(b) (4)
(b) (4)
(b) (4) (b) (4)
(b) (4) (b) (4)
(b) (4)

3
Pharmacokinetics
• Following a single exenatide once weekly injection in type 2 diabetes patients, mean plasma exenatide concentrations generally return to pre-injection values after approximately 10 weeks for all dose groups (2.5 mg, 5.0 mg, 7.0 mg, and 10.0 mg). Overall exposure to exenatide LAR progressively increased with dose for each of the four treatment groups as determined by the PK parameters.
• The multiple-dose pharmacokinetics of exenatide once weekly was evaluated in Phase 2 Study 2993LAR-104 and subsequently in the long-term Phase 3 Study 2993LAR-105. In the Phase 2 study, two doses (0.8 mg and 2 mg) of exenatide LAR were evaluated. Dose-dependent increases in mean plasma exenatide were observed following the two doses. From Week 7 through the remainder of the treatment period, mean plasma exenatide concentrations remained relatively constant for both LAR groups, indicating that steady-state concentrations are achieved in approximately 7 weeks. At Week 14-15, mean (SD) plasma exenatide steady-state concentrations for the 0.8 mg and 2 mg exenatide LAR groups were 117.86 (59.05) pg/mL and 288.8 (134.02) pg/mL, respectively. Similar steady-state concentrations were achieved in the Phase 3 study.
• Based on the population PK analysis, the estimated variability of predicted steady-state exenatide concentration for inter- and intra-subject variability was 44.2 % CV and 54.8% (residual variability %CV), respectively.
• Baseline creatinine clearance (CrCL) was determined to be the most significant predictor of steady-state concentration of exenatide following once weekly dosing based on population PK analysis. There was a 53% increase in the observed average steady-state concentrations in the moderate renal impaired patients (CrCL = 30-50 mL/min) and 24% in the mild renal impaired patients (CrCL=50-80 ml/min) as compared to patients with normal creatinine clearance.
• Based on the results of the population PK analysis, sponsor’s proposal of no dose adjustment based on age, gender, race and body weight is justified. These covariates do not affect exenatide pharmacokinetics in a clinically meaningful manner.
Exposure (Dose)-Response Relationship
• The exposure-response relationship for effectiveness is evidenced in studies LAR-104 (dose ranging study) and LAR-105 (pivotal efficacy trial). An inhibitory Emax model adequately described the relationship between observed HbA1c and exenatide average steady-state concentrations. Based on this, there is a concentration-dependent decrease in HbA1c from baseline with maximal response at exenatide concentrations greater than 200 pg/mL. There was some overlap of exenatide concentrations following the 0.8 mg and 2 mg dose. However, the median concentrations achieved following 0.8 mg was about 60 pg/mL which is less than the EC50 value (83.5 pg/mL) indicating sub-optimal exposures are achieved following 0.8 mg exenatide LAR dose whereas the majority of patients receiving 2 mg exenatide LAR dose had exposures above EC50 (median ~290 pg/mL).
5
difference between the treatment groups (0.34%) being below the predefined 0.4% margin. In both treatment groups, the HbA1c increased over the course of the comparability period which is expected over the long duration of clinical trial due to the natural progression of the disease.
• In spite of the mean steady-state concentration differences between the two products, the range of concentration (Css) values for Amylin manufactured product was within the range of concentration values observed with Alkermes product. In addition, the HbA1c values and fasting plasma glucose concentration demonstrated substantial overlap, indicating the ranges of exposure and response are similar between the 2 treatment groups.
• In conclusion, although bioequivalence has not been established, the comparability of the two products is established based on the following:
o The concentrations range resulting from the two products are similar and greater than the EC50 (~83 pg/mL).
o The differences in the exposure resulting from different manufacturing scale are in the maximal response region of the exposure-response relationship for exenatide LAR (~200 pg/mL).
Renal Impairment As determined in the population PK analysis, baseline creatinine clearance (CrCL) was determined to be the most significant predictor of steady-state concentration of exenatide following once weekly dosing. There was a 53% increase in the observed average steady-state concentrations in the moderate renal impaired patients (CrCL = 30-50 mL/min) and 24% in the mild renal impaired patients (CrCL=50-80 ml/min) as compared to patients with normal creatinine clearance. The median CrCL in the 10 patients in the pivotal phase 3 trial with moderate renal impairment was 44 mL/min (range = 31.8 – 49.7 mL/min). The maximal model predicted increase in steady-state concentrations for patients approaching CrCL of 30 mL/min (severe renal impairment) is 2-fold. No major adverse events were observed in any patients including the renal impaired patients in the Phase 3 trial (study-105). No dose adjustment is proposed for mild and moderate renal impairment. It is contraindicated in severe and end stage renal impairment. Since there were only 10 patients with moderate renal impairment in the pivotal Phase 3 trial and the possibility of increased exposure (up to 2 fold when approaching CrCL of 30 mL/min), the reviewer is recommending caution when initiating Bydureon in patients with moderate renal impairment. Drug-Drug Interactions (DDI)
• The effect of exenatide LAR on the rate of gastric emptying was assessed by measuring acetaminophen absorption in study LAR-105. Exenatide has the potential to alter the absorption of concomitantly administered oral drugs due to its pharmacological effect of delay of gastric emptying as indicated in Byetta labeling. Assessment of the exenatide effects occurred at Week 14, when steady-


8
through multiple mechanisms of action, including enhancement of insulin secretion, following their release into circulation from the gut in response to food intake. In clinical studies, exenatide has been shown to improve glycemic control by reducing fasting and postprandial plasma glucose concentrations through multiple mechanisms of action, including enhancement of glucose-dependent insulin secretion, enhancement of first-and second-phase insulin secretion, suppression of inappropriately elevated glucagon secretion in a glucose-dependent manner, and slowing the rate of gastric emptying to produce slower absorption of meal-derived glucose. These mechanisms work in concert to reduce glucose concentrations by modulating both glucose appearance into the circulation (slowing of gastric emptying and suppression of glucagon secretion) and glucose disposal (glucose-dependent insulin effects), leading to improvements in glycemic control and reductions in body weight. Bydureon is proposed as an adjunct to diet and exercise to improve glycemic control in adults with type 2 diabetes mellitus. 2.1.4 What are the proposed dosage and route of administration? The proposed dose for Bydureon is 2 mg to be administered once weekly by subcutaneous injection. The dose can be administered at any time of day, with or without meals. The sponsor has indicated that a reduction in the dose of concomitant sulfonylurea may be considered to mitigate the risk of hypoglycemia. 2.2 General Clinical Pharmacology 2.2.1 What are the design features of the clinical pharmacology and clinical studies
used to support dosing or claims? An overview of the study design features and subject populations is presented in Table 2. Various formulations were evaluated in early Phase 1 trials. The formulation that was selected for development was called F17 formulation. The pivotal studies listed in the following table were conducted with the F17 formulation.

9
Table 2: Studies providing clinical pharmacology data regarding exenatide once weekly F17 formulation
As shown, the exenatide once weekly F17 formulation was evaluated in subjects with type 2 diabetes in two single-dose studies (2993LAR-101 and 2993LAR-103), a multiple-dose, placebo-controlled study (2993LAR-104), and a long-term comparator-controlled study (2993LAR-105). 2.2.2 What is the basis for selecting the response endpoints, i.e., clinical or surrogate
endpoints, or biomarkers (collectively called pharmacodynamics, PD) and how are they measured in clinical pharmacology and clinical studies?
The American Diabetes Association (ADA) recommends the use of hemoglobin A1c (HbA1c) levels as an indicator of glycemic control. The sponsor has used the change from baseline in HbA1c at the end of double-blind treatment as the primary efficacy variable in all key efficacy studies. 2.2.3 Are the active moieties in the plasma (or other biological fluid) appropriately
identified and measured to assess pharmacokinetic parameters and exposure response relationships?
Yes. Please refer to the Analytical section for details. 2.2.4 Is there evidence of exposure-response relationship for effectiveness to support
the proposed 2 mg dose? Yes, the exposure-response relationship for effectiveness is evidenced in studies LAR-104 (dose ranging study) and LAR-105 (pivotal efficacy trial) and shown in Figure 1. An
10
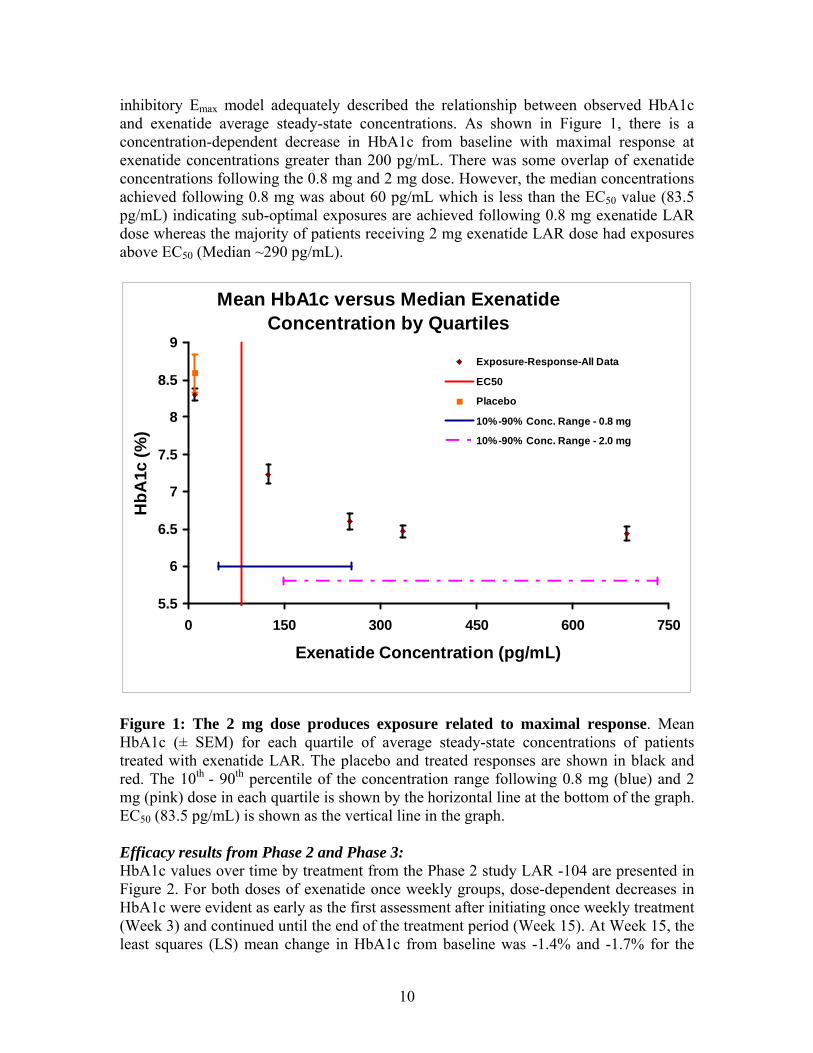
inhibitory Emax model adequately described the relationship between observed HbA1c and exenatide average steady-state concentrations. As shown in Figure 1, there is a concentration-dependent decrease in HbA1c from baseline with maximal response at exenatide concentrations greater than 200 pg/mL. There was some overlap of exenatide concentrations following the 0.8 mg and 2 mg dose. However, the median concentrations achieved following 0.8 mg was about 60 pg/mL which is less than the EC50 value (83.5 pg/mL) indicating sub-optimal exposures are achieved following 0.8 mg exenatide LAR dose whereas the majority of patients receiving 2 mg exenatide LAR dose had exposures above EC50 (Median ~290 pg/mL).
Mean HbA1c versus Median Exenatide Concentration by Quartiles
5.5
6
6.5
7
7.5
8
8.5
9
0 150 300 450 600 750
Exenatide Concentration (pg/mL)
HbA
1c (%
)
Exposure-Response-All Data
EC50
Placebo
10%-90% Conc. Range - 0.8 mg
10%-90% Conc. Range - 2.0 mg
Figure 1: The 2 mg dose produces exposure related to maximal response. Mean HbA1c (± SEM) for each quartile of average steady-state concentrations of patients treated with exenatide LAR. The placebo and treated responses are shown in black and red. The 10th - 90th percentile of the concentration range following 0.8 mg (blue) and 2 mg (pink) dose in each quartile is shown by the horizontal line at the bottom of the graph. EC50 (83.5 pg/mL) is shown as the vertical line in the graph. Efficacy results from Phase 2 and Phase 3: HbA1c values over time by treatment from the Phase 2 study LAR -104 are presented in Figure 2. For both doses of exenatide once weekly groups, dose-dependent decreases in HbA1c were evident as early as the first assessment after initiating once weekly treatment (Week 3) and continued until the end of the treatment period (Week 15). At Week 15, the least squares (LS) mean change in HbA1c from baseline was -1.4% and -1.7% for the

11
0.8-mg and 2-mg exenatide once weekly groups, respectively; the placebo once weekly group had an LS mean increase in HbA1c of 0.3%. According to the sponsor, at Week 30 from the Phase 3 study LAR-105, the LS mean change in HbA1c from baseline in the exenatide once weekly group was -1.9%, a statistically significantly greater decrease than the -1.5% change observed in the Byetta group (p = 0.0023) (Figure 3). In both the exenatide once weekly and Byetta groups, decreases in HbA1c were evident as early as Week 6, the first post-treatment HbA1c measurement. Sponsor stated that significant differences between the treatment groups were observed from Week 10 through Week 30.
Figure 2: Mean (SE) HbA1c values by time and treatment (Study 2993LAR104; Intent-to-Treat Population [N = 45]). (Sponsor’s analysis)
Figure 3: LS Mean (SE) change in HbA1c from baseline to Week 30 by treatment (Study 2993LAR-105; Intent-to-Treat Population [N = 295]). (Sponsor’s analysis)


14
Figure 6 shows the mean HbA1c of patients versus the steady state exenatide concentrations from the two manufacturing scale. Although higher concentrations were achieved from the scale, the majority of the steady-state concentration distribution for the manufacturing scale is encompassed within the range of the manufacturing scale. Also the concentrations are in the proximity of the maximal response indicating that the 36% difference may not be clinically significant.
Mean HbA1c versus Median Exenatide Concentration by Quartiles: Effect of Scale
5.5
5.7
5.9
6.1
6.3
6.5
6.7
6.9
7.1
7.3
7.5
0 500 1000 1500 2000
Exenatide Concentration (pg/mL)
HbA
1c (%
)
Interquartile Concentration Range -
Interquartile Concentration Range -
Figure 6: Mean HbA1c versus manufacturing scale. Mean HbA1c (± SEM) for each quartile of average steady-state concentrations of patients treated with exenatide LAR manufactured in and scale are shown in blue and red, respectively. The concentration range resulting from the two manufacturing scale is shown by the horizontal lines at the bottom of the graph. EC50 (83.5 pg/mL) is shown as the vertical line in the graph. 2.2.6 Does this drug prolong the QT or QTc interval? Exenatide is a peptide and is therefore unlikely to cross cell membrane and interact with ion channels. The cardiovascular safety of exenatide LAR including an evaluation of QT interval was assessed in study LAR-105. Although this was not a thorough QT study, the sponsor has indicated that the statistical analyses followed Agency guidance. According to the CDER QT review team, there were no apparent QT-prolonging effects of exenatide when administered as the extended release or immediate release formulations. However, they state that they cannot rule out small increases in the QTc interval (<10 ms) because a
(b) (4)
(b) (4)
(b) (4)
(b) (4)
(b) (4)
(b) (4)
(b) (4)
(b) (4)
(b) (4)

16
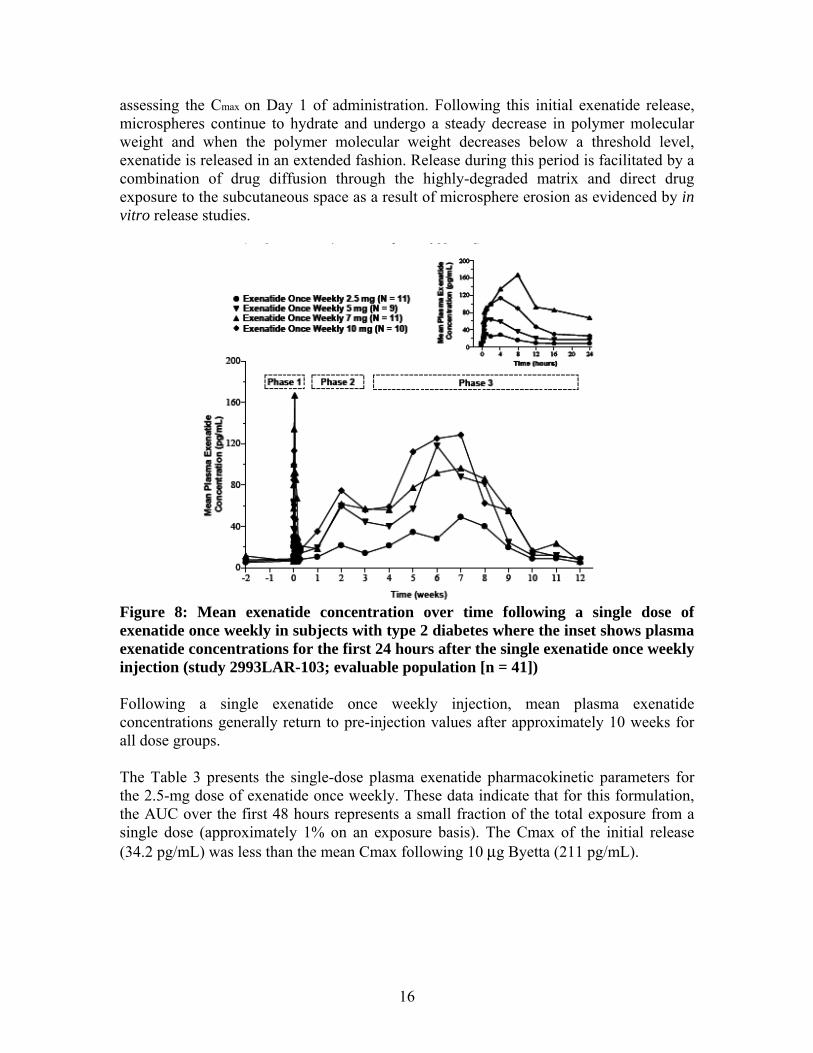
assessing the Cmax on Day 1 of administration. Following this initial exenatide release, microspheres continue to hydrate and undergo a steady decrease in polymer molecular weight and when the polymer molecular weight decreases below a threshold level, exenatide is released in an extended fashion. Release during this period is facilitated by a combination of drug diffusion through the highly-degraded matrix and direct drug exposure to the subcutaneous space as a result of microsphere erosion as evidenced by in vitro release studies.
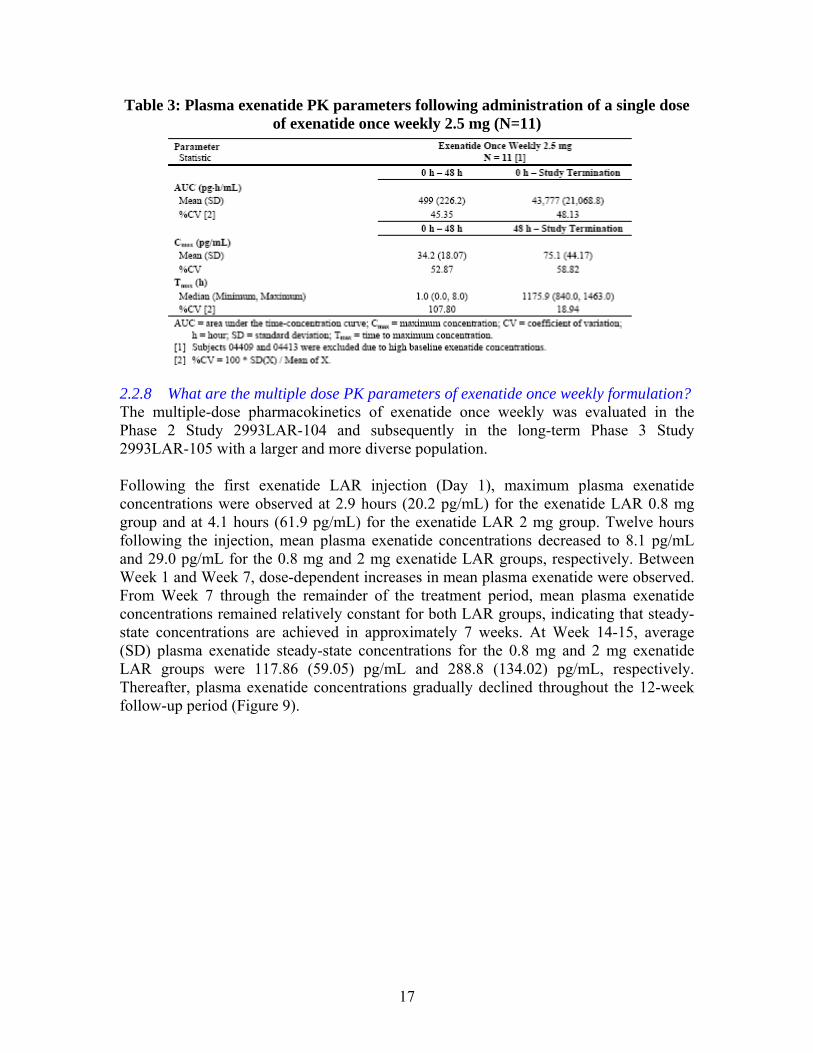
Figure 8: Mean exenatide concentration over time following a single dose of exenatide once weekly in subjects with type 2 diabetes where the inset shows plasma exenatide concentrations for the first 24 hours after the single exenatide once weekly injection (study 2993LAR-103; evaluable population [n = 41]) Following a single exenatide once weekly injection, mean plasma exenatide concentrations generally return to pre-injection values after approximately 10 weeks for all dose groups. The Table 3 presents the single-dose plasma exenatide pharmacokinetic parameters for the 2.5-mg dose of exenatide once weekly. These data indicate that for this formulation, the AUC over the first 48 hours represents a small fraction of the total exposure from a single dose (approximately 1% on an exposure basis). The Cmax of the initial release (34.2 pg/mL) was less than the mean Cmax following 10 μg Byetta (211 pg/mL).
17
Table 3: Plasma exenatide PK parameters following administration of a single dose of exenatide once weekly 2.5 mg (N=11)
2.2.8 What are the multiple dose PK parameters of exenatide once weekly formulation? The multiple-dose pharmacokinetics of exenatide once weekly was evaluated in the Phase 2 Study 2993LAR-104 and subsequently in the long-term Phase 3 Study 2993LAR-105 with a larger and more diverse population. Following the first exenatide LAR injection (Day 1), maximum plasma exenatide concentrations were observed at 2.9 hours (20.2 pg/mL) for the exenatide LAR 0.8 mg group and at 4.1 hours (61.9 pg/mL) for the exenatide LAR 2 mg group. Twelve hours following the injection, mean plasma exenatide concentrations decreased to 8.1 pg/mL and 29.0 pg/mL for the 0.8 mg and 2 mg exenatide LAR groups, respectively. Between Week 1 and Week 7, dose-dependent increases in mean plasma exenatide were observed. From Week 7 through the remainder of the treatment period, mean plasma exenatide concentrations remained relatively constant for both LAR groups, indicating that steady-state concentrations are achieved in approximately 7 weeks. At Week 14-15, average (SD) plasma exenatide steady-state concentrations for the 0.8 mg and 2 mg exenatide LAR groups were 117.86 (59.05) pg/mL and 288.8 (134.02) pg/mL, respectively. Thereafter, plasma exenatide concentrations gradually declined throughout the 12-week follow-up period (Figure 9).

18
Figure 9: Mean (SD) Plasma Exenatide Concentrations by Time and Treatment (Study 2993LAR-104; Evaluable Population [N = 31])
Table 4 shows descriptive statistics for pharmacokinetic parameters by sampling period and treatment for the subset of the Evaluable Population (N=27). From Weeks 14 to 15, mean (SD) AUC, Cave, and Cmax/Cmin appeared dose-proportional. Similarly, during the treatment period (Week 1 to 15), mean Cmax appeared dose-proportional. Mean Tmax was similar between the groups.
Table 4: PK parameters by sampling period and treatment (N=27)

19
The steady-state concentrations were also obtained form the Phase 3 trial (LAR-105). Figure 10 shows the mean plasma Exenatide concentrations immediately after dosing on Day 1 and from Week 29 through Week 30. The concentration achieved following the first injection was relatively low compared to the steady-state concentrations. The average steady-state concentrations (Css ave) were similar to that seen in the Phase 2 study. At week 30, the average steady-state concentrations were 300 pg/mL [10th, 90th percentile 145, 702 pg/mL].
Figure 10: Plasma concentration over time on Day 1 (initial administration) as compared to steady-state. 2.2.9 What are the characteristics of drug distribution, metabolism and excretion? Exenatide once weekly formulation provides extended release of exenatide from the injection site into systemic circulation which is slower than the immediate release formulation (Byetta). However, once absorbed into the systemic circulation, the previously established post-absorptive properties of Byetta can be applied to the once-weekly formulation. Please refer to the Clinical Pharmacology review for NDA 21-773 for details. The mean apparent volume of distribution of exenatide following administration of a single 10 μg dose of Byetta is 28.3 L and the mean apparent clearance of exenatide in humans is 9.1 L/h. Nonclinical studies have shown that exenatide is predominantly eliminated by glomerular filtration with subsequent proteolytic degradation. 2.2.10 What is the inter- and intra-subject variability of PK parameters in volunteers
and patients, and what are the major causes of variability? Based on the population PK analysis, the estimated variability of predicted steady-state exenatide concentration for inter- and intra-subject variability estimates was 44.2 % CV and 54.8% (residual variability %CV), respectively.

20
2.3 Intrinsic Factors 2.3.6 What intrinsic factors (e.g., age, gender, race, weight, height, disease, genetic
polymorphism, pregnancy, and organ dysfunction) influence exposure (PK usually) and/or response, and what is the impact of any differences in exposure on efficacy or safety responses?
• Age, gender and race
For exenatide once weekly, age, gender, and race were not determined to be significant covariates of steady-state concentrations in the population pharmacokinetic model (Also refer Eta-covariate plot (Figure 8) in pharmacometric review). Figure 11 presents observed Css ave following administration of exenatide once weekly 2 mg stratified by gender, age, and race. As it can be seen, the majority of the patients included in the population PK analysis was Caucasian (N=135) and very few subjects were from other races. The data indicate that plasma exenatide steady-state concentrations stratified by these different covariates show considerable overlap. Therefore, as with Byetta, there is no need for dosage adjustments to exenatide once weekly based on gender, age, or race.
(a) No effect of gender on exenatide steady-state concentration (pg/mL) (0= Male and 1= Female)
(b) No effect of age on exenatide steady-state concentration (pg/mL) (Dark squares= 0.8 mg and open circles= 2 mg)
Gender
Css
0
500
1000
1500
0 1
• •
(N 98) (N 67)
Age (years)
Css
0
500
1000
1500
20 30 40 50 60 70 80
(c) No effect of race on exenatide steady-state concentration (pg/mL) (1=Caucasian, 2=Black, 3=Asian, 4=Native American, 5=Hispanic and 6= Other)
(b) (4)

21
RACN
Css
0
500
1000
1500
1 2 3 5 6
• ••
••
(N 135) (N 9) (N 1) (N 19) (N 1)
Figure 11: Exenatide steady-state concentration versus gender, age and race
• Renal Impairment Since exenatide is eliminated primarily by renal route, renal impairment is expected to influence the exenatide PK. No specific PK study was conducted with exenatide LAR in patients with renal impairment. Information on PK of exenatide LAR in renal impairment can be obtained from the population PK analysis. Baseline creatinine clearance (CrCL) was determined to be the most significant predictor of steady-state concentration of exenatide following once weekly dosing. As shown in Figure 12, there was a 53% increase in the observed average steady-state concentrations in the moderate renal impaired patients (CrCL = 30-50 mL/min) and 24% in the mild renal impaired patients (CrCL=50-80 ml/min) as compared to patients with normal creatinine clearance. The median CrCL in the 10 patients in the pivotal phase 3 trial with moderate renal impairment was 44 mL/min (range = 31.8 – 49.7 mL/min). The maximal model predicted increase in steady-state concentrations for patients approaching CrCL of 30 mL/min (severe renal impairment) is 2-fold.

22
Figure 12: Significant increase in exenatide steady-state concentrations in patients with renal impairment: The closed symbols show the mean (SEM) steady-state concentrations following 2 mg exenatide LAR and the red line is the predicted steady-state concentration The effect of renal impairment was studied in Byetta clinical program and submitted under NDA 21-773. No dose adjustment is recommended in mild and moderate renal impairment, while exenatide is contraindicated in severe and end stage renal impairment. Similar dosing recommendations are being proposed for exenatide LAR. Current Byetta package insert has the following language in Highlight section: “Renal Impairment: Postmarketing reports, sometimes requiring hemodialysis and kidney transplantation. BYETTA should not be used in patients with severe renal impairment or end-stage renal disease and should be used with caution in patients with renal transplantation. Caution should be applied when initiating BYETTA or escalating the dose of BYETTA in patients with moderate renal failure.” The sponsor’s proposed language regarding renal impaired patients similar to Byetta. No major adverse events were observed in any patients including the renal impaired patients in the Phase 3 trial (study-105). Since there were only 10 patients with moderate renal impairment in the pivotal Phase 3 trial and the possibility of increased exposure (up to 2 fold when approaching CrCL of 30 mL/min), the reviewer is recommending caution when using Bydureon in patients with moderate renal impairment.
23
• Hepatic impairment No PK study was conducted in patients with hepatic impairment using exenatide LAR. No dosage adjustment for exenatide once weekly is proposed for subjects with hepatic impairment. 2.3.7 What pharmacogenetics information is there in the application and is it important
or not? None 2.3.8 What pregnancy and lactation use information is there in the application? None 2.3.9 What pediatric use information is there in the application? None 2.4 Extrinsic Factors 2.4.1 Are there drug-drug interactions with exenatide LAR? No DDI studies were conducted with exenatide LAR. Please refer to NDA 21-773 (Byetta) Clinical Pharmacology review for details of drug interactions. As shown earlier in Byetta, exenatide has the potential to alter the absorption of concomitantly administered oral drugs due to its pharmacological effect of delay of gastric emptying. The effect of exenatide LAR on the rate of gastric emptying was assessed by measuring acetaminophen absorption in study LAR-105. The effect was studied during both fasting and fed states. The PK parameters (AUC, Cmax and Tmax) were compared statistically between baseline (Day –3) and Week 14 using a two one-sided test procedure. Subjects received oral acetaminophen (1000 mg tablet) administered with exenatide once weekly 2 mg in the fed state (N = 26), exenatide once weekly 2 mg in the fasting state (N = 25), and Byetta 10 μg in the fed state (N = 24). All groups underwent a gastric emptying assessment at baseline, prior to active drug administration. Assessment of the exenatide effects occurred at Week 14, when steady-state concentrations of exenatide had been achieved with exenatide once weekly treatment (geometric mean exenatide concentrations of 321.5 and 251.2 pg/mL for the fed and fasting cohorts, respectively, measured 15 minutes prior to acetaminophen administration). The exenatide once weekly injection was withheld on the day of the gastric-emptying assessment until after the acetaminophen pharmacokinetic sampling period was complete (over 5 h), while Byetta was administered 15 minutes prior to the administration of meal. At Week 14, the geometric mean plasma acetaminophen Cmax values in the groups treated with exenatide LAR, either as a fed or fasted assessment, were similar and in both cases were greater than the geometric mean plasma acetaminophen Cmax value with Byetta treatment (Table 5). Exenatide as expected does reduce the absorption as seen from a 21% decrease in Cmax with Byetta. The magnitude of the decrease was less with the extended release formulation, 16% and 5% under fasting and fed conditions, respectively.
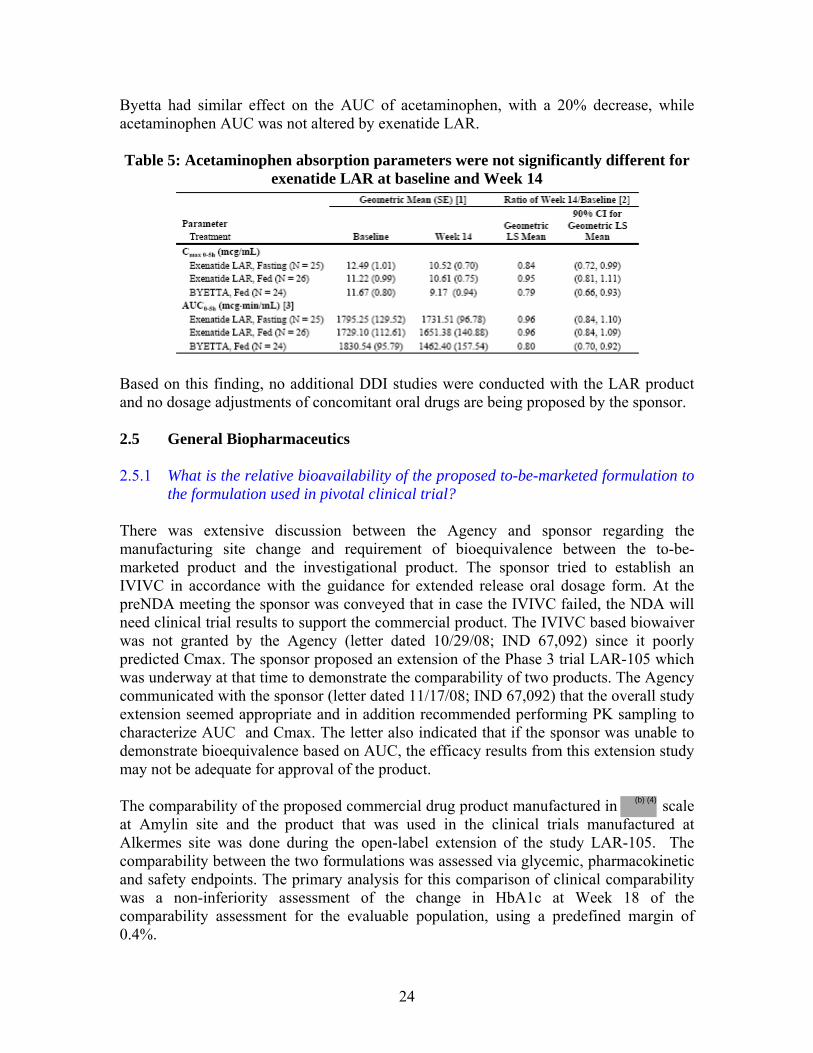
24
Byetta had similar effect on the AUC of acetaminophen, with a 20% decrease, while acetaminophen AUC was not altered by exenatide LAR. Table 5: Acetaminophen absorption parameters were not significantly different for
exenatide LAR at baseline and Week 14
Based on this finding, no additional DDI studies were conducted with the LAR product and no dosage adjustments of concomitant oral drugs are being proposed by the sponsor.
2.5 General Biopharmaceutics 2.5.1 What is the relative bioavailability of the proposed to-be-marketed formulation to
the formulation used in pivotal clinical trial? There was extensive discussion between the Agency and sponsor regarding the manufacturing site change and requirement of bioequivalence between the to-be-marketed product and the investigational product. The sponsor tried to establish an IVIVC in accordance with the guidance for extended release oral dosage form. At the preNDA meeting the sponsor was conveyed that in case the IVIVC failed, the NDA will need clinical trial results to support the commercial product. The IVIVC based biowaiver was not granted by the Agency (letter dated 10/29/08; IND 67,092) since it poorly predicted Cmax. The sponsor proposed an extension of the Phase 3 trial LAR-105 which was underway at that time to demonstrate the comparability of two products. The Agency communicated with the sponsor (letter dated 11/17/08; IND 67,092) that the overall study extension seemed appropriate and in addition recommended performing PK sampling to characterize AUC and Cmax. The letter also indicated that if the sponsor was unable to demonstrate bioequivalence based on AUC, the efficacy results from this extension study may not be adequate for approval of the product. The comparability of the proposed commercial drug product manufactured in scale at Amylin site and the product that was used in the clinical trials manufactured at Alkermes site was done during the open-label extension of the study LAR-105. The comparability between the two formulations was assessed via glycemic, pharmacokinetic and safety endpoints. The primary analysis for this comparison of clinical comparability was a non-inferiority assessment of the change in HbA1c at Week 18 of the comparability assessment for the evaluable population, using a predefined margin of 0.4%.
(b) (4)

25
The overall study design is illustrated in Figure 13. The study design for the clinical comparability assessment that occurred during the open-ended assessment period of study 105 is shown in Figure 14.
Figure 13: Overall study design (Study 2993LAR-105)
Figure 14: Study design of comparability assessment period (Study 2993LAR-105) Table 6 presents the sponsor’s statistical comparison of PK parameters (AUC0-168h, AUCss and Css) between the two treatments. The exposure from the commercial site product was 15-23% lower as compared to the clinical product. The geometric LS mean ratios (90% CI) (Amylin-/Alkermes-manufactured) of AUC0-168h and AUCss were 0.85 (76-94%) and 0.77 (70-85%), respectively. The Css was also lower by 23% for the commercial product as compared to the Alkermes product.
Table 6: Statistical comparison of plasma Exenatide PK parameters between treatment groups (Sponsor’s analysis)
PK parameter N (ref)
Alkermes Geo Mean (SE)
Amylin Geo Mean (SE)
N (test)
Ratio 90%CI
AUC0-168h (pg.h/mL)
75 33420 (1370) 28277 (1281)
62 0.85 76-94%
AUCss (pg.h/mL)
102 32673 (1376) 25241 (1107)
94 0.77 70-85%
Css (pg/mL) 102 194 (8) 150 (7) 94 0.77 70-85%
Table 7 shows the results from the reviewer’s analysis. As shown, the results were different as compared to the sponsor’s especially for AUC0-168h (32% lower vs. 15% lower in sponsor’s results). Overall, there was 25-32% lower AUC of the Amylin product as compared to that of Alkermes product.
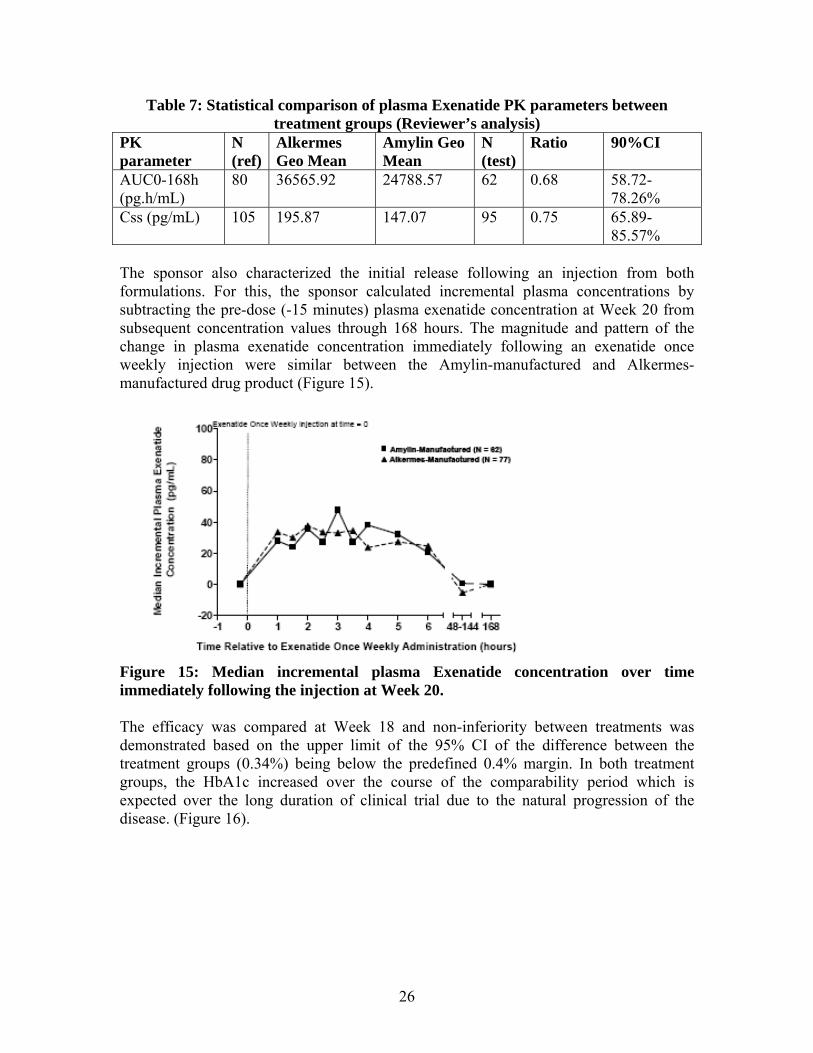
26
Table 7: Statistical comparison of plasma Exenatide PK parameters between treatment groups (Reviewer’s analysis)
PK parameter
N (ref)
Alkermes Geo Mean
Amylin Geo Mean
N (test)
Ratio 90%CI
AUC0-168h (pg.h/mL)
80 36565.92 24788.57 62 0.68 58.72-78.26%
Css (pg/mL) 105 195.87 147.07 95 0.75 65.89-85.57%
The sponsor also characterized the initial release following an injection from both formulations. For this, the sponsor calculated incremental plasma concentrations by subtracting the pre-dose (-15 minutes) plasma exenatide concentration at Week 20 from subsequent concentration values through 168 hours. The magnitude and pattern of the change in plasma exenatide concentration immediately following an exenatide once weekly injection were similar between the Amylin-manufactured and Alkermes-manufactured drug product (Figure 15).
Figure 15: Median incremental plasma Exenatide concentration over time immediately following the injection at Week 20. The efficacy was compared at Week 18 and non-inferiority between treatments was demonstrated based on the upper limit of the 95% CI of the difference between the treatment groups (0.34%) being below the predefined 0.4% margin. In both treatment groups, the HbA1c increased over the course of the comparability period which is expected over the long duration of clinical trial due to the natural progression of the disease. (Figure 16).
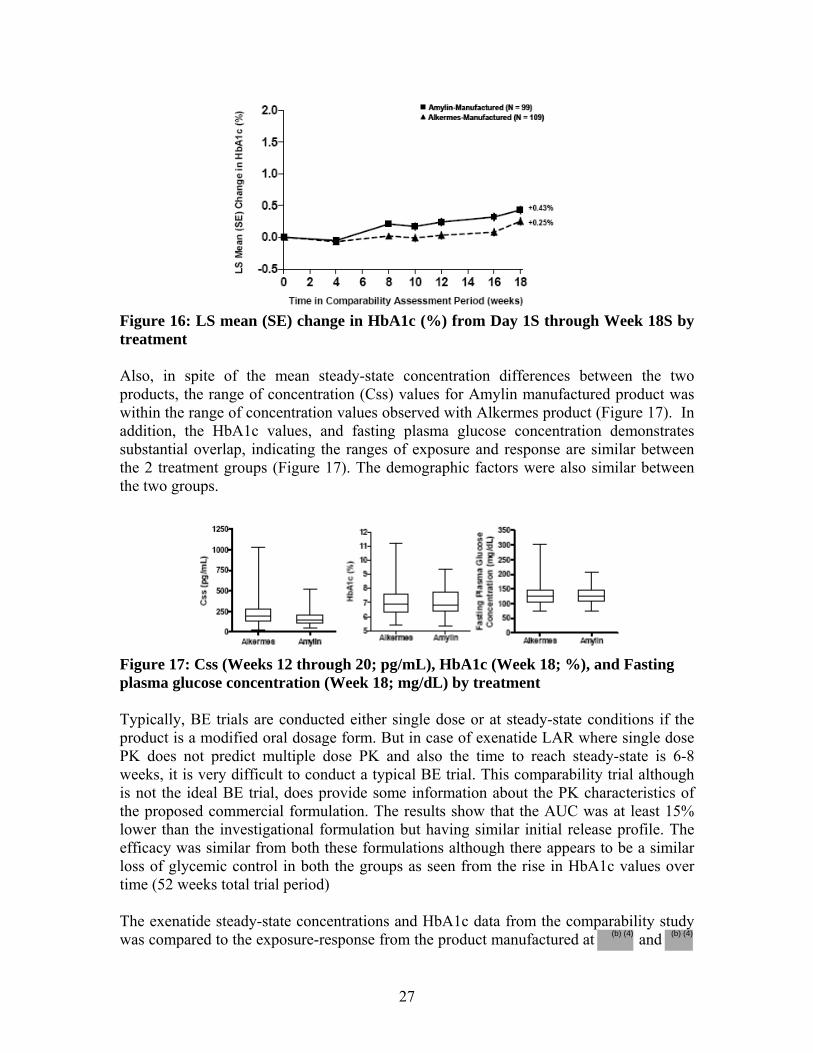
27
Figure 16: LS mean (SE) change in HbA1c (%) from Day 1S through Week 18S by treatment Also, in spite of the mean steady-state concentration differences between the two products, the range of concentration (Css) values for Amylin manufactured product was within the range of concentration values observed with Alkermes product (Figure 17). In addition, the HbA1c values, and fasting plasma glucose concentration demonstrates substantial overlap, indicating the ranges of exposure and response are similar between the 2 treatment groups (Figure 17). The demographic factors were also similar between the two groups.
Figure 17: Css (Weeks 12 through 20; pg/mL), HbA1c (Week 18; %), and Fasting plasma glucose concentration (Week 18; mg/dL) by treatment Typically, BE trials are conducted either single dose or at steady-state conditions if the product is a modified oral dosage form. But in case of exenatide LAR where single dose PK does not predict multiple dose PK and also the time to reach steady-state is 6-8 weeks, it is very difficult to conduct a typical BE trial. This comparability trial although is not the ideal BE trial, does provide some information about the PK characteristics of the proposed commercial formulation. The results show that the AUC was at least 15% lower than the investigational formulation but having similar initial release profile. The efficacy was similar from both these formulations although there appears to be a similar loss of glycemic control in both the groups as seen from the rise in HbA1c values over time (52 weeks total trial period) The exenatide steady-state concentrations and HbA1c data from the comparability study was compared to the exposure-response from the product manufactured at and (b) (4) (b) (4)
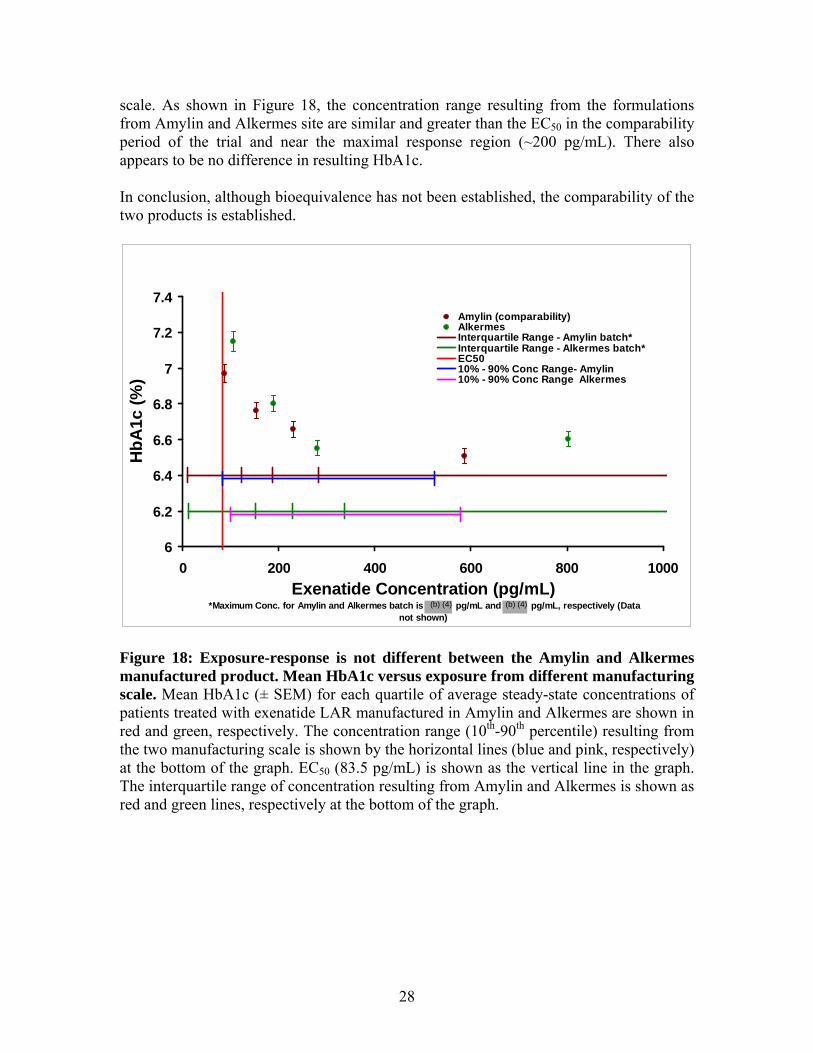
28
scale. As shown in Figure 18, the concentration range resulting from the formulations from Amylin and Alkermes site are similar and greater than the EC50 in the comparability period of the trial and near the maximal response region (~200 pg/mL). There also appears to be no difference in resulting HbA1c. In conclusion, although bioequivalence has not been established, the comparability of the two products is established.
6
6.2
6.4
6.6
6.8
7
7.2
7.4
0 200 400 600 800 1000Exenatide Concentration (pg/mL)
*Maximum Conc. for Amylin and Alkermes batch is pg/mL and pg/mL, respectively (Data not shown)
HbA
1c (%
)
Amylin (comparability)AlkermesInterquartile Range - Amylin batch*Interquartile Range - Alkermes batch*EC5010% - 90% Conc Range- Amylin10% - 90% Conc Range Alkermes
Figure 18: Exposure-response is not different between the Amylin and Alkermes manufactured product. Mean HbA1c versus exposure from different manufacturing scale. Mean HbA1c (± SEM) for each quartile of average steady-state concentrations of patients treated with exenatide LAR manufactured in Amylin and Alkermes are shown in red and green, respectively. The concentration range (10th-90th percentile) resulting from the two manufacturing scale is shown by the horizontal lines (blue and pink, respectively) at the bottom of the graph. EC50 (83.5 pg/mL) is shown as the vertical line in the graph. The interquartile range of concentration resulting from Amylin and Alkermes is shown as red and green lines, respectively at the bottom of the graph.
(b) (4) (b) (4)

29
2.6 Analytical Section 2.6.1 What bioanalytical methods are used to assess concentrations? Exenatide assay: In NDA 21-773 (Byetta), the immediate release formulation of exenatide was analyzed using an immunoenzymetric assay (IMEA). This IEMA was also used to quantify plasma samples for exenatide once weekly from initial clinical trials (ALK23-001, 2993LAR-101, 2993LAR-102, and 2993LAR-103). Subsequently the exenatide IEMA was modified and validated at and this modified assay was used for the quantification of exenatide from the LAR formulation in pivotal clinical trials (Studies 2993LAR-104, and 2993LAR-105). Human plasma specimens were analyzed using the validated IEMA, which is a 2-site sandwich assay utilizing 2 monoclonal antibodies (one for capture [EXE4:2-8.4] and one for detection [GLP1:3-3.1]). The capture antibody is specific for exenatide, as it recognizes a C-terminal epitope of exenatide and does not cross-react with GLP-1(7-36) or glucagon. The detecting antibody recognizes an N-terminal epitope on exenatide, GLP-1(7-36), and glucagon. The assay is specific for exenatide due to the selectivity of the capture antibody. Since both antibodies need to recognize the peptide in order to generate a signal for this assay, cross-reactivity with other peptides or metabolites is minimized. Human plasma samples were analyzed for exenatide (Synthetic Exendin-4) concentrations utilizing a validated Enzyme-Linked Immunosorbent Assay (ELISA) (validation report # 04-051). Standards concentrations ranged from 3.9 pg/mL to 500.0 pg/mL. The validated range of the assay, determined by acceptable accuracy and precision of validation samples prepared at known concentrations was 10 pg/mL to 400 pg/mL. The range for reported concentrations was initially extended to 5,000 pg/mL by performing dilutional linearity experiments. The range was subsequently extended to 20,000 pg/mL (Reference dilutional linearity addendum # 07-066). Accuracy and precision were determined by analysis of human EDTA plasma validation pools containing synthetic exendin-4 prepared at the following concentrations: 10, 15, 20, 50, 150, 250, and 400 pg/mL. Precision was expressed as the percent coefficient of variation (% CV) of each pool. Inter-day % CV and % difference from theoretical for validation samples analyzed at the concentrations listed above are as follows: Validation Accuracy (% difference from theoretical range): -5.6% to 7.6% Validation Precision (%CV): 5.8% to 13.6% Dilution linearity: Dilutional linearity was evaluated by the analysis of a 5,000 pg/mL synthetic exendin-4 validation pool assayed at 25-, 50- and 100-fold dilutions with human EDTA plasma. For samples diluted from the 20,000 pg/mL stock, the percent
(b) (4)

30
difference from theoretical range ranged from -2.4% to 10.6%. The % CV ranged from 8.6% to 16.3%. Dilution of samples is valid. Calibration standards were prepared by diluting a thawed aliquot of the standard solution (500 pg/mL) with Human EDTA Plasma, resulting in calibration standards ranging in concentration from 3.9 to 500 pg/mL. For the analysis of study samples, QC samples will be prepared in a manner similar to the preparation of the validation pools described above. The QC pools will be prepared at the following concentrations: 20, 150 and 250 pg/mL. Different volumes and concentrations of the QC samples may be prepared if necessary. Table 8 summarizes the results from the validation of the assay:
Table 8: Exenatide plasma concentration assay
Anti-exenatide antibody assay: The presence of antibodies to exenatide in human serum from subjects treated in Exenatide once weekly Studies ALK23-001, 2993LAR-101, 2993LAR-102, and 2993LAR-103 was evaluated using the same enzyme-linked immunosorbent assay (ELISA) as that described in the NDA for Byetta (NDA 021-773). An enzyme-linked immunosorbent assay was validated at (REST080375) for determining the presence of antibodies to exenatide in human serum samples from pivotal clinical trials conducted with the LAR formulation. The assay
(b) (4)

31
detects total antibodies specific to exenatide (IgM, IgG, and IgA isotypes) using excess antigen immobilized on a solid phase. Titers of antibodies to exenatide are determined by serial 1/5 dilutions after an initial dilution of 1/25. Antibody titer is expressed as the reciprocal of the highest dilution of sample serum that tests positive in the assay (i.e., a dilution of 1/125 is expressed as an antibody titer of 125). This assay can detect antibodies to Exenatide in samples containing drug concentrations of up to 8 ng/mL. Table 9 summarizes the results of the assay validation.
Table 9: Antibody to Exenatide assay validation results
Effect of antibody on quantitation of exenatide: The presence of antibodies to exenatide in human plasma specimens altered the ability to accurately measure exenatide in the plasma. This was assessed by measuring exenatide concentrations in neat and diluted plasma specimens obtained from subjects enrolled in exenatide once weekly clinical studies with and without the addition of a known concentration (spike) of exenatide. The recovery of exenatide spiked in human plasma specimens in the presence and absence of antibodies to exenatide was determined. The recovery from antibody negative plasma was within 25% of expected exenatide concentrations. The presence of antibody to exenatide in plasma specimens altered the measurement of exenatide, with the largest reductions in the recovery of exenatide observed at antibody to exenatide titers of ≥ 625 at the time of peak titer. Recovery of exenatide was markedly reduced to approximately 50% with max titer samples obtained from subjects with antibody titers greater than or equal to 625. In specimens from subjects with max titer 3125 and 15625, essentially no recovery of spiked exenatide (0- 20%) was obtained from neat samples at their maximum titers (Figure 19).
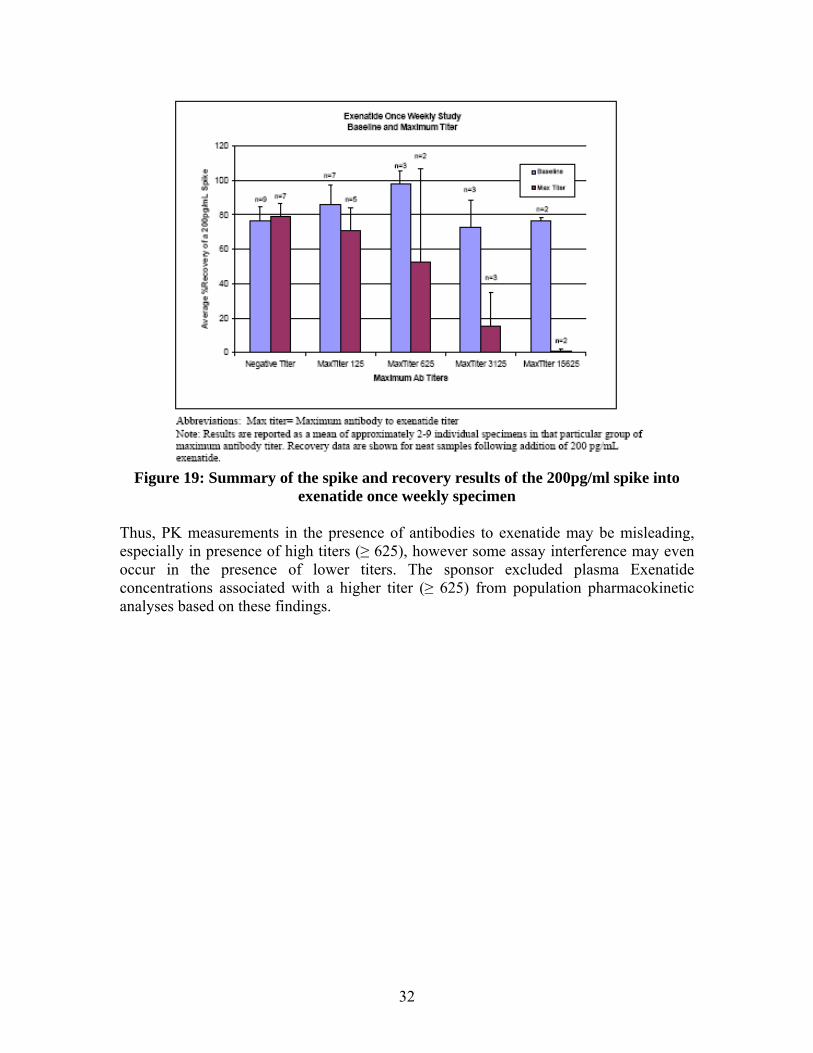
32
Figure 19: Summary of the spike and recovery results of the 200pg/ml spike into
exenatide once weekly specimen Thus, PK measurements in the presence of antibodies to exenatide may be misleading, especially in presence of high titers (≥ 625), however some assay interference may even occur in the presence of lower titers. The sponsor excluded plasma Exenatide concentrations associated with a higher titer (≥ 625) from population pharmacokinetic analyses based on these findings.


36
4 Appendix 4.1 Proposed Package Insert
FULL PRESCRIBING INFORMATION
17 Page(s) of Draft Labeling have been Withheld in Full as b4 (CCI/TS) immediately following this page
(b) (4)
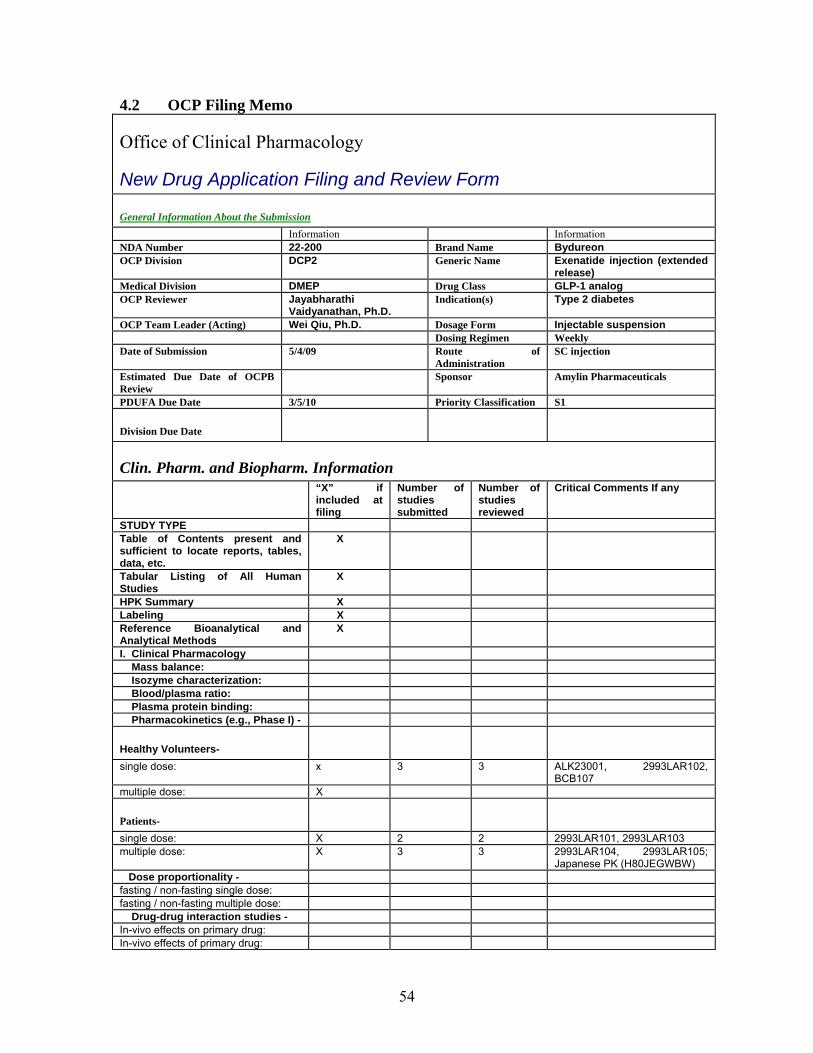
54
4.2 OCP Filing Memo
Office of Clinical Pharmacology
New Drug Application Filing and Review Form General Information About the Submission Information Information NDA Number 22-200 Brand Name Bydureon OCP Division DCP2 Generic Name Exenatide injection (extended
release) Medical Division DMEP Drug Class GLP-1 analog OCP Reviewer Jayabharathi
Vaidyanathan, Ph.D. Indication(s) Type 2 diabetes
OCP Team Leader (Acting) Wei Qiu, Ph.D. Dosage Form Injectable suspension Dosing Regimen Weekly Date of Submission 5/4/09 Route of
Administration SC injection
Estimated Due Date of OCPB Review
Sponsor Amylin Pharmaceuticals
PDUFA Due Date 3/5/10 Priority Classification S1
Division Due Date
Clin. Pharm. and Biopharm. Information “X” if
included at filing
Number of studies submitted
Number of studies reviewed
Critical Comments If any
STUDY TYPE Table of Contents present and sufficient to locate reports, tables, data, etc.
X
Tabular Listing of All Human Studies
X
HPK Summary X Labeling X Reference Bioanalytical and Analytical Methods
X
I. Clinical Pharmacology Mass balance: Isozyme characterization: Blood/plasma ratio: Plasma protein binding: Pharmacokinetics (e.g., Phase I) -
Healthy Volunteers-
single dose: x 3 3 ALK23001, 2993LAR102, BCB107
multiple dose: X
Patients-
single dose: X 2 2 2993LAR101, 2993LAR103 multiple dose: X 3 3 2993LAR104, 2993LAR105;
Japanese PK (H80JEGWBW) Dose proportionality - fasting / non-fasting single dose: fasting / non-fasting multiple dose: Drug-drug interaction studies - In-vivo effects on primary drug: In-vivo effects of primary drug:
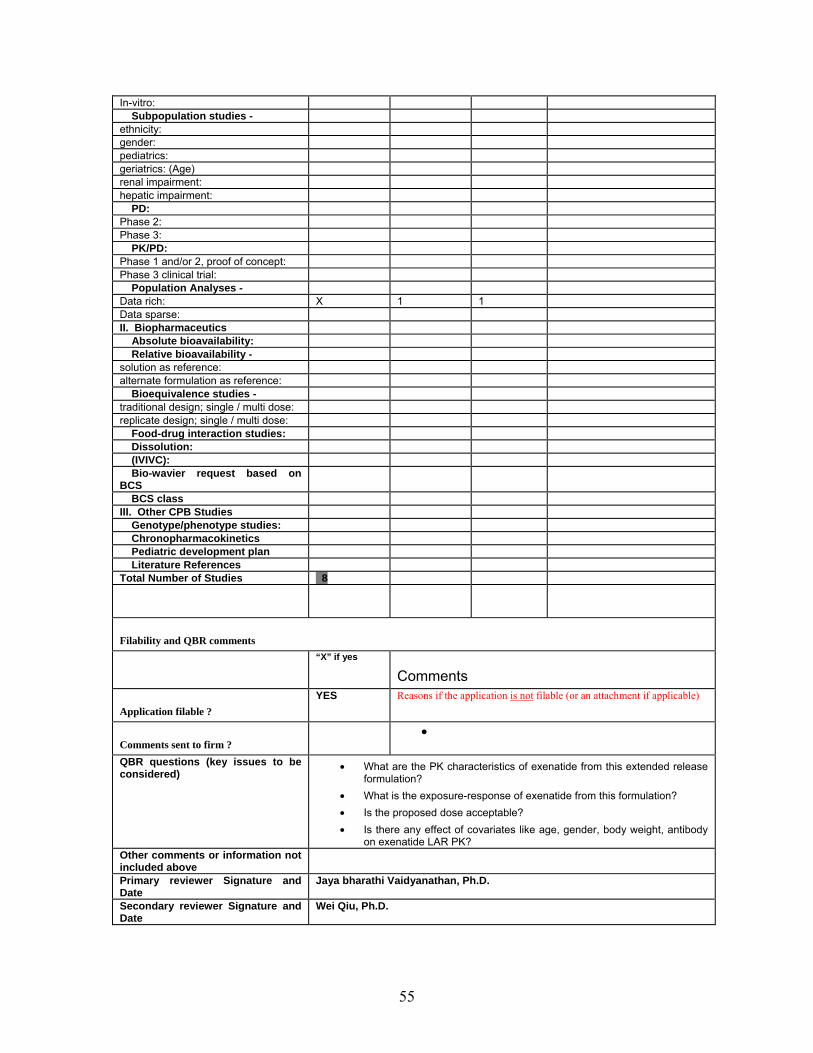
55
In-vitro: Subpopulation studies - ethnicity: gender: pediatrics: geriatrics: (Age) renal impairment: hepatic impairment: PD: Phase 2: Phase 3: PK/PD: Phase 1 and/or 2, proof of concept: Phase 3 clinical trial: Population Analyses - Data rich: X 1 1 Data sparse: II. Biopharmaceutics Absolute bioavailability: Relative bioavailability - solution as reference: alternate formulation as reference: Bioequivalence studies - traditional design; single / multi dose: replicate design; single / multi dose: Food-drug interaction studies: Dissolution: (IVIVC): Bio-wavier request based on BCS
BCS class III. Other CPB Studies Genotype/phenotype studies: Chronopharmacokinetics Pediatric development plan Literature References Total Number of Studies 8
Filability and QBR comments
“X” if yes
Comments
Application filable ? YES Reasons if the application is not filable (or an attachment if applicable)
Comments sent to firm ? •
QBR questions (key issues to be considered)
• What are the PK characteristics of exenatide from this extended release formulation?
• What is the exposure-response of exenatide from this formulation? • Is the proposed dose acceptable? • Is there any effect of covariates like age, gender, body weight, antibody
on exenatide LAR PK? Other comments or information not included above
Primary reviewer Signature and Date
Jaya bharathi Vaidyanathan, Ph.D.
Secondary reviewer Signature and Date
Wei Qiu, Ph.D.
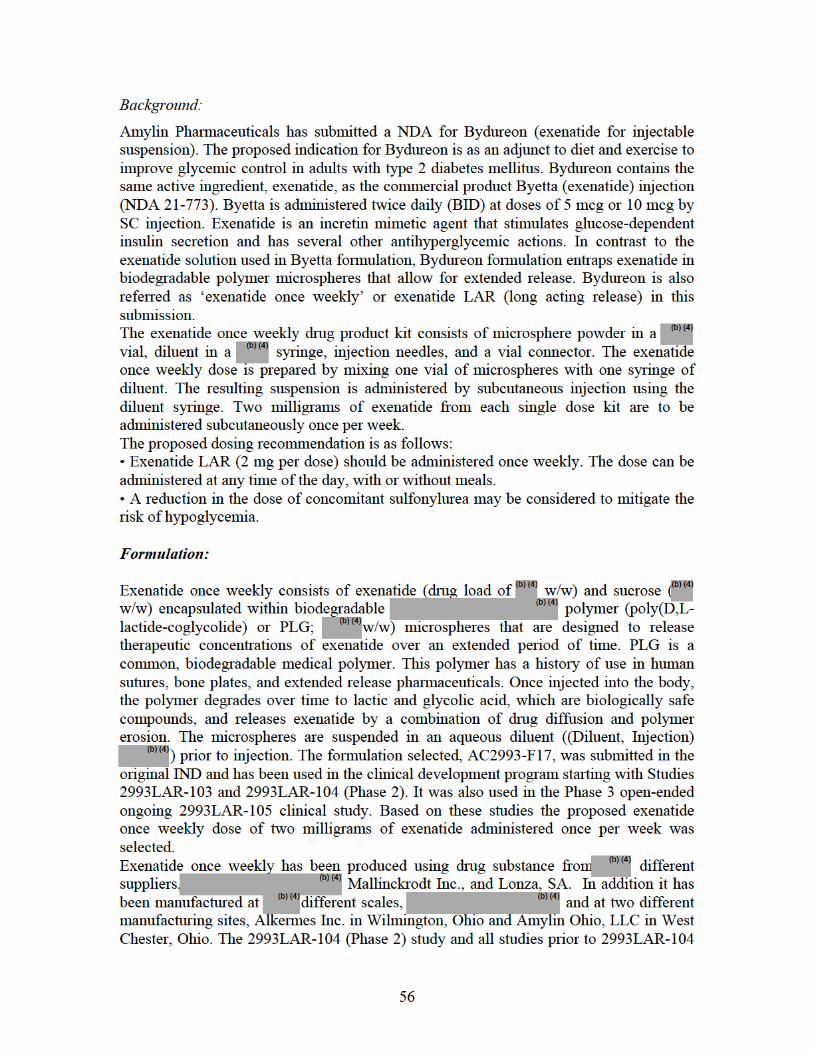

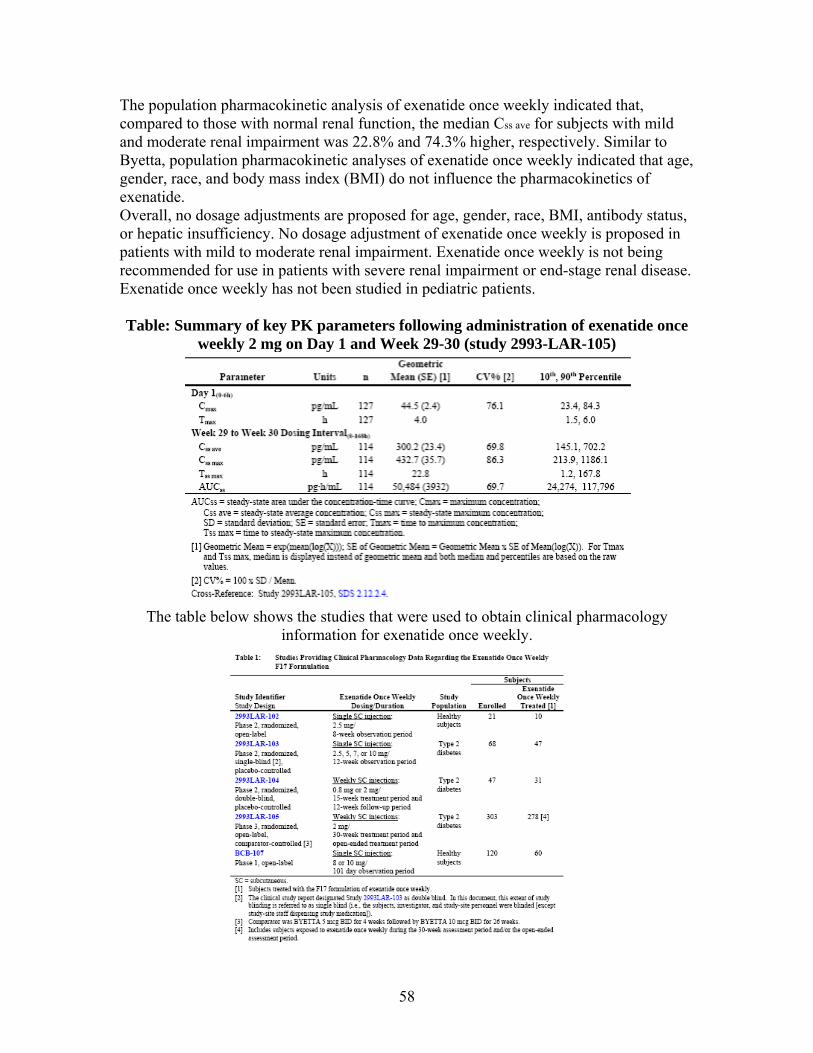
58
The population pharmacokinetic analysis of exenatide once weekly indicated that, compared to those with normal renal function, the median Css ave for subjects with mild and moderate renal impairment was 22.8% and 74.3% higher, respectively. Similar to Byetta, population pharmacokinetic analyses of exenatide once weekly indicated that age, gender, race, and body mass index (BMI) do not influence the pharmacokinetics of exenatide. Overall, no dosage adjustments are proposed for age, gender, race, BMI, antibody status, or hepatic insufficiency. No dosage adjustment of exenatide once weekly is proposed in patients with mild to moderate renal impairment. Exenatide once weekly is not being recommended for use in patients with severe renal impairment or end-stage renal disease. Exenatide once weekly has not been studied in pediatric patients. Table: Summary of key PK parameters following administration of exenatide once
weekly 2 mg on Day 1 and Week 29-30 (study 2993-LAR-105)
The table below shows the studies that were used to obtain clinical pharmacology
information for exenatide once weekly.

59
Steady-state pharmacokinetic and pharmacodynamic response (HbA1c) data were evaluated with population PK analysis using data collected during the Phase 2 Study 2993LAR-104 and the long-term, Phase 3 Study 2993LAR-105. The population pharmacokinetic model described the data by estimating the overall population mean, Css
ave expressed as a function of dose. The final model predicted that mean steady-state plasma exenatide concentrations would increase as creatinine clearance decreased or as the titer of antibodies to exenatide increased. Sponsor’s exposure-response modeling of data from Studies 2993LAR-104 and 2993LAR-105 using HbA1c as the response variable demonstrated that steady-state concentrations of exenatide following a 2 mg dose were substantially higher than the concentration required to reach half-maximal effect (EC50) derived from the exposure response model. Weekly dosing with 0.8 mg resulted in lower exposure leading to a reduced glycemic response and no weight loss. Sponsor concluded that since the majority of the 2-mg data lies within the plateau of the exposure-response curve, the evaluation confirmed that an exenatide once weekly 2-mg dose is an appropriate dose. Figure: HbA1c versus individual predicted Css av overlaid with the model-predicted exposure-response curve
Bioanalytical Methods: The sponsor has submitted three new bioanalytical study reports in this submission and referenced exenatide analytical study reports from the Byetta NDA 21-773. The three analytical reports include:
REST080143: The effect of antibodies to exenatide on the spike and recovery of exenatide in human plasma specimens from an exenatide once weekly study
REST090029: Acetaminophen in human plasma
REST080375: ELISA to detect human antibodies against exenatide in serum (validation report)


61
Clinical studies: A brief description of the clinical studies is mentioned below:
2993LAR-105 Comparability study: This was a phase 3 randomized open-label, comparator controlled multiple dose study in T2DM patients to demonstrate that exenatide once weekly from 2 different manufacturing sites exerts a comparable clinical response on glycemic control (HbA1c).
BCB107: This was a Phase 1 study to evaluate the single dose PK profiles in healthy subjects of different formulations of exenatide once weekly to support IVIVC analysis.
ALK23-001: This was a Phase 1 study in healthy subjects to determine safety and tolerability of 3 formulations of exenatide once weekly following sc administration.
2993LAR-101: This was a Phase 2 randomized, single-blind, placebo controlled single dose study in T2DM patients to assess the safety of single SC injection of exenatide once weekly presented in one of two formulations. The formulation used in this study was not used for further development.
2993LAR-102: This was a Phase 2 open-label, single dose study in healthy subjects to assess the safety and tolerability of a single sc injection of two formulations of exenatide once weekly. Of the two formulations, the F17 was selected for further evaluation.
2993LAR-103: This was a Phase 2 randomized, placebo-controlled single-dose study in T2DM patients to assess the PK following sc administration.
2993LAR-104: This was a Phase 2 randomized, double-blind, placebo-controlled, multiple-dose study in T2DM patients.
29933LAR-105: This was a Phase 3 open-label, comparator controlled multiple dose study to compare the effect on HbA1c as compared to Byetta BID for 30 weeks.
H8O-JE-GWBW: This was a Phase 1 multiple dose study to assess the safety and tolerability of exenatide once weekly administered for 10 weeks by SC in Japanese T2DM patients.
NDA 22-200 Page 62
Exenatide_pm_review
OFFICE OF CLINICAL PHARMACOLOGY: PHARMACOMETRIC REVIEW
1 SUMMARY OF FINDINGS
1.1 Key Review Questions The purpose of this review is to address the following key questions
1.1.1 Is there evidence of exposure-response relationship for effectiveness to support the proposed 2 mg dose?
Yes, the exposure-response relationship for effectiveness is evidenced in studies LAR-104 (dose ranging study) and LAR-105 (pivotal efficacy trial) and shown in Figure 1. An inhibitory Emax model adequately described the relationship between observed HbA1c and exenatide average steady-state concentrations. As shown in Figure 1, there is a concentration-dependent decrease in HbA1c from baseline with maximal response at exenatide concentrations greater than 200 pg/mL. There was some overlap of exenatide concentrations following the 0.8 mg and 2 mg dose. However the median concentrations achieved following 0.8 mg was about 60 pg/mL which is less than the EC50 value (83.5 pg/mL) indicating sub-optimal exposures are achieved following 0.8 mg exenatide LAR dose whereas the majority of patients receiving 2 mg exenatide LAR dose had exposures above EC50.
Mean HbA1c versus Median Exenatide Concentration by Quartiles
5.5
6
6.5
7
7.5
8
8.5
9
0 150 300 450 600 750
Exenatide Concentration (pg/mL)
HbA
1c (%
)
Exposure-Response-All Data
EC50
Placebo
10%-90% Conc. Range - 0.8 mg
10%-90% Conc. Range - 2.0 mg
Figure 1: The 2 mg dose produces exposure related to maximal response. Mean HbA1c (± SEM) for each quartile of average steady-state concentrations of patients treated with exenatide LAR. The placebo and treated responses are shown in black and red. The 10th - 90th percentile of the concentration range following 0.8 mg and 2 mg dose in each quartile is shown by the horizontal line at the bottom of the graph. EC50 (83.5 pg/mL) is shown as the vertical line in the graph.

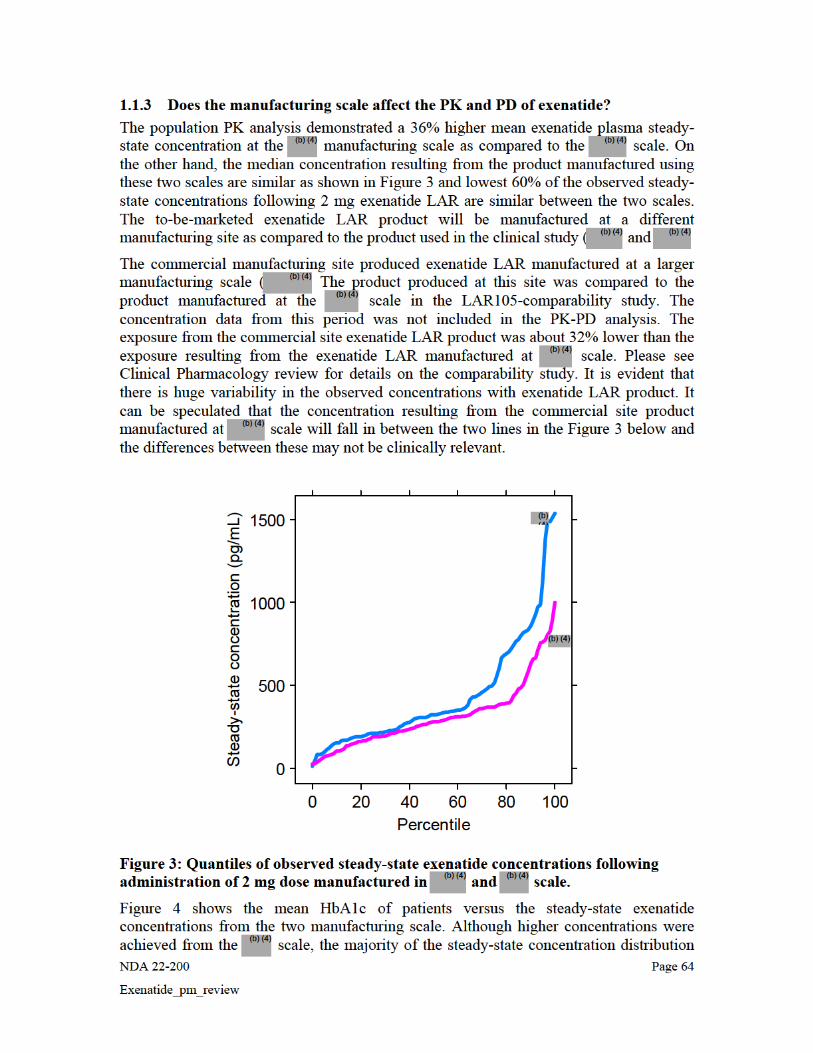
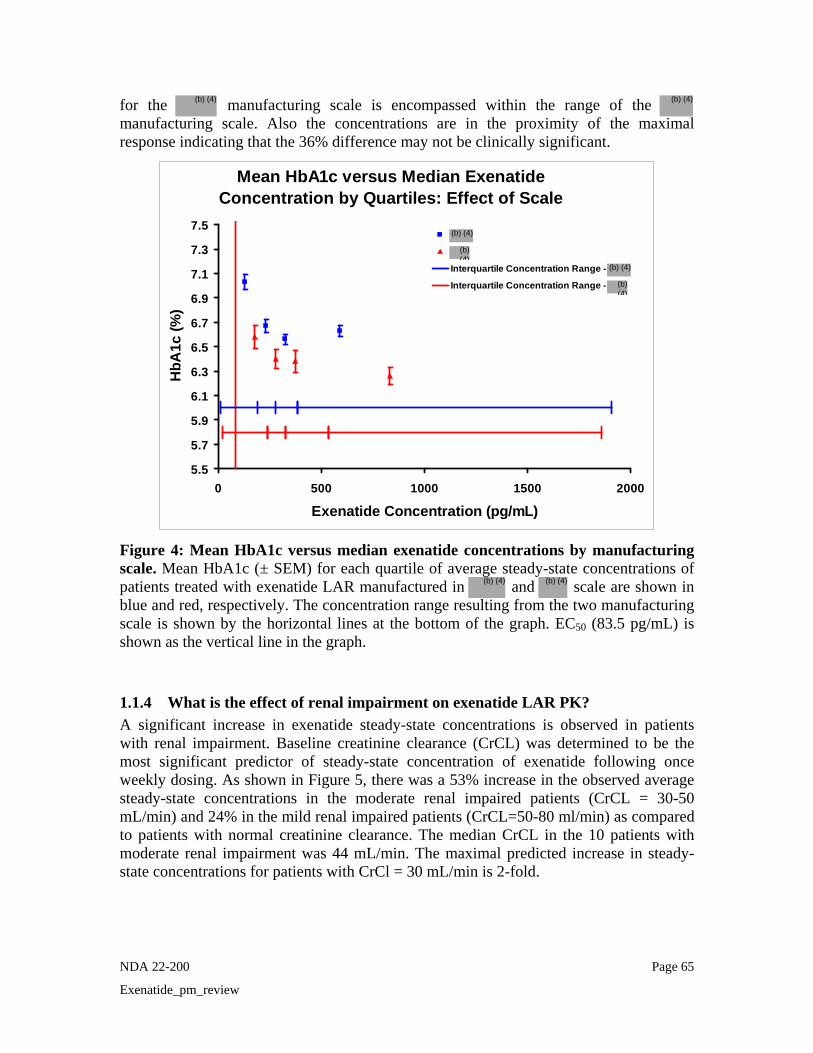
NDA 22-200 Page 65
Exenatide_pm_review
for the manufacturing scale is encompassed within the range of the manufacturing scale. Also the concentrations are in the proximity of the maximal response indicating that the 36% difference may not be clinically significant.
Mean HbA1c versus Median Exenatide Concentration by Quartiles: Effect of Scale
5.5
5.7
5.9
6.1
6.3
6.5
6.7
6.9
7.1
7.3
7.5
0 500 1000 1500 2000
Exenatide Concentration (pg/mL)
HbA
1c (%
)
Interquartile Concentration Range -
Interquartile Concentration Range -
Figure 4: Mean HbA1c versus median exenatide concentrations by manufacturing scale. Mean HbA1c (± SEM) for each quartile of average steady-state concentrations of patients treated with exenatide LAR manufactured in and scale are shown in blue and red, respectively. The concentration range resulting from the two manufacturing scale is shown by the horizontal lines at the bottom of the graph. EC50 (83.5 pg/mL) is shown as the vertical line in the graph.
1.1.4 What is the effect of renal impairment on exenatide LAR PK? A significant increase in exenatide steady-state concentrations is observed in patients with renal impairment. Baseline creatinine clearance (CrCL) was determined to be the most significant predictor of steady-state concentration of exenatide following once weekly dosing. As shown in Figure 5, there was a 53% increase in the observed average steady-state concentrations in the moderate renal impaired patients (CrCL = 30-50 mL/min) and 24% in the mild renal impaired patients (CrCL=50-80 ml/min) as compared to patients with normal creatinine clearance. The median CrCL in the 10 patients with moderate renal impairment was 44 mL/min. The maximal predicted increase in steady-state concentrations for patients with CrCl = 30 mL/min is 2-fold.
(b) (4)
(b) (4)
(b) (4)
(b) (4)
(b) (4)
(b) (4)
(b) (4)
(b) (4)
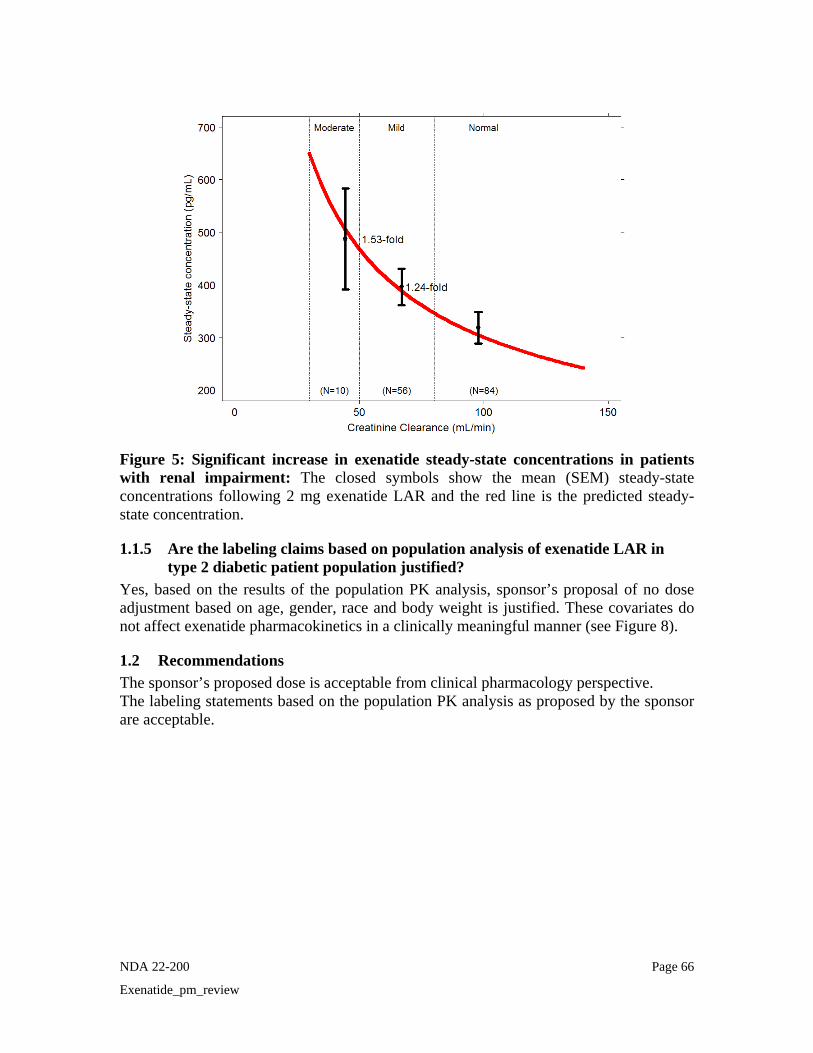
NDA 22-200 Page 66
Exenatide_pm_review
Figure 5: Significant increase in exenatide steady-state concentrations in patients with renal impairment: The closed symbols show the mean (SEM) steady-state concentrations following 2 mg exenatide LAR and the red line is the predicted steady-state concentration.
1.1.5 Are the labeling claims based on population analysis of exenatide LAR in type 2 diabetic patient population justified?
Yes, based on the results of the population PK analysis, sponsor’s proposal of no dose adjustment based on age, gender, race and body weight is justified. These covariates do not affect exenatide pharmacokinetics in a clinically meaningful manner (see Figure 8).
1.2 Recommendations The sponsor’s proposed dose is acceptable from clinical pharmacology perspective. The labeling statements based on the population PK analysis as proposed by the sponsor are acceptable.

NDA 22-200 Page 67
Exenatide_pm_review
2 RESULTS OF SPONSOR’S ANALYSIS The sponsor conducted both population PK as well as PK/PD analysis. The results are summarized below.
Methods: Data from study LAR-104 and study LAR-105 was used. The PK data set had steady-state exenatide concentration values from 165 subjects and HbA1c measurements from 157 subjects. Only steady-state concentration data was evaluated. The exposure measure evaluated in the population PK/PD analysis was the individual predicted average steady-state plasma exenatide concentration (Css aveij) at the time of each measured response variable. The efficacy response variables considered in the population PK/PD analysis were HbA1c and fasting plasma glucose. The covariates assessed in the PK analysis were baseline age, ideal body weight, creatinine clearance (CrCL), ethnicity, sex, and manufacturing scale, anti-exenatide antibody, body mass index, and body weight. While the covariates assessed in the PK/PD analysis were baseline age, ideal body weight, baseline HbA1c, baseline fasting plasma glucose, ethnicity, sex, anti-exenatide antibody, body mass index, and change in body weight from baseline.
Table 1: Studies used in Analysis
2.1 Population Pharmacokinetic Analysis Population PK analysis was done to characterize the average steady-state plasma concentration of exenatide once weekly following either 0.8 mg or 2 mg doses and to evaluate if any covariates explain the variability in the steady-state exenatide levels. The base model characterized the average steady-state plasma exenatide concentration as a function of dose of exenatide LAR. The covariate analysis was performed using forward addition of all covariates that were significant at the 5% level, and backward elimination of covariates not significant at the 0.1% level. Inter-individual variability for Css aveij in the base structural population PK model was estimated using an exponential error model. A proportional error model was used to describe residual variability (RV). The sponsor’s results are summarized in the following tables 2 and 3.
Study Design Exenatide once weekly
Dosing/Duration
Patients
Treated
2993-LAR-104
Phase 2, randomized, double-blind; Placebo-controlled
Weekly SC injection
0.8 mg or 2 mg/
15 week treatment period
31
2993-LAR-105
Phase 3, randomized, open-label; comparator-controlled
Weekly SC injection
2 mg/ 30 week treatment period
278
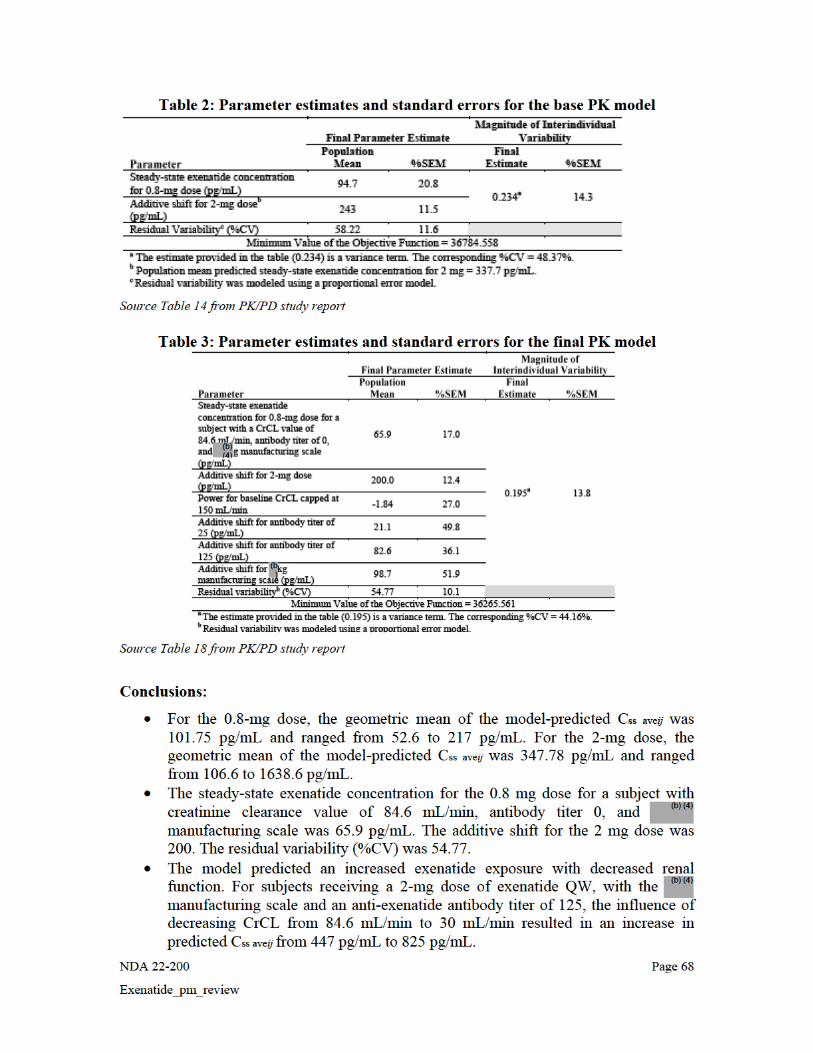
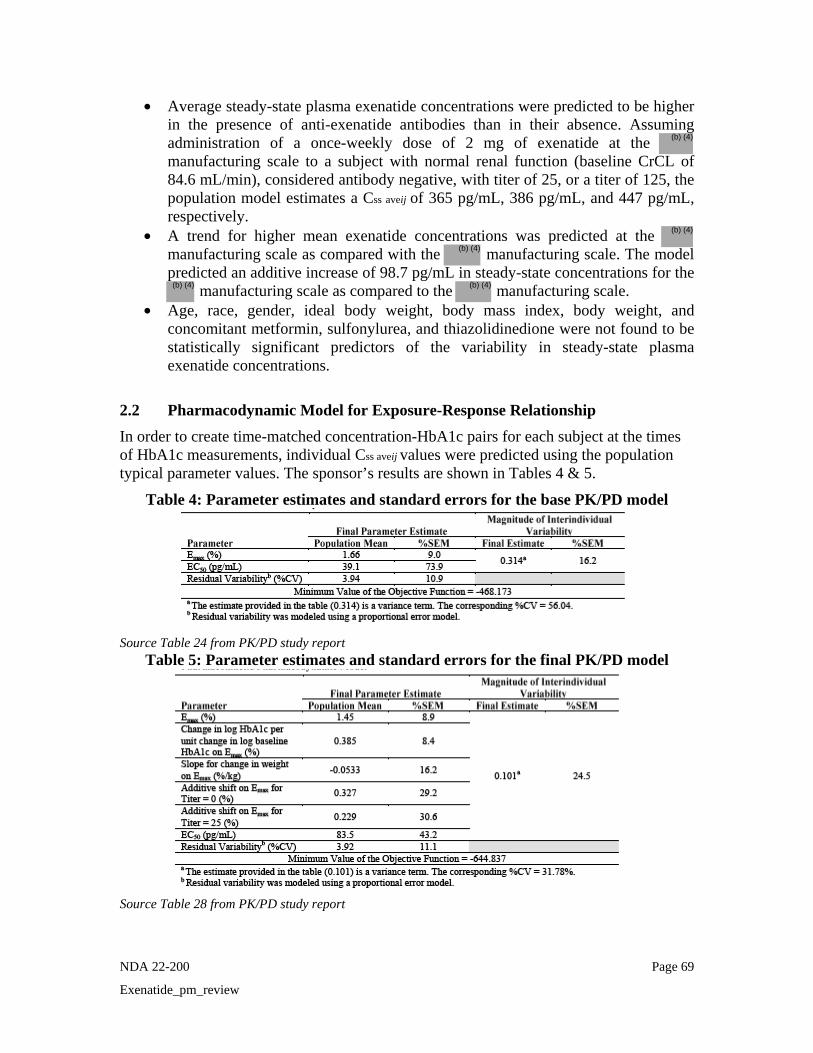
NDA 22-200 Page 69
Exenatide_pm_review
• Average steady-state plasma exenatide concentrations were predicted to be higher in the presence of anti-exenatide antibodies than in their absence. Assuming administration of a once-weekly dose of 2 mg of exenatide at the manufacturing scale to a subject with normal renal function (baseline CrCL of 84.6 mL/min), considered antibody negative, with titer of 25, or a titer of 125, the population model estimates a Css aveij of 365 pg/mL, 386 pg/mL, and 447 pg/mL, respectively.
• A trend for higher mean exenatide concentrations was predicted at the manufacturing scale as compared with the manufacturing scale. The model predicted an additive increase of 98.7 pg/mL in steady-state concentrations for the
manufacturing scale as compared to the manufacturing scale. • Age, race, gender, ideal body weight, body mass index, body weight, and
concomitant metformin, sulfonylurea, and thiazolidinedione were not found to be statistically significant predictors of the variability in steady-state plasma exenatide concentrations.
2.2 Pharmacodynamic Model for Exposure-Response Relationship In order to create time-matched concentration-HbA1c pairs for each subject at the times of HbA1c measurements, individual Css aveij values were predicted using the population typical parameter values. The sponsor’s results are shown in Tables 4 & 5.
Table 4: Parameter estimates and standard errors for the base PK/PD model
Source Table 24 from PK/PD study report
Table 5: Parameter estimates and standard errors for the final PK/PD model
Source Table 28 from PK/PD study report
(b) (4)
(b) (4)
(b) (4)
(b) (4)
(b) (4)
NDA 22-200 Page 70
Exenatide_pm_review
Conclusions:
• An inhibitory Emax model described the relationship between observed HbA1c and exenatide Css aveij. Baseline HbA1c, change in body weight, and anti-exenatide antibody titer were determined to be statistically significant predictors of the variability in the Emax parameter. The estimated EC50 of the relationship was 83.5 pg/mL.
• The population PK/PD model predicted that for a given exenatide concentration, the maximum HbA1c response was greater for those with higher baseline HbA1c and for those with a higher change from baseline in body weight. Also, the magnitude of the reduction of HbA1c decreased with increasing titer at a given exenatide exposure.
• The covariate that did not impact the steady-state concentrations of exenatide - age, race, gender, and concomitant metformin, sulfonylurea, and thiazolidinedione were also not statistically significant predictors of the variability in HbA1c.
2.3 REVIEWER’S COMMENTS ON SPONSOR’S ANALYSIS
Sponsor conducted a well detailed population pharmacokinetic analysis as well as PK/PD analysis. However, the following were noted: (1) Sponsor used an additive shift to describe the effect of the covariates. The reviewer used a proportional shift to describe the effect of covariates. The model estimates were not significantly different as compared to the sponsor’s model, however the results are easier to explain as compared to the additive shift. (2) There was considerable interference with the ability to quantify exenatide in samples with higher titer antibodies (sponsor defined this as ≥625).Exenatide plasma concentration assay interference from anti-exenatide antibodies was demonstrated by loss of exenatide recovery in presence of antibody titers specimens spiked with known exenatide concentrations. This study demonstrated approximately 80% recovery of exenatide from antibody-negative subject plasma. Plasma samples from subjects with titers of 125 demonstrated a recovery of approximately 70%. On average, recovery was reduced to approximately 50% in plasma samples from subjects with titers of 625. Plasma samples from subjects with titers of 3125 and 15625 exhibited even lower recovery (0 to 20%). The exenatide QW concentrations associated with titers of 625 or greater were excluded from the PK model and thereby the PK/PD model by the sponsor. The sponsor used exenatide samples with antibody titer of 125. The reviewer’s model did not include the antibody titer as a covariate in the population PK analysis due to these reasons. (3) The sponsor analyzed body weight as a covariate in the analysis. Creatinine clearance was a significant covariate in the population PK analysis and body weight is accounted for in the calculation of creatinine clearance: Hence, the reviewer did not include body weight as an independent covariate.
NDA 22-200 Page 71
Exenatide_pm_review
3 REVIEWER’S ANALYSIS The population PK analysis was repeated with the modification as mentioned above (using exponential shift rather than additive shift for the covariates). The sponsor’s population PK/PD model was reviewed and found to be appropriate.
3.1 Objectives The analysis objectives are as follows:
1. To determine the exposure-response relationship for effectiveness of exenatide LAR and to determine if any covariates influence this relationship
2. To establish whether the proposed dose is adequate.
3. To determine if the presence of anti-exenatide antibodies and manufacturing scale significantly impact the PK and/or PD of exenatide LAR
4. To determine the effect of renal impairment on PK of exenatide LAR
3.2 Methods
3.2.1 Data Sets Data sets used are summarized in Table 4.
Table 4. Analysis Data Sets Analysis Name Link to EDR
Population PK finalnm.csv NA
Population PK/PD emplarpdold.csv NA
3.2.2 Software NONMEM Version VI was used for the analysis and run using Wings for NONMEM VI on an IBM Thinkpad laptop computer T60, equipped with a Compaq Visual Fortran compiler. The diagnostic and other plots were generated using S-plus script and using EXCEL.
3.2.3 Models The sponsor’s base model was used. Graphical analysis of the base model output (goodness-of-fit plots and parameter-covariate plots) was used to evaluate the adequacy of the model and selection of covariates for further evaluation.
3.3 Results 3.3.1 Population pharmacokinetics The base pharmacokinetic model expressed the population mean Css ave, as a function of dose. An exponential error term was used to describe inter-individual variability in Css ave. Residual variability was estimated using a proportional error term. As seen in the diagnostic plots, this model was not a perfect model as there was significant under-prediction.


NDA 22-200 Page 73
Exenatide_pm_review
(a) Concentration increases with decrease in CrCL
(b) Effect of body weight on concentration is explained with CrCL
(c) No significant difference in concentration with titer level
(d) 36% higher concentration resulting from manufacturing scale
Figure 7: Creatinine clearance is a significant predictor of exenatide steady-state concentration (Note: From base model) It was also seen that body weight was correlated with BMI and gender. However, as estimation of creatinine clearance accounts for the differences in body weight, this was not evaluated as an independent covariate. Age, gender, race, and ideal body weight (IBW) were not determined to be significant covariates (Figure 8). Antibody titer and manufacturing scale were also determined to be significant covariates, explaining an additional 3% variability in exenatide steady-state concentrations.
(b) (4)
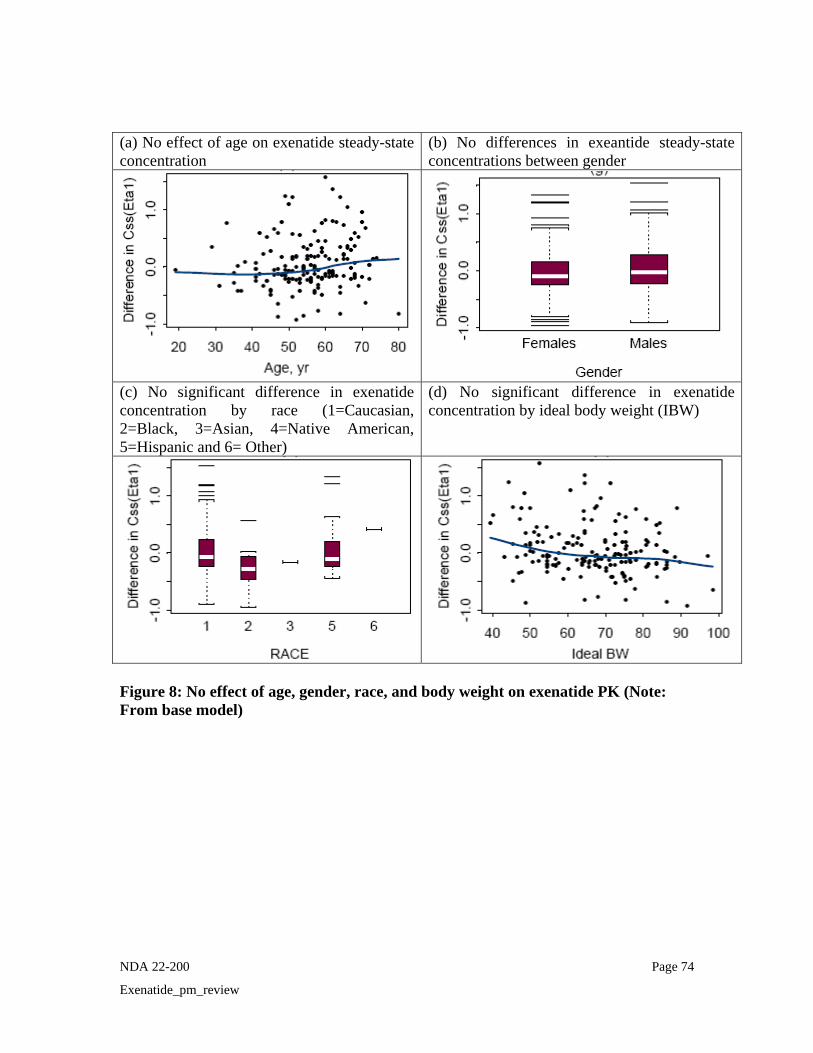
NDA 22-200 Page 74
Exenatide_pm_review
(a) No effect of age on exenatide steady-state concentration
(b) No differences in exeantide steady-state concentrations between gender
(c) No significant difference in exenatide concentration by race (1=Caucasian, 2=Black, 3=Asian, 4=Native American, 5=Hispanic and 6= Other)
(d) No significant difference in exenatide concentration by ideal body weight (IBW)
Figure 8: No effect of age, gender, race, and body weight on exenatide PK (Note: From base model)
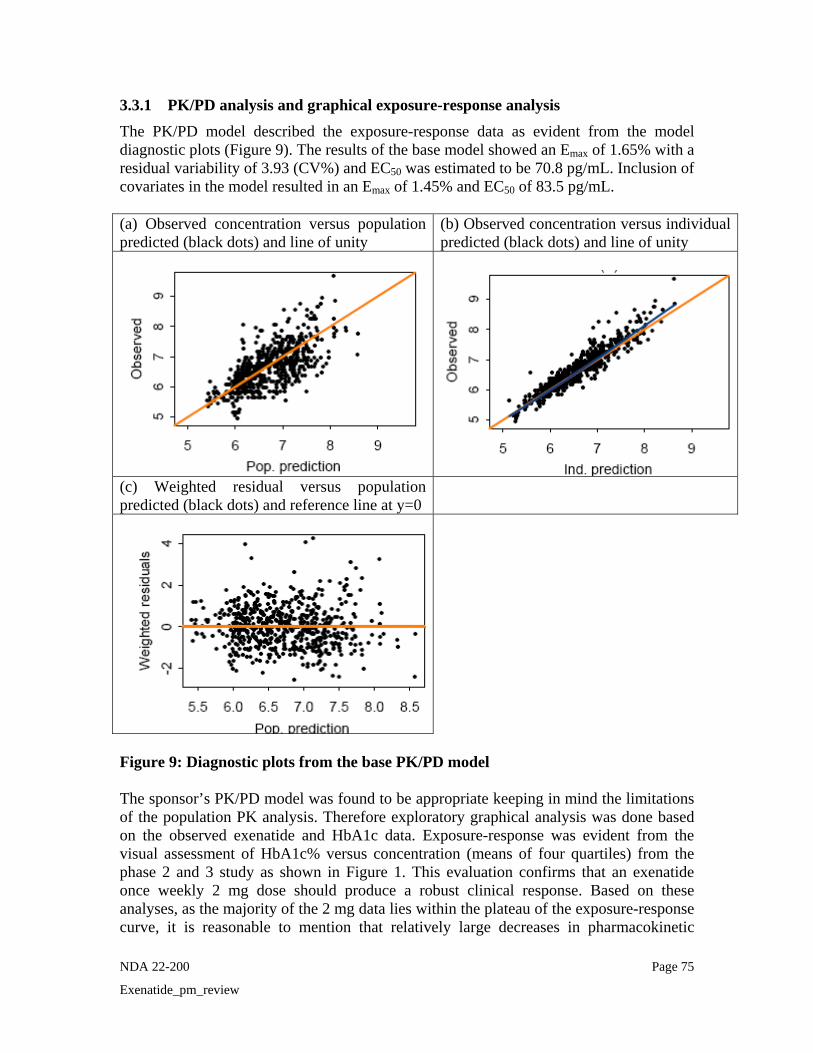
NDA 22-200 Page 75
Exenatide_pm_review
3.3.1 PK/PD analysis and graphical exposure-response analysis The PK/PD model described the exposure-response data as evident from the model diagnostic plots (Figure 9). The results of the base model showed an Emax of 1.65% with a residual variability of 3.93 (CV%) and EC50 was estimated to be 70.8 pg/mL. Inclusion of covariates in the model resulted in an Emax of 1.45% and EC50 of 83.5 pg/mL. (a) Observed concentration versus population predicted (black dots) and line of unity
(b) Observed concentration versus individual predicted (black dots) and line of unity
(c) Weighted residual versus population predicted (black dots) and reference line at y=0
Figure 9: Diagnostic plots from the base PK/PD model The sponsor’s PK/PD model was found to be appropriate keeping in mind the limitations of the population PK analysis. Therefore exploratory graphical analysis was done based on the observed exenatide and HbA1c data. Exposure-response was evident from the visual assessment of HbA1c% versus concentration (means of four quartiles) from the phase 2 and 3 study as shown in Figure 1. This evaluation confirms that an exenatide once weekly 2 mg dose should produce a robust clinical response. Based on these analyses, as the majority of the 2 mg data lies within the plateau of the exposure-response curve, it is reasonable to mention that relatively large decreases in pharmacokinetic

NDA 22-200 Page 76
Exenatide_pm_review
exposure will be required before a clinically relevant change in efficacy response is elicited. The antibody titer was determined to be statistically significant predictor of the variability in the Emax parameter. As shown in Figure 2, there appears to be a slight difference in magnitude of the reduction of HbA1c with increasing titer at a given exenatide concentration. The steady-state concentrations associated with negative antibody titers completely overlap with those concentrations observed for titers of 25 and 125. The median concentration obtained following different titer values are well over the EC50 and in proximity to the maximal response. It is likely that the antibody titer effect is not clinically significant however there are limitations to this analysis.
Although higher concentrations were achieved from the scale based on the population PK analysis, the majority of the steady-state concentration distribution for the
manufacturing scale is encompassed within the range of the manufacturing scale. Also the concentrations are in the proximity of the maximal response indicating that the 36% difference may not be clinically significant (Figure 3).
4 LISTING OF ANALYSES CODES AND OUTPUT FILES File Name Description Location in \\cdsnas\pharmacometrics\
finalnm.csv Sponsor’s NONMEM data set for population PK analysis
\\cdsnas\pharmacometrics\ Reviews\Ongoing PMReviews\Exenatide_NDA22200_000_JV\PPK Analyses\Reviewers Model
pkbasemodelexp.ctl Reviewer’s NONMEM base model code for population PK analysis
\\cdsnas\pharmacometrics\ Reviews\Ongoing PMReviews\Exenatide_NDA22200_000_JV\PPK Analyses\Reviewers Model
pkbasemodelexpcrcl.ctl Reviewer’s NONMEM model code for population PK analysis with CRCL as covariate
\\cdsnas\pharmacometrics\ Reviews\Ongoing PMReviews\Exenatide_NDA22200_000_JV\PPK Analyses\Reviewers Model
pkfullmodelexp.ctl Reviewer’s NONMEM model code for population PK analysis with all covariate
\\cdsnas\pharmacometrics\ Reviews\Ongoing PMReviews\Exenatide_NDA22200_000_JV\PPK Analyses\Reviewers Model
pkfinalmodelexp.ctl Reviewer’s NONMEM final model code for population PK analysis
\\cdsnas\pharmacometrics\ Reviews\Ongoing PMReviews\Exenatide_NDA22200_000_JV\PPK Analyses\Reviewers Model
emplarpdold.csv Reviewer’s NONMEM data set for population PK/PD analysis
\\cdsnas\pharmacometrics\ Reviews\Ongoing PMReviews\Exenatide_NDA22200_000_JV\PK PD Analysis\
pkpdbase-model.ctl Reviewer’s NONMEM base model code for population PK/PD analysis
\\cdsnas\pharmacometrics\ Reviews\Ongoing PMReviews\Exenatide_NDA22200_000_JV\PK PD Analysis\
pkpdbase-modelwt.ctl Reviewer’s NONMEM model code for
\\cdsnas\pharmacometrics\ Reviews\Ongoing PMReviews\Exenatide NDA22200 000 JV\PK
(b) (4)
(b) (4)
(b) (4)

NDA 22-200 Page 77
Exenatide_pm_review
population PK/PD analysis –covariate wt
PD Analysis\
pkpdbase-modelwttit0.ctl Reviewer’s NONMEM model code for population PK/PD analysis –covariate wt,tit0
\\cdsnas\pharmacometrics\ Reviews\Ongoing PMReviews\Exenatide_NDA22200_000_JV\PK PD Analysis\
pkpdbase-modelwttit0tit25.ctl
Reviewer’s NONMEM model code for population PK/PD analysis –covariate wt,tit0, tit25
\\cdsnas\pharmacometrics\ Reviews\Ongoing PMReviews\Exenatide_NDA22200_000_JV\PK PD Analysis\
pkpdbase-modelwttit0tit25tit125.ctl
Reviewer’s NONMEM model code for population PK/PD analysis –covariate wt,tit0,tit25, tit125
\\cdsnas\pharmacometrics\ Reviews\Ongoing PMReviews\Exenatide_NDA22200_000_JV\PK PD Analysis\
pkpdfinal-model.ctl NONMEM final model code
\\cdsnas\pharmacometrics\ Reviews\Ongoing PMReviews\Exenatide_NDA22200_000_JV\PK PD Analysis\
SummarystatisticsPDby
ConcCat_Alldata110209.xls
Excel file for exploratory analysis
\\cdsnas\pharmacometrics\ Reviews\Ongoing PMReviews\Exenatide_NDA22200_000_JV\PK PD Analysis\Reviewer Model
SummarystatisticsPDby
ConcCat_MeanbyID.xls
Excel file for exploratory analysis
\\cdsnas\pharmacometrics\ Reviews\Ongoing PMReviews\Exenatide_NDA22200_000_JV\PK PD Analysis\Reviewer Model
finalbasemodelexpcrcl.SSC S-plus script for plots \\cdsnas\pharmacometrics\ Reviews\Ongoing PMReviews\Exenatide_NDA22200_000_JV\PPK
Analysis\Reviewer Model

NDA 22-200 Page 78
Exenatide_pm_review
5 APPENDIX 1: SPONSOR’S PK/PD REPORT SYNOPSIS (Source: PK/PD study report)
1.1 Introduction Exenatide QW is being developed as a line extension of exenatide for once-weekly (QW) administration to subjects with type 2 diabetes mellitus. This report describes population pharmacokinetic (PK) and pharmacokinetic/pharmacodynamic (PK/PD) analyses of exenatide QW using data from Amylin Studies 2993LAR-104 and 2993LAR-105. 1.2 Methods 1.2.1 Data Amylin Study 2993LAR-104 was a Phase 2, double-blind study of exenatide QW administered by subcutaneous injection for 15 weeks to approximately 30 overweight or obese men and women with type 2 diabetes mellitus. Subjects received either 0.8 mg or 2.0 mg exenatide once weekly. Full-profile PK sampling was done on Day 1 of treatment, with additional PK samples collected weekly or biweekly. An additional 15 subjects received placebo. Amylin Study 2993LAR-105 was a Phase 3, randomized, open-label, multicenter study of exenatide QW administered as a subcutaneous injection once weekly for 52 weeks or beyond in subjects with type 2 diabetes with blood sampling for exenatide plasma concentrations through 52 weeks of the open ended assessment phase. All data available prior to September 24, 2007 were used in this analysis. For the purpose of this analysis, only steady-state concentration data were formally evaluated. 1.2.2 Exposure-Response Variables The exposure measure evaluated in the population PK/PD analysis was the individual predicted average steady-state plasma exenatide concentration (Css aveij) at the time of each measured response variable. Exposure measures were estimated using the population PK model developed in this analysis. For subjects assigned to placebo, Css aveij was assigned a value of zero. The efficacy response variables considered in the population PK/PD analysis were HbA1c and fasting plasma glucose. 1.2.3 Covariates Stationary covariates assessed in the PK analysis were baseline age, ideal body weight, creatinine clearance (CrCL), ethnicity, sex, and manufacturing scale. Time-variant covariates assessed were anti-exenatide antibody, body mass index, and body weight. Stationary covariates assessed in the PK/PD analysis were baseline age, ideal body weight, baseline HbA1c, baseline fasting plasma glucose, ethnicity, and sex. Time variant covariates assessed were anti-exenatide antibody, body mass index, and change in body weight from baseline. In addition, the influence of concomitant use of metformin, sulfonylurea or thiazolidinedione was evaluated in the PK and PK/PD analyses. 1.2.4 Population Pharmacokinetic Analysis Methods The population PK and PK/PD analyses were completed using NONMEM software, Version VI. All data preparation and presentation was performed using SAS Version 8.2.
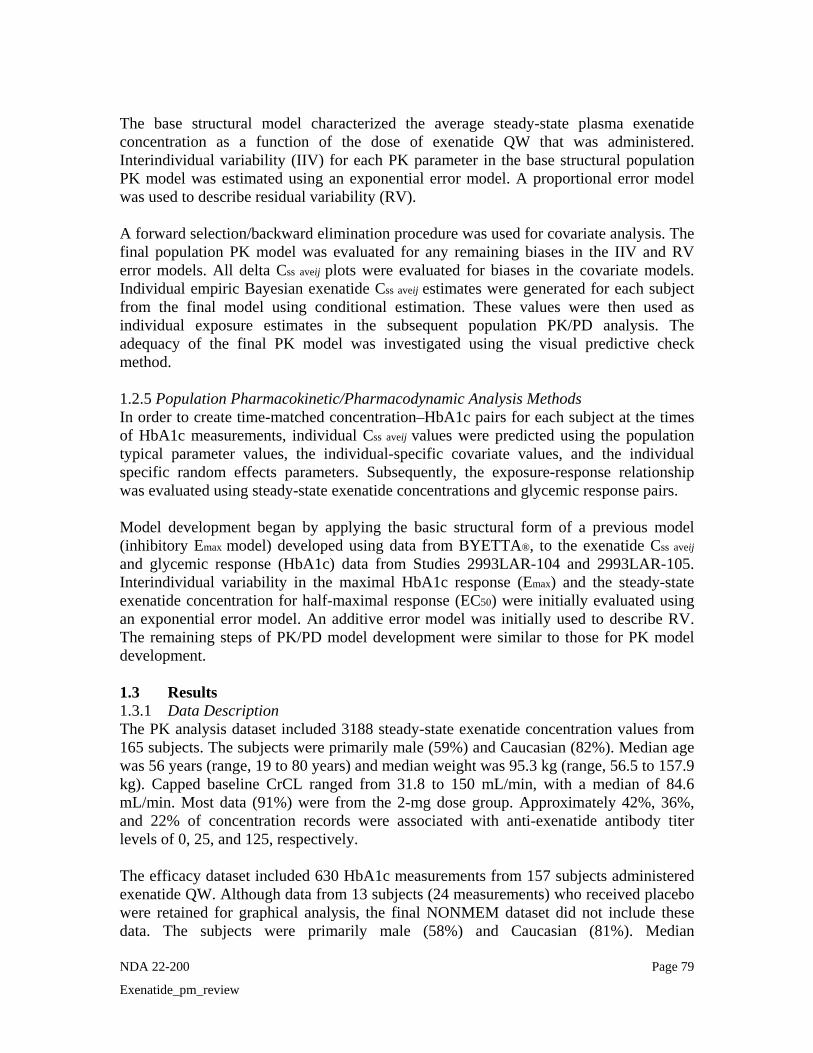
NDA 22-200 Page 79
Exenatide_pm_review
The base structural model characterized the average steady-state plasma exenatide concentration as a function of the dose of exenatide QW that was administered. Interindividual variability (IIV) for each PK parameter in the base structural population PK model was estimated using an exponential error model. A proportional error model was used to describe residual variability (RV). A forward selection/backward elimination procedure was used for covariate analysis. The final population PK model was evaluated for any remaining biases in the IIV and RV error models. All delta Css aveij plots were evaluated for biases in the covariate models. Individual empiric Bayesian exenatide Css aveij estimates were generated for each subject from the final model using conditional estimation. These values were then used as individual exposure estimates in the subsequent population PK/PD analysis. The adequacy of the final PK model was investigated using the visual predictive check method. 1.2.5 Population Pharmacokinetic/Pharmacodynamic Analysis Methods In order to create time-matched concentration–HbA1c pairs for each subject at the times of HbA1c measurements, individual Css aveij values were predicted using the population typical parameter values, the individual-specific covariate values, and the individual specific random effects parameters. Subsequently, the exposure-response relationship was evaluated using steady-state exenatide concentrations and glycemic response pairs. Model development began by applying the basic structural form of a previous model (inhibitory Emax model) developed using data from BYETTA®, to the exenatide Css aveij and glycemic response (HbA1c) data from Studies 2993LAR-104 and 2993LAR-105. Interindividual variability in the maximal HbA1c response (Emax) and the steady-state exenatide concentration for half-maximal response (EC50) were initially evaluated using an exponential error model. An additive error model was initially used to describe RV. The remaining steps of PK/PD model development were similar to those for PK model development. 1.3 Results 1.3.1 Data Description The PK analysis dataset included 3188 steady-state exenatide concentration values from 165 subjects. The subjects were primarily male (59%) and Caucasian (82%). Median age was 56 years (range, 19 to 80 years) and median weight was 95.3 kg (range, 56.5 to 157.9 kg). Capped baseline CrCL ranged from 31.8 to 150 mL/min, with a median of 84.6 mL/min. Most data (91%) were from the 2-mg dose group. Approximately 42%, 36%, and 22% of concentration records were associated with anti-exenatide antibody titer levels of 0, 25, and 125, respectively. The efficacy dataset included 630 HbA1c measurements from 157 subjects administered exenatide QW. Although data from 13 subjects (24 measurements) who received placebo were retained for graphical analysis, the final NONMEM dataset did not include these data. The subjects were primarily male (58%) and Caucasian (81%). Median

NDA 22-200 Page 80
Exenatide_pm_review
demographic characteristics were: age, 56.5 years (range, 19 to 80 years); baseline weight, 100.76 kg (range, 61.5 to 154.6 kg); body mass index, 32.96 kg/m2 (range, 23.3 to 51.9 kg/m2); and change in weight from baseline, -2.72 kg (range, -36.8 to 10.9 kg). Approximately 45%, 34%, and 21% of records were associated with anti-exenatide antibody titer levels of 0, 25, and 125, respectively. About 74% of HbA1c measurements were recorded in the presence of concomitantly administered metformin. The mean (SD) baseline HbA1c was 8.52% (1.40) for placebo subjects, 8.67% (1.12) for subjects administered 0.8 mg exenatide QW, and 8.30% (1.02) for subjects administered 2 mg exenatide QW. Overall, the mean (SD) of all observed steady-state HbA1c measurements was 7.57% (0.97) for the 0.8-mg dose group and 6.55% (0.65) for the 2-mg dose group. 1.3.2 Population Pharmacokinetic Final Model The final PK model characterizing the steady-state plasma exenatide values in subjects with diabetes mellitus was described by the following equation: Css_aveij = [65.9(CrCli/84.6)-1.84 + 200.Dosei + 21.1 T25ij + 82.6 T125ij +98.7 Scalei].exp ηi
Where: j
Css _ ave = individual predicted steady-state exenatide concentration (pg/mL) for the ith
subject at the jth measurement; CrCLi = observed baseline CrCL (mL/min) in the ith subject; Dosei = indicator variable for the exenatide dose (mg) observed in the ith subject (1 = 2 mg and 0 = 0.8 mg);
T25ij = indicator variable for the presence of anti-exenatide antibody titer of 25 observed in the ith subject at the jth measurement (1 = titer of 25 else 0); T125ij = indicator variable for the presence of anti-exenatide antibody titer of 125 observed in the ith subject at the jth measurement (1 = titer of 125 else 0); Scalei = indicator variable for the presence of manufacturing scale observed in the ith
subject (1 = and 0 = and ηi = interindividual variability random effect estimate for the ith subject. The model predicts that as CrCL decreases, mean steady-state concentrations increase, primarily for subjects with mild to moderate renal impairment. For antibody titers of 25 and 125, additive shifts in steady-state concentrations of 21.1 pg/mL and 82.6 pg/mL are predicted. The model predicts the highest mean concentration (825 pg/mL) for subjects with moderately decreased renal function, an associated anti-exenatide antibody titer level of 125, and the manufacturing scale. The model predicts the lowest mean concentration (266 pg/mL) for subjects with normal renal function, a negative anti-exenatide antibody titer level, and the manufacturing scale. 1.3.3 Pharmacokinetic/Pharmacodynamic Final Model for HbA1c An inhibitory Emax model, with the estimation of IIV on Emax, described the relationship between HbA1c and exenatide Css aveij. The final exposure-response model included baseline HbA1c, anti-exenatide antibody titer, and change in body weight from baseline as significant predictors of Emax. A visual predictive check indicated that the PK/PD
(b) (4)
(b) (4)
(b) (4)
(b) (4)
(b) (4)
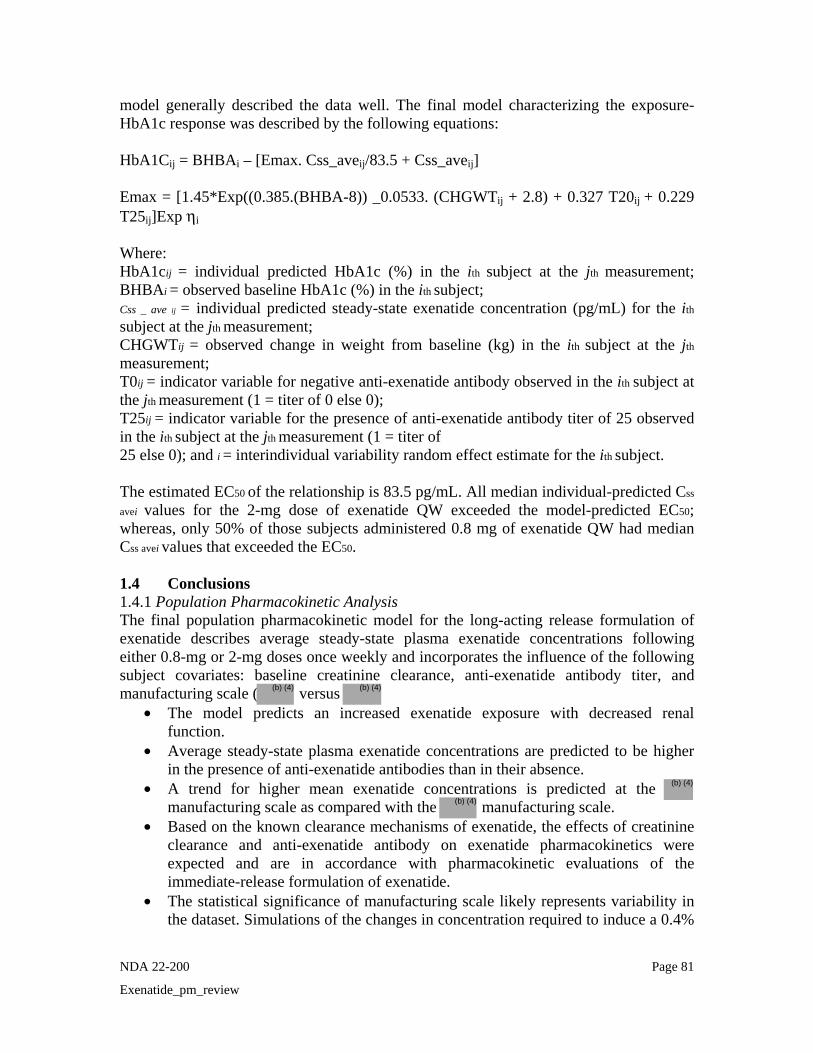
NDA 22-200 Page 81
Exenatide_pm_review
model generally described the data well. The final model characterizing the exposure- HbA1c response was described by the following equations: HbA1Cij = BHBAi – [Emax. Css_aveij/83.5 + Css_aveij] Emax = [1.45*Exp((0.385.(BHBA-8)) _0.0533. (CHGWTij + 2.8) + 0.327 T20ij + 0.229 T25ij]Exp ηi
Where: HbA1cij = individual predicted HbA1c (%) in the ith subject at the jth measurement; BHBAi = observed baseline HbA1c (%) in the ith subject; Css _ ave ij = individual predicted steady-state exenatide concentration (pg/mL) for the ith
subject at the jth measurement; CHGWTij = observed change in weight from baseline (kg) in the ith subject at the jth
measurement; T0ij = indicator variable for negative anti-exenatide antibody observed in the ith subject at the jth measurement (1 = titer of 0 else 0); T25ij = indicator variable for the presence of anti-exenatide antibody titer of 25 observed in the ith subject at the jth measurement (1 = titer of 25 else 0); and i = interindividual variability random effect estimate for the ith subject. The estimated EC50 of the relationship is 83.5 pg/mL. All median individual-predicted Css
avei values for the 2-mg dose of exenatide QW exceeded the model-predicted EC50; whereas, only 50% of those subjects administered 0.8 mg of exenatide QW had median Css avei values that exceeded the EC50. 1.4 Conclusions 1.4.1 Population Pharmacokinetic Analysis The final population pharmacokinetic model for the long-acting release formulation of exenatide describes average steady-state plasma exenatide concentrations following either 0.8-mg or 2-mg doses once weekly and incorporates the influence of the following subject covariates: baseline creatinine clearance, anti-exenatide antibody titer, and manufacturing scale ( versus
• The model predicts an increased exenatide exposure with decreased renal function.
• Average steady-state plasma exenatide concentrations are predicted to be higher in the presence of anti-exenatide antibodies than in their absence.
• A trend for higher mean exenatide concentrations is predicted at the manufacturing scale as compared with the manufacturing scale.
• Based on the known clearance mechanisms of exenatide, the effects of creatinine clearance and anti-exenatide antibody on exenatide pharmacokinetics were expected and are in accordance with pharmacokinetic evaluations of the immediate-release formulation of exenatide.
• The statistical significance of manufacturing scale likely represents variability in the dataset. Simulations of the changes in concentration required to induce a 0.4%
(b) (4)
(b) (4)
(b) (4)
(b) (4)
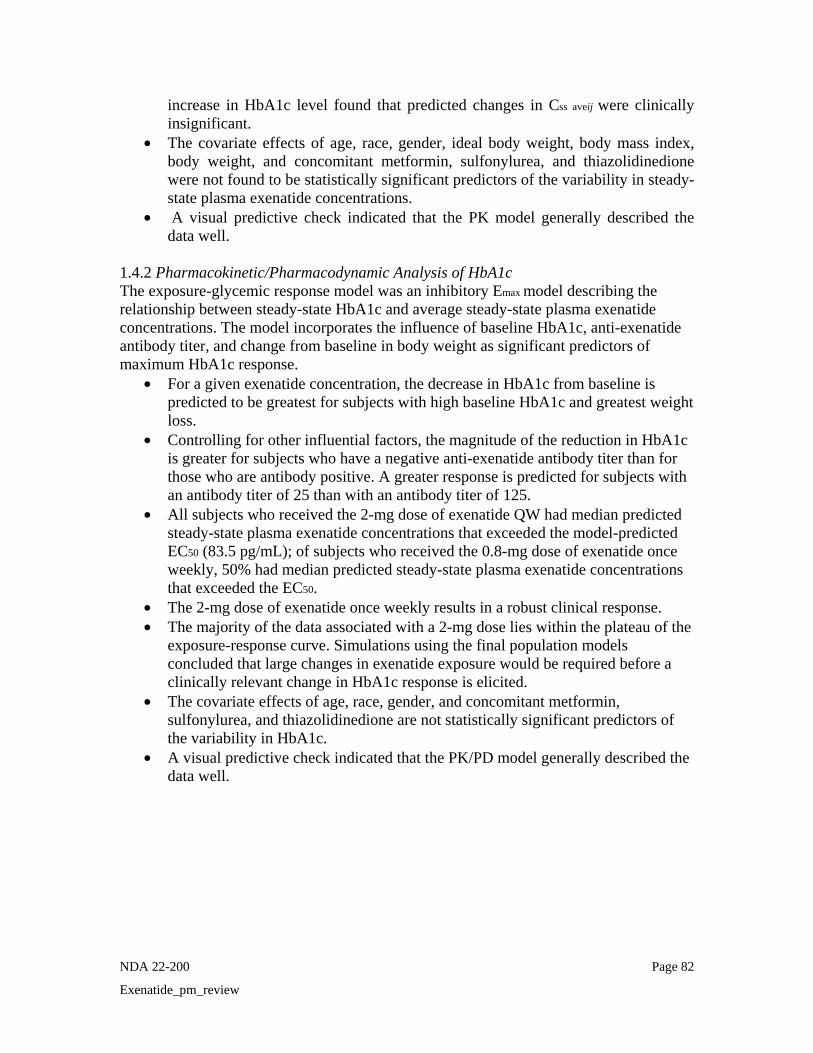
NDA 22-200 Page 82
Exenatide_pm_review
increase in HbA1c level found that predicted changes in Css aveij were clinically insignificant.
• The covariate effects of age, race, gender, ideal body weight, body mass index, body weight, and concomitant metformin, sulfonylurea, and thiazolidinedione were not found to be statistically significant predictors of the variability in steady-state plasma exenatide concentrations.
• A visual predictive check indicated that the PK model generally described the data well.
1.4.2 Pharmacokinetic/Pharmacodynamic Analysis of HbA1c The exposure-glycemic response model was an inhibitory Emax model describing the relationship between steady-state HbA1c and average steady-state plasma exenatide concentrations. The model incorporates the influence of baseline HbA1c, anti-exenatide antibody titer, and change from baseline in body weight as significant predictors of maximum HbA1c response.
• For a given exenatide concentration, the decrease in HbA1c from baseline is predicted to be greatest for subjects with high baseline HbA1c and greatest weight loss.
• Controlling for other influential factors, the magnitude of the reduction in HbA1c is greater for subjects who have a negative anti-exenatide antibody titer than for those who are antibody positive. A greater response is predicted for subjects with an antibody titer of 25 than with an antibody titer of 125.
• All subjects who received the 2-mg dose of exenatide QW had median predicted steady-state plasma exenatide concentrations that exceeded the model-predicted EC50 (83.5 pg/mL); of subjects who received the 0.8-mg dose of exenatide once weekly, 50% had median predicted steady-state plasma exenatide concentrations that exceeded the EC50.
• The 2-mg dose of exenatide once weekly results in a robust clinical response. • The majority of the data associated with a 2-mg dose lies within the plateau of the
exposure-response curve. Simulations using the final population models concluded that large changes in exenatide exposure would be required before a clinically relevant change in HbA1c response is elicited.
• The covariate effects of age, race, gender, and concomitant metformin, sulfonylurea, and thiazolidinedione are not statistically significant predictors of the variability in HbA1c.
• A visual predictive check indicated that the PK/PD model generally described the data well.
ApplicationType/Number
SubmissionType/Number Submitter Name Product Name
-------------------- -------------------- -------------------- ------------------------------------------NDA-22200 ORIG-1 AMYLIN
PHARMACEUTICALS INC
EXENATIDE LAR
---------------------------------------------------------------------------------------------------------This is a representation of an electronic record that was signedelectronically and this page is the manifestation of the electronicsignature.---------------------------------------------------------------------------------------------------------/s/----------------------------------------------------
JAYABHARATHI VAIDYANATHAN01/20/2010
MANOJ KHURANA01/21/2010
CHRISTINE E GARNETT01/21/2010For Christoffer Tornoe, PM Team Leader
SALLY Y CHOE01/22/2010

1
Office of Clinical Pharmacology
New Drug Application Filing and Review Form General Information About the Submission Information Information NDA Number 22-200 Brand Name Bydureon OCP Division DCP2 Generic Name Exenatide injection (extended
release) Medical Division DMEP Drug Class GLP-1 analog OCP Reviewer Jayabharathi Vaidyanathan,
Ph.D. Indication(s) Type 2 diabetes
OCP Team Leader (Acting) Wei Qiu, Ph.D. Dosage Form Injectable suspension Dosing Regimen Weekly
Date of Submission 5/4/09 Route of Administration SC injection
Estimated Due Date of OCPB Review Sponsor Amylin Pharmaceuticals
PDUFA Due Date 3/5/10 Priority Classification S1
Division Due Date
Clin. Pharm. and Biopharm. Information “X” if included
at filing Number of studies submitted
Number of studies reviewed
Critical Comments If any
STUDY TYPE Table of Contents present and sufficient to locate reports, tables, data, etc.
X
Tabular Listing of All Human Studies X HPK Summary X Labeling X Reference Bioanalytical and Analytical Methods
X
I. Clinical Pharmacology Mass balance: Isozyme characterization: Blood/plasma ratio: Plasma protein binding: Pharmacokinetics (e.g., Phase I) - Healthy Volunteers- single dose: x 3 3 ALK23001, 2993LAR102, BCB107 multiple dose: X Patients- single dose: X 2 2 2993LAR101, 2993LAR103 multiple dose: X 3 3 2993LAR104, 2993LAR105;
Japanese PK (H80JEGWBW) Dose proportionality - fasting / non-fasting single dose: fasting / non-fasting multiple dose: Drug-drug interaction studies - In-vivo effects on primary drug: In-vivo effects of primary drug: In-vitro: Subpopulation studies - ethnicity: gender:

2
pediatrics: geriatrics: (Age) renal impairment: hepatic impairment: PD: Phase 2: Phase 3:
PK/PD: Phase 1 and/or 2, proof of concept: Phase 3 clinical trial: Population Analyses - Data rich: X 1 1 Data sparse: II. Biopharmaceutics Absolute bioavailability: Relative bioavailability - solution as reference: alternate formulation as reference: Bioequivalence studies - traditional design; single / multi dose: replicate design; single / multi dose: Food-drug interaction studies:
Dissolution:
(IVIVC): Bio-wavier request based on BCS BCS class III. Other CPB Studies Genotype/phenotype studies:
Chronopharmacokinetics Pediatric development plan
Literature References
Total Number of Studies 8
Filability and QBR comments “X” if yes Comments
Application filable ? YES Reasons if the application is not filable (or an attachment if applicable)
Comments sent to firm ? •
QBR questions (key issues to be considered)
• What are the PK characteristics of exenatide from this extended release formulation?
• What is the exposure-response of exenatide from this formulation? • Is the proposed dose acceptable? • Is there any effect of covariates like age, gender, body weight, antibody on
exenatide LAR PK? Other comments or information not included above
Primary reviewer Signature and Date Jaya bharathi Vaidyanathan, Ph.D.
Secondary reviewer Signature and Date Wei Qiu, Ph.D.
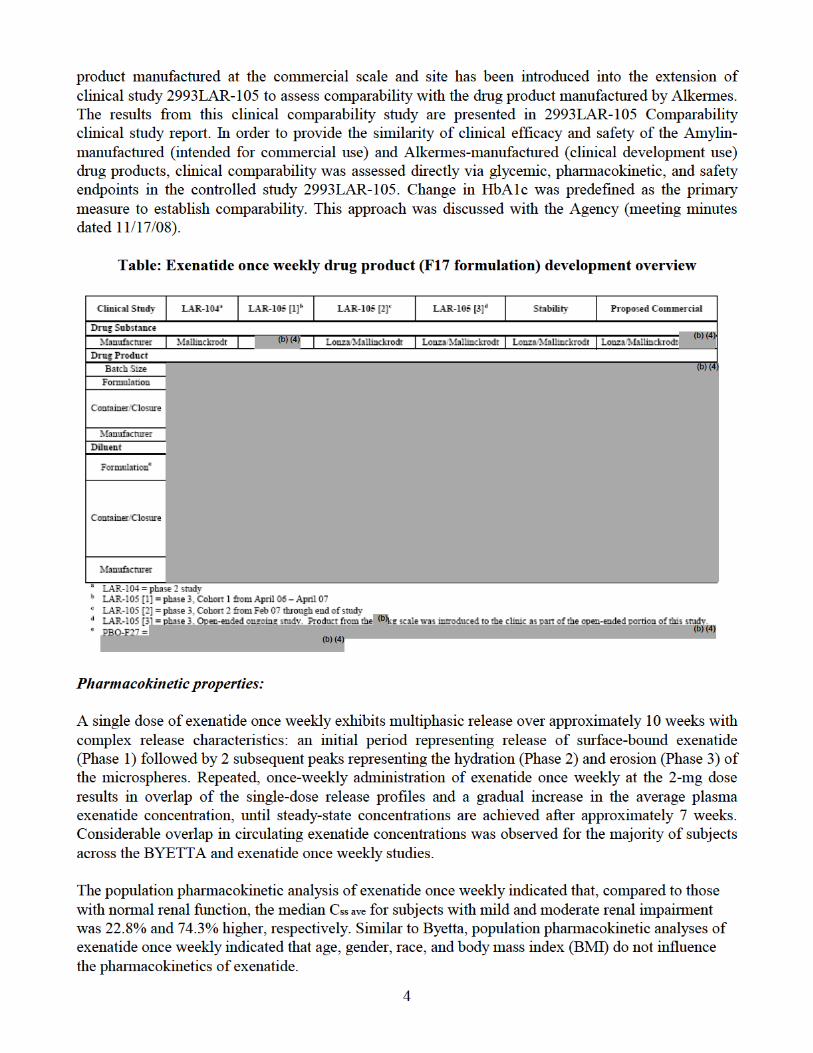
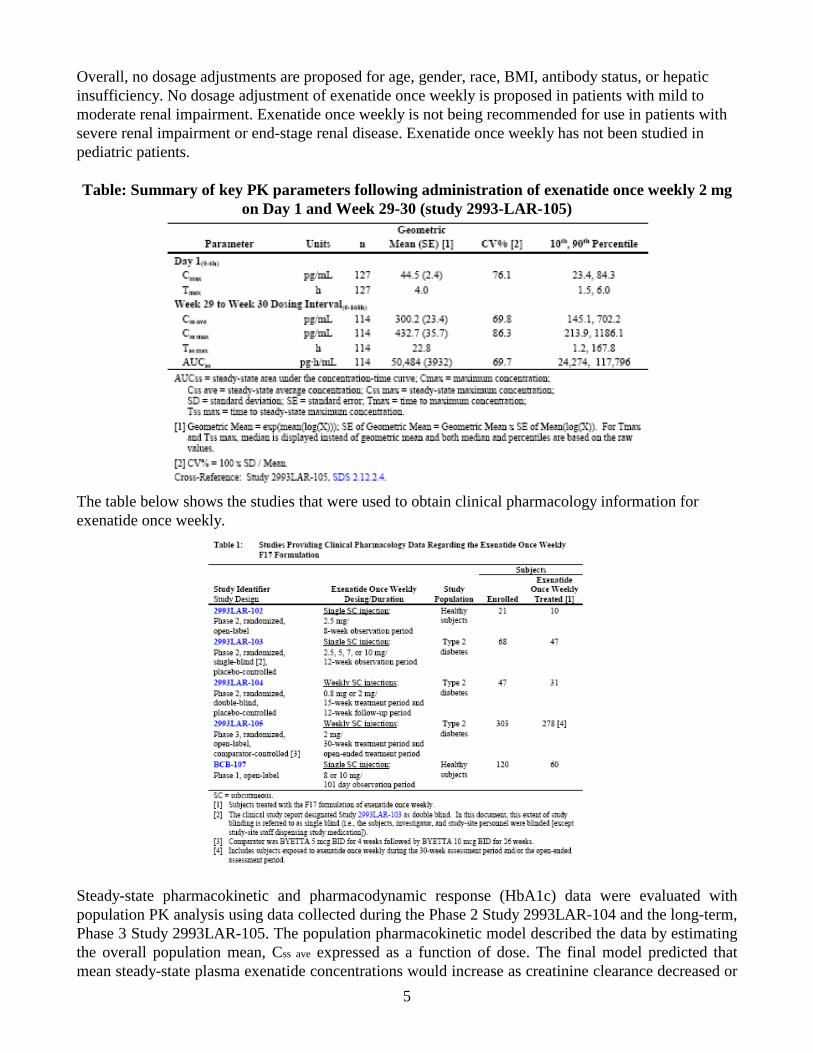
5
Overall, no dosage adjustments are proposed for age, gender, race, BMI, antibody status, or hepatic insufficiency. No dosage adjustment of exenatide once weekly is proposed in patients with mild to moderate renal impairment. Exenatide once weekly is not being recommended for use in patients with severe renal impairment or end-stage renal disease. Exenatide once weekly has not been studied in pediatric patients. Table: Summary of key PK parameters following administration of exenatide once weekly 2 mg
on Day 1 and Week 29-30 (study 2993-LAR-105)
The table below shows the studies that were used to obtain clinical pharmacology information for exenatide once weekly.
Steady-state pharmacokinetic and pharmacodynamic response (HbA1c) data were evaluated with population PK analysis using data collected during the Phase 2 Study 2993LAR-104 and the long-term, Phase 3 Study 2993LAR-105. The population pharmacokinetic model described the data by estimating the overall population mean, Css ave expressed as a function of dose. The final model predicted that mean steady-state plasma exenatide concentrations would increase as creatinine clearance decreased or
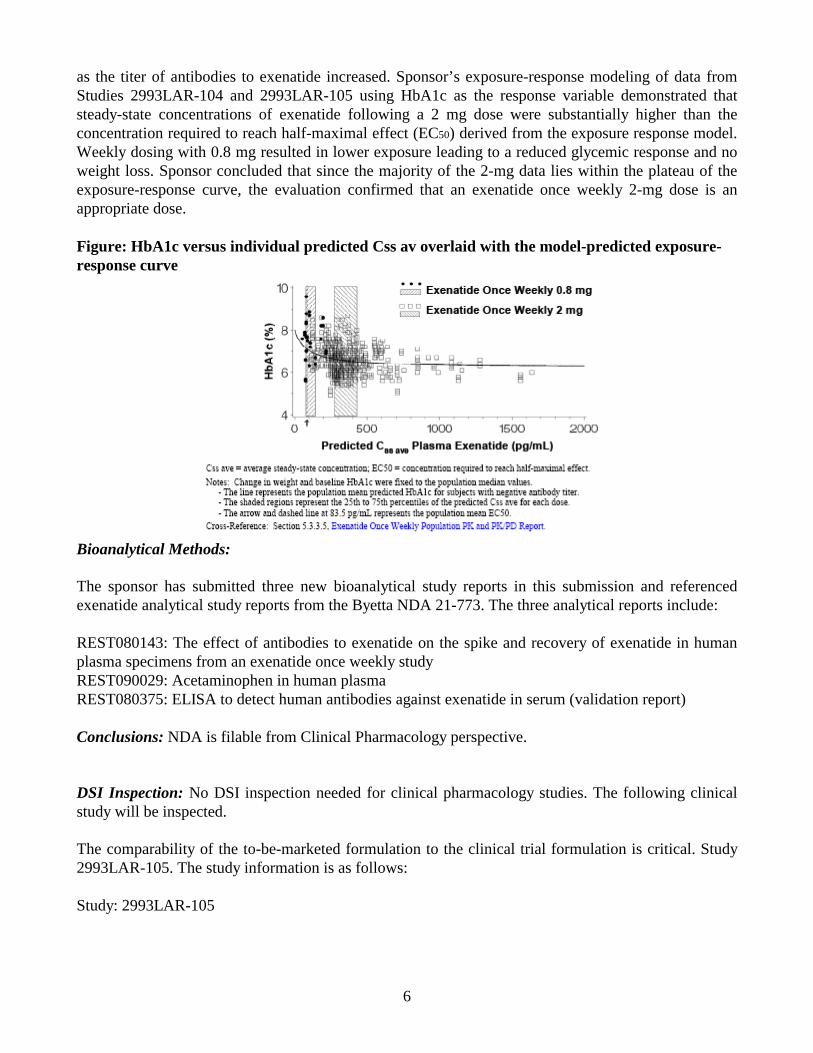
6
as the titer of antibodies to exenatide increased. Sponsor’s exposure-response modeling of data from Studies 2993LAR-104 and 2993LAR-105 using HbA1c as the response variable demonstrated that steady-state concentrations of exenatide following a 2 mg dose were substantially higher than the concentration required to reach half-maximal effect (EC50) derived from the exposure response model. Weekly dosing with 0.8 mg resulted in lower exposure leading to a reduced glycemic response and no weight loss. Sponsor concluded that since the majority of the 2-mg data lies within the plateau of the exposure-response curve, the evaluation confirmed that an exenatide once weekly 2-mg dose is an appropriate dose. Figure: HbA1c versus individual predicted Css av overlaid with the model-predicted exposure-response curve
Bioanalytical Methods: The sponsor has submitted three new bioanalytical study reports in this submission and referenced exenatide analytical study reports from the Byetta NDA 21-773. The three analytical reports include: REST080143: The effect of antibodies to exenatide on the spike and recovery of exenatide in human plasma specimens from an exenatide once weekly study REST090029: Acetaminophen in human plasma REST080375: ELISA to detect human antibodies against exenatide in serum (validation report) Conclusions: NDA is filable from Clinical Pharmacology perspective. DSI Inspection: No DSI inspection needed for clinical pharmacology studies. The following clinical study will be inspected. The comparability of the to-be-marketed formulation to the clinical trial formulation is critical. Study 2993LAR-105. The study information is as follows: Study: 2993LAR-105

8
Clinical studies: A brief description of the clinical studies is mentioned below: 2993LAR-105 Comparability study: This was a phase 3 randomized open-label, comparator controlled multiple dose study in T2DM patients to demonstrate that exenatide once weekly from 2 different manufacturing sites exerts a comparable clinical response on glycemic control (HbA1c). BCB107: This was a Phase 1 study to evaluate the single dose PK profiles in healthy subjects of different formulations of exenatide once weekly to support IVIVC analysis. ALK23-001: This was a Phase 1 study in healthy subjects to determine safety and tolerability of 3 formulations of exenatide once weekly following sc administration. 2993LAR-101: This was a Phase 2 randomized, single-blind, placebo controlled single dose study in T2DM patients to assess the safety of single SC injection of exenatide once weekly presented in one of two formulations. The formulation used in this study was not used for further development. 2993LAR-102: This was a Phase 2 open-label, single dose study in healthy subjects to assess the safety and tolerability of a single sc injection of two formulations of exenatide once weekly. Of the two formulations, the F17 was selected for further evaluation. 2993LAR-103: This was a Phase 2 randomized, placebo-controlled single-dose study in T2DM patients to assess the PK following sc administration. 2993LAR-104: This was a Phase 2 randomized, double-blind, placebo-controlled, multiple-dose study in T2DM patients. 29933LAR-105: This was a Phase 3 open-label, comparator controlled multiple dose study to compare the effect on HbA1c as compared to Byetta BID for 30 weeks. H8O-JE-GWBW: This was a Phase 1 multiple dose study to assess the safety and tolerability of exenatide once weekly administered for 10 weeks by SC in Japanese T2DM patients.
Tabular listing of all clinical studies:
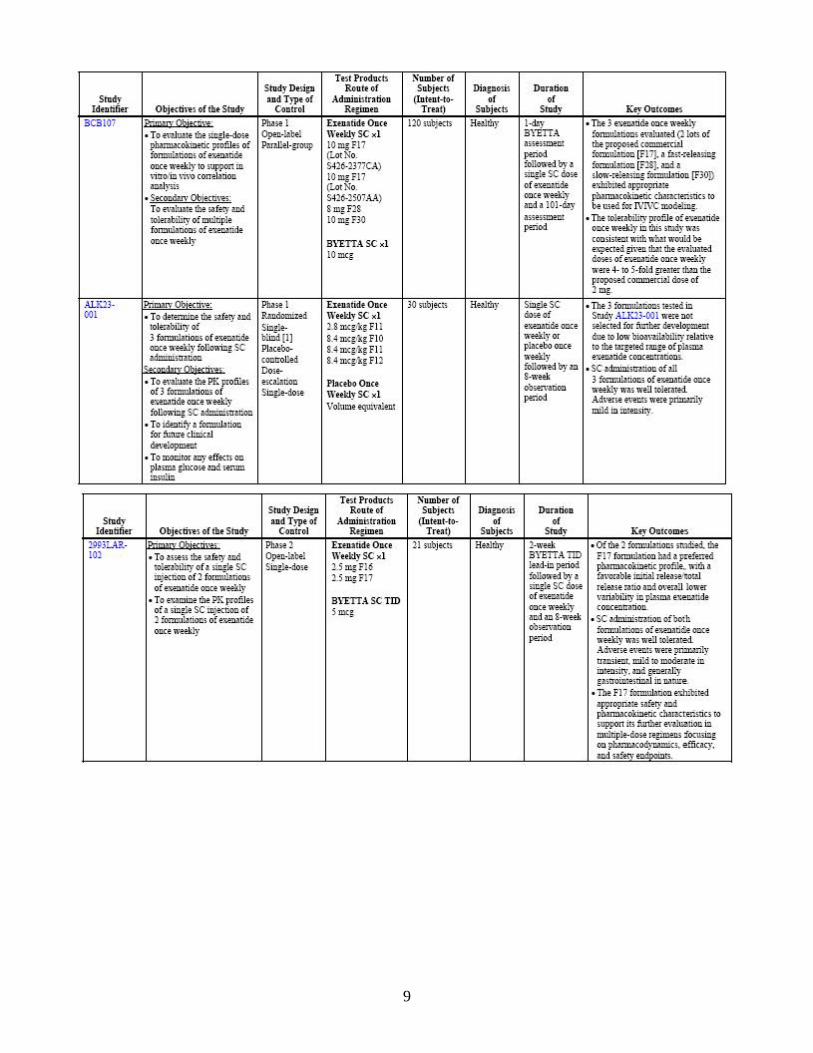
9
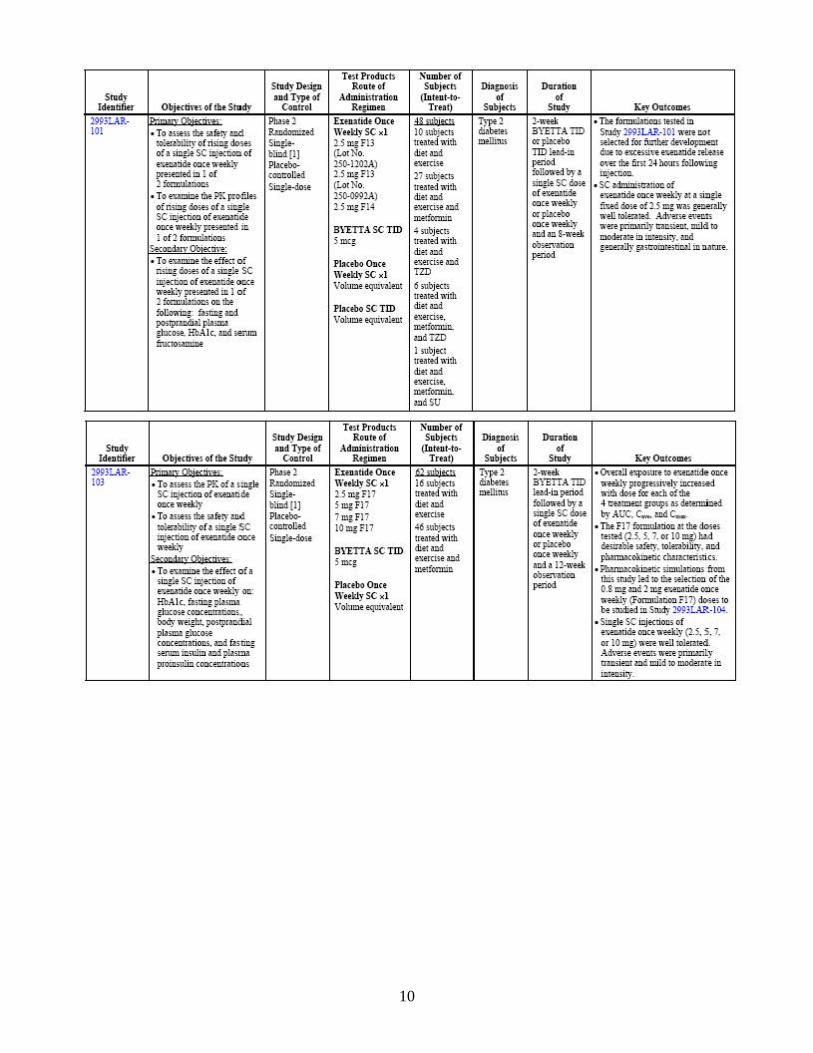
10
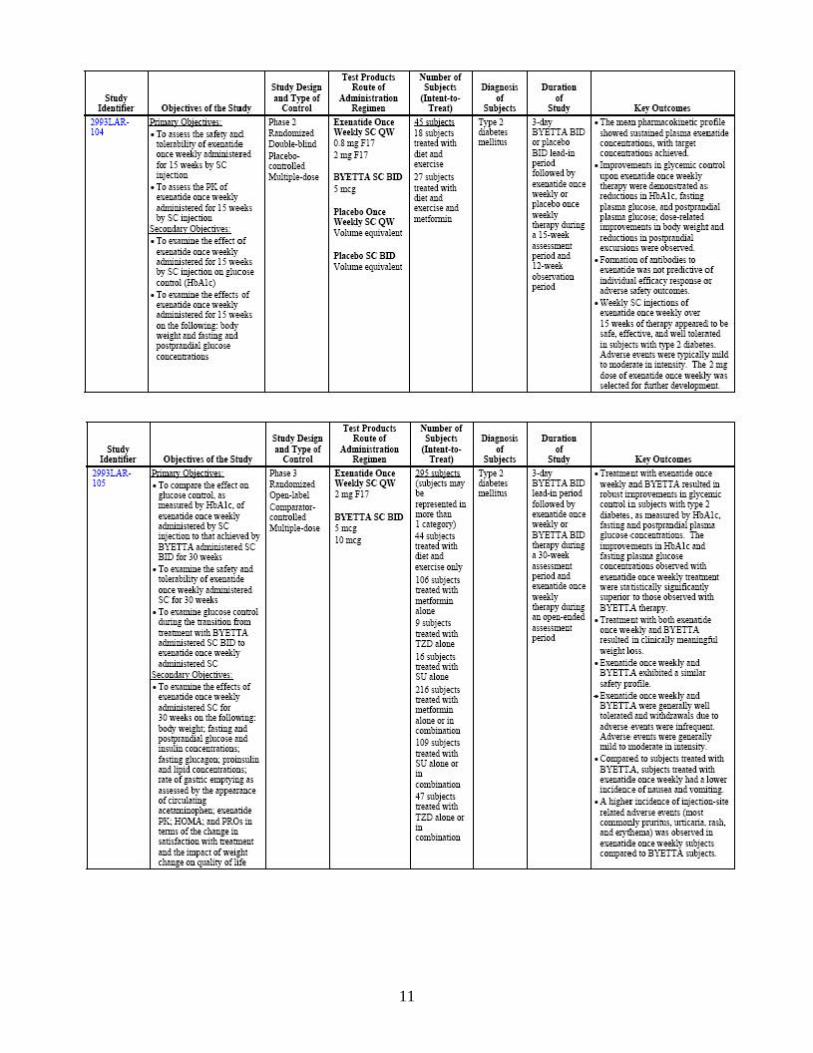
11

12
---------------------------------------------------------------------------------------------------------This is a representation of an electronic record that was signedelectronically and this page is the manifestation of the electronicsignature.---------------------------------------------------------------------------------------------------------/s/----------------------------------------------------
JAYABHARATHI VAIDYANATHAN08/13/2009
WEI QIU08/13/2009