Embed Size (px)
Citation preview

THE UNIVERSITY OF ARIZONA CENTER FOR RURAL HEALTH REPORT
AzCRH 2015 Arizona Pharmacist Supply and Demand Study Report
Howard Eng, Nicholas Jennings, Joe Tabor, Tara Montgomery, Daniel Derksen
February 2016

i
Executive Summary In 2014, Arizona joined 34 other states in passing legislation recognizing pharmacists as medical providers. Pharmacists are medication experts and the primary dispensers of prescription drugs. They promote the appropriate use of both prescription and over-the-counter drugs. Pharmacists increasingly provide other health services such as health information and screening, vaccinations, and referral to other health providers. Pharmacies provide entry points into the health care system and are a vital part of Arizona’s safety net health care system, especially in rural areas where health resources are limited.
The 2014 National Pharmacists Workforce Survey findings provided national data on the supply and demand for pharmacists. There is little data on the supply and demand for pharmacists in Arizona. To address this information gap, the Arizona Center for Rural Health (AzCRH) at the Mel and Enid Zuckerman College of Public Health (MEZCOPH), The University of Arizona Health Sciences (UAHS) conducted and published this AzCRH 2015 Pharmacist Supply and Demand Study Report. The study was funded in part by the Arizona Area Health Education Centers (AHEC) Program and the state of Arizona. The AzCRH 2015 Pharmacist Supply and Demand Study Report examines Arizona pharmacist, pharmacy technician, and pharmacy trends over an eight-year period (2006-13). Data trends were analyzed to forecast potential changes in pharmacist and pharmacy technician demand and supply over the next five years. The Report uses both primary and secondary data sources.
Between 2006-13, Arizona increased the number of pharmacists (by 32.4%), pharmacy technicians (by 71.1%), and pharmacies (by 5.5%). Due to population growth, there was no change in Arizona’s pharmacies per 100,000 population ratio between 2010-13. Seven Arizona counties had no change in pharmacies per 100,000 population, while Gila, Graham, Pinal and Santa Cruz Counties had net losses. Many factors impact the supply and demand for pharmacists. Since 2006, the two Arizona Colleges of Pharmacy graduated 200 or more pharmacists per year. In 2013, 19.1% of Arizona’s practicing pharmacists were age 62 years or older (eligible retirement age). There was a higher percentage of age 65 years or older pharmacists working in rural than in urban areas. “Baby boomer” pharmacist retirement will likely disproportionately decrease the number of pharmacists available in rural areas. Three-quarters of the pharmacists that responded indicate that their practice sites provide clinical services, direct care or counseling to their patients. The top five pharmacy services expected to expand in the next five-years are: immunization, diabetes management, drug information services, health screening, and hypertension management. Expansion of services may increase the demand for pharmacists.
The spatial inequalities of pharmacists in rural areas persist. Strategies to enhance access to rural pharmacist services include establishing an Arizona Rural Pharmacy Task Force, using tele-pharmacy technologies, increasing recruitment (e.g., using Arizona 3RNet), creating retention incentives (e.g., loan repayment for pharmacists practicing in rural areas), and expanding Medicare Part B covered services to include pharmacist services delivered in Health Profession Shortage Areas, Medically Underserved Areas and Medically Underserved Populations (HRSA/MUA/P).

ii
Acknowledgments
The University of Arizona Center for Rural Health AzCRH 2015 Arizona Pharmacist Supply and Demand Report was funded in part by the Arizona Area Health Education Centers Program (AzAHEC) and the state of Arizona. We thank the following organizations and individuals for their assistance and participation:
• Dr. Sally J. Reel, Director, AzAHEC and University of Arizona Health Science (UAHS) Associate Vice President for Health Sciences Interprofessional Education, Collaboration and Community Engagement.
• Arizona State Board of Pharmacy (ASBP) for providing data on pharmacists, pharmacy technicians, and pharmacies, and for helping develop the AzCRH pharmacist survey tool.
• Hal Wand, President, National Association of Boards of Pharmacy. • Rob Dobrowski, Information Technologist, ASBP. • Arizona Pharmacy Association (APA) for helping develop the AzCRH pharmacist survey
tool. • Kelly Ridgeway, Chief Executive Officer and Executive Director, APA. • UAHS College of Pharmacy (COP) for helping develop the AzCRH pharmacist survey
tool. • Dr. John Murphy, Interim Dean and Professor, UAHS, COP. • Dr. Lyle Bootman, Professor, UAHS, COP. • Midwestern University COP for helping develop the AzCRH pharmacist survey tool. • Dr. Mary K. Gurney, Assistant Professor, Midwestern University COP. • Arizona State University (ASU) Center for Health Information and Research (CHiR) for
the pharmacist and pharmacy technician license/certification renewal survey data. • Tameka Sama, Senior Coordinator, ASU, CHiR. • Gevork Harootunian, Statistical Programmer, ASU, CHiR. • American Association of Colleges of Pharmacy (AACP) for the use of the Aggregate
Demand Index and providing the two Arizona Colleges of Pharmacy graduation data. • Dr. Lucinda Maine, Executive Vice President and Chief Executive Officer, AACP. • Danielle A. Taylor, Director of Institutional Research and Effectiveness, AACP. • Dr. Jon C. Schommer, Professor, University of Minnesota COP for permission to use
National Pharmacist Workforce and Minnesota Survey questions. • Kalani Anderson, Chair, Technician Academy, APA. • Eleanor Dorsey, Manager of Customer Services, Pharmacy Technician Certification
Board. • Paul Akmajian, Manager, Marketing & Outreach, AzCRH for the Report’s cover design,
formatting, layout and pharmacy location map. • The pharmacists who participated in the AzCRH 2014 Arizona Pharmacist Survey.

iii
Authors and Affiliations
Howard J. Eng, MS, DrPH, RPh - Associate Professor (Retired) in the Public Health Policy and Management (PHPM) Program in the Community, Environment and Policy (CEP) Department, Mel and Enid Zuckerman College of Public Health (MEZCOPH), and in Pharmacy Practice and Science Department, COP, University of Arizona Health Sciences (UAHS) – Tucson, Arizona.
Nick Jennings, MPH - DrPH graduate student, PHPM Program in the CEP Department, MEZCOPH, UAHS – Tucson, Arizona.
Joe Tabor, PhD - Assistant Professor in PHPM Program, CEP Department, MEZCOPH, UAHS – Tucson, Arizona.
Tara M. Montgomery, PharmD, MBA, MHA - MPH graduate student, Benedictine University, Naperville, Illinois.
Daniel Derksen, MD, Professor, Walter H. Pearce Endowed Chair and Director, AzCRH; PHPM Program, Chair of the CEP Department, MEZCOPH, UAHS – Tucson, Arizona.
The University of Arizona Center for Rural Health serves Arizona through its mission to improve the health and wellness of rural and vulnerable populations. AzCRH houses Arizona’s State Office of Rural Health (AzSORH), the Rural Hospital Flexibility Program (AzFlex), the Small Rural Hospital Improvement Program (AzSHIP), the Western Region Public Health Training Center (WRPHTC), the AzCRH Navigator Consortium and other programs. http://crh.arizona.edu
Suggested citation for this report: Eng H, Jennings N, Tabor J, Montgomery T, Derksen D. The University of Arizona Center for Rural Health: AzCRH 2015 Arizona Pharmacist Supply and Demand Study Report. February 2016. http://crh.arizona.edu

iv
Table of Contents Page Executive Summary………………………………………………………………... i Acknowledgments ………………………………………………………………… ii
Authors, Affiliations and Contributions……………………………………………. iii Table of Contents ………………………………………………………………….. iv
List of Tables ……………………………………………………………………… v List of Figures ……………………………………………………………………... vi
Introduction ………………………………………………………………………... 1 Pharmacist Supply and Demand Factors ………………………………………….. 2
Data Sources and Methodology …………………………………………………… Data Sources ……………………………………………………………………..
Urban and Rural Definitions (Rural Urban Commuting Areas) ………………… Study Limitations ………………………………………………………………...
2 2
3 3
Findings …………………………………………………………………………… National Aggregate Demand Index Scores ………………………………………
National Ranking ………………………………………………………………... Arizona Colleges of Pharmacy Graduation Numbers …………………………… Pharmacists ………………………………………………………………………
Pharmacy Technicians ………………………………………………………….. Pharmacies ……………………………………………………………………….
3 3
4 4 5
13 18
Summary and Recommendations..………………………………………………… 21 References …………………………………………………………………………. 23
Appendices ………………………………………………………………………… 24 A. ASBP 2012-13 Pharmacist and Pharmacy Technician Surveys…………….. B. AzCRH 2014 Pharmacist Survey ……………….………………………….. C. List of Arizona Towns and Cities and their Ruralness
Classification: 2000 and 2010 …………………………………………….. D. Number of Pharmacists in Arizona Towns and Cities: 2013 ……….….….. E. Number of Pharmacy Technicians in Arizona Towns and Cities: 2013..….. F. Number of Pharmacies in Arizona Towns and Cities: 2013 ……..………..…
24 30 42 49 56 63
v
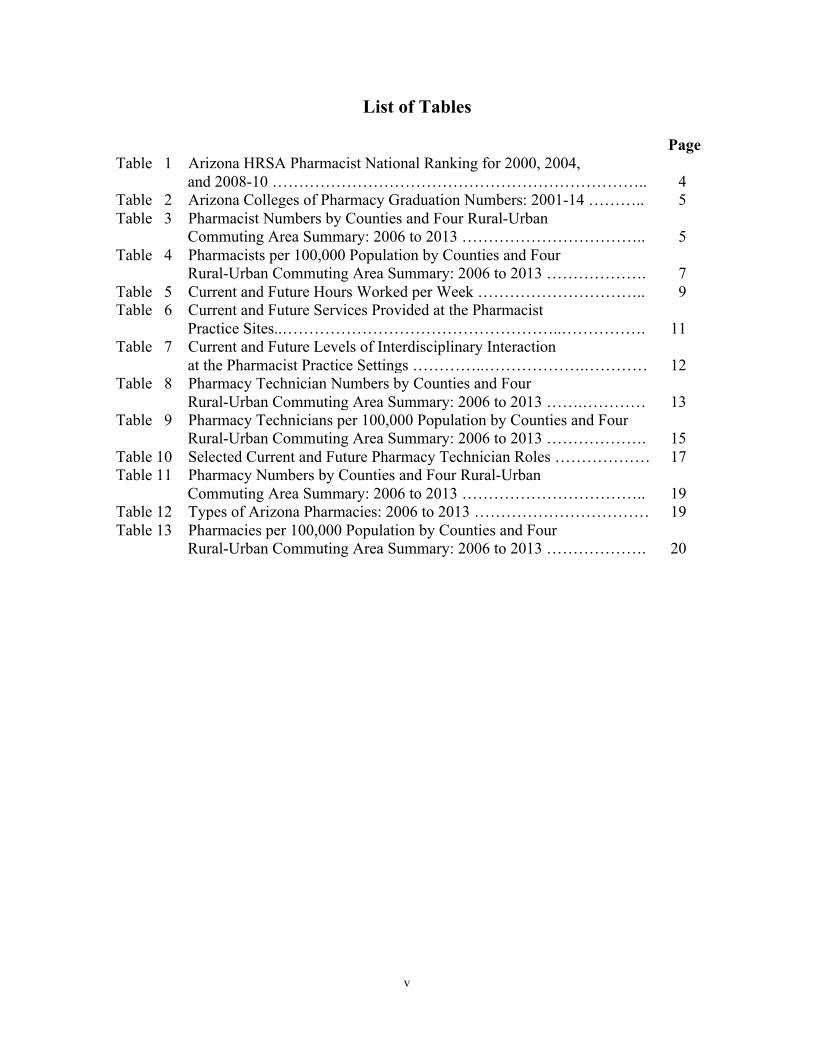
List of Tables
Page Table 1 Arizona HRSA Pharmacist National Ranking for 2000, 2004, and 2008-10 ……………………………………………………………..
4
Table 2 Arizona Colleges of Pharmacy Graduation Numbers: 2001-14 ……….. 5 Table 3 Pharmacist Numbers by Counties and Four Rural-Urban Commuting Area Summary: 2006 to 2013 ……………………………..
5
Table 4 Pharmacists per 100,000 Population by Counties and Four Rural-Urban Commuting Area Summary: 2006 to 2013 ……………….
7
Table 5 Current and Future Hours Worked per Week ………………………….. 9 Table 6 Current and Future Services Provided at the Pharmacist Practice Sites..……………………………………………..…………….
11
Table 7 Current and Future Levels of Interdisciplinary Interaction at the Pharmacist Practice Settings …………..……………….…………
12
Table 8 Pharmacy Technician Numbers by Counties and Four Rural-Urban Commuting Area Summary: 2006 to 2013 …….…………
13
Table 9 Pharmacy Technicians per 100,000 Population by Counties and Four Rural-Urban Commuting Area Summary: 2006 to 2013 ……………….
15
Table 10 Selected Current and Future Pharmacy Technician Roles ……………… 17 Table 11 Pharmacy Numbers by Counties and Four Rural-Urban Commuting Area Summary: 2006 to 2013 ……………………………..
19
Table 12 Types of Arizona Pharmacies: 2006 to 2013 …………………………… 19 Table 13 Pharmacies per 100,000 Population by Counties and Four Rural-Urban Commuting Area Summary: 2006 to 2013 ……………….
20

vi
List of Figures
Page Figure 1 Arizona, Western Region, and National Aggregate Demand Index Trends: 2005-15 ……………………...………….……
4
Figure 2 Pharmacists per 100,000 Population by Arizona and Four Rural-Urban Commuting Area Summary: 2006-09 and 2010-13 ……………………………………………….…….…….
6
Figure 3 Pharmacists per 100,000 Population in Arizona and by Counties Trends: 2006-09 and 2010-13…..………….………….……..
6
Figure 4 Arizona Pharmacist Employment Status: 2012-13..………………..….. 7 Figure 5 Arizona Pharmacist Employment Setting: 2012-13 ….………….……. 8 Figure 6 Arizona Pharmacist Hours Worked Per Week: 2012-13 ……..….……. 8 Figure 7 Arizona Pharmacist Retirement Summary: 2012-13 ………………….. 9 Figure 8 Arizona Pharmacist Retirement Summary: 2014…………………….... 10 Figure 9 Arizona Pharmacist Age Group Urban and Rural Distribution: 2013 ……………………………………………………..
10
Figure 10 Current Interdisciplinary Interaction Levels for Community, Hospital, and Mail Order Pharmacies …………….……..
12
Figure 11 Future Interdisciplinary Interaction Levels for Community, Hospital, and Mail Order Pharmacies …………….……..
13
Figure 12 Pharmacy Technicians per 100,000 Population by Arizona and Four Rural-Urban Commuting Area Summary: 2006-09 and 2010-13 …………………………………………………………..
14
Figure 13 Pharmacy Technicians per 100,000 Population in Arizona and by Counties: 2006-09 and 2010-13…………………………….……...
14
Figure 14 Arizona Pharmacy Technician Employment Status: 2012-13 ….…..… 15 Figure 15 Arizona Pharmacy Technician Employment Setting: 2012-13 ……….. 16 Figure 16 Arizona Pharmacy Technician Hours Worked per Week: 2012-13..….. 16 Figure 17 Current Pharmacy Technician Roles for Community, Hospital, and Mail Order Pharmacies .………………….…….….……
17
Figure 18 Future Pharmacy Technician Roles for Community, Hospital, and Mail Order Pharmacies .…………….……….….………
17
Figure 19 Map of Pharmacy Locations in Arizona……………………………….. 18 Figure 20 Pharmacies per 100,000 Population by Arizona and Four Rural-Urban Commuting Area Summary: 2006-09 and 2010-13 …………………………………………………..…..………..
20
1
Introduction Pharmacists are the medication experts in the health field and are the primary dispensers of prescription drugs used for the prevention, diagnosis, management and elimination of diseases.1 They promote the appropriate use of both prescription and over-the-counter drugs. Pharmacists increasingly provide additional health services including health information, screening, vaccination, and referral to other health providers in many states. Most pharmacists are employed in the community setting. Pharmacy technicians may carry out certain pharmacist functions under the supervision of a pharmacist. Pharmacies are a vital part of Arizona’s safety net health care system and often provide entry points into the health care system. In 2014, Arizona joined 34 other states in passing legislation (SB 1043) recognizing pharmacists as medical providers.2 During the past two decades, pharmacy practice has evolved from merely dispensing prescription drugs to being the medication expert. Medication dispensing functions (filling prescription drugs) have largely shifted to the pharmacy technicians and automated, computerized refilling and robotic dispensing systems. The three most common services reported by pharmacists offered at their practice sites were (1) medication therapy management (60%); (2) immunization (53%); and (3) adjusting medication therapy (52%).3
The contemporary pharmacist workforce is trained for diverse patient care activities such as drug monitoring, disease management, multidisciplinary clinical care, and patient education. Pharmacists with a PharmD increased to 37.8% in 2014 from 13.9% in 2000.3 The number of American Society of Health System Pharmacists (ASHP) residencies has grown 212% from 697 in 2000 to 2,173 in 2011.4 The number board certified in a pharmacy specialty has doubled every five years, from roughly 3,600 in 2002 to more than 18,000 in 2013.5 The U.S. Bureau of Labor Statistics projected a need for 41,400 additional pharmacists (a 14% increase) from 2012 to 2022.6 Demand for pharmacy services could further increase due to other factors, if statute or regulations allow pharmacists to be reimbursed for services by Medicare Part B in medically underserved communities, the number of pharmacies increases, and services provided by pharmacists continues to evolve as it has over the past decade (e.g., medication therapy management, immunization, pharmacist specialty services, and health reform requirements). The Health Resources and Services Administration (HRSA) National Center for Workforce Analysis reported lower pharmacist per 10,000 population ratios in rural areas (6.4) than urban areas (8.8) between 2008-2010.7
Arizona had the fifth-highest increase in population in 2014, adding nearly 100,000 new residents.8 Arizona’s 114,000 square miles makes it the sixth largest state, exceeded in land area only by Alaska, Texas, California, Montana, and New Mexico.9 It is as large as New York and the New England states combined, and as large as Italy.10 Most of Arizona’s land area is sparsely populated - frontier and rural. However, the majority (three-quarters) of Arizona’s population resides in just two urban centers in Phoenix in Maricopa County, and in Tucson in Pima County.9
The AzCRH 2015 Pharmacist Supply and Demand Study Report examines Arizona pharmacist, pharmacy technician, and pharmacy trends over an eight-year period (2006-13). Data trends were analyzed to forecast potential changes in pharmacist and pharmacy technician demand and supply over the next five years. The Report has five sections: (1) Introduction, (2) Pharmacist Supply and Demand Factors, (3) Data Sources and Methodology, (4) Findings, and (5) Summary and Recommendations.

2
Pharmacist Supply and Demand Factors Many factors impact the pharmacist supply and demand in Arizona.11-13
Pharmacist supply factors include the:
• Capacity of the two Arizona and the many out-of-state pharmacy schools and colleges that train new pharmacists – that feed the pharmacist supply.
• Number of pharmacists retiring, reducing work hours, or leaving the profession – that reduce pharmacist supply.
• Demographics of the pharmacist workforce (e.g., percentage of part-time versus full-time and age group distribution) – full-time and younger pharmacists increase pharmacist supply.
• State of the Arizona economy (e.g., a poor economy may result in fewer work hours available) – that decrease the pharmacist supply.
Pharmacist demand factors include the:
• Use of automation and technology (e.g., prescription drug ordering, refilling and dispensing prescription drugs) - decreasing pharmacist demand.
• Use of pharmacy technicians – decreasing pharmacist demand. • Increase in medication use due to the aging of the population, developing new
medications, increasing insurance coverage for prescription drugs, increasing direct-to-consumer advertising by drug companies, and licensing more practitioners with prescriptive authority – increasing pharmacist demand.
• Market demand (e.g., expanding or reducing pharmacy hours, increasing or decreasing the number of pharmacies, and changing the number of mail order prescriptions) – variability affecting pharmacist demand.
• Expansion of pharmacist practice and roles (e.g., complex pharmaceuticals, genomic prescribing, specialty areas, therapy management, prescriptive authority, giving vaccinations, and providing laboratory results) – increasing pharmacist demand.
• Health Reform (e.g., Medicare Part D, 340 B Drug Pricing Program, Patient Protection and Affordable Care Act (ACA) Medicaid and Marketplace expanded health insurance coverage, and potential passage of Medicare Part B reimbursement for pharmacist services in medically underserved communities) – increasing pharmacist demand.
Data Sources and Methodology The AzCRH 2015 Pharmacist Supply and Demand Study was reviewed and approved by The University of Arizona Human Subjects Protection Program. Data Sources used include:
• American Association of Colleges of Pharmacy provided the two Arizona Colleges of Pharmacy graduation numbers for the 2001-02 to 2013-14 academic years.
• Arizona State Board of Pharmacy provided pharmacist, pharmacy technician, and pharmacy data for 2006-13.
• Arizona State University Center for Health Information and Research provided the Arizona State Board of Pharmacy (ASBP) Pharmacist Renewal License Survey and Pharmacy Technician Renewal Certification Survey data for the 2012-13 renewal

3
license/ certification cycle. Both surveys are required to be completed at the time of renewal for their respective professions (See Appendix A for the survey tool).
• AzCRH, MEZCOPH, UAHS developed and administered the AzCRH 2014 Arizona Pharmacist Workforce Survey to collect information on the pharmacist and pharmacy technician current and future roles (see Appendix B for the study description and the survey tool).
Urban and Rural Definitions: There are generally fewer health resources available in rural than in urban areas, and rural populations are older and sicker than urban populations. There is no single, universally preferred definition of rural, nor can a single rural definition serve all policy purposes.9-10
For the AzCRH 2015 Pharmacist Supply and Demand Study Report, the University of Washington Rural Urban Commuting Areas (RUCAs) rural and urban definitions are used.9-10 RUCA defines the degrees of rural and urban by their proximity to urban areas and the portion of the population that commute from rural to urban areas. The RUCAs used are based on postal zip codes from self-reported addresses that pharmacists, pharmacy technicians, and pharmacies provided the Arizona State Board of Pharmacy during applications or renewals.
The four RUCA classifications used are (1) urban and surrounding areas [e.g., Phoenix], (2) areas around and including large rural towns [e.g., Payson], (3) small, rural towns including surrounding areas [e.g., Alpine], and (4) areas around and including isolated small towns [e.g., Ash Fork]. Both 2000 and 2010 RUCA definitions are used in this study for the 2006-09 and 2010-13 time periods, respectively. Several Arizona towns changed rural classifications between 2000 and 2010 (see Appendix C). Because of these changes, only the 2010-13 time periods were used in describing the urban and rural trends.
Study Limitations include that:
• Not all the addresses provided by the pharmacists and pharmacy technicians are work addresses, some are home addresses. Therefore, over- or under-estimates are possible in the pharmacist and pharmacy technician numbers in some locations.
• Not all the pharmacists and pharmacy technicians participated in the Arizona State Board of Pharmacy renewal license/certification surveys.
• Not all pharmacists participated in the AzCRH 2014 Arizona Pharmacist Workforce Survey.
• Survey information was self-reported data (e.g., some responses may change over time). • Some small towns were classified as urban areas due to their close proximity to urban
centers using RUCA classifications.
Findings National Aggregate Demand Index: The Pharmacy Workforce Center’s Aggregate Demand Index (ADI) is a web-based national report of the demand for pharmacists.11 The data is collected monthly from a panel of individuals who are directly involved in hiring pharmacists across the United States since August 1999. Panelists are selected to represent the major areas of pharmacy practice and different geographic areas; they respond to a survey about the ease or difficulty they experienced in filling a pharmacist position in each state where they hired during the past month. The following rating system is used to describe the demand levels: 5 = high demand, difficulty in filling open positions; 4 = moderate demand, some difficulty in filling open

4
positions; 3 = demand in balance with supply (state of equilibrium); 2 = demand somewhat less than the available pharmacist supply; and 1 = demand much less than the available pharmacist supply. After all the surveys are collected for the month, the ADI state level is calculated by determining the means of the ratings submitted by the panelists who hired pharmacists in the state. Between 2011-13, Arizona’s demand for pharmacists was in balance with the supply of pharmacists in the state (state of equilibrium). After 2013, the demand for pharmacists was slightly higher than the supply. Arizona did better in reaching equilibrium than the nation and the Western Region (see Figure 1). The Western Region includes the Mountain states of Arizona, Colorado, Idaho, Montana, Nevada, New Mexico, Utah, and Wyoming and the Pacific states of Alaska, California, Hawaii, Oregon, and Washington. In February 2015, the Pacific states had a higher ADI score (4.0) than the Mountain states (3.5).
National Rankings: Arizona’s national pharmacist ranking and pharmacist per 100,000 population ratio improved since 2000 (Table 1). Table 1. Arizona HRSA Pharmacist National Ranking for 2000, 2004, and 2008-10
Data Year Arizona #/100,000 National Ranking 20001 41.2 50/50 20042 66.7 46/50 2008-103 73.8 39/46
Source: 12000 HRSA Health Workforce Profile, 2HRSA The United States Health Workforce Profile (2006), and 3HRSA The State Health Workforce Profiles (2014). The 2014 State Ranking was based on the pharmacist per 100,000 working age population. Note: if the total population was used instead of the working age population, the Arizona pharmacist per 100,000 population would be lower. Arizona Colleges of Pharmacy Graduation Numbers: Prior to the 2001-02 academic year, the UA College of Pharmacy was the only pharmacy school in the state. Midwestern University graduated its first class (N=86) of Pharm D’s in 2002. By the 2006-07 academic year the two schools graduated 200 (total) or more pharmacists per year, with 244 graduating from the two

5
colleges in 2013-14 (Table 2). Not all graduates go directly into pharmacy practice; some enter residency programs, get specialty certifications or graduate degrees, or leave the state to practice.
Pharmacists: There were 6,573 active Arizona licensed pharmacists in 2013 (Table 3), an increase of 1,608 (32.4%) from 2006. In 2013, 96.2% of the pharmacists were located in urban areas. There were no pharmacists practicing in Greenlee County from 2006-13. Gila, Graham, Pinal and Santa Cruz Counties had net losses of pharmacists between 2010-13. Urban areas, large rural towns, and small rural towns gained pharmacists, while the isolated rural small towns lost pharmacists. See Appendix D for the number of pharmacists by Arizona city/town for 2013. Table 2. Arizona Colleges of Pharmacy Graduation Summary: 2001-14
School Year University of Arizona Midwestern University Total 2001-02 58 86 144 2002-03 50 92 142 2003-04 45 130 175 2004-05 64 122 186 2005-06 67 125 192 2006-07 75 133 208 2007-08 75 125 200 2008-09 78 131 209 2009-10 84 127 211 2010-11 83 120 203 2011-12 94 130 224 2012-13 95 148 243 2013-14 94 150 244
Source: American Association of Colleges of Pharmacy Table 3. Pharmacist Numbers by Counties and Four Rural-Urban Commuting Areas
Summary: 2006 to 2013
County 2006 2009 2006-09 Chg. 2010 2013 2010-13 Chg.
Apache 8 11 37.5% 13 15 15.4% Cochise 47 45 -4.3% 47 56 19.1% Coconino 90 97 7.8% 108 111 2.8% Gila 31 31 0.0% 32 30 -6.3% Graham 16 23 43.8% 24 22 -8.3% Greenlee 0 0 0.0% 0 0 0.0% La Paz 1 3 100.0% 3 4 33.3% Maricopa 3,379 3,874 14.6% 4,051 4,543 12.1% Mohave 94 116 23.4% 122 122 0.0% Navajo 39 46 17.9% 47 52 10.6% Pima 913 1,046 14.6% 1,088 1,213 11.5% Pinal 134 137 2.2% 148 129 -12.8% Santa Cruz 14 16 14.3% 14 12 -14.3% Yavapai 141 157 11.3% 156 180 15.4% Yuma 58 72 24.1% 80 84 5.0% Arizona – Total 4,965 5,674 14.3% 5,933 6,573 10.8%
2000 RUCA
2006-09 Chg. 2010 RUCA
2010-13 Chg. Urban 4,637 5,297 14.2% 5,699 6,322 10.9% Large Rural Town 195 216 10.8% 187 198 5.9% Small Rural Town 109 131 20.2% 39 48 23.1% Isolated Small Rural Town 24 30 25.0% 8 5 -37.5%
Source: Arizona State Board of Pharmacy

6
Arizona’s ratio of pharmacists per 100,000 population increased from 93 to 99 (6.5%) from 2010-13. Urban areas along with large rural and small rural towns all increased their pharmacists per 100,000 population ratios between 2010-13. Only isolated small rural towns saw a decrease. La Paz County had the largest percent increase from 15 to 20 per 100,000 population (33.3%). Gila, Graham, Mohave, Pinal, and Santa Cruz Counties had decreases in pharmacists per 100,000 population.
Pharmacists to population ratios by ruralness ranged 53 fold between isolated small rural town areas (2 per 100,000) and urban areas (106 per 100,000) in 2013 or greater between Greenlee County (0) and Pima County (122 per 100,000) in 2013 (Figures 2 and 3; and Table 4). Figure 2. Pharmacists per 100,000 Population in Arizona and by Four Rural-Urban Commuting Areas Trends: 2006-09 and 2010-13
Source: Arizona State Board of Pharmacy
Figure 3. Pharmacists per 100,000 Population in Arizona and by Counties Trends: 2006-09 and 2010-13
Source: Arizona State Board of Pharmacy
0
20
40
60
80
100
120
2006 2007 2008 2009 2010 2011 2012 2013
per 1
00,0
00 p
opul
atio
n
YearUrban Large rural town Small rural town Isolated small rural town AZ total
0
20
40
60
80
100
120
140
2006 2007 2008 2009 2010 2011 2012 2013
per 1
00,0
00 p
opul
atio
n
YearApache Cochise Coconino GilaGraham Greenlee La Paz MaricopaMohave Navajo Pima PinalSanta Cruz Yavapai Yuma Arizona

7
Table 4. Pharmacists per 100,000 Population by Counties and Four Rural-Urban Commuting Areas Summary: 2006 to 2013
County 2006 2009 2006-09 Chg. 2010 2013 2010-13 Chg.
Apache 12 15 25.0% 18 21 16.7% Cochise 39 35 -10.3% 36 43 19.4% Coconino 69 73 5.8% 80 81 1.3% Gila 60 58 -3.3% 60 57 -5.0% Graham 42 61 45.2% 65 59 -9.2% Greenlee 0 0 0.0% 0 0 0.0% La Paz 5 15 200.0% 15 20 33.3% Maricopa 90 102 13.3% 106 113 6.6% Mohave 49 58 18.4% 61 60 -1.6% Navajo 36 43 19.4% 44 48 9.1% Pima 96 107 11.5% 111 122 9.9% Pinal 38 39 2.6% 39 33 -15.4% Santa Cruz 26 34 30.8% 29 25 -13.8% Yavapai 71 74 4.2% 74 84 13.5% Yuma 31 37 19.4% 41 43 4.9% Arizona – Total 82 90 9.8% 93 99 6.5%
2000 RUCA
2006-09 Chg. 2010 RUCA
2010-13 Chg. Urban 90 98 8.9% 94 106 12.8% Large Rural Town 46 47 2.2% 73 79 8.2% Small Rural Town 29 34 17.2% 24 31 29.1% Isolated Small Rural Town 23 28 21.7% 3 2 -33.3%
Source: Arizona State Board of Pharmacy
Pharmacist Renewal License Survey: There were 3,559 Arizona pharmacists who submitted their Arizona State Board of Pharmacy (ASBP) 2012-13 Survey (two-year renewal license cycle). Most (75.6%) of the pharmacists were located in Maricopa (2,099) and in Pima (591) Counties. More than half the pharmacists were female (51.2%). Eighty-seven percent of the respondents were employed as pharmacists (3,088) and 9% were unemployed (322). See Figure 4.
Figure 4. Arizona Pharmacist Employment Status: 2012-13
Source: Arizona State Board of Pharmacy 2012-13 Pharmacist Survey
86.8
1.1 19
2.10
10
20
30
40
50
60
70
80
90
100
Pharmacist Healthcare Not in Healthcare Unemployed Retired/Disabled
Perc
ent
Employment Status

8
Pharmacist Employment Setting: The top three pharmacist primary employment settings reported were (1) retail [chain – 1,381 and independent – 156], (2) hospital [692], and (3) mail order [325] (see Figure 5). Twenty-five percent of the pharmacists reported that they have been with their current position for ten years or more. Figure 5. Arizona Pharmacist Employment Setting: 2012-13
Source: Arizona State Board of Pharmacy 2012-13 Pharmacist Survey
Pharmacist Working Weeks and Hours: Seventy-eight percent of pharmacists reported working 40 hours or more per week (see Figure 6). Less than 10% of the pharmacists worked less than 30 hours per week.
Figure 6. Arizona Pharmacist Hours Worked Per Week: 2012-13
Source: Arizona State Board of Pharmacy 2012-13 Pharmacist Survey
49.4
22.2
10.5
17.9
0
10
20
30
40
50
60
Chain and Independent
Hospital Mail Order Other
Perc
ent
Employment Setting
1.4 2.35.7
12.9
65.8
6.9 5
0
10
20
30
40
50
60
70
<10 hrs. 10 - 19 hrs. 20 - 29 hrs. 30 - 39 hrs. 40 - 49 hrs. 50 - 59 hrs. 60 hrs. or more
Perc
ent
Hour Worked Per Week

9
The AzCRH 2014 Arizona Pharmacist Workforce Survey reported that 80.5% of pharmacists worked 40 hours or more per week. One fifth of the pharmacists worked 50 hours or more. Table 5 compares the current and future expected working hours per week. Table 5. Current and Future Hours Worked Per Week
Hours Worked per Week Current # and % Future # and % Change % 10 hours or less 12 2.3% 9 1.8% -0.5% 10 - 19 hours 13 2.5% 16 3.3% 0.8% 20 - 29 hours 31 6.1% 35 7.1% 1.0% 30 - 39 hours 44 8.6% 49 9.9% 1.3% 40 - 49 hours 307 60.1% 312 63.3% 3.2% 50 - 59 hours 50 9.8% 44 8.9% -0.9% 60 hours or more 54 10.6% 28 5.7% -4.9% Total 511 100.0% 493 100.0%
Source: Arizona Center for Rural Health 2014 Pharmacist Survey; Future – Five-years from now.
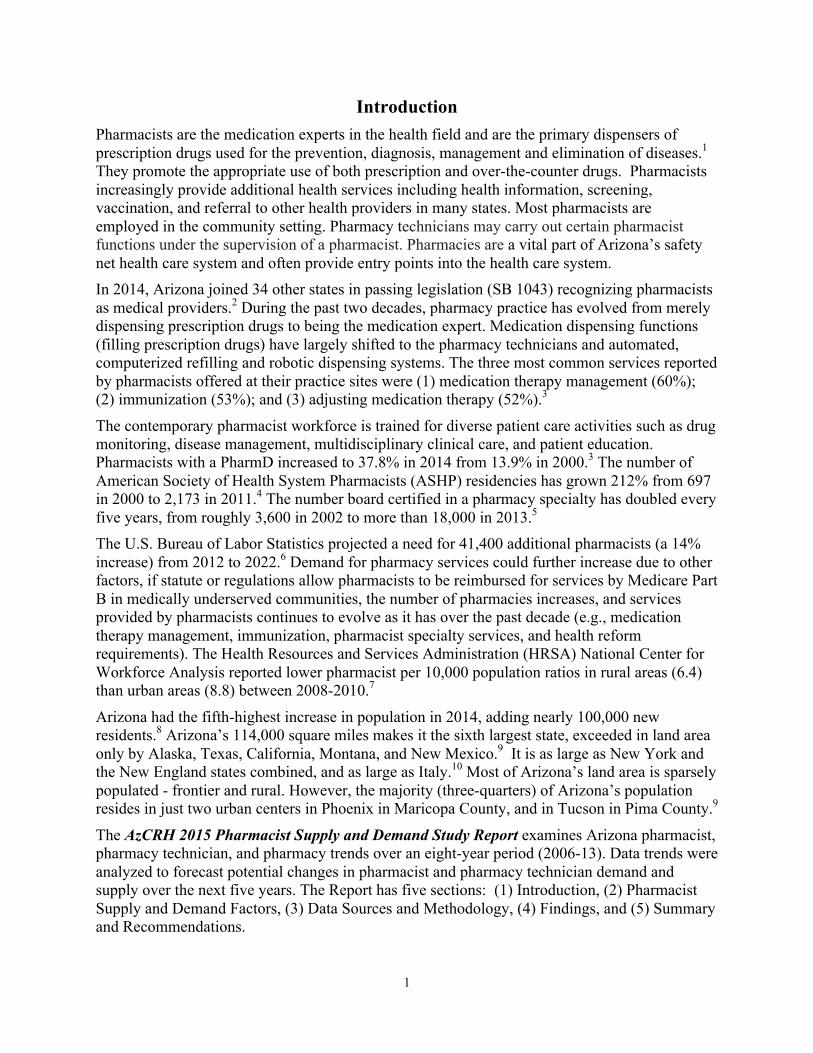
Retirement Plans: Using the ASBP 2012-13 Arizona Pharmacist Renewal License Survey and the AzCRH 2014 Arizona Pharmacist Workforce Survey and projecting forward, an estimated 9 to 18% of pharmacists will retire in the next five years (see Figures 7 and 8). In 2013, 19.1% of pharmacists were age 62 years or older (1,264 were of eligible retirement age).
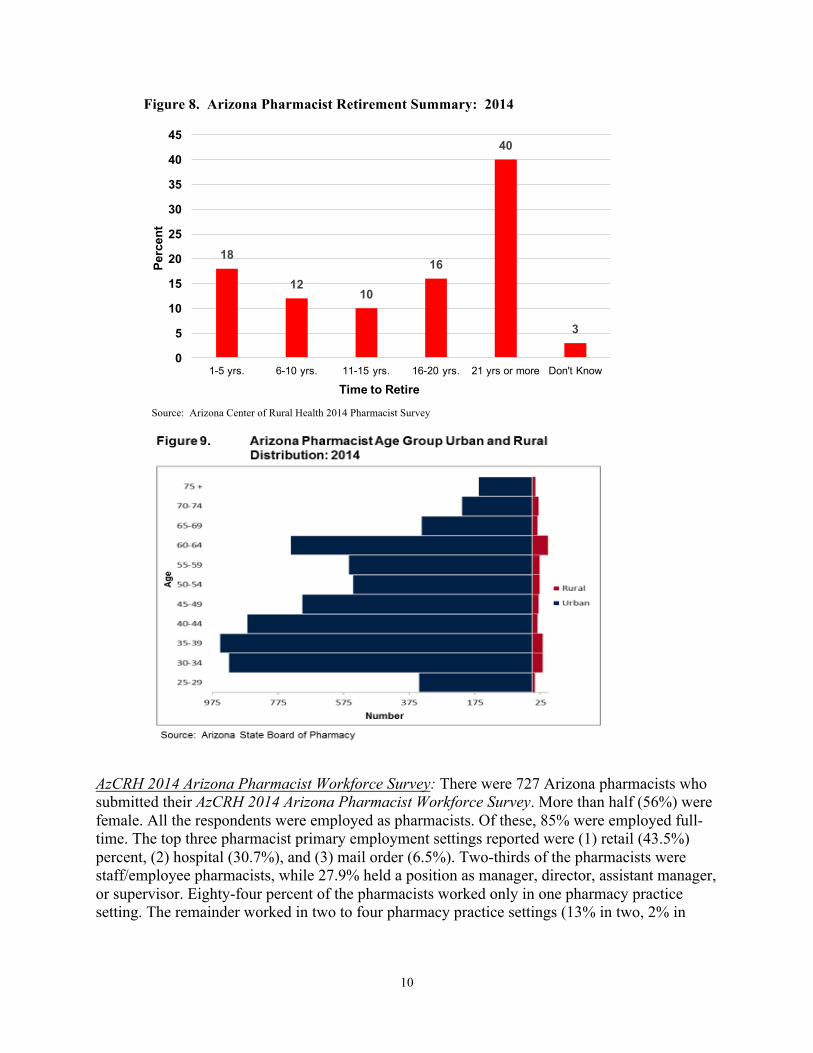
There is a higher percentage of pharmacists aged 65 years or older in rural (19%) than urban areas (11%). “Baby boomer” retirement will likely disproportionately decrease pharmacists in rural areas while the demand for them will increase. Urban and rural age distributions for 2013 are shown in Figure 9.
Figure 7. Arizona Pharmacist Retirement Summary: 2012-13
Source: Arizona State Board of Pharmacy 2012-13 Pharmacist Survey
9.47.6
12.614.6
34.6
21.1
0
5
10
15
20
25
30
35
40
2-3 yrs. 6-9 yrs. 10-15 yrs. 16-20 yrs. 21 yrs or more No specified
Perc
ent
Time to Retire
10
Figure 8. Arizona Pharmacist Retirement Summary: 2014
Source: Arizona Center of Rural Health 2014 Pharmacist Survey
AzCRH 2014 Arizona Pharmacist Workforce Survey: There were 727 Arizona pharmacists who submitted their AzCRH 2014 Arizona Pharmacist Workforce Survey. More than half (56%) were female. All the respondents were employed as pharmacists. Of these, 85% were employed full-time. The top three pharmacist primary employment settings reported were (1) retail (43.5%) percent, (2) hospital (30.7%), and (3) mail order (6.5%). Two-thirds of the pharmacists were staff/employee pharmacists, while 27.9% held a position as manager, director, assistant manager, or supervisor. Eighty-four percent of the pharmacists worked only in one pharmacy practice setting. The remainder worked in two to four pharmacy practice settings (13% in two, 2% in
18
1210
16
40
3
0
5
10
15
20
25
30
35
40
45
1-5 yrs. 6-10 yrs. 11-15 yrs. 16-20 yrs. 21 yrs or more Don't Know
Perc
ent
Time to Retire
11
three, and 1% in four). The expansion of pharmacy practice and roles are expected to increase pharmacist demand (e.g., increase clinical services and health profession interactions).
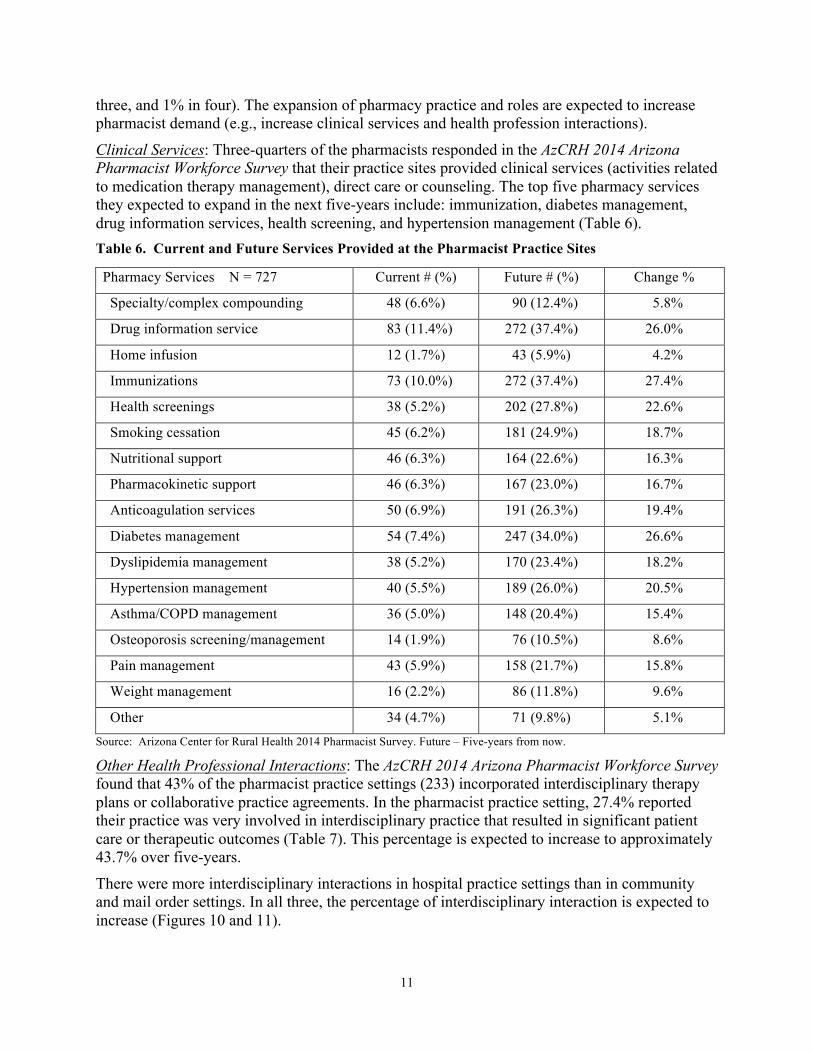
Clinical Services: Three-quarters of the pharmacists responded in the AzCRH 2014 Arizona Pharmacist Workforce Survey that their practice sites provided clinical services (activities related to medication therapy management), direct care or counseling. The top five pharmacy services they expected to expand in the next five-years include: immunization, diabetes management, drug information services, health screening, and hypertension management (Table 6). Table 6. Current and Future Services Provided at the Pharmacist Practice Sites
Pharmacy Services N = 727 Current # (%) Future # (%) Change %
Specialty/complex compounding 48 (6.6%) 90 (12.4%) 5.8%
Drug information service 83 (11.4%) 272 (37.4%) 26.0%
Home infusion 12 (1.7%) 43 (5.9%) 4.2%
Immunizations 73 (10.0%) 272 (37.4%) 27.4%
Health screenings 38 (5.2%) 202 (27.8%) 22.6%
Smoking cessation 45 (6.2%) 181 (24.9%) 18.7%
Nutritional support 46 (6.3%) 164 (22.6%) 16.3%
Pharmacokinetic support 46 (6.3%) 167 (23.0%) 16.7%
Anticoagulation services 50 (6.9%) 191 (26.3%) 19.4%
Diabetes management 54 (7.4%) 247 (34.0%) 26.6%
Dyslipidemia management 38 (5.2%) 170 (23.4%) 18.2%
Hypertension management 40 (5.5%) 189 (26.0%) 20.5%
Asthma/COPD management 36 (5.0%) 148 (20.4%) 15.4%
Osteoporosis screening/management 14 (1.9%) 76 (10.5%) 8.6%
Pain management 43 (5.9%) 158 (21.7%) 15.8%
Weight management 16 (2.2%) 86 (11.8%) 9.6%
Other 34 (4.7%) 71 (9.8%) 5.1% Source: Arizona Center for Rural Health 2014 Pharmacist Survey. Future – Five-years from now.
Other Health Professional Interactions: The AzCRH 2014 Arizona Pharmacist Workforce Survey found that 43% of the pharmacist practice settings (233) incorporated interdisciplinary therapy plans or collaborative practice agreements. In the pharmacist practice setting, 27.4% reported their practice was very involved in interdisciplinary practice that resulted in significant patient care or therapeutic outcomes (Table 7). This percentage is expected to increase to approximately 43.7% over five-years.
There were more interdisciplinary interactions in hospital practice settings than in community and mail order settings. In all three, the percentage of interdisciplinary interaction is expected to increase (Figures 10 and 11).

12
Table 7. Current and Future Levels of Interdisciplinary Interaction in Pharmacist Practice Settings
Interdisciplinary Practice Level Current # and % Future # and % Change % Very involved resulting in significant patient care/therapeutic outcomes
149 27.4% 235 43.7% 16.3%
Somewhat involved resulting in some patient care/therapeutic outcomes
166 30.6% 169 31.4% 0.8%
Slightly involved resulting in slight patient care/therapeutic outcomes
98 18.0% 65 12.1% -5.9%
Minimally involved resulting in few patient care/therapeutic outcomes
83 15.3% 49 9.1% -6.2%
Nonproductive resulting in no documentable patient care/therapeutic outcomes
47 8.7% 20 3.7% -5.0%
Total 543 100.0% 538 100.0% Source: Arizona Center for Rural Health 2014 Pharmacist Survey. Future – Five-years from now.
Figure 10. Current Interdisciplinary Interaction Levels for Community, Hospital, and Mail Order Pharmacies
Source: Arizona Center for Rural Health 2014 Pharmacist Survey
05
101520253035404550
Community Hospital Mail Order
Perc
ent
Pharmacy Practice SettingVery Involved Somewhat Involved Slightly Involved Minimally Involved Not Involved

13
Figure 11. Future Interdisciplinary Interaction Levels for Community, Hospital, and Mail Order Pharmacies
Source: Arizona Center for Rural Health 2014 Pharmacist Survey
Pharmacy Technicians: The Arizona State Board of Pharmacy began certifying pharmacy technicians in 2004. The increased number of pharmacy technicians performing pharmacist functions will likely decrease pharmacist demand. There were more certified pharmacy technicians (10,433) than licensed pharmacists (6,573) in Arizona in 2013. See Tables 3 and 8. Table 8. Pharmacy Technician Numbers by Counties and Four Rural-Urban Commuting Areas
Summary: 2006 to 2013
County 2006 2009 2006-09 Chg. 2010 2013 2010-13 Chg. Apache 25 38 52.0% 39 51 30.8% Cochise 72 101 40.3% 114 128 12.3% Coconino 77 96 24.7% 100 118 18.0% Gila 35 49 40.0% 50 51 2.0% Graham 43 49 14.0% 42 42 0.0% Greenlee 1 3 200.0% 2 6 200.0% La Paz 4 8 100.0% 11 9 -18.2% Maricopa 4,187 5,701 36.2% 6,516 7,143 9.6% Mohave 116 195 68.1% 208 229 10.1% Navajo 40 79 97.5% 83 83 0.0% Pima 860 1,205 40.1% 1,300 1,522 17.1% Pinal 382 553 44.8% 553 594 7.4% Santa Cruz 22 31 40.9% 37 48 29.7% Yavapai 143 205 43.4% 231 264 14.3% Yuma 89 126 41.6% 130 145 11.5% Arizona – Total 6,096 8,439 38.4% 9,416 10,433 10.8%
2000 RUCA
2006-09 Chg. 2010 RUCA
2010-13 Chg. Urban 5,589 7,676 37.3% 8,960 9,927 10.8% Large Rural Town 309 459 48.5% 333 368 10.5% Small Rural Town 171 269 57.3% 111 126 13.5% Isolated Small Rural Town 27 35 29.6% 12 12 0.0%
Source: Arizona State Board of Pharmacy
Most pharmacy technicians were located in urban areas (95.2%). Pharmacy technicians increased by 4,337 (71.1%) from 2006-13. Between 2010-13, the gains in pharmacy technician numbers
0
10
20
30
40
50
60
70
Community Hospital Mail Order
Perc
ent
Pharmacy Practice SettingVery Involved Somewhat Involved Slightly Involved Minimally Involved Not Involved

14
occurred in both urban and rural areas. Only La Paz County lost pharmacy technicians during that period. See Appendix E for pharmacy technicians by Arizona towns/cities for 2013.
Pharmacy technicians increased from 101 to 159 per 100,000 (57.4%) between 2006-13. La Paz and Navajo Counties were the only two counties with a decreasing ratio. All state RUCA areas either increased or remained steady (isolated small rural towns) between 2010-13 in their pharmacy technician provider to 100,000 population ratio. There were inequalities in distribution of pharmacy technician-population ratios by ruralness and counties (Figures 12 and 13; Table 9).
Figure 12. Pharmacy Technicians per 100,000 Population in Arizona and by Four Rural-Urban Commuting Areas Trends: 2006-09 and 2010-13
Source: Arizona State Board of Pharmacy
Figure 13. Pharmacy Technicians per 100,000 Population in Arizona by County Trends: 2006-09 and 2010-13
Source: Arizona State Board of Pharmacy
0
50
100
150
200
2006 2007 2008 2009 2010 2011 2012 2013
per 1
00,0
00 p
opul
atio
n
YearUrban Large rural town Small rural town Isolated small rural town Arizona
0
50
100
150
200
2006 2007 2008 2009 2010 2011 2012 2013
per 1
00,0
00 p
opul
atio
n
YearApache Cochise Coconino GilaGraham Greenlee LaPaz MaricopaMohave Navajo Pima PinalSantaCruz Yavapai Yuma Arizona

15
Table 9. Pharmacy Technicians per 100,000 Population by Counties and Four Rural-Urban Commuting Areas Summary: 2006 to 2013
County 2006 2009 2006-09 Chg. 2010 2013 2010-13 Chg. Apache 33 54 63.6% 54 71 31.5% Cochise 65 78 20.0% 87 94 8.0% Coconino 59 72 22.0% 74 89 20.3% Gila 70 92 31.4% 93 97 4.3% Graham 96 131 36.5% 113 114 0.9% Greenlee 13 35 169.2% 24 71 195.8% La Paz 20 39 95.0% 54 44 -18.5% Maricopa 112 150 33.9% 170 181 6.5% Mohave 60 98 63.3% 104 111 6.7% Navajo 38 73 92.1% 77 75 -2.6% Pima 91 124 36.3% 132 153 15.9% Pinal 129 158 22.5% 144 153 6.3% Santa Cruz 45 66 46.7% 78 100 28.2% Yavapai 71 97 36.6% 109 120 10.1% Yuma 48 65 35.4% 66 72 9.1% Arizona – Total 101 133 31.7% 147 159 8.2%
2000 RUCA
2006-09 Chg. 2010 RUCA
2010-13 Chg. Urban 109 142 30.2% 147 167 13.6% Large Rural Town 73 101 38.4% 130 147 13.1% Small Rural Town 45 70 55.6% 68 82 20.6% Isolated Small Rural Town 26 33 27.0% 5 5 0.0%
Source: Arizona State Board of Pharmacy Technician Renewal Certification Survey: There were 5,175 Arizona pharmacy technicians who submitted their Arizona State Board of Pharmacy 2012-13 Survey. Seventy-seven percent of the respondents were employed as pharmacy technicians [3,965] and 13% were unemployed [672] (see Figure 14).
Figure 14. Arizona Pharmacy Technician Employment Status: 2012-13
Source: Arizona State Board of Pharmacy 2012-13 Pharmacy Technician Survey
76.6
6 313
1.40
102030405060708090
Pharmacy Technician
Healthcare Not in Healthcare Unemployed Retired/Disabled
Perc
ent
Employment Status

16
Most pharmacy technicians (83.8 %) were located in Maricopa County (3,556) and Pima County (780). Seventy-one percent the pharmacy technicians were female. The top three pharmacy technician primary employment settings reported were (1) retail [chain = 1,872 and independent = 239], (2) mail order [745], and (3) hospital [684] (see Figure 15). Figure 15. Arizona Pharmacy Technician Employment Setting: 2012-13
Source: Arizona State Board of Pharmacy 2012-13 Pharmacy Technician Survey Pharmacy Technician Working Weeks and Hours: Sixty-eight percent of pharmacy technicians reported working 40 or more hours per week (see Figure 16). Ten percent of pharmacy technicians worked less than 30 hours per week. Figure 16. Arizona Pharmacy Technician Hours Worked Per Week: 2012-13
Source: Arizona State Board of Pharmacy 2012-13 Pharmacy Technician Survey
Pharmacy Technician Roles: Using AzCRH 2014 Arizona Pharmacist Workforce Survey data, pharmacy technician roles will likely expand. The top two expansion areas are: medication reconciliation and management and administrative duties (Table 10). There are more consumer service interactions by pharmacy technicians in the mail order and community settings than in the hospital practice setting (Figure 17). Pharmacy technicians will likely play greater roles in
47.8
15.5 16.919.8
0
10
20
30
40
50
60
Chain and Independent
Hospital Mail Order Other
Perc
ent
Employment Setting
0.8 2.16.6
22.9
59.1
3.5 5
0
10
20
30
40
50
60
70
<10 hrs. 10 - 19 hrs. 20 - 29 hrs. 30 - 39 hrs. 40 - 49 hrs. 50 - 59 hrs. 60 hrs. or more
Perc
ent
Hour Worked Per Week

17
medication reconciliation in hospital settings and in management and administration duties in mail order settings (Figure 18). Table 10. Selected Current and Future Pharmacy Technician Roles
Pharmacy Technician Role N = 727 Current # (%) Future # (%) Change % Customer service provider 381 (52.4%) 380 (52.3%) -0.1% Inventory management 416 (57.2%) 413 (56.8%) -0.4% Buying and acquisition 313 (43.1%) 314 (43.2%) -0.1% Medication preparation in the distribution process 423 (58.2%) 409 (56.3%) -1.9% Medication reconciliation 136 (18.7%) 224 (30.8%) 12.1% Management/administrative duties 211 (29.0%) 266 (36.6%) 7.6%
Source: Arizona Center for Rural Health 2014 Pharmacist Survey. Future – Five-years from now.
Figure 17. Current Pharmacy Technician Roles for Community, Hospital, and Mail Order Pharmacies
Source: Arizona Center for Rural Health 2014 Pharmacist Survey
Figure 18. Future Pharmacy Technician Roles for Community, Hospital, and Mail Order Pharmacies
Source: Arizona Center for Rural Health 2014 Pharmacist Survey
0
5
10
15
20
25
30
Community Hospital Mail Order
Perc
ent
Pharmacy Practice SettingConsumer Service Inventory Mgmt PurchasingMed Preparation Med Reconciilation Mgmt/Admin Duties
0
5
10
15
20
25
30
Community Hospital Mail Order
Perc
ent
Pharmacy Practice SettingConsumer Service Inventory Mgmt PurchasingMed Preparation Med Reconciliation Mgmt/Admin Duties

18
Pharmacies: In 2013, there were 1,319 Arizona pharmacies (Table 11), an increase of 69 pharmacies (5.5%) from 2006. In 2013, 92.6% of Arizona’s pharmacies were located in urban areas. Between 2006-13, there was no change in the number of pharmacies in Apache, Graham, Greenlee, La Paz, and Santa Cruz Counties. There was no change in the number of pharmacies in small rural towns. Due to RUCA classification changes between 2000-10, there were no pharmacists located in isolated small rural towns between 2010-13. Appendix F displays the number of pharmacies in Arizona towns and cities for 2013. Figure 19. Pharmacy Locations in Arizona in 2013.
Source: Arizona State Board of Pharmacy

19
Table 11. Pharmacy Numbers by Counties and Four Rural-Urban Commuting Areas Summary: 2006-13
County 2006 2009 2006-09 Chg. 2010 2013 2010-13 Chg. Apache 4 4 0% 4 4 0% Cochise 23 26 13.0% 24 27 12.5% Coconino 24 23 -4.2% 25 25 0% Gila 11 11 0% 11 14 27.3% Graham 6 6 0% 6 6 0% Greenlee 1 1 0% 1 1 0% La Paz 5 5 0% 5 5 0% Maricopa 824 817 -0.9% 811 852 5.1% Mohave 38 43 13.2% 40 41 2.5% Navajo 13 15 15.4% 15 16 6.7% Pima 194 193 -0.5% 193 202 4.7% Pinal 33 39 - 18.2% 43 45 4.7% Santa Cruz 8 8 0% 8 8 0% Yavapai 41 45 9.8% 44 46 4.5% Yuma 25 30 20.0% 29 27 - 6.9% Arizona – Total 1,250 1,266 1.3% 1,259 1,319 4.7%
2000 RUCA
2006-09 Chg. 2010 RUCA
2010-13 Chg. Urban 1,108 1,106 -0.2% 1,167 1,221 4.6% Large Rural Town 80 89 11.3% 69 75 8.7% Small Rural Town 56 63 12.5% 23 23 0.0% Isolated Small Rural Town 7 8 33.3% 0 0 0.0%
Source: Arizona State Board of Pharmacy
Table 12 shows pharmacy permit trends. There are six types of pharmacy permits (chain, independent, hospital, limited service, government, and full service). In 2013, the top three types of pharmacy permits were: (1) chain, (2) independent, and (3) hospital. The greatest percentages increase in permit types during 2006-13 were for hospital and independents; the greatest percentage decrease was for government pharmacy permits. Table 12. Types of Arizona Pharmacies: 2006 to 2013
Type of Pharmacy 2006 2007 2008 2009 2010 2011 2012 2013
2006-13 Chg.
Chain 934 900 939 931 921 922 934 957 2.5%
Independent 139 143 141 150 151 148 157 160 15.1%
Hospital 102 106 107 111 115 117 117 127 24.5%
Limited Service 63 67 65 63 61 66 65 68 7.9%
Government 11 11 11 10 10 11 9 6 -45.5%
Full Service 1 1 1 1 1 1 1 1 0%
Other 0 1 0 0 0 0 0 0 0%
Total 1,250 1,229 1,264 1,266 1,259 1,265 1,283 1,319
Source: Arizona State Board of Pharmacy
While the number of pharmacies increased, there was no change in Arizona’s ratio of pharmacies per 100,000 population (20) between 2010-13, due to Arizona’s population growth. Seven
20
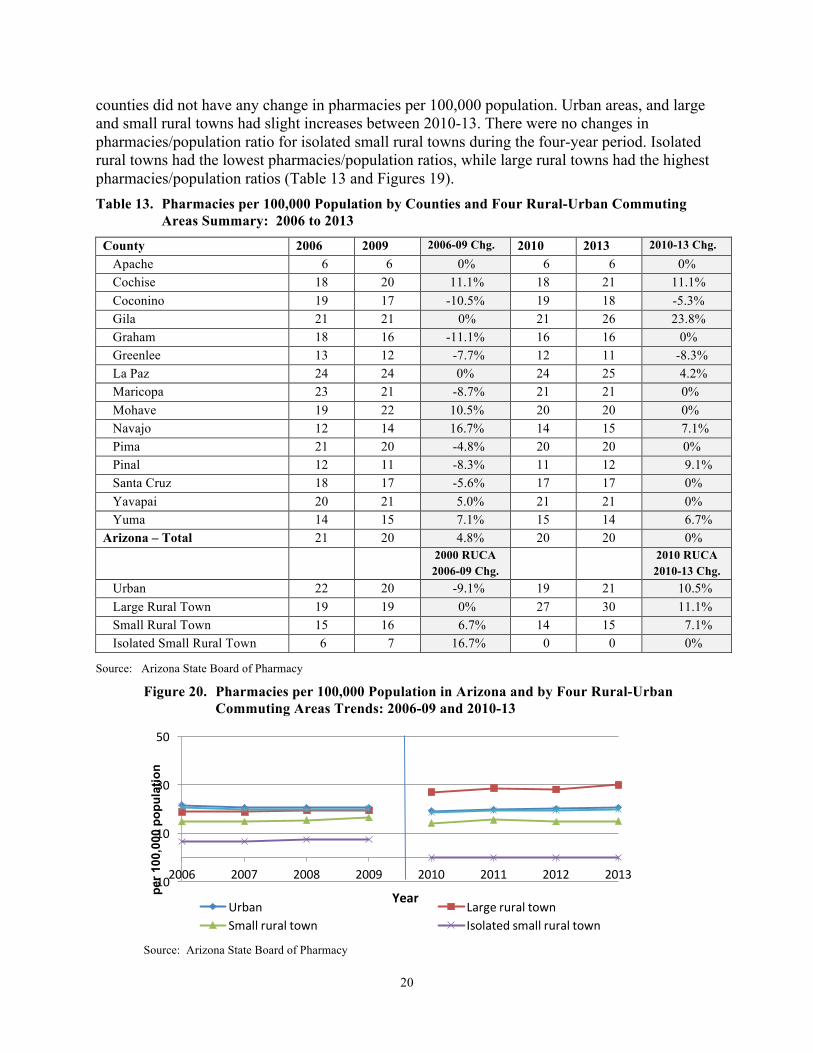
counties did not have any change in pharmacies per 100,000 population. Urban areas, and large and small rural towns had slight increases between 2010-13. There were no changes in pharmacies/population ratio for isolated small rural towns during the four-year period. Isolated rural towns had the lowest pharmacies/population ratios, while large rural towns had the highest pharmacies/population ratios (Table 13 and Figures 19). Table 13. Pharmacies per 100,000 Population by Counties and Four Rural-Urban Commuting
Areas Summary: 2006 to 2013
County 2006 2009 2006-09 Chg. 2010 2013 2010-13 Chg. Apache 6 6 0% 6 6 0% Cochise 18 20 11.1% 18 21 11.1% Coconino 19 17 -10.5% 19 18 -5.3% Gila 21 21 0% 21 26 23.8% Graham 18 16 -11.1% 16 16 0% Greenlee 13 12 -7.7% 12 11 -8.3% La Paz 24 24 0% 24 25 4.2% Maricopa 23 21 -8.7% 21 21 0% Mohave 19 22 10.5% 20 20 0% Navajo 12 14 16.7% 14 15 7.1% Pima 21 20 -4.8% 20 20 0% Pinal 12 11 -8.3% 11 12 9.1% Santa Cruz 18 17 -5.6% 17 17 0% Yavapai 20 21 5.0% 21 21 0% Yuma 14 15 7.1% 15 14 6.7% Arizona – Total 21 20 4.8% 20 20 0%
2000 RUCA
2006-09 Chg. 2010 RUCA
2010-13 Chg. Urban 22 20 -9.1% 19 21 10.5% Large Rural Town 19 19 0% 27 30 11.1% Small Rural Town 15 16 6.7% 14 15 7.1% Isolated Small Rural Town 6 7 16.7% 0 0 0%
Source: Arizona State Board of Pharmacy
Figure 20. Pharmacies per 100,000 Population in Arizona and by Four Rural-Urban Commuting Areas Trends: 2006-09 and 2010-13
Source: Arizona State Board of Pharmacy
-10
10
30
50
2006 2007 2008 2009 2010 2011 2012 2013
per 1
00,0
00 p
opul
atio
n
YearUrban LargeruraltownSmallruraltown Isolatedsmallruraltown

21
Summary and Recommendations In the U.S. health care system, pharmacists are the medication experts and the primary dispensers of prescription drugs. They promote the appropriate use of both prescription and non-prescription drugs. Pharmacists increasingly provide other health services such as health information, health screening, vaccination, and referral to other health providers. Pharmacies provide entry points into the health care system and are a vital part of Arizona’s safety net health care system, especially in rural areas where health resources are limited. The Pharmacy Workforce Center’s Aggregate Demand Index showed that Arizona’s demand for pharmacists was in balance with the supply of pharmacists (state of equilibrium) between 2011-13. After 2013, the demand for pharmacists was slightly higher than supply. Arizona is doing better in meeting the demand for pharmacists than the nation and the Western Region. The spatial distribution inequalities between rural and urban areas for pharmacists persist.
Between 2006-13, Arizona increased in the number of pharmacists (by 32.4%), pharmacy technicians (71.1%), and pharmacies (5.5%). Gila, Graham, Pinal and Santa Cruz Counties lost pharmacists between 2010-13. There was no change in Arizona’s pharmacies per 100,000 population in that period.
Three-quarters of the pharmacist respondents reported that their practice sites provide clinical services, direct care or counseling to their patients at their site. Twenty-eight percent of the pharmacists report that they are very involved with interdisciplinary practice in patient care, most in hospital settings. These activities are expected to increase over the next five-years. Pharmacy technician medication dispensing functions will likely level off over the next five-years. However, their roles in medication reconciliation in hospital settings, and management and administrative duties in mail order settings are expected to expand.
Arizona pharmacist supply and demand are influenced by many factors including that:
• Both Arizona Colleges of Pharmacy increased class sizes and capacity to graduate pharmacists, thereby increasing the supply of pharmacists.
• An estimated 9 to 18% of pharmacists will retire in the next five years, thus decreasing the supply of pharmacists.
• There is higher percentage of pharmacists age 65 years or older in rural (19%) than urban areas (11%). “Baby boomer” pharmacist retirement will disproportionately affect rural areas, decreasing the pharmacist supply.
• The number and use of pharmacy technicians will increase, reducing pharmacist demand. • Pharmacist delivery of clinical services and interdisciplinary interactions will likely
increase in the next five-years, increasing the demand for pharmacists. • The top five pharmacy services that are expected to expand in the next five-years are:
immunization, diabetes management, drug information services, health screening, and hypertension management – increasing pharmacist demand.
To address pharmacist supply, demand and distribution challenges in Arizona’s rural areas, the following steps are recommended:
• Establish an Arizona Rural Pharmacy Task Force to review data, reports and best practices from other rural states to assure access to a well-trained and distributed pharmacist workforce for all Arizonans, with an emphasis on rural areas;

22
• Publicize the recently created Arizona pharmacist loan repayment program; • Expand the National Health Service Corps loan repayment program to include
pharmacists; • Increase tele-pharmacy services for rural Arizonans; • Expand Medicare Part B covered services to include pharmacist services delivered in
Health Profession Shortage Areas, Medically Underserved Areas and Medically Underserved Populations (HRSA/MUA/P);
• Work with pharmacy employers to increase the number of pharmacists in rural areas. • Use tools such as Arizona 3RNet to recruit rural pharmacists to Arizona’s rural areas.

23
References
1. Arizona State Board of Pharmacy. 2013. Arizona Revised Statue: Pharmacy Act: Title 32 – Chapter 18. Available at: https://pharmacy.az.gov/sites/default/files/editors_choice/attachments/ LAW%20BOOK%202014.pdf.
2. Burkley, B. 2014. We are providers: Arizona passes provider status legislation. Available at: https://www.pharmacist.com/we-are-providers-arizona-passes-provider-status-legislation.
3. Midwest Pharmacy Workforce Research Consortium. 2015. 2014 National Pharmacist Workforce Survey. Available at: http://www.aacp.org/resources/research/pharmacyworkforcecenter/Documents/FinalReportOfTheNationalPharmacistWorkforceStudy2014.pdf.
4. American Association of Colleges of Pharmacy. 2011. Bridges to Our Bright Future: The Intersection of Pharmacy Residencies and Schools/Colleges of Pharmacy presentation at the 2011 AACP Annual Meeting and Seminars, San Antonio, Texas.
5. ASHP. 2014. Growing Trend Toward Specialization Board Certification. Available at: http://www.ashpintersections.org/2014/01/growing-trend-toward-specialization-board-certification-2/.
6. Bureau of Labor Statistics, U.S. Department of Labor. 2014. Occupational Outlook Handbook, 2014-15 Edition, Pharmacists. Available at: http://www.bls.gov/ooh/healthcare/pharmacists.htm#tab-6.
7. Health Resources and Services Administration. 2014. Distribution of U.S. Health Care Providers Residing in Rural and Urban Areas. Available at: http://bhpr.hrsa.gov/healthworkforce/supplydemand/nchwafactsheet.pdf.
8. Fischer, H. 2014. Census: Arizona’s growth rank 5th. Arizona Daily Star, December 14, 2014. 9. Eng HJ, Tabor J, Hughes A. 2011. Arizona Rural Health Workforce Trend Analysis. Tucson:
Arizona Area Health Education Centers and Arizona Rural Health Office, the University of Arizona.
10. Tabor, JA, Eng HJ. 2012. Arizona Rural Health Workforce Trend Analysis 2007-2010. Tucson: Arizona Area Health Education Centers and Center for Rural Health, the University of Arizona.
11. Health Resources and Services Administration. 2000. A Study of the Supply and Demand for Pharmacists. Available at: http://bhpr.hrsa.gov/healthworkforce/reports/pharmaciststudy.pdf.
12. Health Resources and Services Administration. 2008. The Adequacy of Pharmacist Supply: 2004 to 2030. Available at: http://bhpr.hrsa.gov/healthworkforce/reports/pharmsupply20042030.pdf.
13. University of California. 2014. An Era of Growth and Change: A Closer Look at Pharmacy Education and Practice. Available at: http://www.ucop.edu/uc-health/_files/pharmacy-an-era-of-growth-and-change.pdf.

24
Appendix A: Arizona State Board of Pharmacy (ASBP) – 2012-13 Pharmacist Renewal
License Survey and 2012-13 Pharmacy Technician Renewal Certification Survey
ASBP 2012-13 Pharmacist Renewal License Survey
25
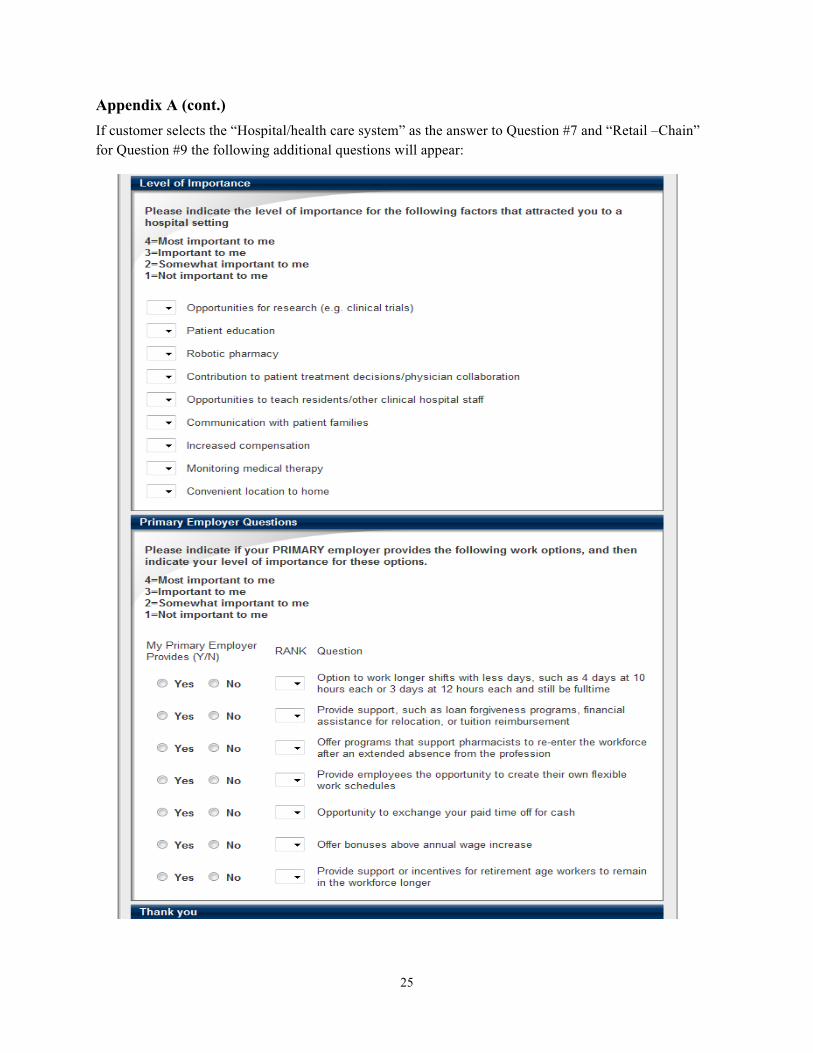
Appendix A (cont.) If customer selects the “Hospital/health care system” as the answer to Question #7 and “Retail –Chain” for Question #9 the following additional questions will appear:
26
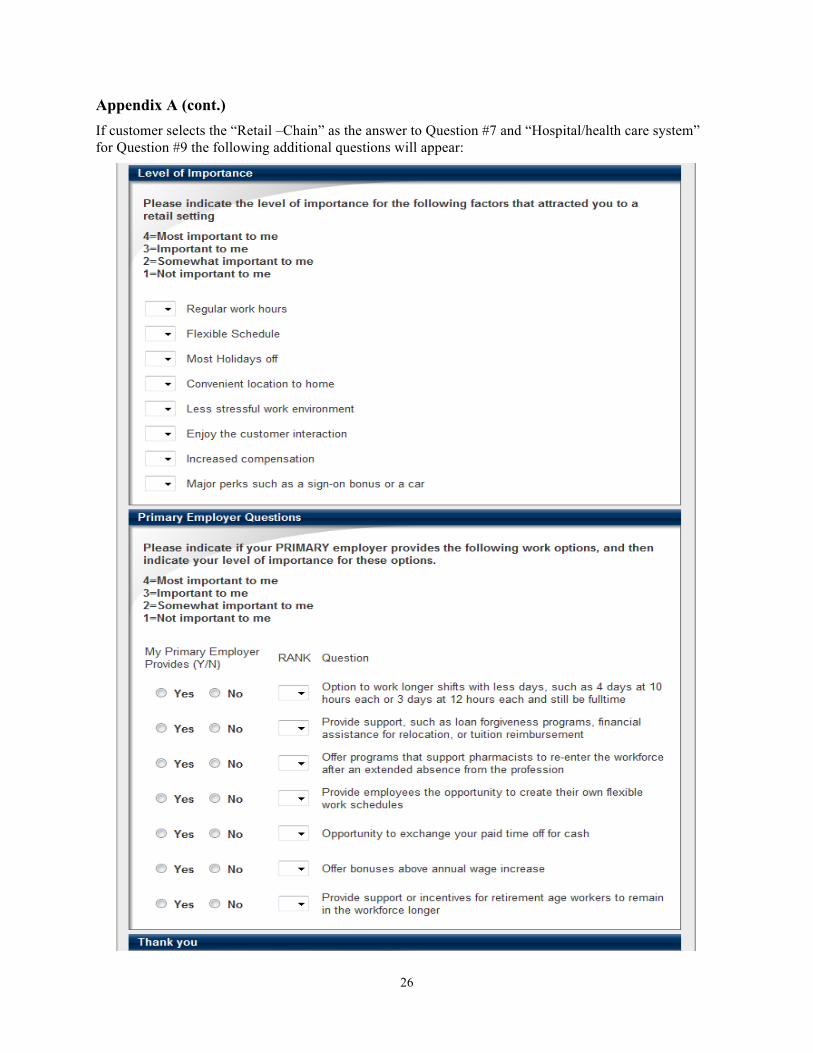
Appendix A (cont.) If customer selects the “Retail –Chain” as the answer to Question #7 and “Hospital/health care system” for Question #9 the following additional questions will appear:

27
Appendix A (cont.)
Pharmacy Technician Survey

28
Appendix A (cont.) If customer selects the “Hospital/health care system” as the answer to Question #7 and “Retail –Chain” for Question #9 the following additional questions will appear:

29
Appendix A (cont.) If a customer selects the “Retail –Chain” as the answer to Question #7 and “Hospital/health care system” for Question #9 the following additional questions will appear:

30
Appendix B: Arizona Center for Rural Health (AzCRH) 2014 Pharmacist Survey
The 2014 National Pharmacists Workforce Survey findings provided a national summary of the current pharmacist roles, but there was very little empirical data on the pharmacist current and future roles in Arizona. To fill this information gap, the AzCRH 2014 Arizona Pharmacist Workforce Survey was developed and administered with assistance by the Arizona State Board of Pharmacy, Arizona Pharmacy Association, Midwestern University College of Pharmacy, and UAHS College of Pharmacy. The survey was reviewed and approved by UA Human Subjects Protection Program. The survey was pilot-tested with 10 pharmacists before distributing to Arizona pharmacists. On October 22, 2014, an email was sent to 10,410 Arizona licensed pharmacists inviting them to participate in the survey. There were two follow-up email reminders for those who did not submit a survey. The Arizona Pharmacy Association emailed two newsletter messages encouraging pharmacists to participate. One thousand one hundred and eighty-six pharmacists submitted a survey (11.4% response rate). Of the 1,186 respondents, 727 were pharmacists practicing in Arizona. The primary difference between the 2012-13 Arizona Pharmacist Renewal License Survey (87%) and the AzCRH 2014 Arizona Pharmacist Workforce Survey (100%) was the percentage of respondents who were employed as a pharmacist. Although there were pharmacist characteristic percentage differences for gender, employment settings, and 40-49 hours worked per week between the two surveys, the overall patterns for three comparison characteristics were similar for the pharmacists practicing in Arizona – more female respondents, same top three employment settings, and 40-49 hours worked per weeks (see Table 1 for details). Table 1. ASBP 2012-13 Pharmacist Renewal License Survey and AzCRH 2014 Pharmacist
Workforce Survey Demographic Characteristic Comparisons for Gender, Top Three Employment Settings, and 40-49 Hours Worked per Week.
Characteristics ASBP Survey
(N = 3,559 – AZ RPh’s) AzCRH Survey
(N = 727 – AZ RPh’s) Gender Female %
51.2%
56.0%
Employment Setting (Top 3) Community (Retail) % Hospital % Mail Order %
49.4% 22.2% 10.5%
43.5% 30.7% 6.5%
Hours Worked per Week Worked 40-49 Hours per Week %
65.8%
60.3%
Source: ASBP 2012-13 Pharmacist Renewal License Survey and AzCRH 2014 Arizona Pharmacist Workforce Survey

31
Appendix B (cont.)

32
Appendix B (cont.)

33
Appendix B (cont.)

34
Appendix B (cont.)

35
Appendix B (cont.)

36
Appendix B (cont.)

37
Appendix B (cont.)

38
Appendix B (cont.)

39
Appendix B (cont.)

40
Appendix B (cont.)

41
Appendix B (cont.)

42
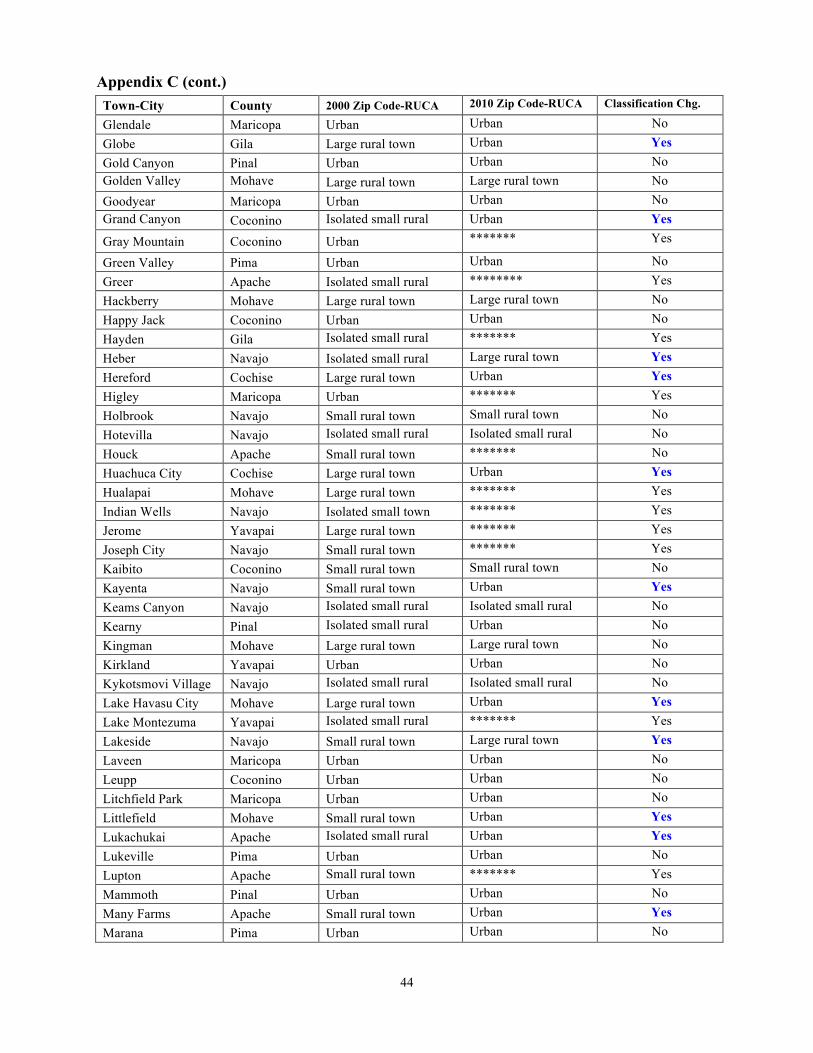
Appendix C:
List of Arizona Towns and Cities and their Ruralness Classifications 2000 and 2010
Town-City County 2000 Zip Code-RUCA 2010 Zip Code-RUCA Classification Chg.
Aguila Maricopa ******* Urban Yes Ajo Pima Small rural town Urban Yes Alpine Apache Small rural town Small rural town No Amado Santa Cruz Urban Urban No Apache Junction Pinal Urban Urban No Arivaca Pima Urban Urban No Arizona City Pinal Large rural town Urban Yes Arlington Maricopa Urban Urban No Ash Fork Yavapai Isolated small rural
town Isolated small rural No
Avondale Maricopa Urban Urban No Avra Valley Pima Urban ******* Yes Bagdad Yavapai Isolated small rural
town Urban Yes
Bapchule Pinal Small rural town ******* Yes Bellemont Coconino Urban ******* Yes Benson Cochise Small rural town Urban Yes Bisbee Cochise Small rural town Urban Yes Black Canyon City Yavapai Urban Urban No Blue Greenlee Small rural town Small rural town No Blue Gap Navajo Isolated small rural ******** Yes Bouse La Paz Small rural town Small rural town No Bowie Cochise Isolated small rural ******* Yes Buckeye Maricopa Urban Urban No Bullhead City Mohave Small rural town Large rural town Yes Bylas Graham Small rural town Large rural town Yes Cameron Coconino Small rural town ******* Yes Camp Verde Yavapai Isolated small rural
town Urban Yes
Carefree Maricopa Urban Urban No Casa Grande Pinal Large rural town Urban Yes Cashion Maricopa Urban ******* Yes Cave Creek Maricopa Urban Urban No Central Graham Small rural town ******* Yes Chamber Apache Urban Urban No Chandler Maricopa Urban Urban No Chandler Heights Maricopa Urban ******* Yes Chinle Apache Small rural town Urban Yes Chino Valley Yavapai Urban Urban No Chloride Mohave Large rural town
******* Yes
Cibecue Navajo Small rural town *******
Yes

43
Town-City County 2000 Zip Code-RUCA 2010 Zip Code-RUCA Classification Chg.
Cibola La Paz Large rural town Large rural town No Clarkdale Yavapai Large rural town Urban Yes
Clay Springs
Navajo Small rural town ******* Yes Claypool Gila Large rural town *******
Yes
Clifton Greenlee Small rural town Small rural town No Cochise Cochise Small rural town Isolated small rural Yes Colorado City Mohave Small rural town Urban Yes Concho Apache Urban Urban No Congress Yavapai Urban Urban No Coolidge Pinal Small rural town Urban Yes Cornville Yavapai Small rural town Large rural town Yes Cortaro Pima Urban ******* Yes Cottonwood Yavapai Large rural town Large rural town No Crown King Yavapai Urban Urban No Dataland Yuma Isolated small rural Urban Yes Dennehotso Apache Small rural town Urban Yes Dewey Yavapai Urban Urban No Dolan Springs Mohave Large rural town Isolated small rural Yes Douglas Cochise Large rural town Large rural town No Dragoon Cochise Isolated small rural Isolated small rural No Duncan Greenlee Isolated small rural
townIsolated small rural No
Eagar Apache Small rural town Small rural town No Eden Graham Large rural town Large rural town No Ehrenberg La Paz Large rural town Large rural town No El Mirage Maricopa Urban Urban No Elfrida Cochise Isolated small rural Isolated small rural No Elgin Santa Cruz Isolated small rural
townUrban Yes
Eloy Pinal Small rural town Urban Yes Flagstaff Coconino Urban Urban No Florence Pinal Large rural town Urban Yes Forest Lake Coconino Small rural town ******* Yes Fort Apache Navajo Small rural town ******* Yes Fort Defiance Apache Small rural town ******* Yes Fort Huachuca Cochise Large rural town Urban Yes Fort McDowell Maricopa Urban Urban No Fort Mohave Mohave Small rural town Large rural town Yes Fort Thomas Graham Large rural town ******* Yes Fountain Hills Maricopa Urban Urban No Fredonia Coconino Isolated small rural
townUrban Yes
Gadsden Yuma Urban ******* Yes Ganado Apache Small rural town Large rural town Yes Gila Bend Maricopa Urban Urban No Gilbert Maricopa Urban Urban No
Appendix C (cont.)
44
Town-City County 2000 Zip Code-RUCA 2010 Zip Code-RUCA Classification Chg.
Glendale Maricopa Urban Urban No Globe Gila Large rural town Urban Yes Gold Canyon Pinal Urban Urban
No
Golden Valley Mohave Large rural town Large rural town No Goodyear Maricopa Urban Urban No Grand Canyon
Village
Coconino Isolated small rural town
Urban Yes
Gray Mountain Coconino Urban ******* Yes
Green Valley Pima Urban Urban No Greer Apache Isolated small rural ******** Yes Hackberry Mohave Large rural town Large rural town No Happy Jack Coconino Urban Urban No Hayden Gila Isolated small rural
town ******* Yes
Heber Navajo Isolated small rural Large rural town Yes Hereford Cochise Large rural town Urban Yes Higley Maricopa Urban ******* Yes Holbrook Navajo Small rural town Small rural town No Hotevilla Navajo Isolated small rural
town Isolated small rural No
Houck Apache Small rural town ******* No Huachuca City Cochise Large rural town Urban Yes Hualapai Mohave Large rural town ******* Yes Indian Wells Navajo Isolated small town ******* Yes Jerome Yavapai Large rural town ******* Yes Joseph City Navajo Small rural town ******* Yes Kaibito Coconino Small rural town Small rural town No Kayenta Navajo Small rural town Urban Yes Keams Canyon Navajo Isolated small rural
town Isolated small rural No
Kearny Pinal Isolated small rural town
Urban No Kingman Mohave Large rural town Large rural town No Kirkland Yavapai Urban Urban No Kykotsmovi Village Navajo Isolated small rural
town Isolated small rural No
Lake Havasu City Mohave Large rural town Urban Yes Lake Montezuma Yavapai Isolated small rural
town ******* Yes
Lakeside Navajo Small rural town Large rural town Yes Laveen Maricopa Urban Urban No Leupp Coconino Urban Urban No Litchfield Park Maricopa Urban Urban No Littlefield Mohave Small rural town Urban Yes Lukachukai Apache Isolated small rural
town Urban Yes
Lukeville Pima Urban Urban No Lupton Apache Small rural town
******* Yes
Mammoth Pinal Urban Urban No Many Farms Apache Small rural town Urban Yes Marana Pima Urban Urban No
Appendix C (cont.)

45
Town-City County 2000 Zip Code-RUCA 2010 Zip Code-RUCA Classification Chg.
Marble Canyon Coconino Isolated small rural Urban Yes Maricopa Pinal Urban Urban No Mayer
Yavapai
Urban
Urban
No McNary Apache Small rural town *******
Yes
McNeal Cochise Isolated small rural Isolated small rural No Meadview Mohave Large rural town Isolated small rural Yes Mesa Maricopa Urban Urban No Miami Gila Large rural town Urban Yes Mohave Valley Mohave Small rural town Small rural town No Morenci Greenlee Small rural town Small rural town No Mormon Lake Coconino Urban Urban No Morrristown Maricopa Urban Urban No Mount Lemon Pima Urban Urban No Naco Cochise Small rural town ******* Yes Nazlini Apache Small rural town ******* Yes New River Maricopa Urban Urban No Nogales Santa Cruz Large rural town Large rural town No Nutrioso Apache Small rural town ******* Yes Oatman Mohave Small rural town ******* Yes Oracle Pinal Urban Urban No Overgaard Navajo Small isolated town ******* Yes Page Coconino Small rural town Urban Yes Pale Verde Maricopa Urban Urban No Paradise Valley Maricopa Urban Urban No Parker La Paz Small rural town Small rural town No Parks Coconino Isolated small rural
town ******* Yes
Patagonia Santa Cruz Isolated small rural town
Urban Yes Paulden Yavapai Urban Urban No Payson Gila Large rural town Large rural town No Peach Springs Mohave Large rural town Isolated small rural Yes Pearce Cochise Small rural town Isolated small rural Yes Peoria Maricopa Urban Urban No Peridot Gila Small rural town Small rural town No Phoenix Maricopa Urban Urban No Picacho Pinal Small rural town ******* Yes Pima Graham Large rural town Large rural town
No
Pine Gila Large rural town Urban Yes Pinedale Navajo Small rural town ******* Yes Pinetop Navajo Small rural town Large rural town Yes Pinon Navajo Isolated small rural
townUrban Yes
Pirtleville Cochise Large rural town ******* Yes Polacca Navajo Isolated small rural
Isolated small rural No
Pomerene Cochise Small rural town ******* Yes
Appendix C (cont.)

46
Town-City County 2000 Zip Code-RUCA 2010 Zip Code-RUCA Classification Chg.
Poston La Paz Small rural town *******
Yes Prescott Yavapai Urban Urban No
Prescott Valley Yavapai Urban Urban No Quartzsite La Paz Small rural town *******
*
No Queen Creek Maricopa Urban Urban No Red Rock Pinal Urban Urban No Red Valley Apache Isolated rural town ******* Yes Rillito Pima Urban ******* Yes Rim Rock Yavapai Isolated rural town Urban Yes Rio Rico Santa Cruz Large rural town Large rural town No Rio Verde Maricopa Urban Urban No Rock Point Apache Isolated small rural
town******* Yes
Roll Yuma Isolated small rural Isolated small rural No Roosevelt Gila Isolated small rural Isolated small rural No Round Rock Apache Small rural town ******* Yes Sacaton Pinal Isolated small rural
town******* Yes
Safford Graham Large rural town Large rural town No Sahuarita Pima Urban Urban No Saint David Cochise Small rural town Urban Yes Saint John Apache Small rural town Small rural town No Saint Michaels Apache Small rural town ******* Yes Salome La Paz Isolated small rural
townIsolated small rural No
San Carlos Gila Small rural town Large rural town Yes San Luis Yuma Urban ******* Yes San Manuel Pinal Small rural town Urban Yes San Simon Cochise Isolated small rural Isolated small rural No San Tan Valley Pinal Urban Urban No Sanders Apache Isolated small rural ******* Yes Sasabe Pima Urban ******* Yes Scottsdale Maricopa Urban Urban No Second Mesa Navajo Isolated small rural
townIsolated small rural No
Sedona Coconino Small rural town Small rural town No Seligman Yavapai Isolated small rural
town Isolated small rural No
Sells Pima Isolated small rural town
Urban Yes Shonto Navajo Small rural town Urban Yes Show Low Navajo Small rural town Large rural town Yes Sierra Vista Cochise Large rural town Urban Yes Skull Valley Yavapai Urban ******* Yes Snowflake Navajo Small rural town Small rural town No Solomon Graham Large rural town ******* Yes Somerton Yuma Urban Urban No Sonoita Santa Cruz Isolated small rural
townUrban Yes
Springerville Apache Small rural town Small rural town No
Appendix C (cont.)

47
Town-City County 2000 Zip Code-RUCA 2010 Zip Code-RUCA Classification Chg.
Stanfield Pinal Urban Urban No Sun City Maricopa Urban Urban No Sun City West Maricopa Urban Urban No Sun Valley Navajo Small rural town Small rural town
No
Supai Coconino Isolated small rural Urban Yes Superior Pinal Urban Urban No Surprise Maricopa Urban Urban No Tacna Yuma Urban ******* Yes Taylor Navajo Small rural town ******* No Teec Nos Pos Apache Isolated small rural
townUrban Yes
Tempe Maricopa Urban Urban No Temple Bar Marin Mohave Large rural town ******* Yes Thatcher Graham Large rural town Large rural town No Tolleson Maricopa Urban Urban No Tombstone Cochise Isolated small rural
townUrban Yes
Tonalea Coconino Small rural town ******* Yes Tonopah Maricopa Urban Urban No Tonto Basin Gila Large rural town ******* Yes Topawa Pima Urban ******* Yes Topock Mohave Small rural town Large rural town Yes Tortilla Flat Maricopa Urban ******* Yes Tsaile Apache Isolated small rural
townUrban Yes
Tuba City Coconino Small rural town Small rural town No Tubac Santa Cruz Isolated small rural
townUrban Yes
Tucson Pima Urban Urban No Tumacacori San Cruz Isolated small rural Isolated small rural
No
Vail Pima Urban Urban No Valentine Mohave Large rural town ******* Yes Vernon Apache Small rural town ******* Yes Valley Farms Pinal Small rural town ******* Yes Waddell Maricopa Urban Urban No Wellton Yuma Urban Urban No Wenden
La Paz Isolated small rural town
******* Yes White Mount. Lake
MmMMoMountlLLLak
Navajo Smaill rural town ******* Yes Whiteriver Navajo Small rural town Large rural town Yes Wickenburg Maricopa Urban Urban No Wikieup Mohave Large rural town ******* Yes Willcox Cochise Small rural town Small rural town No Williams Coconino Isolated small rural
town Urban Yes
Willow Beach Mohave Large rural town Isolated small rural Yes Window Rock Apache Small rural town ******* Yes Winkelman Gila Isolated small rural
townUrban Yes
Winslow Navajo Small rural town Small rural town No
Appendix C (cont.)

48
Town-City County 2000 Zip Code-RUCA 2010 Zip Code-RUCA Classification Chg.
Whittmann Maricopa Urban
Urban No Woodruff Navajo Small rural town *******
Yes
Yarnell Yavapai Urban Urban No Young Gila Large rural town *******
Yes
Youngtown Maricopa Urban Urban No Yucca Mohave Small rural town ******** Yes Yuma Yuma Urban Urban No
Based on University of Washington RUCA Classifications Key: “Blue Yes” – change to a larger town/urban classification in 2010
“Red Yes” – change to a smaller town classification in 2010 “Black Yes” – previously classification in 2000, but not in 2010 “Black No” – no change in town/urban classification between 2000 and 2010
Appendix C (cont.)

49
Appendix D: Number of Pharmacists in Arizona Towns and Cities 2013
Town-City County 2013 Numbers
Aguila Maricopa 1 Ajo Pima 1 Alpine Apache 1 Amado Santa Cruz 2 Anthem Maricopa 35 Apache Junction Maricopa 1 Apache Junction Pinal 13 Arivaca Pima 0 Arizona City Pinal 0 Arlington Maricopa 0 Ash Fork Yavapai 0 Avondale Maricopa 50 Avra Valley Pima 0 Bagdad Yavapai 0 Bapchule Pinal 0 Bellemont Coconino 0 Benson Cochise 2 Bisbee Cochise 2 Black Canyon City Yavapai 2 Blue Greenlee 0 Blue Gap Navajo 0 Bouse La Paz 0 Bowie Cochise 0 Buckeye Maricopa 34 Bullhead City Mohave 27 Bylas Graham 0 Cameron Coconino 0 Camp Verde Yavapai 5 Carefree Maricopa 7 Casa Grande Pinal 17 Cashion Maricopa 0 Cave Creek Maricopa 80 Central Graham 5 Chamber Apache 0 Chandler Maricopa 485 Chandler Heights Maricopa 0 Chinle Apache 3 Chino Valley Yavapai 7 Chloride Mohave 0 Cibecue Navajo 0

50
Town-City County 2013 Numbers
Cibola La Paz 0 Clarkdale Yavapai 2 Clay Springs
Navajo 0 Claypool Gila 0 Clifton Greenlee 0 Cochise Cochise 0 Colorado City Mohave 0 Concho Apache 1 Congress Yavapai 0 Coolidge Pinal 3 Cornville Pinal 1 Cornville Yavapai 6 Cortaro Pima 2 Cottonwood Yavapai 13 Crown King Yavapai 0 Dataland Yuma 0 Dennehotso Apache 0 Desert Hills Maricopa 3 Dewey Yavapai 3 Dolan Springs Mohave 0 Douglas Cochise 5 Dragoon Cochise 0 Duncan Greenlee 0 Eagar Apache 1 Eden Graham 0 Ehrenberg La Paz 0 El Mirage Maricopa 3 Elfrida Cochise 0 Elgin Santa Cruz 1 Eloy Pinal 3 Flagstaff Coconino 97 Florence Pinal 7 Forest Lake Coconino 0 Fort Apache Navajo 0 Fort Defiance Apache 1 Fort Defiance Navajo 1 Fort Huachuca Cochise 0 Fort McDowell Maricopa 0 Fort Mohave Mohave 8 Fort Thomas Graham 0 Fountain Hills Maricopa 55 Fredonia Coconino 0 Gadsden Yuma 0
Appendix D (cont.)

51
Town-City County 2013 Numbers
Ganado Apache 1 Gila Bend Maricopa 0 Gilbert Maricopa 413 Glendale Maricopa 307 Globe Gila 6 Gold Canyon Pinal 15 Golden Valley Mohave 2 Goodyear Maricopa 121 Grand Canyon
Village
Coconino 0
Gray Mountain Coconino 0
Green Valley Pima 14 Greer Apache 0 Hackberry Mohave 0 Happy Jack Coconino 1 Hayden Gila 0 Heber Navajo 0 Hereford Cochise 5 Higley Maricopa 2 Holbrook Navajo 2 Hotevilla Navajo 0 Houck Apache 0 Huachuca City Cochise 1 Hualapai Mohave 0 Humboldt Yavapai 1 Indian Wells Navajo 0 Jerome Yavapai 0 Joseph City Navajo 0 Kaibito Coconino 0 Kayenta Navajo 2 Keams Canyon Navajo 0 Kearny Pinal 0 Kingman Mohave 47 Kirkland Yavapai 0 Kykotsmovi Village Navajo 0 Lake Havasu City La Paz 3 Lake Havasu City Maricopa 1 Lake Havasu City Mohave 37 Lake Montezuma Yavapai 0 Lakeside Navajo 10 Laveen Maricopa 20 Leupp Coconino 0 Litchfield Park Maricopa 53 Littlefield Mohave 0
Appendix D (cont.)

52
Town-City County 2013 Numbers
Lukachukai Apache 0 Lukeville Pima 0 Lupton Apache 0 Mammoth Pinal 0 Many Farms Apache 0 Marana Pima 39 Marana Pinal 1 Marble Canyon Coconino 0 Maricopa Maricopa 1 Maricopa Pinal 1 Mayer
Yavapai
3 McNary Apache 0 McNeal Cochise 1 Meadview Mohave 0 Mesa Maricopa 308 Miami Gila 0 Mohave Valley Mohave 0 Morenci Greenlee 0 Mormon Lake Coconino 0 Morrristown Maricopa 2 Mount Lemon Pima 0 Naco Cochise 0 Nazlini Apache 0 New River Maricopa 4 Munds Park Coconino 1 Nogales Santa Cruz 1 Nutrioso Apache 0 Oatman Mohave 0 Oracle Pinal 3 Oro Valley Pima 81 Overgaard Navajo 2 Page Coconino 5 Pale Verde Maricopa 0 Paradise Valley Maricopa 26 Parker La Paz 2 Parks Coconino 1 Patagonia Santa Cruz 2 Paulden Yavapai 0 Payson Gila 18 Peach Springs Mohave 0 Pearce Cochise 2 Peoria Maricopa 314 Peridot Gila 0
Appendix D (cont.)

53
Town-City County 2013 Numbers
Phoenix Maricopa 1,115 Picacho Pinal 0 Pima Graham 5 Pine Gila 2 Pinedale Navajo 0 Pinetop Apache 1 Pinetop Navajo 14 Pinon Navajo 0 Pirtleville Cochise 0 Polacca Navajo 0 Pomerene Cochise 0 Poston La Paz 0 Prescott Yavapai 80 Prescott Valley Maricopa 1 Prescott Valley Yavapai 37 Quartzsite La Paz 0 Queen Creek Maricopa 31 Queen Creek Pinal 9 Red Rock Pinal 0 Red Valley Apache 0 Rillito Pima 0 Rim Rock Yavapai 0 Rio Rico Santa Cruz 3 Rio Verde Maricopa 0 Rock Point Apache 0 Roll Yuma 0 Roosevelt Gila 1 Round Rock Apache 0 Sacaton Pinal 1 Safford Graham 8 Sahuarita Pima 28 Saint David Cochise 0 Saint John Apache 0 Saint Michaels Apache 0 Salome La Paz 0 San Carlos Gila 0 San Luis Yuma 0 San Manuel Pinal 0 San Simon Cochise 0 San Tan Valley Maricopa 1 San Tan Valley Pinal 20 Sanders Apache 0 Sasabe Pima 0
Appendix D (cont.)
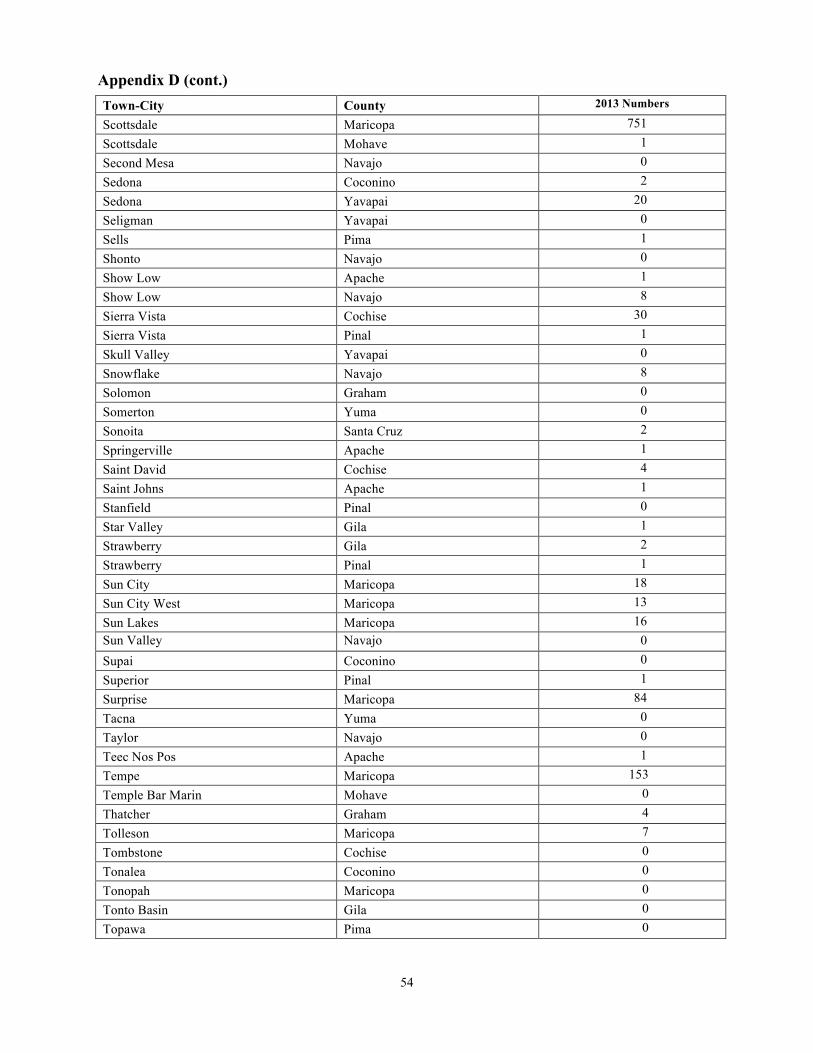
54
Town-City County 2013 Numbers
Scottsdale Maricopa 751 Scottsdale Mohave 1 Second Mesa Navajo 0 Sedona Coconino 2 Sedona Yavapai 20 Seligman Yavapai 0 Sells Pima 1 Shonto Navajo 0 Show Low Apache 1 Show Low Navajo 8 Sierra Vista Cochise 30 Sierra Vista Pinal 1 Skull Valley Yavapai 0 Snowflake Navajo 8 Solomon Graham 0 Somerton Yuma 0 Sonoita Santa Cruz 2 Springerville Apache 1 Saint David Cochise 4 Saint Johns Apache 1 Stanfield Pinal 0 Star Valley Gila 1 Strawberry Gila 2 Strawberry Pinal 1 Sun City Maricopa 18 Sun City West Maricopa 13 Sun Lakes Maricopa 16 Sun Valley Navajo 0 Supai Coconino 0 Superior Pinal 1 Surprise Maricopa 84 Tacna Yuma 0 Taylor Navajo 0 Teec Nos Pos Apache 1 Tempe Maricopa 153 Temple Bar Marin Mohave 0 Thatcher Graham 4 Tolleson Maricopa 7 Tombstone Cochise 0 Tonalea Coconino 0 Tonopah Maricopa 0 Tonto Basin Gila 0 Topawa Pima 0
Appendix D (cont.)

55
Town-City County 2013 Numbers
Topock Mohave 0 Tortilla Flat Maricopa 0 Tsaile Apache 0 Tuba City Coconino 2 Tubac Santa Cruz 3 Tucson Maricopa 1 Tucson Pima 1,019 Tucson Pinal 9 Tumacacori San Cruz 0 Vail Pima 26 Valentine Mohave 0 Vernon Apache 0 Valley Farms Pinal 0 Waddell Maricopa 4 Wellton Yuma 1 Wenden
La Paz 0 White Mount. Lake MmMMoMountlLLLak
Navajo 0 Whiteriver Navajo 2 Wickenburg Maricopa 5 Wickenburg Yavapai 1 Wikieup Mohave 0 Willcox Cochise 4 Williams Coconino 2 Willow Beach Mohave 0 Window Rock Apache 2 Winkelman Gila 1 Winslow Navajo 3 Whittmann Maricopa 3 Woodruff Navajo 0 Yarnell Yavapai 0 Young Gila 0 Youngtown Maricopa 2 Yucca Mohave 0 Yuma Maricopa 1 Yuma Yuma 83
Source: Arizona State Board of Pharmacy
Appendix D (cont.)
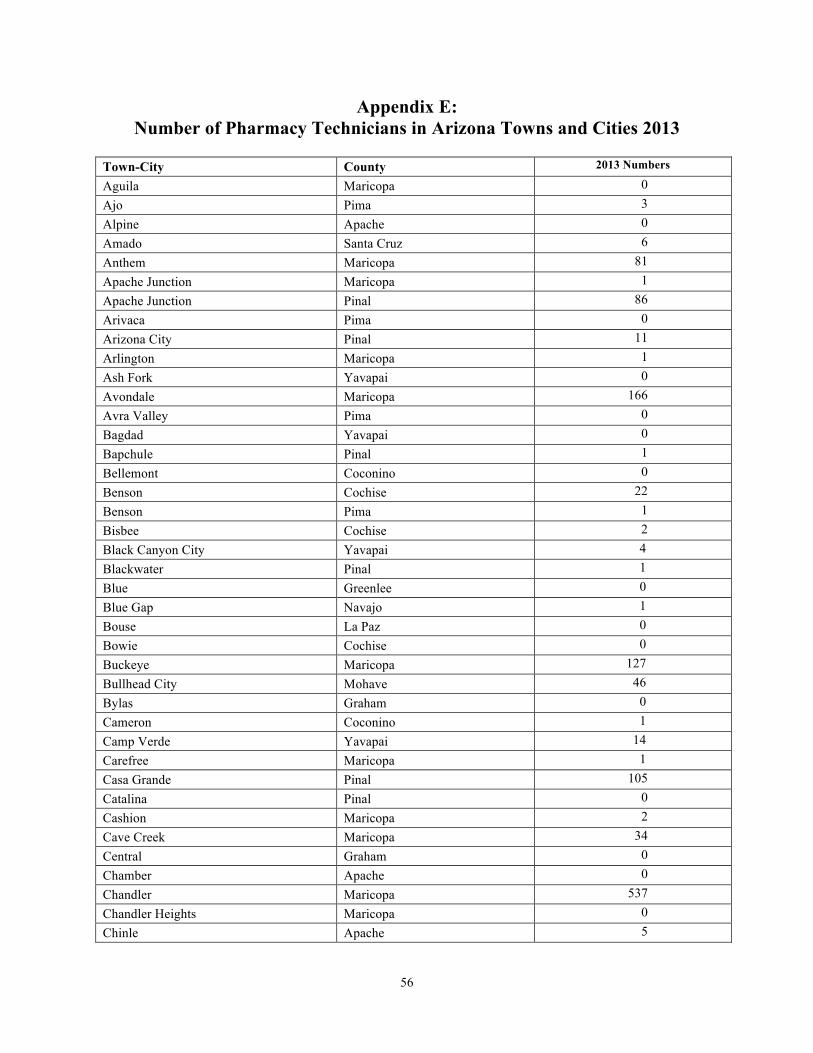
56
Appendix E: Number of Pharmacy Technicians in Arizona Towns and Cities 2013
Town-City County 2013 Numbers
Aguila Maricopa 0 Ajo Pima 3 Alpine Apache 0 Amado Santa Cruz 6 Anthem Maricopa 81 Apache Junction Maricopa 1 Apache Junction Pinal 86 Arivaca Pima 0 Arizona City Pinal 11 Arlington Maricopa 1 Ash Fork Yavapai 0 Avondale Maricopa 166 Avra Valley Pima 0 Bagdad Yavapai 0 Bapchule Pinal 1 Bellemont Coconino 0 Benson Cochise 22 Benson Pima 1 Bisbee Cochise 2 Black Canyon City Yavapai 4 Blackwater Pinal 1 Blue Greenlee 0 Blue Gap Navajo 1 Bouse La Paz 0 Bowie Cochise 0 Buckeye Maricopa 127 Bullhead City Mohave 46 Bylas Graham 0 Cameron Coconino 1 Camp Verde Yavapai 14 Carefree Maricopa 1 Casa Grande Pinal 105 Catalina Pinal 0 Cashion Maricopa 2 Cave Creek Maricopa 34 Central Graham 0 Chamber Apache 0 Chandler Maricopa 537 Chandler Heights Maricopa 0 Chinle Apache 5
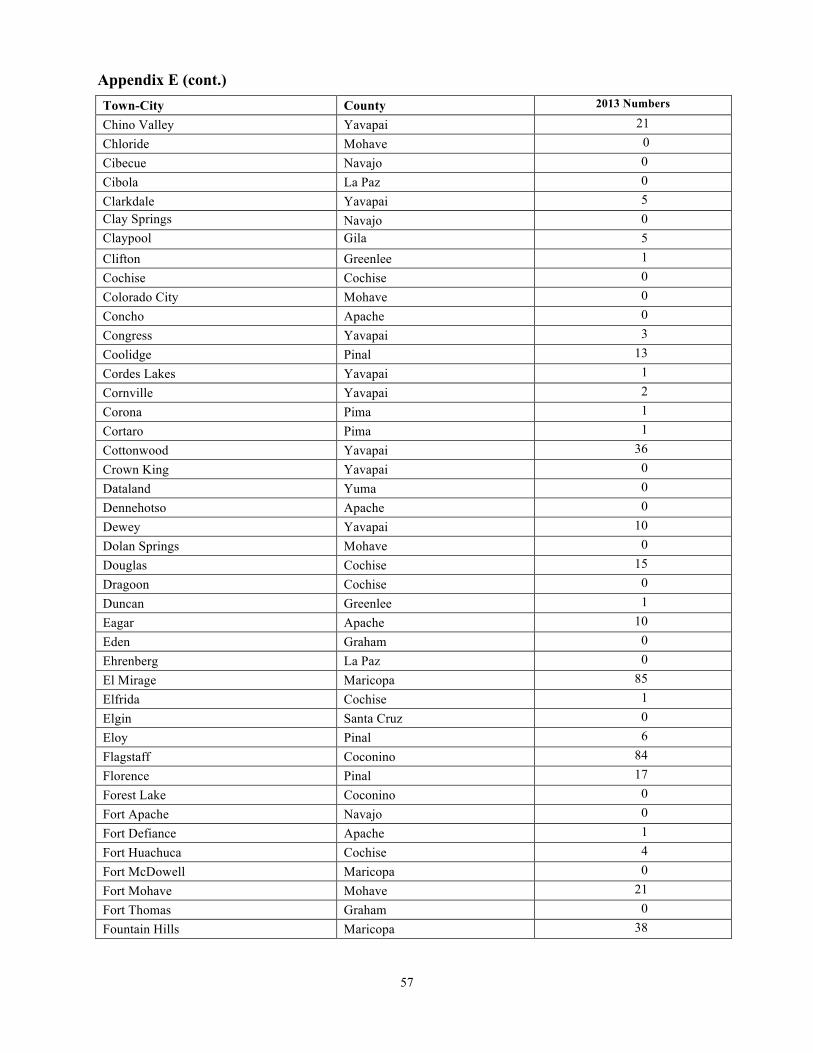
57
Town-City County 2013 Numbers
Chino Valley Yavapai 21 Chloride Mohave 0 Cibecue Navajo 0 Cibola La Paz 0 Clarkdale Yavapai 5 Clay Springs
Navajo 0 Claypool Gila 5 Clifton Greenlee 1 Cochise Cochise 0 Colorado City Mohave 0 Concho Apache 0 Congress Yavapai 3 Coolidge Pinal 13 Cordes Lakes Yavapai 1 Cornville Yavapai 2 Corona Pima 1 Cortaro Pima 1 Cottonwood Yavapai 36 Crown King Yavapai 0 Dataland Yuma 0 Dennehotso Apache 0 Dewey Yavapai 10 Dolan Springs Mohave 0 Douglas Cochise 15 Dragoon Cochise 0 Duncan Greenlee 1 Eagar Apache 10 Eden Graham 0 Ehrenberg La Paz 0 El Mirage Maricopa 85 Elfrida Cochise 1 Elgin Santa Cruz 0 Eloy Pinal 6 Flagstaff Coconino 84 Florence Pinal 17 Forest Lake Coconino 0 Fort Apache Navajo 0 Fort Defiance Apache 1 Fort Huachuca Cochise 4 Fort McDowell Maricopa 0 Fort Mohave Mohave 21 Fort Thomas Graham 0 Fountain Hills Maricopa 38
Appendix E (cont.)

58
Town-City County 2013 Numbers
Fredonia Coconino 1 Gadsden Yuma 1 Ganado Apache 14 Gila Bend Maricopa 1 Gilbert Maricopa 515 Glendale Maricopa 657 Globe Gila 13 Gold Canyon Pinal 16 Golden Valley Mohave 6 Goodyear Maricopa 153 Grand Canyon
Village
Coconino 0 Granado Apache 1
Gray Mountain Coconino 0
Green Valley Pima 22 Greer Apache 0 Hackberry Mohave 0 Happy Jack Coconino 0 Hayden Gila 0 Heber Navajo 0 Hereford Cochise 10 Higley Maricopa 2 Holbrook Navajo 4 Hotevilla Navajo 1 Houck Apache 0 Huachuca City Cochise 5 Hualapai Mohave 0 Humboldt Mohave 1 Indian Wells Navajo 0 Janesville Maricopa 1 Jerome Yavapai 0 Joseph City Navajo 0 Kaibito Coconino 2 Kayenta Navajo 4 Keams Canyon Navajo 0 Kearny Pinal 1 Kingman Mohave 73 Kirkland Yavapai 1 Kykotsmovi Village Navajo 1 Lake Havasu City Mohave 72 Lake Montezuma Yavapai 0 Lakeside Navajo 8 Laveen Maricopa 90 Leupp Coconino 2
Appendix E (cont.)

59
Town-City County 2013 Numbers
Linden Navajo 1 Litchfield Park Maricopa 62 Littlefield Mohave 0 Lukachukai Apache 1 Lukeville Pima 0 Lupton Apache 0 Mammoth Pinal 3 Many Farms Apache 0 Marana Pima 38 Marble Canyon Coconino 0 Maricopa Pinal 84 Mayer
Yavapai
4 McNary Apache 0 McNeal Cochise 2 Meadview Mohave 0 Mesa Maricopa 1,032 Mesquite Mohave 0 Miami Gila 6 Mohave Valley Mohave 10 Morenci Greenlee 4 Mormon Lake Coconino 0 Morrristown Maricopa 2 Mount Lemon Pima 0 Naco Cochise 2 Nazlini Apache 0 New River Maricopa 14 Nogales Santa Cruz 18 Nutrioso Apache 0 Oatman Mohave 0 Oracle Pinal 7 Overgaard Navajo 29 Page Coconino 7 Pale Verde Maricopa 0 Paradise Valley Maricopa 4 Parker La Paz 9 Parks Coconino 1 Patagonia Santa Cruz 0 Paulden Yavapai 3 Payson Gila 22 Peach Springs Mohave 0 Pearce Cochise 1 Peeples Valley Yavapai 1 Peoria Maricopa 395
Appendix E (cont.)
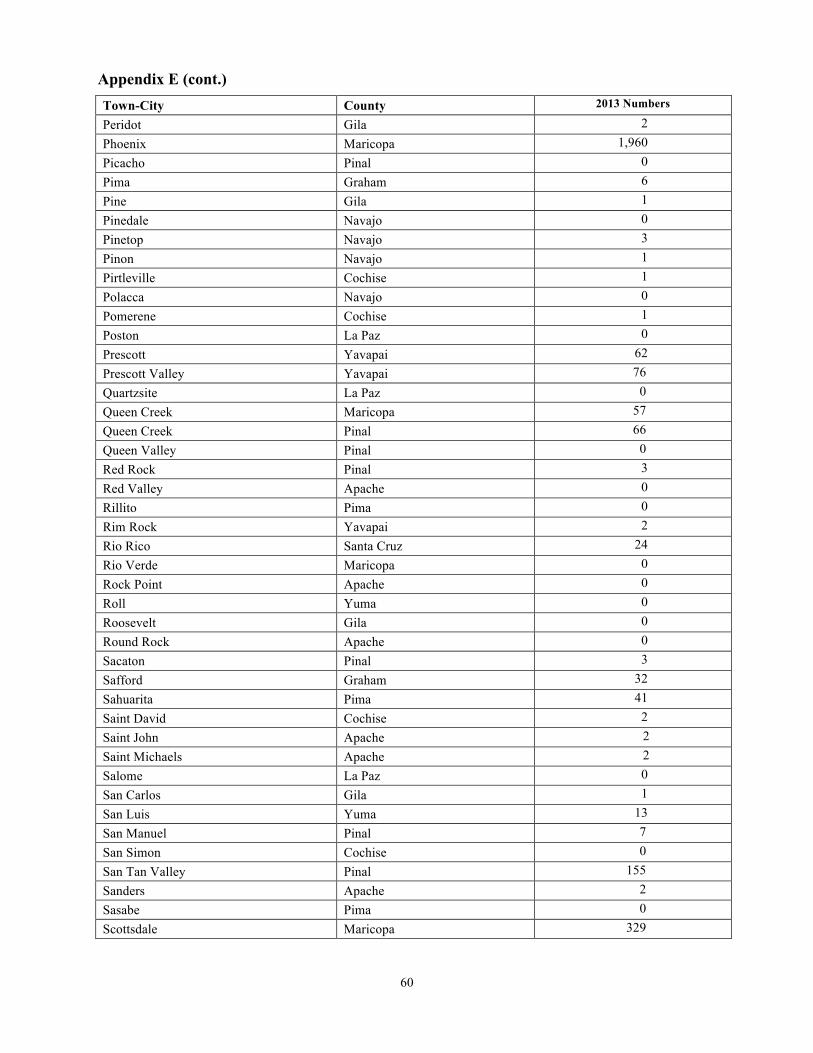
60
Town-City County 2013 Numbers
Peridot Gila 2 Phoenix Maricopa 1,960 Picacho Pinal 0 Pima Graham 6 Pine Gila 1 Pinedale Navajo 0 Pinetop Navajo 3 Pinon Navajo 1 Pirtleville Cochise 1 Polacca Navajo 0 Pomerene Cochise 1 Poston La Paz 0 Prescott Yavapai 62 Prescott Valley Yavapai 76 Quartzsite La Paz 0 Queen Creek Maricopa 57 Queen Creek Pinal 66 Queen Valley Pinal 0 Red Rock Pinal 3 Red Valley Apache 0 Rillito Pima 0 Rim Rock Yavapai 2 Rio Rico Santa Cruz 24 Rio Verde Maricopa 0 Rock Point Apache 0 Roll Yuma 0 Roosevelt Gila 0 Round Rock Apache 0 Sacaton Pinal 3 Safford Graham 32 Sahuarita Pima 41 Saint David Cochise 2 Saint John Apache 2 Saint Michaels Apache 2 Salome La Paz 0 San Carlos Gila 1 San Luis Yuma 13 San Manuel Pinal 7 San Simon Cochise 0 San Tan Valley Pinal 155 Sanders Apache 2 Sasabe Pima 0 Scottsdale Maricopa 329
Appendix E (cont.)

61
Town-City County 2013 Numbers
Second Mesa Navajo 0 Sedona Coconino 16 Seligman Yavapai 0 Sells Pima 1 Shonto Navajo 0 Show Low Navajo 26 Sierra Vista Cochise 51 Skull Valley Yavapai 0 Snowflake Navajo 10 Solomon Graham 0 Somerton Yuma 13 Sonoita Santa Cruz 0 Spring Valley Yavapai 1 Springerville Apache 6 Stanfield Pinal 5 Strawberry Gilia 1 Sun City Maricopa 42 Sun City West Maricopa 9 Sun Valley Navajo 0 Supai Coconino 0 Superior Pinal 2 Surprise Maricopa 260 Tacna Yuma 0 Taylor Navajo 7 Teec Nos Pos Apache 0 Tempe Maricopa 330 Temple Bar Marin Mohave 0 Thatcher Graham 4 Tolleson Maricopa 80 Toltec Pinal 1 Tombstone Cochise 0 Tonalea Coconino 4 Tonopah Maricopa 11 Tonto Basin Gila 0 Topawa Pima 0 Topock Mohave 1 Tortilla Flat Maricopa 0 Tsaile Apache 0 Tuba City Coconino 12 Tubac Santa Cruz 0 Tucson Pima 1,355 Tumacacori San Cruz 0 Vail Pima 30
Appendix E (cont.)

62
Town-City County 2013 Numbers
Valentine Mohave 0 Valley Farms Pinal 1 Vernon Apache 3 Waddell Maricopa 20 Wellton Yuma 2 Wenden
La Paz 0 White Mount. Lake MmMMoMountlLLLak
Navajo 0 Whiteriver Navajo 0 Wickenburg Maricopa 10 Wikieup Mohave 0 Willcox Cochise 9 Williams Coconino 4 Willow Beach Mohave 0 Window Rock Apache 1 Winkelman Gila 0 Winslow Navajo 14 Whittmann Maricopa 11 Woodruff Navajo 0 Yarnell Yavapai 1 Young Gila 0 Youngtown Maricopa 24 Yucca Mohave 0 Yuma Yuma 116
Source: Arizona State Board of Pharmacy
Appendix E (cont.)

63
Appendix F: Number of Pharmacies Arizona Towns and Cities 2013
Town-City County 2013 Numbers
Aguila Maricopa 0 Ajo Pima 1 Alpine Apache 0 Amado Santa Cruz 0 Anthem Maricopa 4 Apache Junction Pinal 11 Arivaca Pima 0 Arizona City Pinal 0 Arlington Maricopa 0 Ash Fork Yavapai 0 Avondale Maricopa 13 Avra Valley Pima 0 Bagdad Yavapai 0 Bapchule Pinal 0 Bellemont Coconino 0 Benson Cochise 4 Bisbee Cochise 2 Black Canyon City Yavapai 1 Blue Greenlee 0 Blue Gap Navajo 0 Bouse La Paz 0 Bowie Cochise 0 Buckeye Maricopa 7 Bullhead City Mohave 10 Bylas Graham 0 Cameron Coconino 0 Camp Verde Yavapai 2 Carefree Maricopa 2 Casa Grande Pinal 13 Cashion Maricopa 0 Cave Creek Maricopa 6 Central Graham 0 Chamber Apache 0 Chandler Maricopa 58 Chandler Heights Maricopa 0 Chinle Apache 0 Chino Valley Yavapai 2 Chloride Mohave 0 Cibecue Navajo 0

64
Town-City County 2013 Numbers
Cibola La Paz 0 Clarkdale Yavapai 0 Clay Springs
Navajo 0 Claypool Gila 1 Clifton Greenlee 0 Cochise Cochise 0 Colorado City Mohave 0 Concho Apache 0 Congress Yavapai 0 Coolidge Pinal 3 Cornville Yavapai 0 Cortaro Pima 0 Cottonwood Yavapai 7 Crown King Yavapai 0 Dataland Yuma 0 Dennehotso Apache 0 Dewey Yavapai 0 Dolan Springs Mohave 0 Douglas Cochise 6 Dragoon Cochise 0 Duncan Greenlee 0 Eagar Apache 0 Eden Graham 0 Ehrenberg La Paz 0 El Mirage Maricopa 3 Elfrida Cochise 0 Elgin Santa Cruz 0 Eloy Pinal 1 Flagstaff Coconino 21 Florence Pinal 3 Forest Lake Coconino 0 Fort Apache Navajo 0 Fort Defiance Apache 0 Fort Huachuca Cochise 0 Fort McDowell Maricopa 0 Fort Mohave Mohave 5 Fort Thomas Graham 0 Fountain Hills Maricopa 7 Fredonia Coconino 0 Gadsden Yuma 0 Ganado Apache 1 Gila Bend Maricopa 0 Gilbert Maricopa 51
Appendix F (cont.)
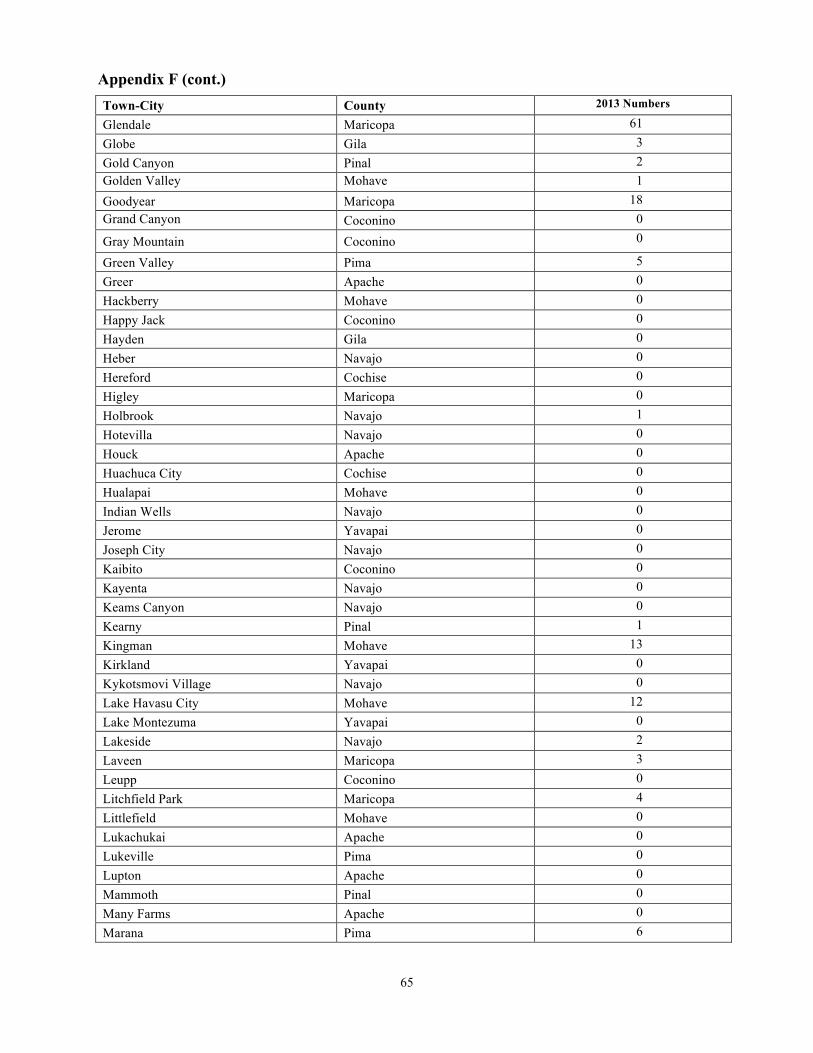
65
Town-City County 2013 Numbers
Glendale Maricopa 61 Globe Gila 3 Gold Canyon Pinal 2 Golden Valley Mohave 1 Goodyear Maricopa 18 Grand Canyon
Village
Coconino 0
Gray Mountain Coconino 0
Green Valley Pima 5 Greer Apache 0 Hackberry Mohave 0 Happy Jack Coconino 0 Hayden Gila 0 Heber Navajo 0 Hereford Cochise 0 Higley Maricopa 0 Holbrook Navajo 1 Hotevilla Navajo 0 Houck Apache 0 Huachuca City Cochise 0 Hualapai Mohave 0 Indian Wells Navajo 0 Jerome Yavapai 0 Joseph City Navajo 0 Kaibito Coconino 0 Kayenta Navajo 0 Keams Canyon Navajo 0 Kearny Pinal 1 Kingman Mohave 13 Kirkland Yavapai 0 Kykotsmovi Village Navajo 0 Lake Havasu City Mohave 12 Lake Montezuma Yavapai 0 Lakeside Navajo 2 Laveen Maricopa 3 Leupp Coconino 0 Litchfield Park Maricopa 4 Littlefield Mohave 0 Lukachukai Apache 0 Lukeville Pima 0 Lupton Apache 0 Mammoth Pinal 0 Many Farms Apache 0 Marana Pima 6
Appendix F (cont.)

66
Town-City County 2013 Numbers
Marble Canyon Coconino 0 Maricopa Maricopa 1 Maricopa Pinal 4 Mayer
Yavapai
1 McNary Apache 0 McNeal Cochise 0 Meadview Mohave 0 Mesa Maricopa 103 Miami Gila 1 Mohave Valley Mohave 0 Morenci Greenlee 1 Mormon Lake Coconino 0 Morrristown Maricopa 0 Mount Lemon Pima 0 Naco Cochise 0 Nazlini Apache 0 New River Maricopa 0 Nogales Santa Cruz 6 Nutrioso Apache 0 Oatman Mohave 0 Oracle Pinal 0 Oro Valley Pima 13 Overgaard Navajo 1 Page Coconino 3 Pale Verde Maricopa 0 Paradise Valley Maricopa 1 Parker La Paz 4 Parks Coconino 0 Patagonia Santa Cruz 0 Paulden Yavapai 0 Payson Gila 6 Peach Springs Mohave 0 Pearce Cochise 0 Peoria Maricopa 36 Peridot Gila 0 Phoenix Maricopa 270 Picacho Pinal 0 Pima Graham 0 Pine Gila 0 Pinedale Navajo 0 Pinetop Navajo 0 Pinon Navajo 0 Pirtleville Cochise 0
Appendix F (cont.)

67
Town-City County 2013 Numbers
Polacca Navajo 0 Pomerene Cochise 0 Poston La Paz 0 Prescott Yavapai 16 Prescott Valley Yavapai 12 Quartzsite La Paz 1 Queen Creek Maricopa 8 Queen Creek Pinal 2 Red Rock Pinal 0 Red Valley Apache 0 Rillito Pima 0 Rim Rock Yavapai 0 Rio Rico Santa Cruz 1 Rio Verde Maricopa 0 Rock Point Apache 0 Roll Yuma 0 Roosevelt Gila 0 Round Rock Apache 0 Sacaton Pinal 0 Safford Graham 5 Sahuarita Pima 3 Saint David Cochise 0 Saint John Apache 0 Saint Michaels Apache 0 Salome La Paz 0 San Carlos Gila 0 San Luis Yuma 3 San Manuel Pinal 1 San Simon Cochise 0 San Tan Valley Maricopa 1 San Tan Valley Pinal 4 Sanders Apache 0 Sasabe Pima 0 Scottsdale Maricopa 86 Second Mesa Navajo 0 Sedona Coconino 5 Seligman Yavapai 0 Sells Pima 0 Shonto Navajo 0 Show Low Navajo 7 Sierra Vista Cochise 11 Skull Valley Yavapai 0 Snowflake Navajo 0
Appendix F (cont.)

68
Town-City County 2013 Numbers
Solomon Graham 0 Somerton Yuma 1 Sonoita Santa Cruz 1 Springerville Apache 2 St. Johns Apache 1 Stanfield Pinal 0 Sun City Maricopa 10 Sun City West Maricopa 6 Sun Lakes Maricopa 3 Sun Valley Navajo 0 Supai Coconino 0 Superior Pinal 0 Surprise Maricopa 27 Tacna Yuma 0 Taylor Navajo 1 Teec Nos Pos Apache 0 Tempe Maricopa 52 Temple Bar Marin Mohave 0 Thatcher Graham 1 Tolleson Maricopa 1 Tombstone Cochise 1 Tonalea Coconino 0 Tonopah Maricopa 0 Tonto Basin Gila 0 Topawa Pima 0 Topock Mohave 0 Tortilla Flat Maricopa 0 Tsaile Apache 0 Tuba City Coconino 0 Tubac Santa Cruz 0 Tucson Pima 174 Tumacacori San Cruz 0 Vail Pima 1 Valentine Mohave 0 Vernon Apache 0 Valley Farms Pinal 0 Waddell Maricopa 0 Wellton Yuma 0 Wenden
La Paz 0 White Mount. Lake MmMMoMountlLLLak
Navajo 0 Whiteriver Navajo 0 Wickenburg Maricopa 6 Wikieup Mohave 0
Appendix F (cont.)

69
Town-City County 2013 Numbers
Willcox Cochise 3 Williams Coconino 1 Willow Beach Mohave 0 Window Rock Apache 0 Winkelman Gila 0 Winslow Navajo 4 Whittmann Maricopa 0 Woodruff Navajo 0 Yarnell Yavapai 0 Young Gila 0 Youngtown Maricopa 3 Yucca Mohave 0 Yuma Yuma 23
Source: Arizona State Board of Pharmacy
Appendix F (cont.)