Embed Size (px)
Citation preview
page 1
JAMESON CELL DEVELOPMENTS AT PHILEX MINING CORPORATION
by
Harbort, GJ,(1) Murphy, AS,(2) Budod A(3)
for publication in
The AusIMM Sixth Mill Operators Conference 1997
(1): Greg HarbortML Consultants9 Marica StreetBellbowrie, Qld 4070Australia.
(2): Andrew MurphyMIM Holdings LimitedGPO Box 1433Brisbane, Qld, 4000Australia
(3): Albert BudodPhilex Mining CorporationPO Box 46Baguio City, BenguetPhilippines
page 2
ABSTRACT
The Philex concentrator represents the first time Jameson Cells have been used in a cleaner scavengerapplication or to replace mechanical flotation cells in roughing and scavenging. It also represents the firstconcentrator to operate wholly with Jameson Cells. This necessitated a major change in Jameson Cell designas well as a change in operating philosophy within Philex.
This paper provides an update on cleaner circuit performance, together with refinements that were requiredfor cleaner scavenger, roughing and scavenging operation. The extended commissioning period and operationto date are reviewed in respect to operating difficulties, changes in operational philosophy and metallurgicalresults. Comparisons of operating, costs are provided as are residence time and flotation area, together withscale up information leading to the final production cell design. Metallurgical results in relation to gold andcopper recoveries are reviewed, with special attention given to direct comparisons between Jameson andmechanical flotation banks, size by size analysis and mineralogical performance.
INTRODUCTION
The Jameson Cell combines a novel method for air and slurry contact where a contained plunging jet naturallyentrains air achieving high voidage and intimate particle bubble contact. The fundamentals have been describedby numerous authors, including Jameson and Manlapig (1991) and are not discussed further here.
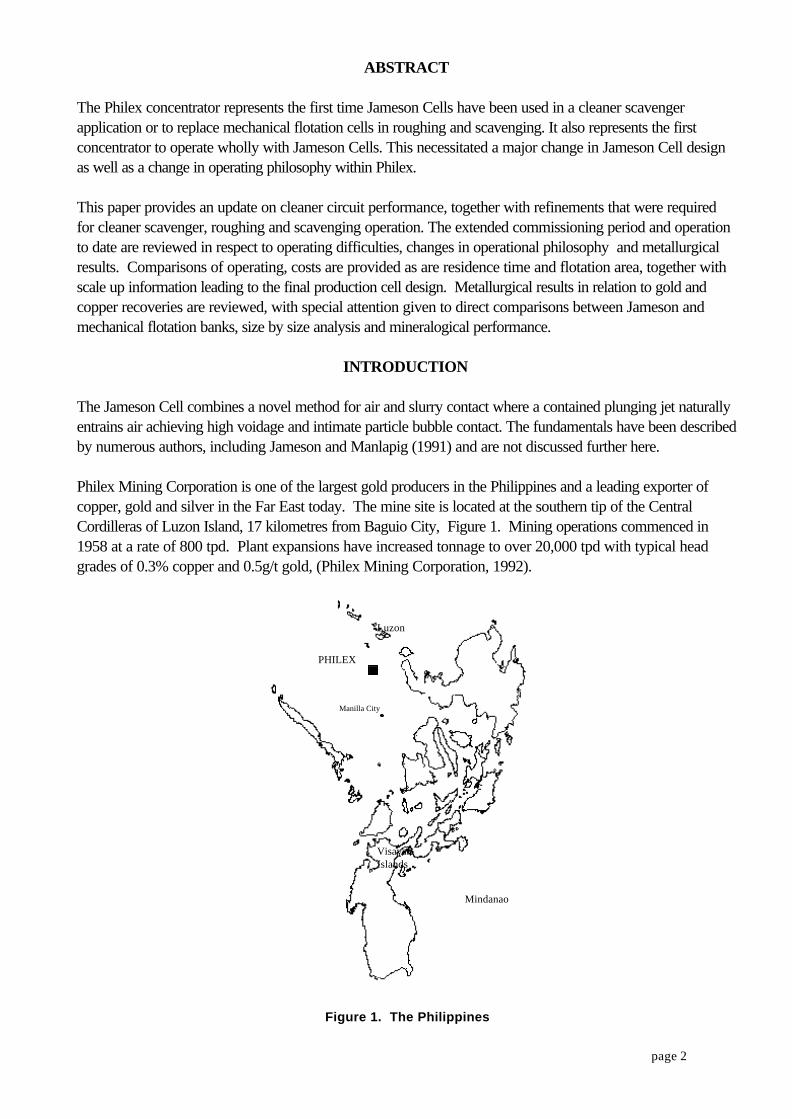
Philex Mining Corporation is one of the largest gold producers in the Philippines and a leading exporter ofcopper, gold and silver in the Far East today. The mine site is located at the southern tip of the CentralCordilleras of Luzon Island, 17 kilometres from Baguio City, Figure 1. Mining operations commenced in1958 at a rate of 800 tpd. Plant expansions have increased tonnage to over 20,000 tpd with typical headgrades of 0.3% copper and 0.5g/t gold, (Philex Mining Corporation, 1992).
Luzon
Mindanao
VisayanIslands
Manilla City
PHILEX
Figure 1. The Philippines
page 3
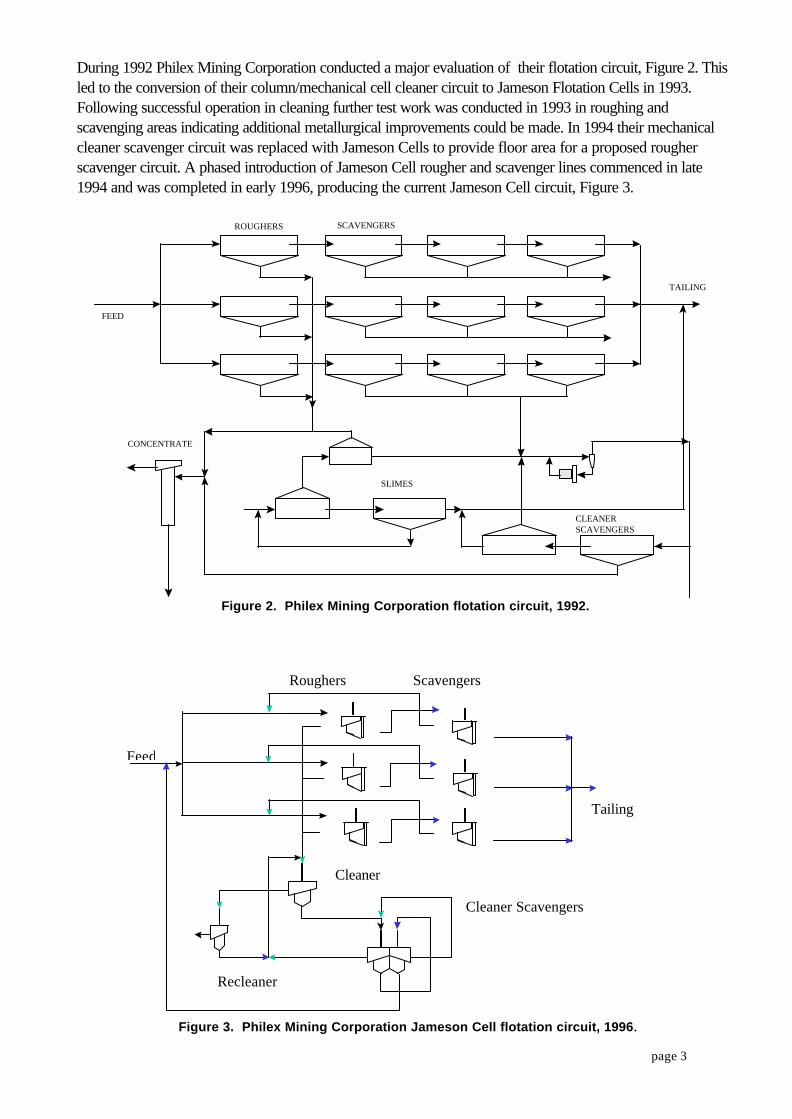
During 1992 Philex Mining Corporation conducted a major evaluation of their flotation circuit, Figure 2. Thisled to the conversion of their column/mechanical cell cleaner circuit to Jameson Flotation Cells in 1993.Following successful operation in cleaning further test work was conducted in 1993 in roughing andscavenging areas indicating additional metallurgical improvements could be made. In 1994 their mechanicalcleaner scavenger circuit was replaced with Jameson Cells to provide floor area for a proposed rougherscavenger circuit. A phased introduction of Jameson Cell rougher and scavenger lines commenced in late1994 and was completed in early 1996, producing the current Jameson Cell circuit, Figure 3.
ROUGHERS SCAVENGERS
SLIMES
CLEANERSCAVENGERS
CONCENTRATE
FEED
TAILING
Figure 2. Philex Mining Corporation flotation circuit, 1992.
Roughers Scavengers
Feed
Tailing
Cleaner Scavengers
Cleaner
Recleaner
Figure 3. Philex Mining Corporation Jameson Cell flotation circuit, 1996.
page 4
CLEANER SCAVENGER INSTALLATION.
Motivation
Additional floor space created by the installation of the cleaner/recleaner cells had been used to increasecleaner scavenger residence time by sixty percent, through additional mechanical cells. As such, there hadinitially been no plan to replace the existing mechanical cleaner scavengers with Jameson Cells.
Following six months successful Jameson Cell cleaner/recleaner operation Philex’s confidence in JamesonCell technology was such to begin planning of a rougher/scavenger installation. This original proposal requireda phased replacement of the mechanical banks, in their existing location, with Jameson Cells. A one third lossin plant capacity would have resulted at each equipment change over. In early 1994 a review of therougher/scavenger proposal indicated that this entire circuit could be placed in the area where the mechanicalcleaner scavengers were currently installed, without affecting production. This provided the motivation for achange of the cleaner scavenger circuit to Jameson Cells.
Design Considerations
Two major difficulties with this change over existed:
1. The only cleaner scavenger test work conducted (Harbort, 1992), was done with the aim ofincreasing circuit recovery with the addition of one Jameson Cell acting as a scalper. Scale-upcalculations had shown that a four metre diameter cell with sixteen downcomers (4000/16) wasrequired for this duty and initial cell design had been commenced. Typically it was to produce aconcentrate of 15% Cu at a copper recovery of 60%. This compared with a new requirement toproduce a recovery of 90% or better.
2. Available floor space was limited to an area 6.0m by 6.0m.
Alterations to initial design
The limited test work had indicated that recovery was very dependent on superficial air velocity, (Jg), with anincrease in Jg from 0.4cm/sec to 0.8cm/sec giving a copper recovery increase from 60% to 70%. A furtherincrease in Jg to 1.2cm/sec was expected to further improve recovery to 80%, still less than the newrequirement, indicating that two stages of Jameson Cell treatment were required for the new application.
Until this installation Jameson Cell design had largely increased Jg by increasing the air to pulp ratio, (APR).Experience in other applications indicated that low APR values would not affect recovery provided the Jg wasmaintained. Later work at the University of Newcastle by Evans, Atkinson and Jameson (1995) subsequentlyconfirmed theoretical aspects. Lower APR values would allow tank diameters to be reduced, and alsoallowed operation with lower frother addition. Reduction of APR from an initial value of 0.3 to 0.2, whilemaintaining Jg at 1.2cm/sec allowed the diameter required to be reduced from 4.0m to 2.75m.
Two 2.75m cells were still unable to fit into the allowable space. To overcome this problem the 4000/16design was altered to produce a cell capable of two stages of flotation in the one shell. This was achieved bythe use of additional baffles in the feed distributor, tank, internal and external launder - creating the 4000/16 2stage Jameson Cell, Figure 4.
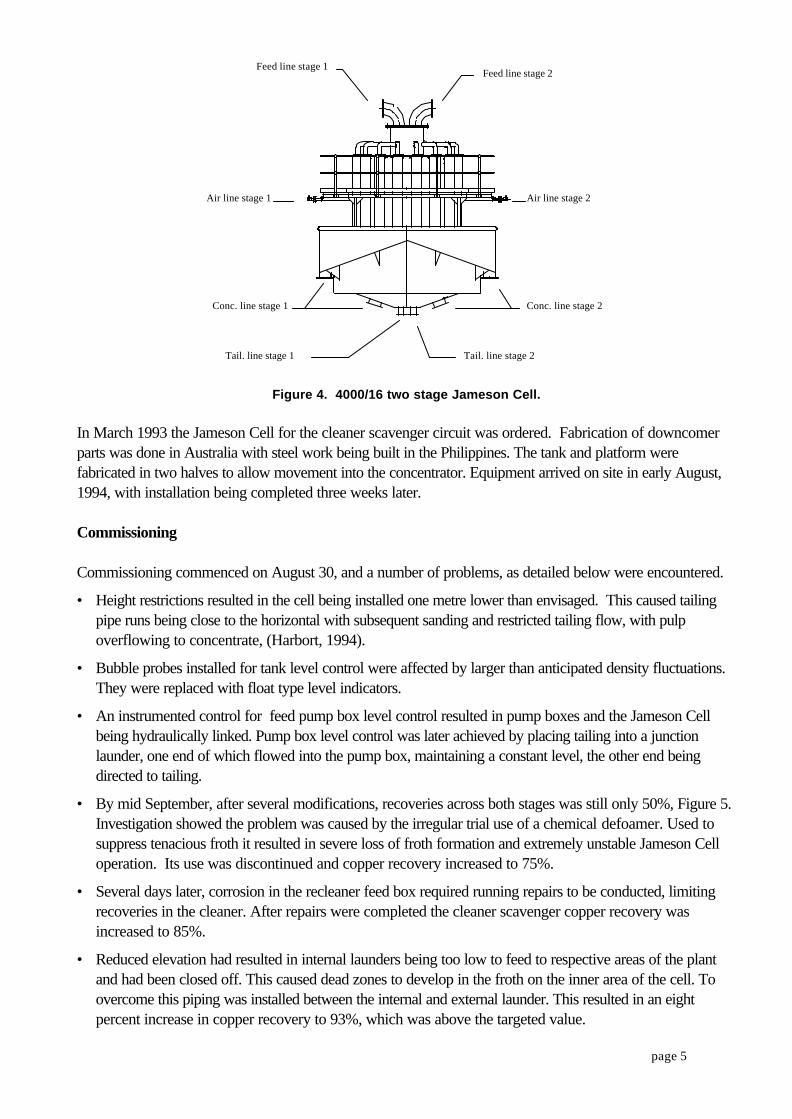
page 5
Feed line stage 1Feed line stage 2
Air line stage 1 Air line stage 2
Conc. line stage 1 Conc. line stage 2
Tail. line stage 1 Tail. line stage 2
Figure 4. 4000/16 two stage Jameson Cell.
In March 1993 the Jameson Cell for the cleaner scavenger circuit was ordered. Fabrication of downcomerparts was done in Australia with steel work being built in the Philippines. The tank and platform werefabricated in two halves to allow movement into the concentrator. Equipment arrived on site in early August,1994, with installation being completed three weeks later.
Commissioning
Commissioning commenced on August 30, and a number of problems, as detailed below were encountered.
• Height restrictions resulted in the cell being installed one metre lower than envisaged. This caused tailingpipe runs being close to the horizontal with subsequent sanding and restricted tailing flow, with pulpoverflowing to concentrate, (Harbort, 1994).
• Bubble probes installed for tank level control were affected by larger than anticipated density fluctuations.They were replaced with float type level indicators.
• An instrumented control for feed pump box level control resulted in pump boxes and the Jameson Cellbeing hydraulically linked. Pump box level control was later achieved by placing tailing into a junctionlaunder, one end of which flowed into the pump box, maintaining a constant level, the other end beingdirected to tailing.
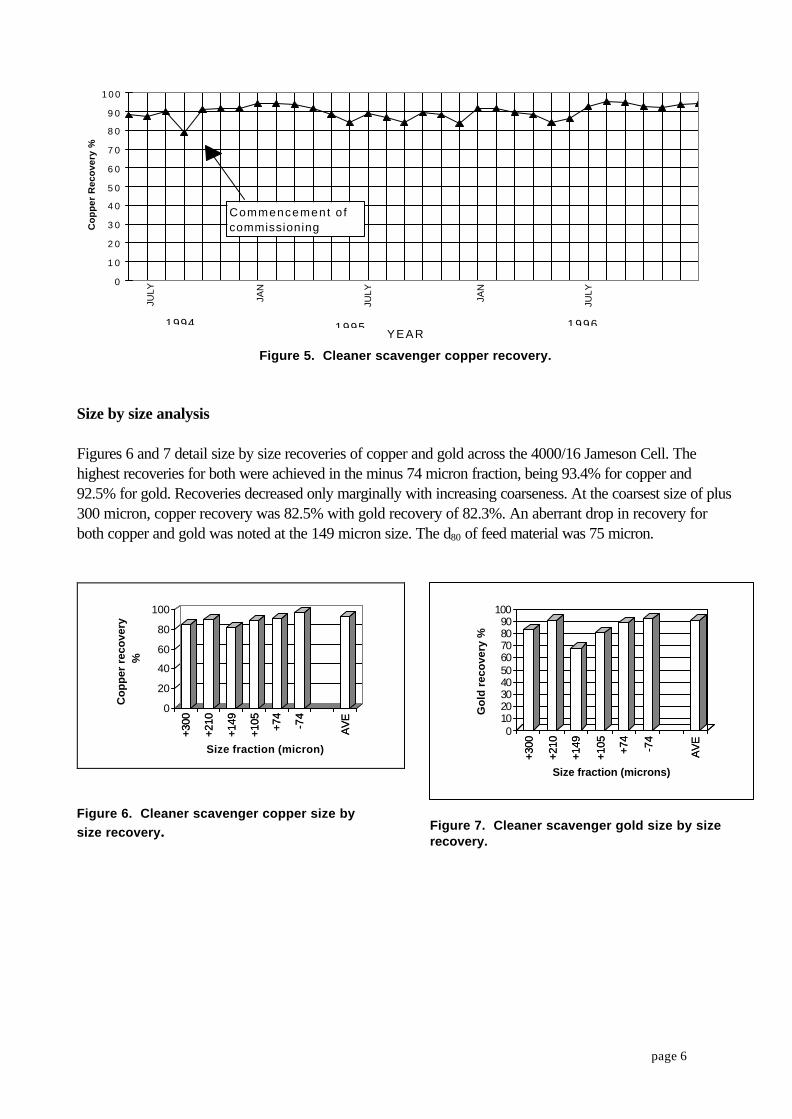
• By mid September, after several modifications, recoveries across both stages was still only 50%, Figure 5.Investigation showed the problem was caused by the irregular trial use of a chemical defoamer. Used tosuppress tenacious froth it resulted in severe loss of froth formation and extremely unstable Jameson Celloperation. Its use was discontinued and copper recovery increased to 75%.
• Several days later, corrosion in the recleaner feed box required running repairs to be conducted, limitingrecoveries in the cleaner. After repairs were completed the cleaner scavenger copper recovery wasincreased to 85%.
• Reduced elevation had resulted in internal launders being too low to feed to respective areas of the plantand had been closed off. This caused dead zones to develop in the froth on the inner area of the cell. Toovercome this piping was installed between the internal and external launder. This resulted in an eightpercent increase in copper recovery to 93%, which was above the targeted value.
page 6
0
1 0
2 0
3 0
4 0
5 0
6 0
7 0
8 0
9 0
1 0 0C
op
per
Rec
ove
ry %
JULY
JAN
JULY
JAN
JULY
Commencement o fcommissioning
1994 1995 1996YEAR
Figure 5. Cleaner scavenger copper recovery.
Size by size analysis
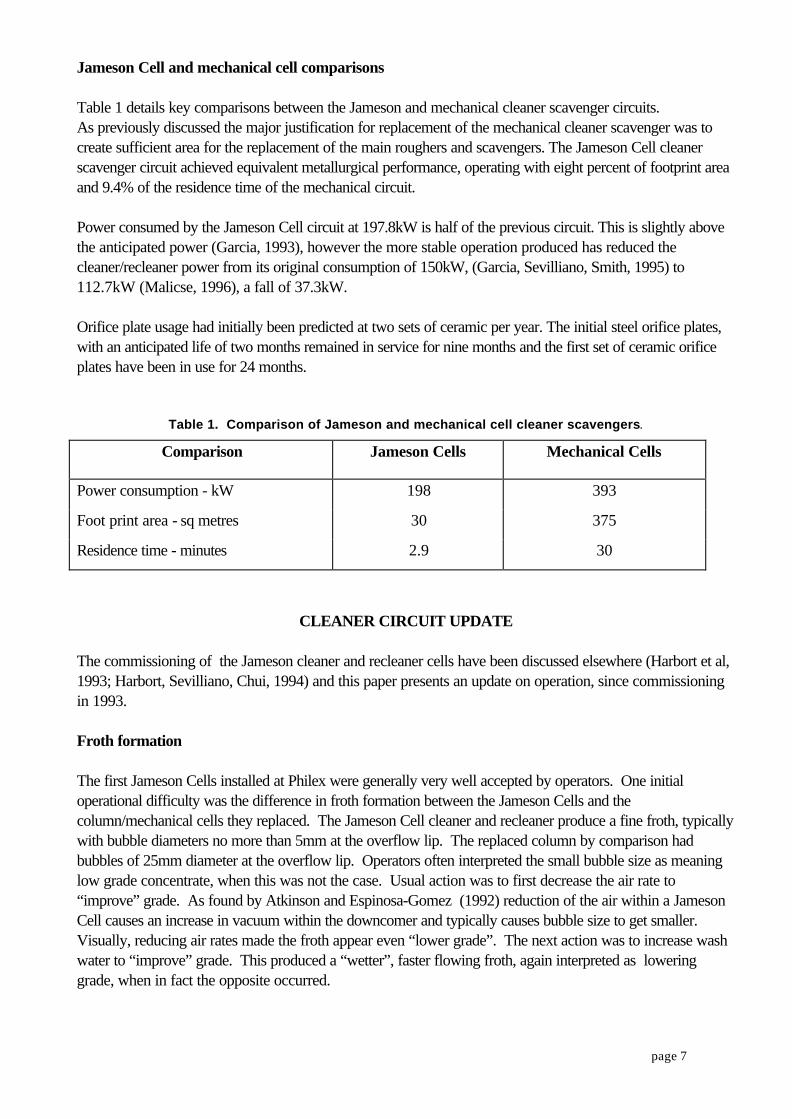
Figures 6 and 7 detail size by size recoveries of copper and gold across the 4000/16 Jameson Cell. Thehighest recoveries for both were achieved in the minus 74 micron fraction, being 93.4% for copper and92.5% for gold. Recoveries decreased only marginally with increasing coarseness. At the coarsest size of plus300 micron, copper recovery was 82.5% with gold recovery of 82.3%. An aberrant drop in recovery forboth copper and gold was noted at the 149 micron size. The d80 of feed material was 75 micron.
+300
+210
+149
+105 +74
-74
AV
E
0
20
40
60
80
100
Co
pp
er r
eco
very
%
+300
+210
+149
+105 +74
-74
AV
E
Size fraction (micron)
Figure 6. Cleaner scavenger copper size bysize recovery.
+300
+210
+149
+105 +74
-74
AV
E
0102030405060708090
100
Go
ld r
eco
very
%
+300
+210
+149
+105 +74
-74
AV
E
Size fraction (microns)
Figure 7. Cleaner scavenger gold size by sizerecovery.
page 7
Jameson Cell and mechanical cell comparisons
Table 1 details key comparisons between the Jameson and mechanical cleaner scavenger circuits.As previously discussed the major justification for replacement of the mechanical cleaner scavenger was tocreate sufficient area for the replacement of the main roughers and scavengers. The Jameson Cell cleanerscavenger circuit achieved equivalent metallurgical performance, operating with eight percent of footprint areaand 9.4% of the residence time of the mechanical circuit.
Power consumed by the Jameson Cell circuit at 197.8kW is half of the previous circuit. This is slightly abovethe anticipated power (Garcia, 1993), however the more stable operation produced has reduced thecleaner/recleaner power from its original consumption of 150kW, (Garcia, Sevilliano, Smith, 1995) to112.7kW (Malicse, 1996), a fall of 37.3kW.
Orifice plate usage had initially been predicted at two sets of ceramic per year. The initial steel orifice plates,with an anticipated life of two months remained in service for nine months and the first set of ceramic orificeplates have been in use for 24 months.
Table 1. Comparison of Jameson and mechanical cell cleaner scavengers.
Comparison Jameson Cells Mechanical Cells
Power consumption - kW 198 393
Foot print area - sq metres 30 375
Residence time - minutes 2.9 30
CLEANER CIRCUIT UPDATE
The commissioning of the Jameson cleaner and recleaner cells have been discussed elsewhere (Harbort et al,1993; Harbort, Sevilliano, Chui, 1994) and this paper presents an update on operation, since commissioningin 1993.
Froth formation
The first Jameson Cells installed at Philex were generally very well accepted by operators. One initialoperational difficulty was the difference in froth formation between the Jameson Cells and thecolumn/mechanical cells they replaced. The Jameson Cell cleaner and recleaner produce a fine froth, typicallywith bubble diameters no more than 5mm at the overflow lip. The replaced column by comparison hadbubbles of 25mm diameter at the overflow lip. Operators often interpreted the small bubble size as meaninglow grade concentrate, when this was not the case. Usual action was to first decrease the air rate to“improve” grade. As found by Atkinson and Espinosa-Gomez (1992) reduction of the air within a JamesonCell causes an increase in vacuum within the downcomer and typically causes bubble size to get smaller.Visually, reducing air rates made the froth appear even “lower grade”. The next action was to increase washwater to “improve” grade. This produced a “wetter”, faster flowing froth, again interpreted as loweringgrade, when in fact the opposite occurred.
page 8
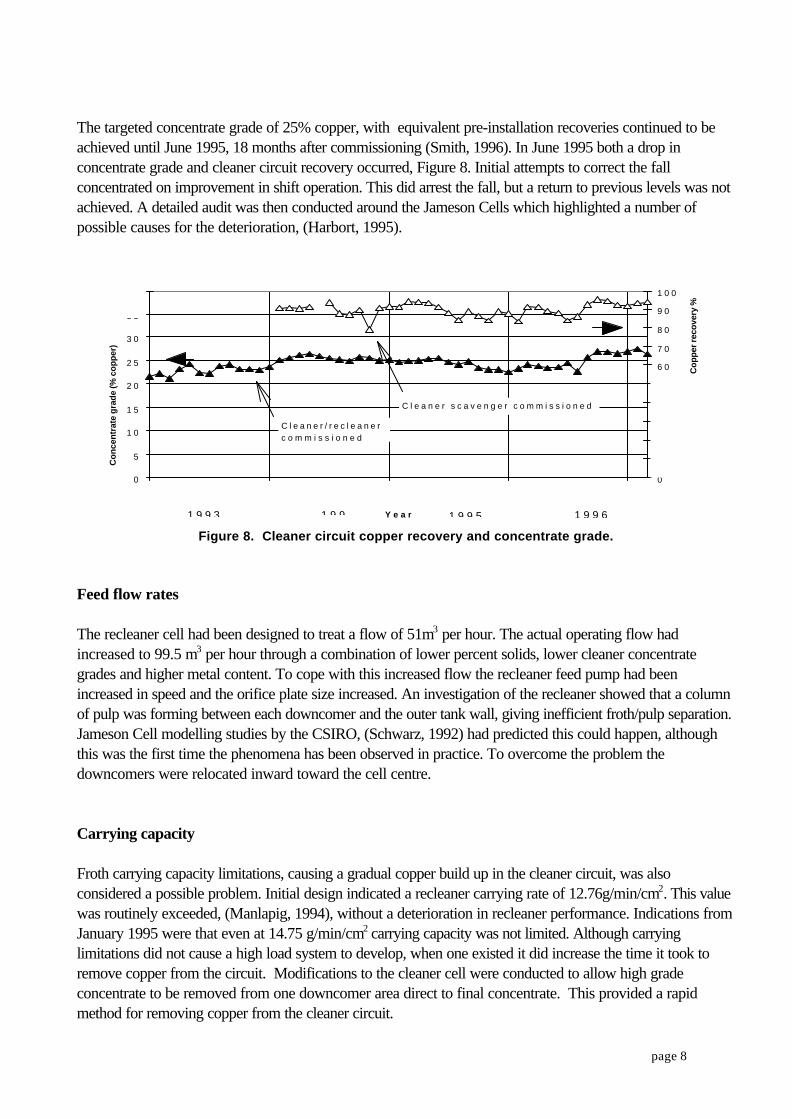
The targeted concentrate grade of 25% copper, with equivalent pre-installation recoveries continued to beachieved until June 1995, 18 months after commissioning (Smith, 1996). In June 1995 both a drop inconcentrate grade and cleaner circuit recovery occurred, Figure 8. Initial attempts to correct the fallconcentrated on improvement in shift operation. This did arrest the fall, but a return to previous levels was notachieved. A detailed audit was then conducted around the Jameson Cells which highlighted a number ofpossible causes for the deterioration, (Harbort, 1995).
0
5
1 0
1 5
2 0
2 5
3 0
3 5
4 0
Y e a r
Co
nce
ntr
ate
gra
de
(% c
op
per
)
0
1 0
2 0
3 0
4 0
5 0
6 0
7 0
8 0
9 0
1 0 0
Cop
per
reco
very
%
1 9 9 3 1 9 9 1 9 9 5 1 9 9 6
C l e a n e r / r e c l e a n e r c o m m i s s i o n e d
C l e a n e r s c a v e n g e r c o m m i s s i o n e d
Figure 8. Cleaner circuit copper recovery and concentrate grade.
Feed flow rates
The recleaner cell had been designed to treat a flow of 51m3 per hour. The actual operating flow hadincreased to 99.5 m3 per hour through a combination of lower percent solids, lower cleaner concentrategrades and higher metal content. To cope with this increased flow the recleaner feed pump had beenincreased in speed and the orifice plate size increased. An investigation of the recleaner showed that a columnof pulp was forming between each downcomer and the outer tank wall, giving inefficient froth/pulp separation.Jameson Cell modelling studies by the CSIRO, (Schwarz, 1992) had predicted this could happen, althoughthis was the first time the phenomena has been observed in practice. To overcome the problem thedowncomers were relocated inward toward the cell centre.
Carrying capacity
Froth carrying capacity limitations, causing a gradual copper build up in the cleaner circuit, was alsoconsidered a possible problem. Initial design indicated a recleaner carrying rate of 12.76g/min/cm2. This valuewas routinely exceeded, (Manlapig, 1994), without a deterioration in recleaner performance. Indications fromJanuary 1995 were that even at 14.75 g/min/cm2 carrying capacity was not limited. Although carryinglimitations did not cause a high load system to develop, when one existed it did increase the time it took toremove copper from the circuit. Modifications to the cleaner cell were conducted to allow high gradeconcentrate to be removed from one downcomer area direct to final concentrate. This provided a rapidmethod for removing copper from the cleaner circuit.
page 9
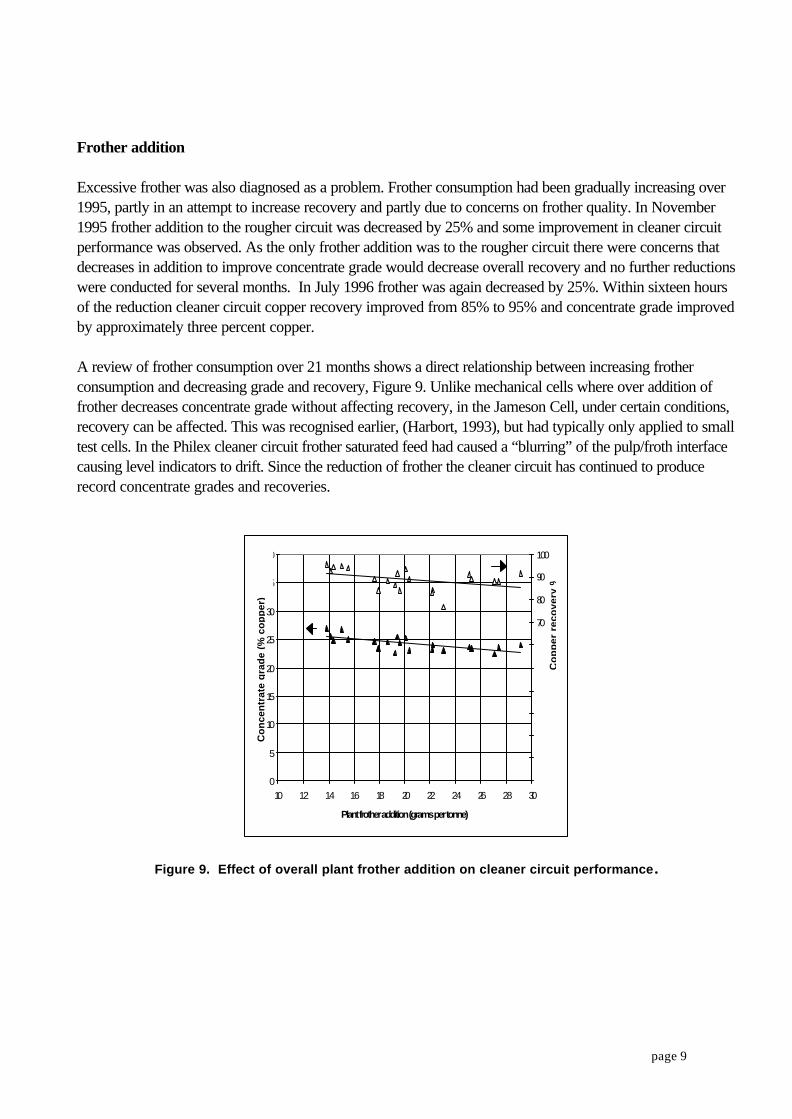
Frother addition
Excessive frother was also diagnosed as a problem. Frother consumption had been gradually increasing over1995, partly in an attempt to increase recovery and partly due to concerns on frother quality. In November1995 frother addition to the rougher circuit was decreased by 25% and some improvement in cleaner circuitperformance was observed. As the only frother addition was to the rougher circuit there were concerns thatdecreases in addition to improve concentrate grade would decrease overall recovery and no further reductionswere conducted for several months. In July 1996 frother was again decreased by 25%. Within sixteen hoursof the reduction cleaner circuit copper recovery improved from 85% to 95% and concentrate grade improvedby approximately three percent copper.
A review of frother consumption over 21 months shows a direct relationship between increasing frotherconsumption and decreasing grade and recovery, Figure 9. Unlike mechanical cells where over addition offrother decreases concentrate grade without affecting recovery, in the Jameson Cell, under certain conditions,recovery can be affected. This was recognised earlier, (Harbort, 1993), but had typically only applied to smalltest cells. In the Philex cleaner circuit frother saturated feed had caused a “blurring” of the pulp/froth interfacecausing level indicators to drift. Since the reduction of frother the cleaner circuit has continued to producerecord concentrate grades and recoveries.
0
5
10
15
20
25
30
35
40
10 12 14 16 18 20 22 24 26 28 30
Plant frother addition (grams per tonne)
Co
nce
ntr
ate
gra
de
(% c
op
per
)
0
10
20
30
40
50
60
70
80
90
100
Co
pp
er r
eco
very
%
Figure 9. Effect of overall plant frother addition on cleaner circuit performance.
page 10
ROUGHER/SCAVENGER INSTALLATION
Design considerations
Where the cleaner scavenger cell required alteration to an existing design, the rougher scavenger JamesonCells required a new design. Criteria for design included:
• ability to handle coarse feed
• sizing to incorporate space limitations
• efficient feed distribution to downcomers
• operator acceptance
The Philex concentrator operated with three parallel lines of rougher/scavengers and it was a site preferencethat the Jameson Cell installation would follow this layout. A number of installation options were reviewed.
1. Six by five metre diameter Jameson Cells ( three for roughing/three for scavenging). This option failedthe design criteria in terms of footprint area, lip length and froth travel distance, (Table 2).
2. Twelve by 3.5 metre diameter cells. There was operator resistance to this option in that circular cellswere considered largely suitable for cleaning but it was felt that rougher/ scavengers should be rectangular.
3. Twelve by R3330/8 cells. Rectangular Jameson Cells had been operated at Newlands Coal Pty Ltd oncoal fines, (Jameson, Goffinet, Hughes, 1991) and at the Philippine Smelting and Refining Corporation oncopper slag scavenging, (Dawson, Harbort, 1996). However, these cells had operated at less than 20tphper cell, compared to the Philex requirement of 200tph per cell. Significant design work on rectangularcells for roughing duties had been done in 1993 Manlapig and this was further developed for the design ofthe R3330/8 model Jameson Cell for use at Philex.
Table 2. Jameson rougher/scavenger design criteria.
Model Lip length/area ratio
cm/cm2
Maximum froth travel
distance (mm)
Operator
acceptance
5000/16 0.96 1000 medium
3500/8 1.46 625 medium
R3330/8 1.33 550 high
Target >1.0 < 750 high
page 11
Design changes
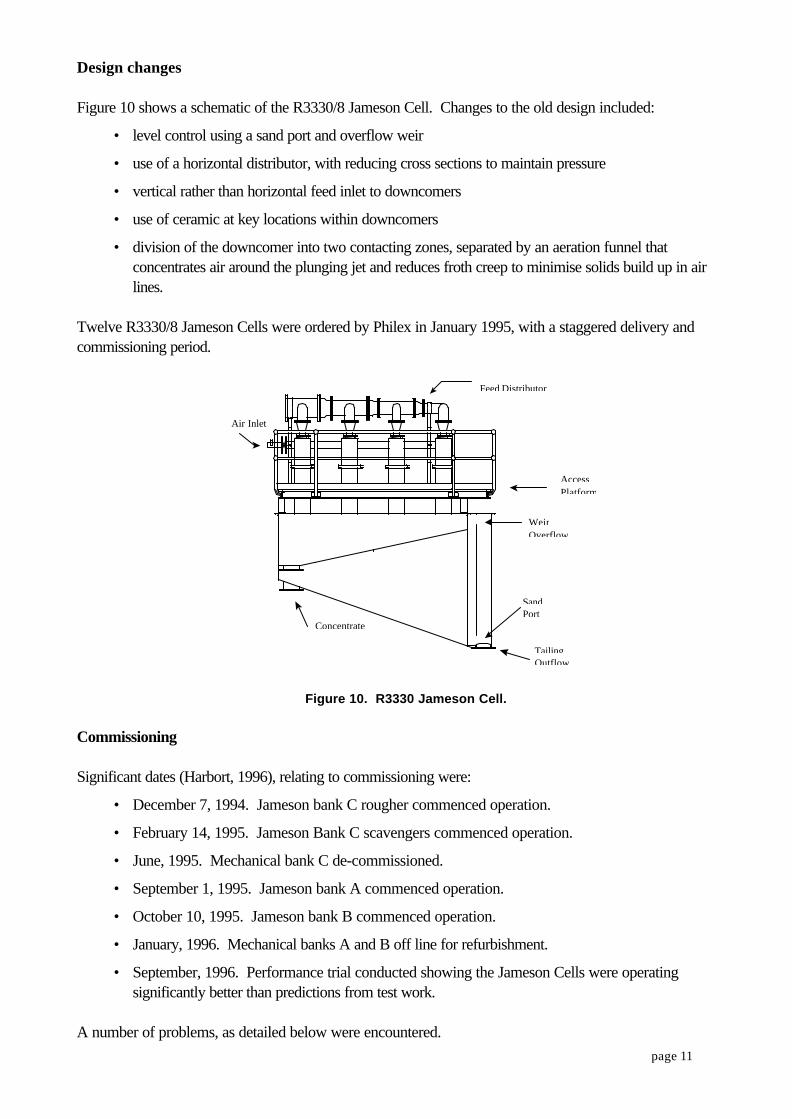
Figure 10 shows a schematic of the R3330/8 Jameson Cell. Changes to the old design included:
• level control using a sand port and overflow weir
• use of a horizontal distributor, with reducing cross sections to maintain pressure
• vertical rather than horizontal feed inlet to downcomers
• use of ceramic at key locations within downcomers
• division of the downcomer into two contacting zones, separated by an aeration funnel thatconcentrates air around the plunging jet and reduces froth creep to minimise solids build up in airlines.
Twelve R3330/8 Jameson Cells were ordered by Philex in January 1995, with a staggered delivery andcommissioning period.
WeirOverflow
SandPort
TailingOutflow
Concentrate
Feed Distributor
AccessPlatform
Air Inlet
Figure 10. R3330 Jameson Cell.
Commissioning
Significant dates (Harbort, 1996), relating to commissioning were:
• December 7, 1994. Jameson bank C rougher commenced operation.
• February 14, 1995. Jameson Bank C scavengers commenced operation.
• June, 1995. Mechanical bank C de-commissioned.
• September 1, 1995. Jameson bank A commenced operation.
• October 10, 1995. Jameson bank B commenced operation.
• January, 1996. Mechanical banks A and B off line for refurbishment.
• September, 1996. Performance trial conducted showing the Jameson Cells were operatingsignificantly better than predictions from test work.
A number of problems, as detailed below were encountered.
page 12
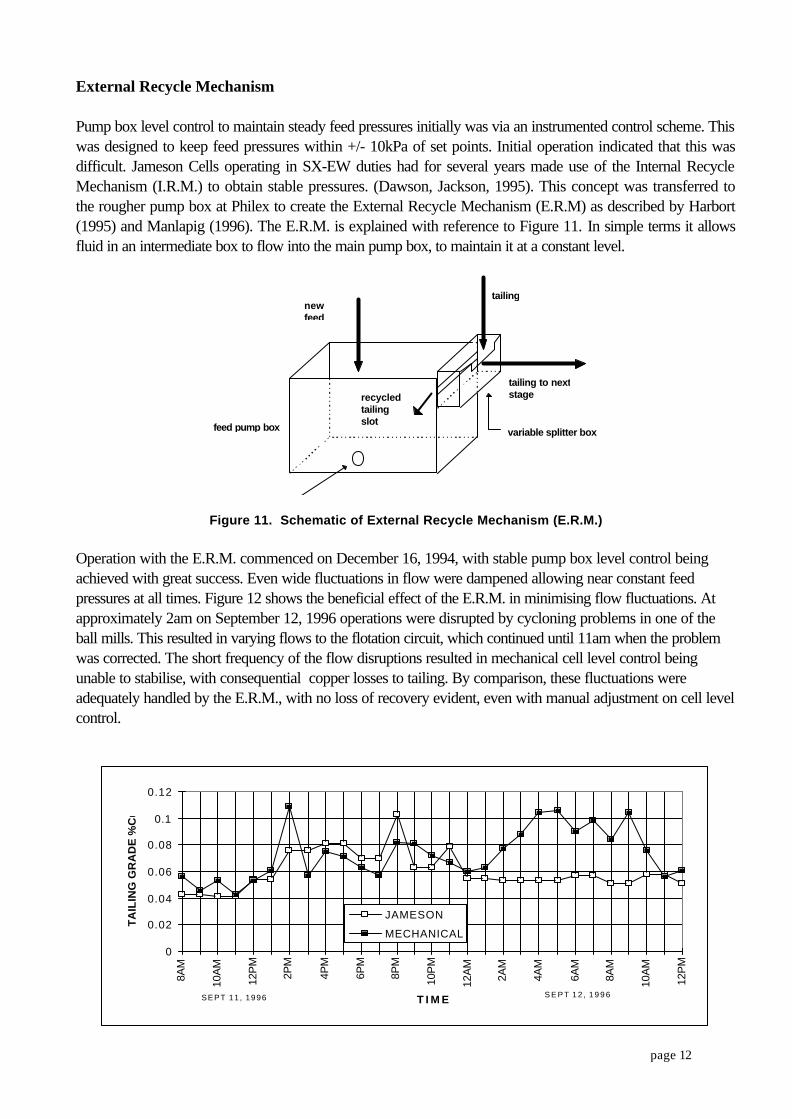
External Recycle Mechanism
Pump box level control to maintain steady feed pressures initially was via an instrumented control scheme. Thiswas designed to keep feed pressures within +/- 10kPa of set points. Initial operation indicated that this wasdifficult. Jameson Cells operating in SX-EW duties had for several years made use of the Internal RecycleMechanism (I.R.M.) to obtain stable pressures. (Dawson, Jackson, 1995). This concept was transferred tothe rougher pump box at Philex to create the External Recycle Mechanism (E.R.M) as described by Harbort(1995) and Manlapig (1996). The E.R.M. is explained with reference to Figure 11. In simple terms it allowsfluid in an intermediate box to flow into the main pump box, to maintain it at a constant level.
tailing to nextstage
variable splitter box
newfeed
feed pump box
tailing
recycledtailingslot
Figure 11. Schematic of External Recycle Mechanism (E.R.M.)
Operation with the E.R.M. commenced on December 16, 1994, with stable pump box level control beingachieved with great success. Even wide fluctuations in flow were dampened allowing near constant feedpressures at all times. Figure 12 shows the beneficial effect of the E.R.M. in minimising flow fluctuations. Atapproximately 2am on September 12, 1996 operations were disrupted by cycloning problems in one of theball mills. This resulted in varying flows to the flotation circuit, which continued until 11am when the problemwas corrected. The short frequency of the flow disruptions resulted in mechanical cell level control beingunable to stabilise, with consequential copper losses to tailing. By comparison, these fluctuations wereadequately handled by the E.R.M., with no loss of recovery evident, even with manual adjustment on cell levelcontrol.
0
0.02
0.04
0.06
0.08
0.1
0.12
8AM
10A
M
12P
M
2PM
4PM
6PM
8PM
10P
M
12A
M
2AM
4AM
6AM
8AM
10A
M
12P
M
T I M E
TA
ILIN
G G
RA
DE
%C
u
JAMESON
MECHANICAL
SEPT 11 , 1996 S E P T 1 2 , 1 9 9 6
page 13
Figure 12. Minimisation of circuit disruptions with the E.R.M.Froth formation
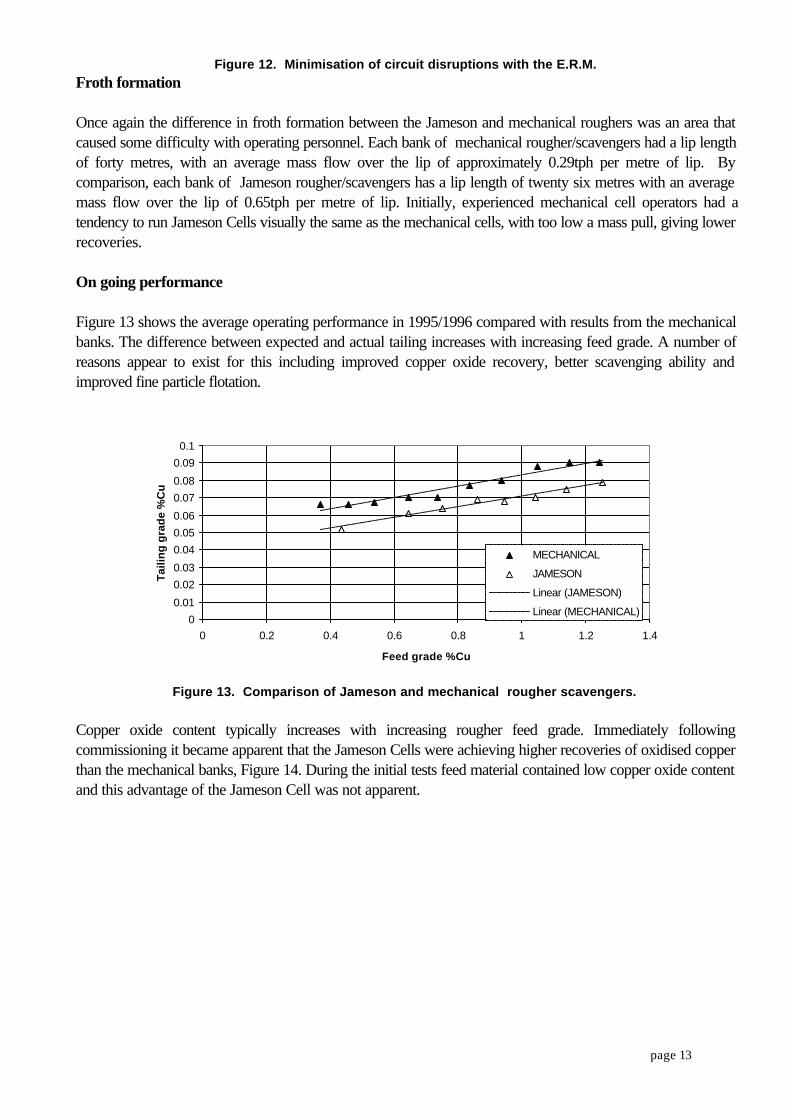
Once again the difference in froth formation between the Jameson and mechanical roughers was an area thatcaused some difficulty with operating personnel. Each bank of mechanical rougher/scavengers had a lip lengthof forty metres, with an average mass flow over the lip of approximately 0.29tph per metre of lip. Bycomparison, each bank of Jameson rougher/scavengers has a lip length of twenty six metres with an averagemass flow over the lip of 0.65tph per metre of lip. Initially, experienced mechanical cell operators had atendency to run Jameson Cells visually the same as the mechanical cells, with too low a mass pull, giving lowerrecoveries.
On going performance
Figure 13 shows the average operating performance in 1995/1996 compared with results from the mechanicalbanks. The difference between expected and actual tailing increases with increasing feed grade. A number ofreasons appear to exist for this including improved copper oxide recovery, better scavenging ability andimproved fine particle flotation.
0
0.01
0.02
0.03
0.04
0.05
0.06
0.07
0.08
0.09
0.1
0 0.2 0.4 0.6 0.8 1 1.2 1.4
Feed grade %Cu
Tai
ling
gra
de
%C
u
MECHANICAL
JAMESON
Linear (JAMESON)
Linear (MECHANICAL)
Figure 13. Comparison of Jameson and mechanical rougher scavengers.
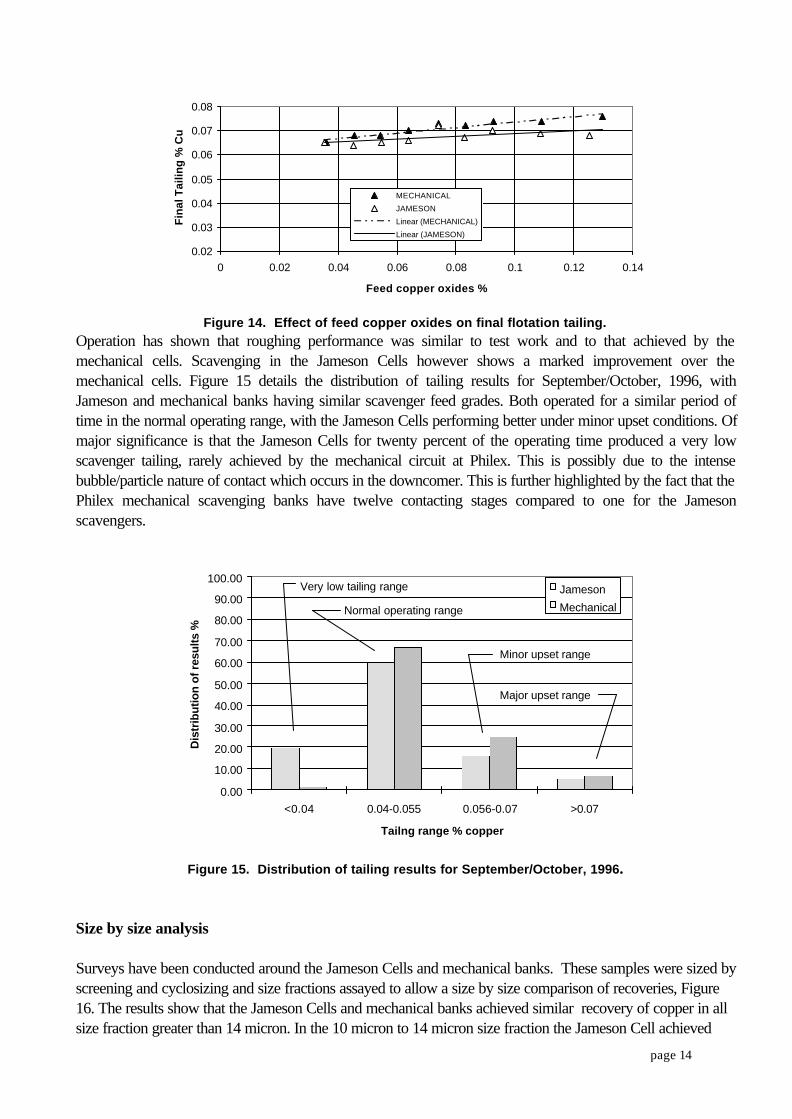
Copper oxide content typically increases with increasing rougher feed grade. Immediately followingcommissioning it became apparent that the Jameson Cells were achieving higher recoveries of oxidised copperthan the mechanical banks, Figure 14. During the initial tests feed material contained low copper oxide contentand this advantage of the Jameson Cell was not apparent.
page 14
0.02
0.03
0.04
0.05
0.06
0.07
0.08
0 0.02 0.04 0.06 0.08 0.1 0.12 0.14
Feed copper oxides %
Fin
al T
ailin
g %
Cu
MECHANICAL
JAMESON
Linear (MECHANICAL)
Linear (JAMESON)
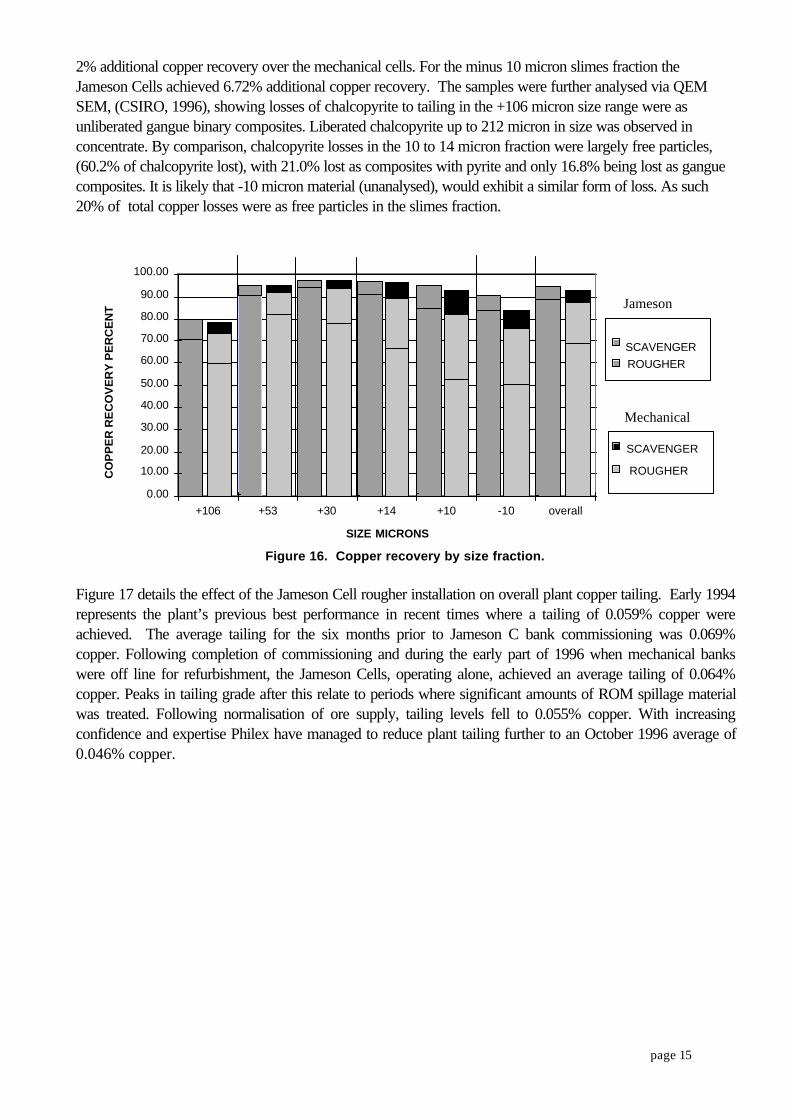
Figure 14. Effect of feed copper oxides on final flotation tailing.Operation has shown that roughing performance was similar to test work and to that achieved by themechanical cells. Scavenging in the Jameson Cells however shows a marked improvement over themechanical cells. Figure 15 details the distribution of tailing results for September/October, 1996, withJameson and mechanical banks having similar scavenger feed grades. Both operated for a similar period oftime in the normal operating range, with the Jameson Cells performing better under minor upset conditions. Ofmajor significance is that the Jameson Cells for twenty percent of the operating time produced a very lowscavenger tailing, rarely achieved by the mechanical circuit at Philex. This is possibly due to the intensebubble/particle nature of contact which occurs in the downcomer. This is further highlighted by the fact that thePhilex mechanical scavenging banks have twelve contacting stages compared to one for the Jamesonscavengers.
0.00
10.00
20.00
30.00
40.00
50.00
60.00
70.00
80.00
90.00
100.00
<0.04 0.04-0.055 0.056-0.07 >0.07
Tailng range % copper
Dis
trib
utio
n of
res
ults
%
Jameson
Mechanical
Very low tailing range
Normal operating range
Minor upset range
Major upset range
Figure 15. Distribution of tailing results for September/October, 1996.
Size by size analysis
Surveys have been conducted around the Jameson Cells and mechanical banks. These samples were sized byscreening and cyclosizing and size fractions assayed to allow a size by size comparison of recoveries, Figure16. The results show that the Jameson Cells and mechanical banks achieved similar recovery of copper in allsize fraction greater than 14 micron. In the 10 micron to 14 micron size fraction the Jameson Cell achieved
page 15
2% additional copper recovery over the mechanical cells. For the minus 10 micron slimes fraction theJameson Cells achieved 6.72% additional copper recovery. The samples were further analysed via QEMSEM, (CSIRO, 1996), showing losses of chalcopyrite to tailing in the +106 micron size range were asunliberated gangue binary composites. Liberated chalcopyrite up to 212 micron in size was observed inconcentrate. By comparison, chalcopyrite losses in the 10 to 14 micron fraction were largely free particles,(60.2% of chalcopyrite lost), with 21.0% lost as composites with pyrite and only 16.8% being lost as ganguecomposites. It is likely that -10 micron material (unanalysed), would exhibit a similar form of loss. As such20% of total copper losses were as free particles in the slimes fraction.
0.00
10.00
20.00
30.00
40.00
50.00
60.00
70.00
80.00
90.00
100.00
+106 +53 +30 +14 +10 -10 overall
SIZE MICRONS
CO
PP
ER
RE
CO
VE
RY
PE
RC
EN
T
SCAVENGER
ROUGHER
SCAVENGERROUGHER
Jameson
Mechanical
Figure 16. Copper recovery by size fraction.
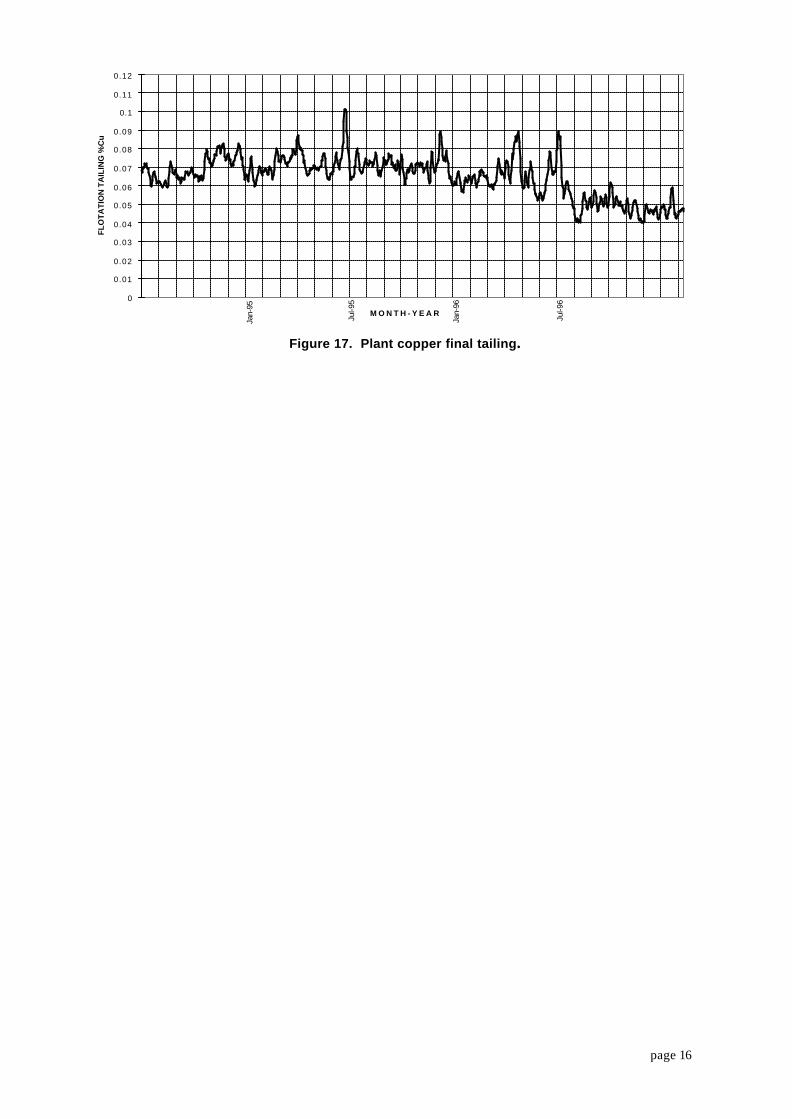
Figure 17 details the effect of the Jameson Cell rougher installation on overall plant copper tailing. Early 1994represents the plant’s previous best performance in recent times where a tailing of 0.059% copper wereachieved. The average tailing for the six months prior to Jameson C bank commissioning was 0.069%copper. Following completion of commissioning and during the early part of 1996 when mechanical bankswere off line for refurbishment, the Jameson Cells, operating alone, achieved an average tailing of 0.064%copper. Peaks in tailing grade after this relate to periods where significant amounts of ROM spillage materialwas treated. Following normalisation of ore supply, tailing levels fell to 0.055% copper. With increasingconfidence and expertise Philex have managed to reduce plant tailing further to an October 1996 average of0.046% copper.
page 16
0
0.01
0.02
0.03
0.04
0.05
0.06
0.07
0.08
0.09
0.1
0.11
0.12
M O N T H - Y E A R
FL
OT
AT
ION
TA
ILIN
G %
Cu
Jan-
95
Jul-9
5
Jan-
96
Jul-9
6
Figure 17. Plant copper final tailing.
page 17
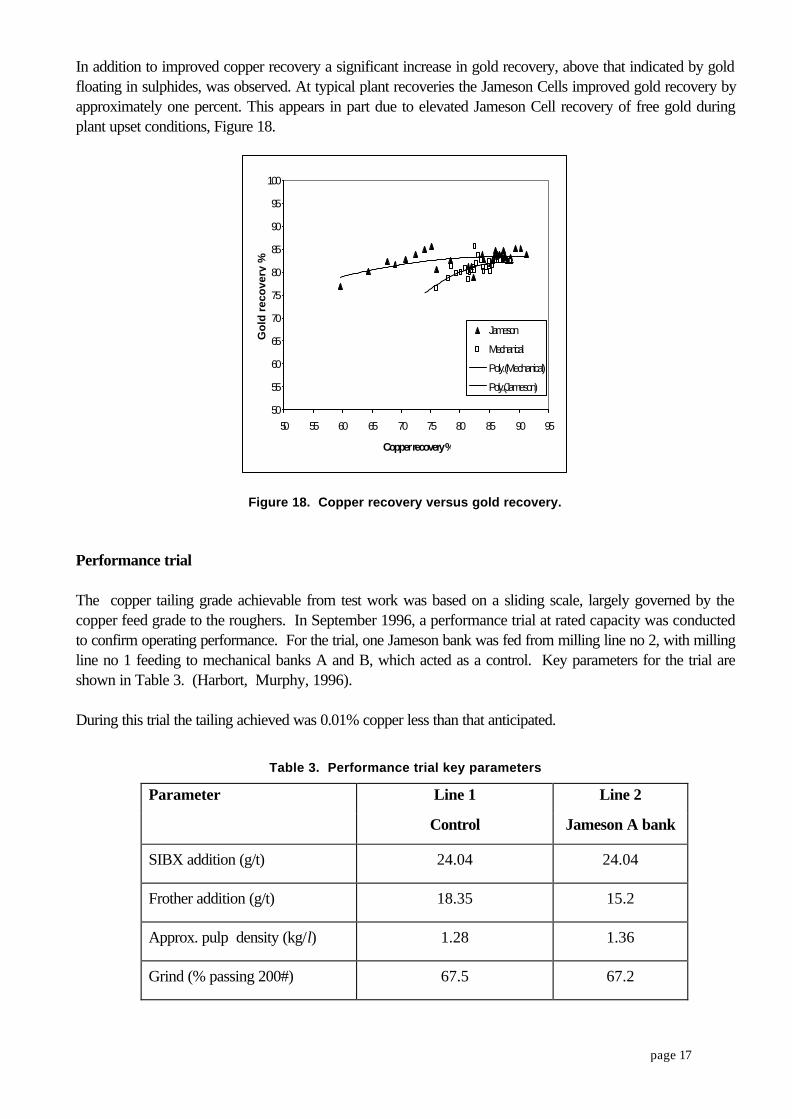
In addition to improved copper recovery a significant increase in gold recovery, above that indicated by goldfloating in sulphides, was observed. At typical plant recoveries the Jameson Cells improved gold recovery byapproximately one percent. This appears in part due to elevated Jameson Cell recovery of free gold duringplant upset conditions, Figure 18.
50
55
60
65
70
75
80
85
90
95
100
50 55 60 65 70 75 80 85 90 95
Copper recovery %
Go
ld r
eco
very
%
Jameson
Mechanical
Poly. (Mechanical)
Poly. (Jameson)
Figure 18. Copper recovery versus gold recovery.
Performance trial
The copper tailing grade achievable from test work was based on a sliding scale, largely governed by thecopper feed grade to the roughers. In September 1996, a performance trial at rated capacity was conductedto confirm operating performance. For the trial, one Jameson bank was fed from milling line no 2, with millingline no 1 feeding to mechanical banks A and B, which acted as a control. Key parameters for the trial areshown in Table 3. (Harbort, Murphy, 1996).
During this trial the tailing achieved was 0.01% copper less than that anticipated.
Table 3. Performance trial key parameters
Parameter Line 1 Line 2
Control Jameson A bank
SIBX addition (g/t) 24.04 24.04
Frother addition (g/t) 18.35 15.2
Approx. pulp density (kg/l) 1.28 1.36
Grind (% passing 200#) 67.5 67.2
page 18
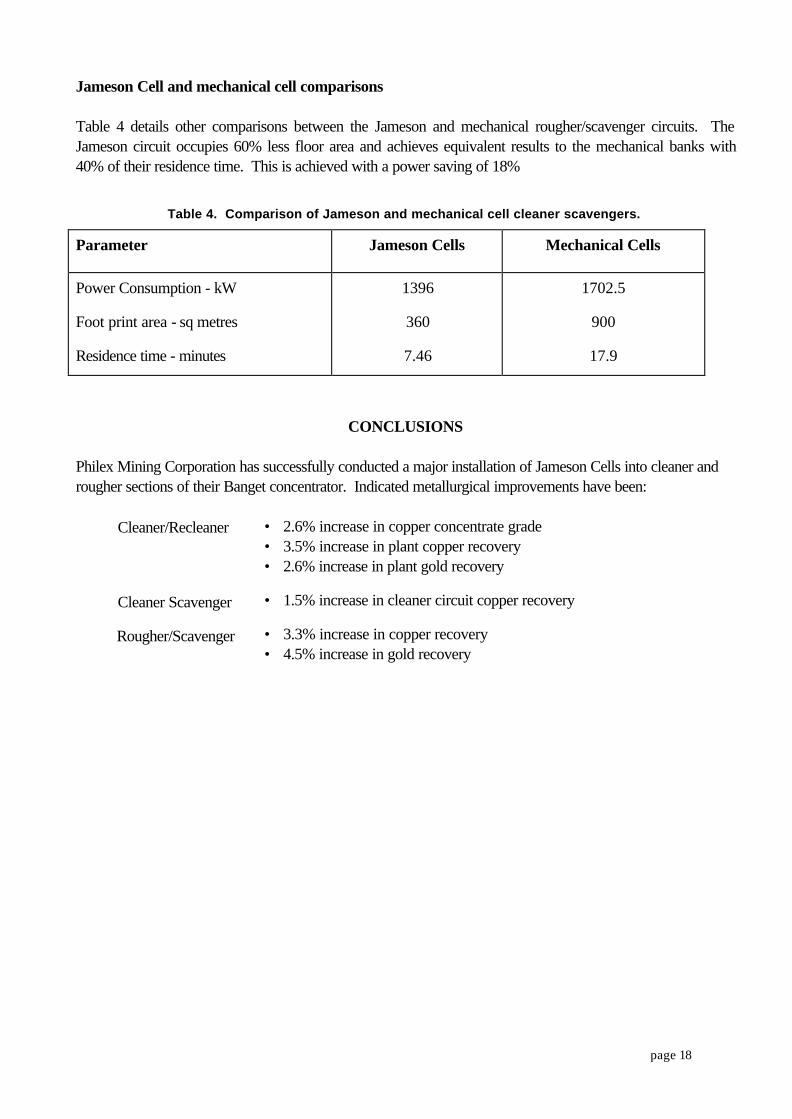
Jameson Cell and mechanical cell comparisons
Table 4 details other comparisons between the Jameson and mechanical rougher/scavenger circuits. TheJameson circuit occupies 60% less floor area and achieves equivalent results to the mechanical banks with40% of their residence time. This is achieved with a power saving of 18%
Table 4. Comparison of Jameson and mechanical cell cleaner scavengers.
Parameter Jameson Cells Mechanical Cells
Power Consumption - kW 1396 1702.5
Foot print area - sq metres 360 900
Residence time - minutes 7.46 17.9
CONCLUSIONS
Philex Mining Corporation has successfully conducted a major installation of Jameson Cells into cleaner androugher sections of their Banget concentrator. Indicated metallurgical improvements have been:
• 2.6% increase in copper concentrate grade• 3.5% increase in plant copper recovery• 2.6% increase in plant gold recovery
• 1.5% increase in cleaner circuit copper recovery
• 3.3% increase in copper recovery• 4.5% increase in gold recovery
Cleaner/Recleaner
Cleaner Scavenger
Rougher/Scavenger
page 19
REFERENCES
Atkinson, B W, Espinosa-Gomez, R, 1992. The Jameson Cell - Effects of downcomer length, feed pressureand air-pulp ratio. University of Newcastle report issued to Mount Isa Mines Limited.
CSIRO, 1996. Philex Concentrator - Jameson Cell rougher and scavenger circuit analysis. CSIRO Divisionof Minerals report issued to MIM Holdings Limited.
Dawson, W J, Harbort, G J, 1996. Jameson Cell recovery of copper from smelter slags, in Proceedings ofthe SAIMM Hidden Wealth conference, 2 - 4 October, 1996.
Dawson, W J, Jackson, B R, 1995. Evolution of Jameson Cells for solvent extraction applications, in CopperHydrometallurgy Forum, Sept 18-19, 1995.(ALTA:Melbourne)
Evans, G M, Atkinson, BW, Jameson, G J, 1995. The Jameson Cell, in Flotation Science andEngineering (Ed:KA Matis), pp 331 - 363, Marcel Dekker, NY, 1995.
Garcia, T F, 1993. Economic benefits that can be derived from the operation of Jameson Cells at BangetConcentrator. Philex Mining Corporation internal report.
Garcia, T F, Sevilliano II, A C S, Smith, G A L, 1995. Economic benefit studies on the various Jameson Cellinstallations. Philex Mining Corporation internal report.
Harbort, G J, 1992. Pilot plant test work at Philex Mining Corporation. MTM report no JC45A/9209,issued to Philex Mining Corporation.
Harbort, G J, 1993. Companion guide to Jameson Cell operating software. MIM Holdings Limited generalrelease.
Harbort, G J, 1994. Commissioning of middling circuit Jameson Cell at Philex Mining Corporation. MTMreport no IS113\9411, issued to Philex Mining Corporation.
Harbort, G J, 1995a. External recycle mechanism for pump box level control. MIM Holdings Limitedinternal report.
Harbort, G J, 1995b. Flotation Circuit Review. ML Consultants report issued to Philex Mining Corporation.
Harbort G J, 1996. Commissioning of roughers and scavengers at Philex Mining Corporation. MTM reportno IS133A/9601 issued to Philex Mining Corporation.
Harbort, G J, Jackson, B R, Jameson G J, Malicse, TB, Sevilliano II, A C S, 1993. Jameson Flotation CellOperation at Philex Mining Corporation, paper presented at PSEM Symposium on Metallurgy, Manilla,November, 1993.
Harbort, GJ, Murphy, AS, 1996. Capacity and performance trial of Jameson Cell roughers and scavengersat Philex Mining Corporation. MIM Holdings Limited report no IS113A/9609 issued to Philex MiningCorporation.
page 20
Harbort G J, Sevilliano II, A C S, Chui, A V, 1994. Optimisation of the Philex Mining CorporationConcentrator with the Jameson Cell, in Proceedings of the AusIMM Fifth Mill Operators Conference, pp 37-42, (The Australasian Institute of Mining and Metallurgy: Melbourne)
Jameson, G J, , Goffinet, M, Hughes, D, 1991. Operating experiences with Jameson Cell at Newlands CoalPty Ltd, in Proceedings of the Fifth Coal Preparation Conference, pp 146-159, (The Coal PreparationSociety)
Jameson, G J, Manlapig, E V, 1991. Applications of the Jameson Flotation Cell, in Column ’91 -Proceedings of an international conference on column flotation (Eds Agar, Huls and Hyma).
Manlapig, E V, 1993. Jameson Cell - 2nd Generation flotation cell. MIM Holdings Limited internal report.
Manlapig, E V, 1994. Analysis of Jameson Cell performance - Philex cleaner/ recleaner. MIM HoldingsLimited internal report.Manlapig, E V, 1996. Scale model testing of pump box and launder (ERM Box). MIM Technologiesinternal report.
Schwarz, M P, 1992. Hydrodynamic simulation of the pulp zone of the Jameson Flotation Cell: Parametricstudies. CSIRO report REP722 issued to MIM Holdings Limited.
Smith, G A L, 1995. Personal communication - November.

page 21