Embed Size (px)
Citation preview

Fiscal policy has a significant role in creating an equitable distribution of income and wealth in society. Particularly, better fiscal management helps mobilize domestic savings and increase the efficiency of resource allocation. Consequently, it paves the way for achieving macroeconomic stability along with promoting more sustainable and inclusive growth.
Historically, whenever Pakistan’s economy has witnessed higher growth, it was unsustainable because it created macroeconomic imbalances. The growth was largely driven by consumption-led spending as opposed to investment. The non-productive nature of this growth caused higher external and fiscal imbalances. Consequently, it has seriously undermined the growth prospects. Furthermore, structural weaknesses like weak tax administration, a difficult business environment, low tax to GDP ratio and insufficient resources further aggravated the situation.
In 2018, the economy was at a critical juncture due to rising debt and liabilities, high current account and fiscal deficit, depleting foreign exchange reserves and circular debt. In particular, persistently high fiscal deficit due to income-expenditure mismatch resulted in an unsustainable level of public debt, which in turn, became the major source of macroeconomic imbalance. In the wake of these challenges, the government introduced adjustment and demand management policies to ensure economic and financial stability and to improve the growth prospects. Similarly, Pakistan entered into 39-months Extended Fund Facility with IMF for the $ 6.0 billion to support the government’s reform program.
These measures helped in handling macroeconomic imbalances, particularly, the constraints on the fiscal side were put on the path of fiscal discipline and fiscal consolidation. During the first nine months of the current fiscal year, all major fiscal indicators have witnessed a marked improvement owing to government’s stringent fiscal strategy to improve the revenues through comprehensive tax measures and administrative reforms along with expenditure rationalization. The persistence of these measures would be supportive in addressing a large primary deficit to ensure debt sustainability over the medium term. Further, with the promulgation of the Public Finance Management Act 2019, budgetary management is being strengthened and it will encourage fiscal discipline and transparency, going forward.
During the first nine months of the current fiscal year, the performances of fiscal indicators suggest that fiscal consolidation is on track. Overall fiscal deficit reduced to 4.0 percent of GDP against 5.1 percent of GDP recorded in the same period last year while primary balance posted a surplus of Rs 194 billion during July-March, FY2020 against the deficit of Rs 463 billion during the comparable period of FY2019. Total revenues grew by 30.9
FISCAL DEVELOPMENT
Chapter 4

Pakistan Economic Survey 2019-20
68
percent during July-March, FY2020 against 0.04 percent growth during the same period of FY2019, on account of a substantial rise in both tax and non-tax revenues. Similarly, on the expenditure side, PSDP spending witnessed a significant rise both at federal and provincial levels. Overall PSDP expenditure grew by 24.9 percent during July-March, FY2020 over the previous year.
However, the outbreak of Coronavirus (COVID-19) has negatively affected the near-term outlook. It has brought significant challenges for the economy by squeezing the economic gains achieved during the ongoing fiscal year. In particular, fiscal accounts are expected to come under tremendous pressure.
On one hand, the Government is focused on increasing the expenditures on public health and strengthening social safety net programs, while on the other, it intends to mitigate the impact of the COVID-19 on the economy. In doing so, the budget will therefore temporarily deviate from initial targets. On the revenue side, achieving targets of both tax and non-tax would be challenging owing to disruption in economic activity, manifested through both demand and supply shocks. The budget deficit is expected to exceed the target set for FY2020.
Nevertheless, the Government has acted in a timely and well-calibrated manner to lessen the detrimental effects of COVID-19. It has taken appropriate measures to support the economy through fiscal and monetary policies. On the fiscal side, a comprehensive fiscal stimulus package has been initiated in order to accommodate the expenditures required to mitigate the impact of the COVID-19 shock. The package has created stress on fiscal flows, however, the impact may become severe if the pandemic lasts for a longer time period. State Bank of Pakistan has responded timely through appropriate monetary policy response. The measures have been aimed at a reduction in the policy rate and introduction of various ways to improve the liquidity of, particularly small-scale businesses. It has introduced various other temporary and time- bound actions which will ensure monetary stability and functionality of the financial system in the wake of COVID-19 crisis.
In order to meet the financing requirement for these expenditures, additional resources have also been mobilized through various international financial institutions including IMF, World Bank, ADB etc. The government is constantly monitoring the situation in the country and accordingly additional measures are being deployed to meet the emerging requirements.
Box-I: Impact of COVID-19 on Public Finances
The COVID-19 pandemic has not only caused severe damage to human lives but it has also taken a toll on global economic activity. Various necessary safety measures have brought much of the global economic activity to a halt. IMF has projected the global economy to contract sharply by –3 percent in 2020, much worse than during the 2008–09 financial crises. With the decline in global output, revenues are expected to reduce even more sharply.
To date, various policy measures have been taken worldwide in this regard to mitigate the health and economic effect of the COVID-19 outbreak. However, in response to these measures, fiscal balances in 2020 are expected to deteriorate significantly in almost all countries, particularly, a substantial widening is expected in the United States, China and several European and Asian economies. While for Pakistan, the fiscal deficit is projected to increase by 9.2 percent of GDP in 2020.

By increasing expenditures on monitoring, containment and mitigation, countries are allocating more fiscal resources to the health sector. Moreover, to lessen the economic impact of COVID-19, countries are providing additional fiscal resources to other sectors of the economy. On the expenditure side, measures include extended unemployment benefits, governmentleave, wage subsidies, targeted transfers to affected households and firms, and support to hardas tourism, hospitality services, and travel. On the revenue side, measures include temporary deferral of corporate and personal income tax payments and social security contributions ranging from three months to one year, as well as temporary tax relief or exemptions, including on medical goods and services, for affected sectors and vulnerable firms and households.
In order to finance these additional fiscal measures, governments strategy around the world includes reprioritizing budget items; using emergency funds or buffers; frontloading existing spending plans, external aid or grants and undertaking additional borrowing.
Source: Fiscal Monitor - April 2020. IMF
Fiscal Performance (July-June,
A brief review of major fiscal indicators durioverall fiscal deficit increased torevenue collection and a significant rise in current expenditures. Earlier, higher level of fiscal deficit was recorded at 8.8 percent in FY2012 followed by 8.2 percent in FY2013.
Total revenues remained below the revised target of 14.5 percent of GDP and stood at percent of GDP during FY2019. Although both tax and nonsignificant decline, however, nonagainst 2.2 percent of GDP recorded in the preceding year. The declinelargely stemmed from a sharp reduction in SBP profit and mark&others). On the other hand, nonand oil, discount retained on crude oil and other levies owing to increase in rupee value of crude oil. However, a sharp decline in revenues from both SBP profit and markothers) offset the impact of an increase in collection within energy
Total tax revenue collection stood at recorded at 10.1 percent of GDPprimarily attributed to decline in of the withholding tax on mobile phone topcompression and reduced rate on salary income.
On the expenditure side, despite a sharp decline in development spending, a significant rise in current expenditure kept total expenditures at a higher level. and net lending reduced from FY2019. With the increase of stood at 22.0 percent of GDP
Fiscal Development
By increasing expenditures on monitoring, containment and mitigation, countries are allocating more fiscal resources to the health sector. Moreover, to lessen the
countries are providing iscal resources to other sectors of the economy.
expenditure side, measures include extended unemployment benefits, government-funded paid sick leave, wage subsidies, targeted transfers to affected households and firms, and support to hard-hit sectors such as tourism, hospitality services, and travel. On the revenue side, measures include temporary deferral of corporate and personal income tax payments and social security contributions ranging from three months to one year, as
elief or exemptions, including on medical goods and services, for affected sectors and
In order to finance these additional fiscal measures, governments strategy around the world includes emergency funds or buffers; frontloading existing spending plans, external
aid or grants and undertaking additional borrowing.
June, FY2019)
A brief review of major fiscal indicators during FY2019 indicate a sharp deterioration as increased to 9.1 percent of GDP owing to the unprecedented decline in
significant rise in current expenditures. Earlier, cit was recorded at 8.8 percent in FY2012 followed by 8.2 percent
Total revenues remained below the revised target of 14.5 percent of GDP and stood at during FY2019. Although both tax and non-tax revenues recorded a
ant decline, however, non-tax revenues reduced substantially to 1.1 percent of GDP recorded in the preceding year. The decline in non
sharp reduction in SBP profit and mark-up payments (PSE ers). On the other hand, non-tax revenues witnessed higher growth in royalties on gas
and oil, discount retained on crude oil and other levies owing to increase in rupee value of crude oil. However, a sharp decline in revenues from both SBP profit and markothers) offset the impact of an increase in collection within energy-related components.
collection stood at 11.8 percent of GDP, of which, FBR tax collection percent of GDP during FY2019. The slowdown in tax c
primarily attributed to decline in the sales tax rate on major petroleum products, suspension of the withholding tax on mobile phone top-ups, decline in PSDP expenditures, import compression and reduced rate on salary income.
re side, despite a sharp decline in development spending, a significant rise in current expenditure kept total expenditures at a higher level. Development expenditures
reduced from 4.7 percent of GDP in FY2018 to 3.2 percent of GDPWith the increase of 18.7 percent of GDP in current expenditures, total spending
percent of GDP during FY2019. Consequently, with widening revenue
-15.4
-9.2
-5.5-8.3 -9.5
-7.1-8.3
-11.8-
US
A
Fra
nce
Ger
man
y
Italy
Spa
in
Japa
n
U.K
Can
ada
Fig: 4.1-General Government Overall Balance (% of GDP)
Source: Fiscal Monitor, April.2020.
Fiscal Development
69
In order to finance these additional fiscal measures, governments strategy around the world includes emergency funds or buffers; frontloading existing spending plans, external
ng FY2019 indicate a sharp deterioration as unprecedented decline in
significant rise in current expenditures. Earlier, a significantly cit was recorded at 8.8 percent in FY2012 followed by 8.2 percent
Total revenues remained below the revised target of 14.5 percent of GDP and stood at 12.9 tax revenues recorded a
to 1.1 percent of GDP in non-tax revenue
up payments (PSE tax revenues witnessed higher growth in royalties on gas
and oil, discount retained on crude oil and other levies owing to increase in rupee value of crude oil. However, a sharp decline in revenues from both SBP profit and mark-up (PSE &
related components.
of which, FBR tax collection during FY2019. The slowdown in tax collection was sales tax rate on major petroleum products, suspension
ups, decline in PSDP expenditures, import
re side, despite a sharp decline in development spending, a significant rise Development expenditures
3.2 percent of GDP in in current expenditures, total spending
during FY2019. Consequently, with widening revenue-
11.8-11.2
-7.4
-12.6
-9.2
Chi
na
Indi
a
Sau
di A
rabi
a
Pak
ista
n
General Government Overall Balance (% of GDP)
Source: Fiscal Monitor, April.2020.

Pakistan Economic Survey 2019-20
70
expenditure gap, fiscal deficit reached 9.1 percent of GDP during FY2019 against 6.5 percent of GDP recorded in FY2018.
Table: 4.1 Fiscal Indicators as Percent of GDP
Year Overall Fiscal Deficit
Expenditure Revenue Total Current Development/1 Total Tax Non-
Tax FY2008 7.3 21.4 17.4 4.0 14.1 9.9 4.2 FY2009 5.2 19.2 15.5 3.5 14.0 9.1 4.9 FY2010 6.2 20.2 16.0 4.4 14.0 9.9 4.1 FY2011 6.5 18.9 15.9 2.8 12.3 9.3 3.0 FY2012 8.8 21.6 17.3 3.9 12.8 10.2 2.6 FY2013 8.2 21.5 16.4 5.1 13.3 9.8 3.5 FY2014 5.5 20.0 15.9 4.9 14.5 10.2 4.3 FY2015 5.3 19.6 16.1 4.2 14.3 11.0 3.3 FY2016 4.6 19.9 16.1 4.5 15.3 12.6 2.7 FY2017 5.8 21.3 16.3 5.3 15.5 12.4 3.0 FY2018 6.5 21.6 16.9 4.7 15.1 12.9 2.2 FY2019* 9.1 22.0 18.7 3.2 12.9 11.8 1.1 FY2020 B.E 7.5 24.4 20.5 3.9 16.9 14.6 2.3 /1 including net lending, * on the basis of revised GDP numbers, B.E: Budget Estimates Source: Budget Wing. Ministry of Finance
Similarly, the fiscal year 2019 witnessed a deterioration in primary and revenue balances which highlighted growing debt pressure and limited fiscal space for critical development expenditures. During FY2019, primary balance posted a deficit of Rs 1,353.8 billion (-3.6 % of GDP) against the deficit of Rs 760.5 billion (-2.2 % of GDP) in FY2018. Likewise, revenue deficit stood at Rs 2,203.3 billion (-5.8% of GDP) in FY2019 against the deficit of Rs 626.3 billion (-1.8% of GDP) in FY2018.
According to provincial fiscal operations, all the four provinces posted a combined surplus of Rs 190.0 billion in FY2019 against the deficit of Rs 17.5 billion in FY2018. However, Punjab generated a significantly higher surplus of Rs 122.3 billion followed by Sindh (Rs 42.1 billion).
0.0
6.0
12.0
18.0
24.0
30.0
FY
2008
FY
2009
FY
2010
FY
2011
FY
2012
FY
2013
FY
2014
FY
2015
FY
2016
FY
2017
FY
2018
FY
2019
FY
2020
Fig:4.2- Revenue-Expenditure Gap (% of GDP)
Revenues
Fiscal Deficit
Expenditures
Fiscal Development
71
Review of Public Expenditures
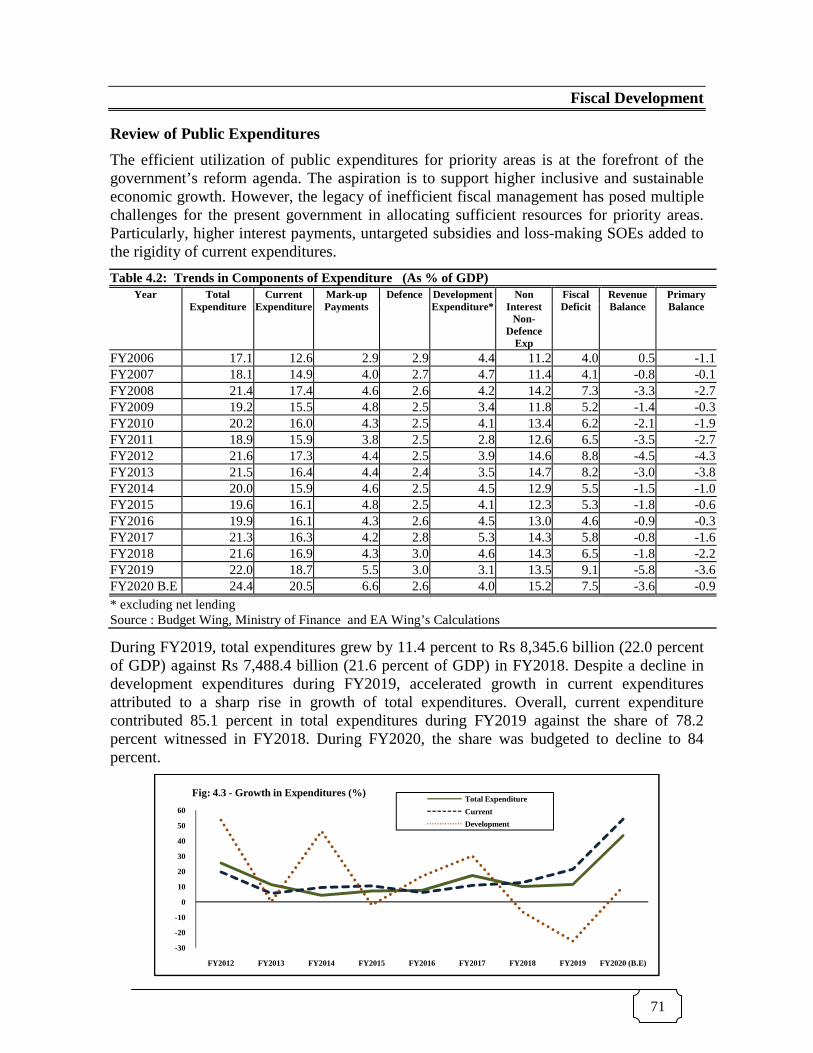
The efficient utilization of public expenditures for priority areas is at the forefront of the government’s reform agenda. The aspiration is to support higher inclusive and sustainable economic growth. However, the legacy of inefficient fiscal management has posed multiple challenges for the present government in allocating sufficient resources for priority areas. Particularly, higher interest payments, untargeted subsidies and loss-making SOEs added to the rigidity of current expenditures.
Table 4.2: Trends in Components of Expenditure (As % of GDP) Year Total
Expenditure Current
Expenditure Mark-up Payments
Defence
Development Expenditure*
Non Interest
Non-Defence
Exp
Fiscal Deficit
Revenue Balance
Primary Balance
FY2006 17.1 12.6 2.9 2.9 4.4 11.2 4.0 0.5 -1.1 FY2007 18.1 14.9 4.0 2.7 4.7 11.4 4.1 -0.8 -0.1 FY2008 21.4 17.4 4.6 2.6 4.2 14.2 7.3 -3.3 -2.7 FY2009 19.2 15.5 4.8 2.5 3.4 11.8 5.2 -1.4 -0.3 FY2010 20.2 16.0 4.3 2.5 4.1 13.4 6.2 -2.1 -1.9 FY2011 18.9 15.9 3.8 2.5 2.8 12.6 6.5 -3.5 -2.7 FY2012 21.6 17.3 4.4 2.5 3.9 14.6 8.8 -4.5 -4.3 FY2013 21.5 16.4 4.4 2.4 3.5 14.7 8.2 -3.0 -3.8 FY2014 20.0 15.9 4.6 2.5 4.5 12.9 5.5 -1.5 -1.0 FY2015 19.6 16.1 4.8 2.5 4.1 12.3 5.3 -1.8 -0.6 FY2016 19.9 16.1 4.3 2.6 4.5 13.0 4.6 -0.9 -0.3 FY2017 21.3 16.3 4.2 2.8 5.3 14.3 5.8 -0.8 -1.6 FY2018 21.6 16.9 4.3 3.0 4.6 14.3 6.5 -1.8 -2.2 FY2019 22.0 18.7 5.5 3.0 3.1 13.5 9.1 -5.8 -3.6 FY2020 B.E 24.4 20.5 6.6 2.6 4.0 15.2 7.5 -3.6 -0.9 * excluding net lending Source : Budget Wing, Ministry of Finance and EA Wing’s Calculations
During FY2019, total expenditures grew by 11.4 percent to Rs 8,345.6 billion (22.0 percent of GDP) against Rs 7,488.4 billion (21.6 percent of GDP) in FY2018. Despite a decline in development expenditures during FY2019, accelerated growth in current expenditures attributed to a sharp rise in growth of total expenditures. Overall, current expenditure contributed 85.1 percent in total expenditures during FY2019 against the share of 78.2 percent witnessed in FY2018. During FY2020, the share was budgeted to decline to 84 percent.
-30
-20
-10
0
10
20
30
40
50
60
FY2012 FY2013 FY2014 FY2015 FY2016 FY2017 FY2018 FY2019 FY2020 (B.E)
Fig: 4.3 - Growth in Expenditures (%)Total Expenditure
Current
Development

Pakistan Economic Survey 2019
72
Current expenditures grew by 21.3 percent to FY2019 against Rs 5,854.3 billion (16.9 percent of GDP) in FY2018. Major contribution in current expenditures came from higher markowing to a rise in domestic interest rates. In absolute termFY2019 against Rs 1499.9 billion during FY2018. Share of markcurrent expenditures increased to 25.1 and 29.4 percent, respectively during FY2019 against 20.0 percent and 25.6 percent, respectively in FY2018.
Another major component within current expenditures is defence related expenditure which grew by 11.3 percent to Rs 1,146.8 billion in FY2019 against Defence expenditures contributed 13.7 and 16.1 percent share in total and current expenditures, respectively, inrespectively during FY2018.
Regarding current subsidies, it has witnessed a sharp rise in FY2019 in both absolute and growth terms. It increased from FY2019, thus grew by 71.1 percent. Its contribution within current expenditures increased to 2.7 percent in FY2019 from 2.0 percent recorded in FY2018. was largely attributed to higher energy
Within current expenditures, other components also recorded For instance, Superannuation Allowances & pension (17.7 percent), Grants (other than Provinces) (15.2 percent), Other General PSafety affairs (37.6 percent), Economic affairs (24.7 percent) and Social protection (18.4 percent).
Contrary to the rise in current expenditures, development expenditures and net lending reduced by 24.8 percent to stand at The decline was largely attributed toand provincial level. PSDP spending stood at Rs 1,456.2 billion, thus reduced by 30.8 percent. Federal PSDP declined to
17.3 16.4 15.9
3.93.5 4.5
21.6 21.520.0
FY2012 FY2013 FY2014
Current Expenditure
Pakistan Economic Survey 2019-20
Current expenditures grew by 21.3 percent to Rs 7,104 billion (18.7 percent of GDP) 5,854.3 billion (16.9 percent of GDP) in FY2018. Major contribution in
current expenditures came from higher mark-up payments which grew by 39.4 percent rise in domestic interest rates. In absolute term, it increased to Rs 2
1499.9 billion during FY2018. Share of mark-up payments in total and current expenditures increased to 25.1 and 29.4 percent, respectively during FY2019 against
and 25.6 percent, respectively in FY2018.
r major component within current expenditures is defence related expenditure which 1,146.8 billion in FY2019 against Rs 1,030.4 billion in FY2018.
Defence expenditures contributed 13.7 and 16.1 percent share in total and current in FY2019 against the share of 13.8 and 17.6 percent,
Regarding current subsidies, it has witnessed a sharp rise in FY2019 in both absolute and growth terms. It increased from Rs 114.2 billion in FY2018 to Rs 195.3 billion during FY2019, thus grew by 71.1 percent. Its contribution within current expenditures increased to 2.7 percent in FY2019 from 2.0 percent recorded in FY2018. A significant rise
largely attributed to higher energy-related subsidies due to power generation.
Within current expenditures, other components also recorded a sharp rise during FY2019.For instance, Superannuation Allowances & pension (17.7 percent), Grants (other than Provinces) (15.2 percent), Other General Public Services (45.9 percent), Public Orders and Safety affairs (37.6 percent), Economic affairs (24.7 percent) and Social protection (18.4
rise in current expenditures, development expenditures and net lending ercent to stand at Rs 1,219.2 billion against Rs 1,621.7 billion in FY2018.
The decline was largely attributed to a sharp reduction in PSDP spending both at and provincial level. PSDP spending stood at Rs 1,008.2 billion in FY2019 against
,456.2 billion, thus reduced by 30.8 percent. Federal PSDP declined to Rs
15.9 16.1 16.1 16.3 16.9 18.7
4.5 4.1 4.5 5.3 4.6 3.1
20.0 19.6 19.921.3 21.6 22.0
FY2014 FY2015 FY2016 FY2017 FY2018 FY2019 FY2020
Fig:4.4- Expenditures % of GDP
Current Expenditure Development Expenditure Total Expenditure
percent of GDP) in 5,854.3 billion (16.9 percent of GDP) in FY2018. Major contribution in
grew by 39.4 percent 2,091 billion in
up payments in total and current expenditures increased to 25.1 and 29.4 percent, respectively during FY2019 against
r major component within current expenditures is defence related expenditure which 1,030.4 billion in FY2018.
Defence expenditures contributed 13.7 and 16.1 percent share in total and current against the share of 13.8 and 17.6 percent,
Regarding current subsidies, it has witnessed a sharp rise in FY2019 in both absolute and 195.3 billion during
FY2019, thus grew by 71.1 percent. Its contribution within current expenditures increased to A significant rise in subsidy
ated subsidies due to power generation.
sharp rise during FY2019. For instance, Superannuation Allowances & pension (17.7 percent), Grants (other than
ublic Services (45.9 percent), Public Orders and Safety affairs (37.6 percent), Economic affairs (24.7 percent) and Social protection (18.4
rise in current expenditures, development expenditures and net lending 1,621.7 billion in FY2018.
sharp reduction in PSDP spending both at the federal 1,008.2 billion in FY2019 against
Rs 502.1 billion
20.5
4.0
24.4
FY2020 (B.E)
Total Expenditure
(Net excluding development grants to provinces), while provincial stood at during FY2019 against Rs 576.1 billion and
Structure of Tax Revenues
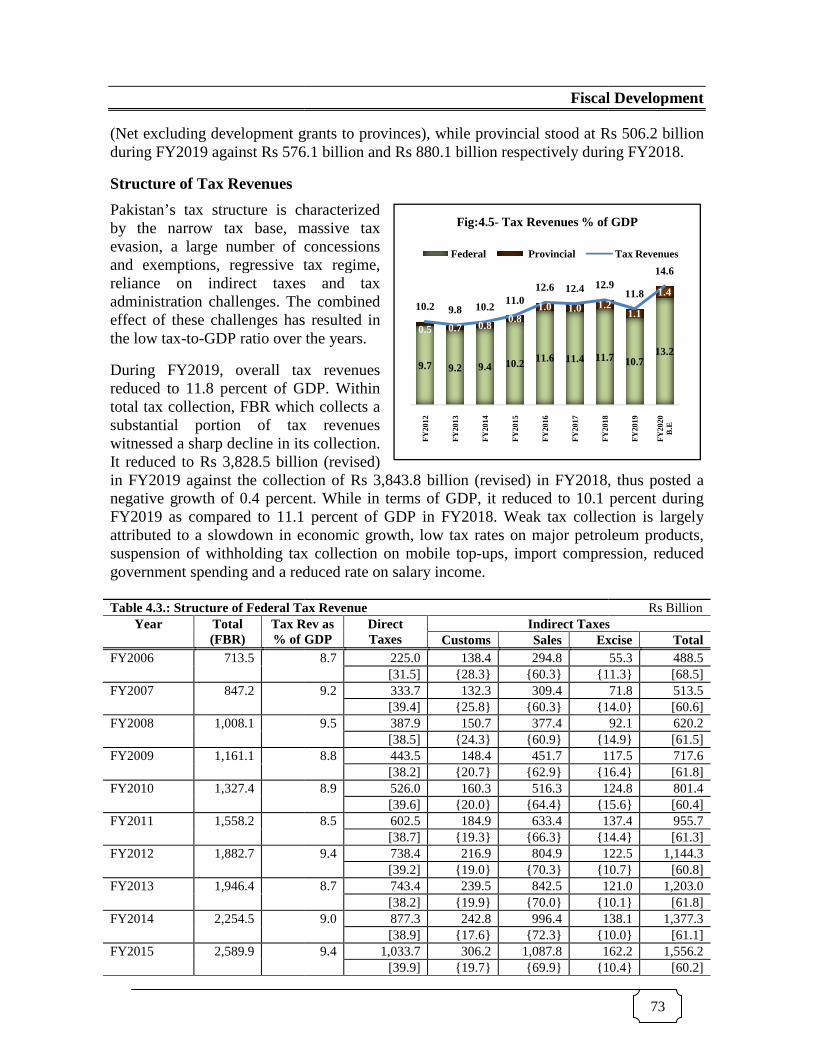
Pakistan’s tax structure is characterizedby the narrow tax base, massive tax evasion, a large number of concessions and exemptions, regressive tax regime, reliance on indirect taxes and tax administration challenges. The combined effect of these challenges has the low tax-to-GDP ratio over the years.
During FY2019, overall tax revenues reduced to 11.8 percent of GDP. Within total tax collection, FBR which collects a substantial portion of tax revenues witnessed a sharp decline in its collection. It reduced to Rs 3,828.5 billion (revised) in FY2019 against the collection of negative growth of 0.4 percent. While in terms of GDP, it reduced to FY2019 as compared to 11.1 percent of GDP in FY2018. Weak tax collection is largely attributed to a slowdown in economic growth, low tax rates on major petroleum products, suspension of withholding tax collection on mobile topgovernment spending and a reduced rate on salary income.
Table 4.3.: Structure of Federal Tax RevenueYear Total
(FBR) Tax Rev as % of GDP
FY2006 713.5
FY2007 847.2
FY2008 1,008.1
FY2009 1,161.1
FY2010 1,327.4
FY2011 1,558.2
FY2012 1,882.7
FY2013 1,946.4
FY2014 2,254.5
FY2015 2,589.9
Fiscal Development
excluding development grants to provinces), while provincial stood at Rs 576.1 billion and Rs 880.1 billion respectively during FY2018.
characterized by the narrow tax base, massive tax evasion, a large number of concessions
regressive tax regime, reliance on indirect taxes and tax
. The combined has resulted in
GDP ratio over the years.
During FY2019, overall tax revenues percent of GDP. Within
total tax collection, FBR which collects a substantial portion of tax revenues
nessed a sharp decline in its collection. 3,828.5 billion (revised)
in FY2019 against the collection of Rs 3,843.8 billion (revised) in FY2018, thus posted a negative growth of 0.4 percent. While in terms of GDP, it reduced to 10.1 FY2019 as compared to 11.1 percent of GDP in FY2018. Weak tax collection is largely
slowdown in economic growth, low tax rates on major petroleum products, suspension of withholding tax collection on mobile top-ups, import compressi
reduced rate on salary income.
Table 4.3.: Structure of Federal Tax Revenue Tax Rev as % of GDP
Direct Taxes
Indirect TaxesCustoms Sales Excise
8.7 225.0 138.4 294.8 [31.5] {28.3} {60.3} {11.3}
9.2 333.7 132.3 309.4 [39.4] {25.8} {60.3} {14.0}
9.5 387.9 150.7 377.4 [38.5] {24.3} {60.9} {14.9}
8.8 443.5 148.4 451.7 117.5[38.2] {20.7} {62.9} {16.4}
8.9 526.0 160.3 516.3 124.8[39.6] {20.0} {64.4} {15.6}
8.5 602.5 184.9 633.4 137.4[38.7] {19.3} {66.3} {14.4}
9.4 738.4 216.9 804.9 122.5[39.2] {19.0} {70.3} {10.7}
8.7 743.4 239.5 842.5 121.0[38.2] {19.9} {70.0} {10.1}
9.0 877.3 242.8 996.4 138.1[38.9] {17.6} {72.3} {10.0}
9.4 1,033.7 306.2 1,087.8 162.2[39.9] {19.7} {69.9} {10.4}
9.7 9.2 9.4 10.2 11.6 11.4 11.7
0.5 0.7 0.80.8
1.0 1.0 1.210.2 9.8 10.211.0
12.6 12.4 12.9
FY
2012
FY
2013
FY
2014
FY
2015
FY
2016
FY
2017
FY
2018
Fig:4.5- Tax Revenues % of GDP
Federal Provincial
Fiscal Development
73
Rs 506.2 billion ing FY2018.
billion (revised) in FY2018, thus posted a percent during
FY2019 as compared to 11.1 percent of GDP in FY2018. Weak tax collection is largely slowdown in economic growth, low tax rates on major petroleum products,
ups, import compression, reduced
Rs Billion Indirect Taxes
Excise Total 55.3 488.5
{11.3} [68.5] 71.8 513.5
{14.0} [60.6] 92.1 620.2
{14.9} [61.5] 117.5 717.6
{16.4} [61.8] 124.8 801.4
{15.6} [60.4] 137.4 955.7
{14.4} [61.3] 122.5 1,144.3
{10.7} [60.8] 121.0 1,203.0
{10.1} [61.8] 138.1 1,377.3
{10.0} [61.1] 162.2 1,556.2
{10.4} [60.2]
11.7 10.713.2
1.21.1
1.412.9
11.8
14.6
FY
2018
FY
2019
FY
2020
B
.E
Tax Revenues % of GDP
Tax Revenues

Pakistan Economic Survey 2019
74
Table 4.3.: Structure of Federal Tax RevenueYear Total
(FBR) Tax Rev as % of GDP
FY2016 3,112.7
FY2017 3,367.9
FY2018 3,843.8
FY2019 3,828.5
FY2020 BE
5,555.0
[]as % of total taxes, {} as % of indirect taxesSource: Federal Board of Revenue
Within FBR tax collection, direct taxes detax collection reduced by 1.8 percent owing to the sharp decline in the GST rate on Petroleum Products on both import and domestic stages, reduced GST on natural gas and import compression. However, customs duty and FED posted a healthy growth of 12.7 percent and 11.6 percent respectively.
In terms of share within total FBR tax collection, Sales tax remained the major revenue source with a higher contribution of 38.1 percent followed by the direct taxes with 37.8 percent. Similarly, the share of customs stood atotal FBR tax collection reached 6.2 percent during FY2019. It implies of Pakistan over the years still remains heavily dependent on indirect taxes.
Currently, the contribution of indirect tahas reduced from 68.5 percent in FY2006. On the other hand, the contribution of direct taxes has increased steadily over the years on account of various reforms/initiatives undertaken in the past like introduction of USAS, result of these initiatives, the emphasis has shifted to voluntary compliance, automation of entire business processes and reduction of corporate tax rates from29 percent in the tax year 2019.
Pakistan Economic Survey 2019-20
Table 4.3.: Structure of Federal Tax Revenue Tax Rev as % of GDP
Direct Taxes
Indirect TaxesCustoms Sales Excise
10.7 1,217.3 404.6 1,302.7 188.1[39.1] {21.3} {68.8} {9.9}
10.6 1,344.2 496.8 1,329.0 197.9[39.9] {24.5} {65.7} {9.8}
11.1 1,536.6 608.4 1,485.3 213.5[39.7] {26.4} {64.4} {9.3}
10.1 1,445.5 685.6 1,459.2 238.2[37.8] {28.8} {61.2} {10.0}
12.6
2,081.9 1,000.5 2,107.7 364.8[37.5] {28.8} {60.7} {10.5}
[]as % of total taxes, {} as % of indirect taxes
Within FBR tax collection, direct taxes declined by 5.9 percent in FY2019. Similarly, sales lection reduced by 1.8 percent owing to the sharp decline in the GST rate on
Petroleum Products on both import and domestic stages, reduced GST on natural gas and import compression. However, customs duty and FED posted a healthy growth of 12.7
11.6 percent respectively.
In terms of share within total FBR tax collection, Sales tax remained the major revenue higher contribution of 38.1 percent followed by the direct taxes with 37.8
share of customs stood at 17.9 percent while FED contribution in total FBR tax collection reached 6.2 percent during FY2019. It implies that theof Pakistan over the years still remains heavily dependent on indirect taxes.
Currently, the contribution of indirect taxes is 62.2 percent in total FBR tax collection which has reduced from 68.5 percent in FY2006. On the other hand, the contribution of direct taxes has increased steadily over the years on account of various reforms/initiatives undertaken in
ntroduction of USAS, the promulgation of Income Tax Ordinance, 2001. As a result of these initiatives, the emphasis has shifted to voluntary compliance, automation of entire business processes and reduction of corporate tax rates from a peak of 49 percent
tax year 2019.
Rs Billion Indirect Taxes
Excise Total 188.1 1,895.4 {9.9} [60.9] 197.9 2,023.7 {9.8} [60.1] 213.5 2,307.2 {9.3} [60.0] 238.2 2,383.0
{10.0} [62.2] 364.8 3,473.1
{10.5} [62.5]
Similarly, sales lection reduced by 1.8 percent owing to the sharp decline in the GST rate on
Petroleum Products on both import and domestic stages, reduced GST on natural gas and import compression. However, customs duty and FED posted a healthy growth of 12.7
In terms of share within total FBR tax collection, Sales tax remained the major revenue higher contribution of 38.1 percent followed by the direct taxes with 37.8
t 17.9 percent while FED contribution in the tax structure
xes is 62.2 percent in total FBR tax collection which has reduced from 68.5 percent in FY2006. On the other hand, the contribution of direct taxes has increased steadily over the years on account of various reforms/initiatives undertaken in
promulgation of Income Tax Ordinance, 2001. As a result of these initiatives, the emphasis has shifted to voluntary compliance, automation of
peak of 49 percent to

Fiscal Development
75
The share of sales tax has witnessed a gradual decline over the years due to shifting of services to the provincial governments like telecommunication, banking and insurance services which were the major source of revenue of sales tax. Similarly, the contribution of customs duty in total FBR collection has come down from 45.7 percent in FY1991 to around 18 percent in FY2019. The decline in share is attributed to a gradual decline in maximum statutory rates of customs duty from 125 percent in FY1988 to 20 percent in FY2020.
Historically, FED has been an important source of FBR revenues, however, it has witnessed a declining trend over the years and now it is limited to only a few commodities like cigarettes, cement, beverages, international travel etc. The contribution of FED in the total collection has dropped from 20 percent in FY1991 to 6 percent during FY2019.
The present government is focused on introducing a tax structure that is not only capable to generate sufficient revenues to meet government’s need, but also embodies fairness and equity in taxation, reduces the burden of high taxes that distorts economic incentives, improve tax enforcement and promotes efficient and responsive tax administration. In this regard, various reforms / special initiatives and steps have been envisioned by FBR, aligned with progress in the sectoral policies for the facilitation of taxpayers. These initiatives are intended to give fruitful results in the form of better revenue collection in line with efforts to facilitate the taxpayers for the best outcome (Box-II).
Box-II: Major Initiatives Taken by FBR
A. Automation of Business Processes For simplification/ automation of registration of sales tax and income tax, a mobile app has been launched for online registration. However, biometric verification has been outsourced to NADRA to avoid any contact between a tax collector and taxpayer. In addition, ‘Tax Assan’ App has also been launched which cater for filing of simple returns.
B. Income Tax Enforcement Measures
I. Withholding Taxes – Special WH Tax Management Plan
– Taxpayer Education/Awareness Outreach Initiative
– Focused & Risk Based WH Taxes Monitoring
II. Broadening of Tax Base (BTB) Initiatives i. Data obtained from DISCOs and Gas Companies for broadening of the tax base
– Data of more than 3.5 million industrial and commercial users gathered
– Informal letters issued to all such consumers for registration
– In the first phase notices to industrial consumers issued for registration
ii. To develop a 360-degree view of tax payers, data sources like banks, vehicles and real estate transactions have been captured and a Data Bank developed.
iii. Number of tax filers has reached to around 2.7 million, which is a record high in the history of FBR
Customs18%
Sales38%Excise
6%
Direct Tax38%
Fig:4.7- Share of Direct and Indirect Taxes in Total FBR Collection (FY2019)

Pakistan Economic Survey 2019-20
76
for the tax year 2018.
C. Registration of Persons for Sales tax Industrial and commercial data of DISCOs have been obtained which are being utilized for registration of those traders who have obtained commercial or industrial connections but are not registered for sales tax.
D. Sales Tax (Enforcement Measures) i. Point of Sales (POS): Development of a mobile app for customers to get cash back on Sales Invoices
ii. Track & Trace System for Specified Goods (i.e., Tobacco, Cement, Sugar, Beverages and Fertilizers)
iii. Establishment of Port Teams for Third Schedule items
iv. Joint Anti-smuggling field intelligence exercise
v. Inland Revenue Enforcement Network (IREN)
– Establishment of IREN to check smuggling and counterfeit products and counterfeit products in tobacco, electronics, Cosmetics and beverages.
Other Initiatives i. Plaza Mapping at Lahore, Karachi and Islamabad
ii. Launch of Device Identification, Registration and Blocking System (DIRBS) to control smuggling of mobile devices
iii. Discouraging imports of luxurious goods through additional Regulatory Duties (RDs)
iv. Forensic audit in Sugar, Tobacco and Steel Industries to address leakages and tax evasion and in these industries
Under Customs Implementation Plan, the following are the priority initiatives
i. More contribution / collection through realizing stuck-up revenue through administrative measures like Auctions, Recovery, litigation disposal etc
ii. Enhance Effectiveness of the Risk Management Process/ Establishment of National Targeting Centre to prevent loss of revenue through mis-declarations in values, quantities, & description
iii. Strengthening of Post Clearance Audit Organization and Function to ensure that consignments cleared through Green channel are scrutinized and possible evasions/short payments are recovered
iv. Design, Develop and Roll Out of WeBOC-global for ease of doing business and promote bonafide imports
Besides above listed steps / initiatives, the government has also launched a five year reform program by obtaining a loan from the World Bank which includes:
i. Transformation of Business Model
ii. Organizational capacity building by HR system improvement
iii. Simplification of laws and procedures
iv. Taxpayer facilitation through behavioral change
Source: Federal Board of Revenue (FBR)
Fiscal Performance (July-March, FY2020)
The fiscal performance during the first nine months of the current fiscal year has remained strong. With the continuous efforts to ensure fiscal discipline, the government has successfully reduced the fiscal deficit to 4.0 percent of GDP during July-March, FY2020 against the deficit of 5.1 percent in the comparable period of FY2019. Similarly, primary balance posted a surplus of Rs 193.5 billion (0.5 percent of GDP) during July-March,

Fiscal Development
77
FY2020 against the deficit of Rs 463.3 billion (-1.2 percent of GDP) last year. The improvement in the fiscal account is largely attributed to higher provincial surplus and a sharp rise in non-tax revenues. Overall, total revenues posted an impressive growth that outpaced the rise in expenditures.
Table 4.4: Consolidated Revenue & Expenditure of the Government FY2020 B.E July-March (Rs Billion) Growth
FY2020 FY2019 FY2020 A. Total Revenue 7,458.0 4,689.9 3,583.7 30.9 % of GDP 16.9 11.2 9.4 a) Tax Revenue 6,431.0 3,594.3 3,162.1 13.7 % of GDP 14.6 8.6 8.3 Federal 5,822.0 3,273.1 2,874.4 13.9 of which FBR Revenues 5,555.0 3,044.3 2,704.5 12.6 other Federal 267.0 228.8 169.9 34.7 Provincial Tax Revenue 609.0 321.2 287.7 11.6 b) Non-Tax Revenue 1,027.0 1,095.6 421.6 159.9 % of GDP 2.3 2.6 1.1 B. Total Expenditure 10,740.0 6,376.1 5,506.2 15.8 % of GDP 24.4 15.3 14.5 a) Current Expenditure 9,025.0 5,611.6 4,798.4 16.9 % of GDP 20.5 13.4 12.6 Federal 6,096.0 3,887.7 3,180.9 22.2 Mark-up Payments 2,891.0 1,879.7 1,459.2 28.8 % of GDP 6.6 4.5 3.8 Defence 1,153.0 802.4 774.7 3.6 % of GDP 2.6 1.9 2.0 Provincial 2,929.0 1,723.9 1,617.4 6.6 b) Development Expenditure & net lending
1,715.0 781.4 684.2 14.2
% of GDP 3.9 1.9 1.8 PSDP 1,662.0 722.5 578.5 24.9 Other Development 80.0 29.2 77.4 -62.2 c) Net Lending -27.0 29.7 28.3 4.9 e) Statistical discrepancy 0.0 -16.9 23.7 C. Overall Fiscal Deficit -3,282.0 -1,686.2 -1,922.5 -12.3 As % of GDP -7.5 -4.0* -5.1** Financing of Fiscal Deficit 3,282.0 1,686.2 1,922.5 -12.3 i) External Sources 1,829.0 682.4 524.5 30.1 ii) Domestic 1,453.0 1,003.8 1,398.0 -28.2 - Bank 484.0 601.8 787.7 -23.6 - Non-Bank 819.0 402.0 610.4 -34.1 Privatization Proceeds 150.0 0.0 0.0 GDP at Market Prices 44,003 41,727 37,972 9.9 *On the basis of provisional GDP **On the basis of revised GDP Source: Budget Wing, Finance Division
According to the consolidated fiscal operations, revenue collection grew by 30.9 percent during July-March, FY2020 in contrast with 0.04 percent growth in the same period of FY2019 despite a slowdown in economic activity and import compression. In absolute

Pakistan Economic Survey 2019-20
78
terms, total revenues stood at Rs 4,689.9 billion (11.2 percent of GDP) during July-March, FY2020 against Rs 3,583.7 billion (9.4 percent of GDP) in the same period of FY2019. Both tax and non-tax revenues have performed better in boosting overall revenue collection.
Tax revenues increased to Rs 3,594.3 billion during the first nine months of the current fiscal year against Rs 3,162.1 billion in the comparable period last year, posting a growth of 13.7 percent. Tax revenues picked up in response to various policy measures implemented at the start of FY 2020. Out of total tax collection, federal and provincial tax revenues increased by 13.9 percent and 11.6 percent respectively during July-March, FY2020. Within total federal tax collection, FBR accumulated Rs 3,044.3 billion (7.3 percent of GDP) during July-March, FY2020 against Rs 2,704.5 billion (7.1 percent of GDP) in the same period of FY2019, posting a growth of 12.6 percent.
Non-tax revenues witnessed a strong recovery during July-March, FY2020 against the decline of 16.7 percent in the comparable period of last year. In absolute term, it amounted to Rs 1,095.6 billion during July-March, FY2020 against Rs 421.6 billion in the same period of FY2019. The major source of this rebound was a substantial rise in receipt of outstanding telecom licenses renewal fees and SBP profit. The breakup shows that out of the total, Rs 635.5 billion were accumulated as SBP profit followed by Rs 113.2 billion from PTA profit, Rs 70.0 billion under mark-up (PSEs & others), Rs 65.6 billion from royalties on oil/gas and Rs 26.6 billion as a dividend.
On the expenditure side, total expenditures incurred during July-March, FY2020 grew by 15.8 percent to Rs 6,376.1 billion (15.3 percent of GDP) as compared with Rs 5,506.2 billion (14.5 percent of GDP) in the comparable period of FY2019. Within the total, current expenditure remained the major source of increase with 16.9 percent growth in nine months of the current fiscal year. In absolute terms, it increased to Rs 5,611.6 billion during July-March, FY2020 against Rs 4,798.4 billion in the comparable period of last year. The increase in current expenditure is primarily attributed to higher mark-up payments, grants for social spending and expenditures on social protection.
It is worth mentioning that there has been a substantial rise in the grants during the current fiscal year as these increased by more than 50 percent to stand at Rs 363.1 billion against Rs 227.1 billion in the comparable period last year. Higher social spending reveals the government’s commitment to improve the living standards of people apart from providing them with basic necessities of life.
On the other hand, the mark-up payments on both domestic and foreign debt consumed Rs 1,879.7 billion during July-March, FY2020 against Rs 1,459.2 billion in the comparable period of last year, thus grew by 28.8 percent. Increase in mark-up payments has been observed mainly on domestic debt as a result of higher interest rates and re-profiling of domestic debt.
Further breakup of current expenditures shows that defence expenditures grew by 3.6 percent to reach Rs 802.4 billion in the first nine months of the current fiscal year against Rs 774.7 billion in the same period of FY2019.
During July-March, FY2020, subsidies amounted to Rs 169.5 billion against Rs 96.8 billion

Fiscal Development
79
in the same period of FY2019, registering a growth of 75 percent. The break-up shows that Rs 133.9 billion has been provided for inter-Disco tariff differentials and Rs 8.5 billion to WAPDA (receivables from FATA). Similarly, Rs 11.7 billion subsidy has been released to the LNG sector for providing gas to the industry on lower rates. Most importantly, against the budgeted amount of Rs 2.5 billion to Utility Stores Corporations (USC) for Ramazan package, the government has provided an amount of Rs 10 billion subsidy during the first nine months of the current fiscal year.
Development expenditure (excluding net lending) grew by 14.6 percent during July-March, FY2020 and stood at Rs 751.7 billion against Rs 655.9 billion in the same period last year. The sharp rise has been realized across both federal and provincial levels. In particular, PSDP expenditures grew by 24.9 percent during July-March, FY2020 in contrast to a sharp decline observed during the same period last year. In absolute term, PSDP expenditures escalated to Rs 722.5 billion in the first nine months of the current fiscal year against Rs 578.5 billion in the comparable period last year.
Within PSDP, provincial development expenditures witnessed a remarkable performance by posting a growth of 38.4 percent and amounted to Rs 382.0 billion during July-March, FY2020 against Rs 276.0 billion in the comparable period last year. Similarly, federal PSDP grew by 12.6 percent to stand at Rs 340.5 billion as compared with Rs 302.4 billion in the same period of FY2019.
In order to finance the fiscal deficit, domestic and external resources generated Rs 1,003.8 billion and Rs 682.4 billion respectively during July- March, FY2020. Of domestic sources, financing from bank stood at Rs 601.8 billion and from non-bank amounted to Rs 402.0 billion during the period under review.
Detailed analysis reaffirms this fact that overall, fiscal accounts have registered a significant improvement during the first nine months of the current fiscal year. However, the outbreak of COVID-19 has brought a plethora of challenges to further improve the fiscal indicators. The government has taken swift actions to control the spread of the virus along with introducing an economic stimulus package. The aspiration is to increase health expenditures, strengthening social safety net programs and supporting economic activity.
Nevertheless, in doing so, major risks have emerged towards the end of the current fiscal year such as expected revenue shortfall and a sharp rise in expenditures due to higher subsidies and grants. Consequently, the short term economic impact of COVID-19 is expected to be significant, creating large fiscal and external financing needs.
FBR Tax Collection (July-April, FY2020)
FBR tax collection has witnessed a remarkable turnaround during the current fiscal year after posting negative growth of 0.4 percent in FY2019. The overall FBR tax collection grew by 10.8 percent to Rs 3,300.6 billion during July-April, FY2020 against Rs 2,980.0 billion in the comparable period last year. Within the total, the domestic component of tax revenue collected by the FBR grew by 14.7 percent to stand at Rs 2,777.7 billion in first ten months of the current fiscal year against Rs 2,421.1 billion in the comparable period last year.
Pakistan Economic Survey 2019-20
80
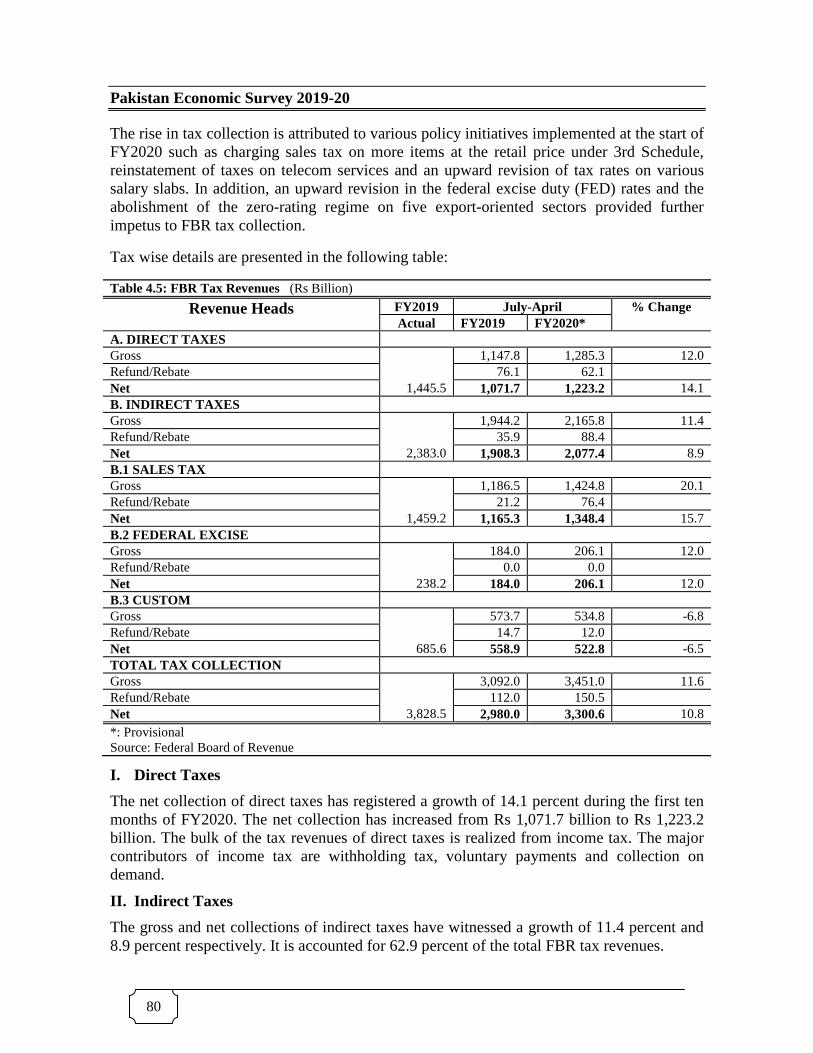
The rise in tax collection is attributed to various policy initiatives implemented at the start of FY2020 such as charging sales tax on more items at the retail price under 3rd Schedule, reinstatement of taxes on telecom services and an upward revision of tax rates on various salary slabs. In addition, an upward revision in the federal excise duty (FED) rates and the abolishment of the zero-rating regime on five export-oriented sectors provided further impetus to FBR tax collection.
Tax wise details are presented in the following table:
Table 4.5: FBR Tax Revenues (Rs Billion)
Revenue Heads FY2019 July-April % Change Actual FY2019 FY2020*
A. DIRECT TAXES Gross
1,445.5
1,147.8 1,285.3 12.0 Refund/Rebate 76.1 62.1 Net 1,071.7 1,223.2 14.1 B. INDIRECT TAXES Gross
2,383.0
1,944.2 2,165.8 11.4 Refund/Rebate 35.9 88.4 Net 1,908.3 2,077.4 8.9 B.1 SALES TAX Gross
1,459.2
1,186.5 1,424.8 20.1 Refund/Rebate 21.2 76.4 Net 1,165.3 1,348.4 15.7 B.2 FEDERAL EXCISE Gross
238.2
184.0 206.1 12.0 Refund/Rebate 0.0 0.0 Net 184.0 206.1 12.0 B.3 CUSTOM Gross
685.6
573.7 534.8 -6.8 Refund/Rebate 14.7 12.0 Net 558.9 522.8 -6.5 TOTAL TAX COLLECTION Gross
3,828.5
3,092.0 3,451.0 11.6 Refund/Rebate 112.0 150.5 Net 2,980.0 3,300.6 10.8 *: Provisional Source: Federal Board of Revenue
I. Direct Taxes
The net collection of direct taxes has registered a growth of 14.1 percent during the first ten months of FY2020. The net collection has increased from Rs 1,071.7 billion to Rs 1,223.2 billion. The bulk of the tax revenues of direct taxes is realized from income tax. The major contributors of income tax are withholding tax, voluntary payments and collection on demand.
II. Indirect Taxes
The gross and net collections of indirect taxes have witnessed a growth of 11.4 percent and 8.9 percent respectively. It is accounted for 62.9 percent of the total FBR tax revenues.

Fiscal Development
81
i. Sales Tax
Within indirect taxes, net collection of sales tax increased by 15.7 percent. The gross and net sales tax collection during July-April, FY2020 has been Rs 1,424.8 billion and Rs 1,348.4 billion respectively, showing a growth of 20.1 percent and 15.7 percent respectively. In fact, around 55.0 percent of total sales tax was contributed by a sales tax on import during July-April, FY2020, while the rest was contributed by the domestic sector.
ii. Federal Excise Duty
The collection of federal excise duties (FED) during July-April, FY2020 has recorded 12.0 percent growth. The net collection has stood at Rs 206.1 billion during July-April, FY2020 as against Rs 184.0 billion during the same period last year. The major revenue spinners of FED are cigarettes, cement, services and beverages.
iii. Customs Duty
Customs duty has registered a negative growth of 6.8 percent and 6.5 percent in gross and net revenues respectively. The net collection has decreased from Rs 558.9 billion during July-April, FY2019 to Rs 522.8 billion during July-April, FY2020. The major revenue spinners of customs duty have been vehicles, mineral fuels, iron and steel, electrical machinery, plastic, edible fruits etc.
Impact of COVID-19 on FBR Tax Collection
COVID-19 pandemic has casted a significant impact on revenue collection efforts of FBR. During the first eight months of FY2020, FBR recorded total revenue collection of Rs 2,738 billion with a growth rate of 17.5 percent over last fiscal year. FBR was able to achieve 91.4 percent of its (first revised) target for the period. However, after the outbreak of COVID-19 pandemic, an average negative growth rate of 13.4 percent was recorded during March 2020 and April 2020 as compared to last year as well as compared to the projected collection. The situation is likely to exacerbate further during the month of May and slight recovery is expected in the last month of the financial year because of usual lumped government spending.
Assessment of the full impact of COVID-19 on FBR’s tax collection merits analysis of the various expected and projected revenue figures prior to the time of crisis emergence. FBR’s target which stood at Rs 4,807 billion was revised downwards to Rs 3,908 billion keeping in view the economic slowdown consequent to the pandemic. The aforementioned revision had thus forecasted a revenue loss of Rs 899 billion. Nevertheless, the actual shortfall is expected to be higher than what has been projected.
The Federal Government has recently announced an incentive package for the construction sector, fulfilling the longstanding demand of builders and developers for fixed income tax and declaration of the construction sector as an industry. The package would not only revive the construction industry but also serve as a catalyst to enhance business activity in forty different economic sectors. Furthermore, FBR is also striving for simplification of laws and procedures to reduce the cost of doing business and lower administrative burden.
The total impact of COVID-19 pandemic is yet to be determined. The dynamic and
Pakistan Economic Survey 2019-20
82
challenging nature of the crisis necessitates an equally dynamic and vigorous strategy that is capable of being evolved in response to the demands made on it.
Provincial Budget
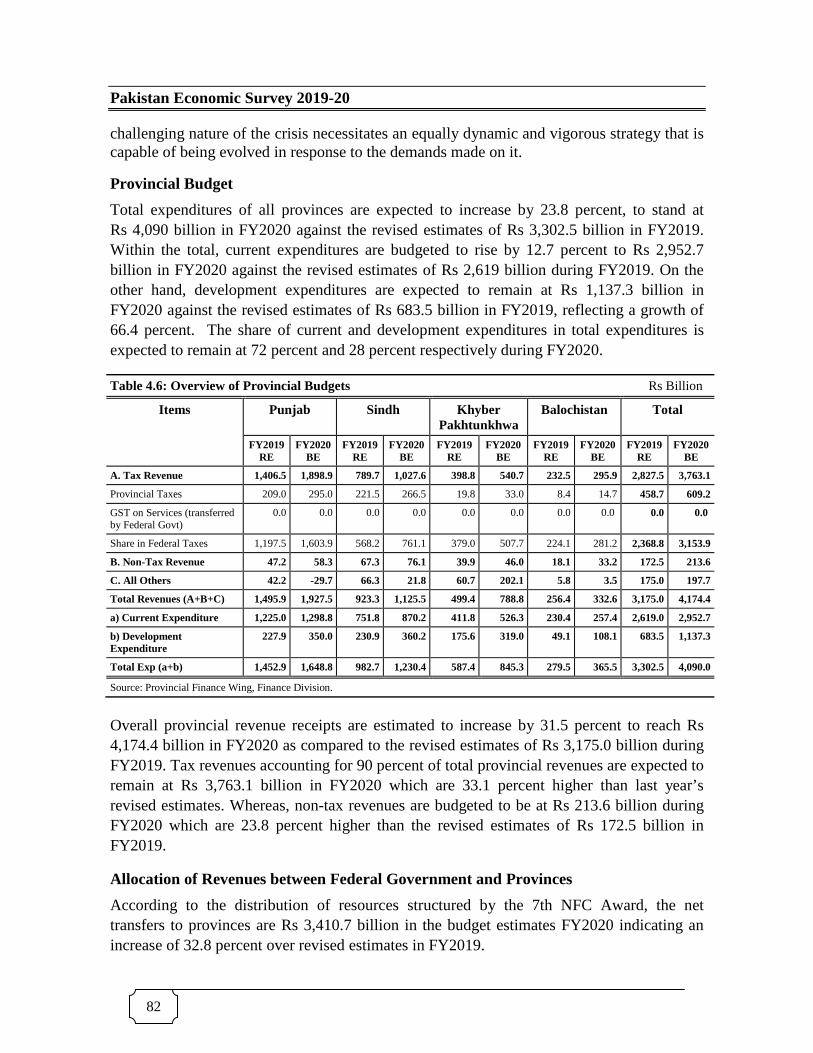
Total expenditures of all provinces are expected to increase by 23.8 percent, to stand at Rs 4,090 billion in FY2020 against the revised estimates of Rs 3,302.5 billion in FY2019. Within the total, current expenditures are budgeted to rise by 12.7 percent to Rs 2,952.7 billion in FY2020 against the revised estimates of Rs 2,619 billion during FY2019. On the other hand, development expenditures are expected to remain at Rs 1,137.3 billion in FY2020 against the revised estimates of Rs 683.5 billion in FY2019, reflecting a growth of 66.4 percent. The share of current and development expenditures in total expenditures is expected to remain at 72 percent and 28 percent respectively during FY2020.
Table 4.6: Overview of Provincial Budgets Rs Billion
Items Punjab Sindh Khyber Pakhtunkhwa
Balochistan Total
FY2019 RE
FY2020 BE
FY2019 RE
FY2020 BE
FY2019 RE
FY2020 BE
FY2019 RE
FY2020 BE
FY2019 RE
FY2020 BE
A. Tax Revenue 1,406.5 1,898.9 789.7 1,027.6 398.8 540.7 232.5 295.9 2,827.5 3,763.1
Provincial Taxes 209.0 295.0 221.5 266.5 19.8 33.0 8.4 14.7 458.7 609.2
GST on Services (transferred by Federal Govt)
0.0 0.0 0.0 0.0 0.0 0.0 0.0 0.0 0.0 0.0
Share in Federal Taxes 1,197.5 1,603.9 568.2 761.1 379.0 507.7 224.1 281.2 2,368.8 3,153.9
B. Non-Tax Revenue 47.2 58.3 67.3 76.1 39.9 46.0 18.1 33.2 172.5 213.6
C. All Others 42.2 -29.7 66.3 21.8 60.7 202.1 5.8 3.5 175.0 197.7
Total Revenues (A+B+C) 1,495.9 1,927.5 923.3 1,125.5 499.4 788.8 256.4 332.6 3,175.0 4,174.4
a) Current Expenditure 1,225.0 1,298.8 751.8 870.2 411.8 526.3 230.4 257.4 2,619.0 2,952.7
b) Development Expenditure
227.9 350.0 230.9 360.2 175.6 319.0 49.1 108.1 683.5 1,137.3
Total Exp (a+b) 1,452.9 1,648.8 982.7 1,230.4 587.4 845.3 279.5 365.5 3,302.5 4,090.0
Source: Provincial Finance Wing, Finance Division.
Overall provincial revenue receipts are estimated to increase by 31.5 percent to reach Rs 4,174.4 billion in FY2020 as compared to the revised estimates of Rs 3,175.0 billion during FY2019. Tax revenues accounting for 90 percent of total provincial revenues are expected to remain at Rs 3,763.1 billion in FY2020 which are 33.1 percent higher than last year’s revised estimates. Whereas, non-tax revenues are budgeted to be at Rs 213.6 billion during FY2020 which are 23.8 percent higher than the revised estimates of Rs 172.5 billion in FY2019.
Allocation of Revenues between Federal Government and Provinces
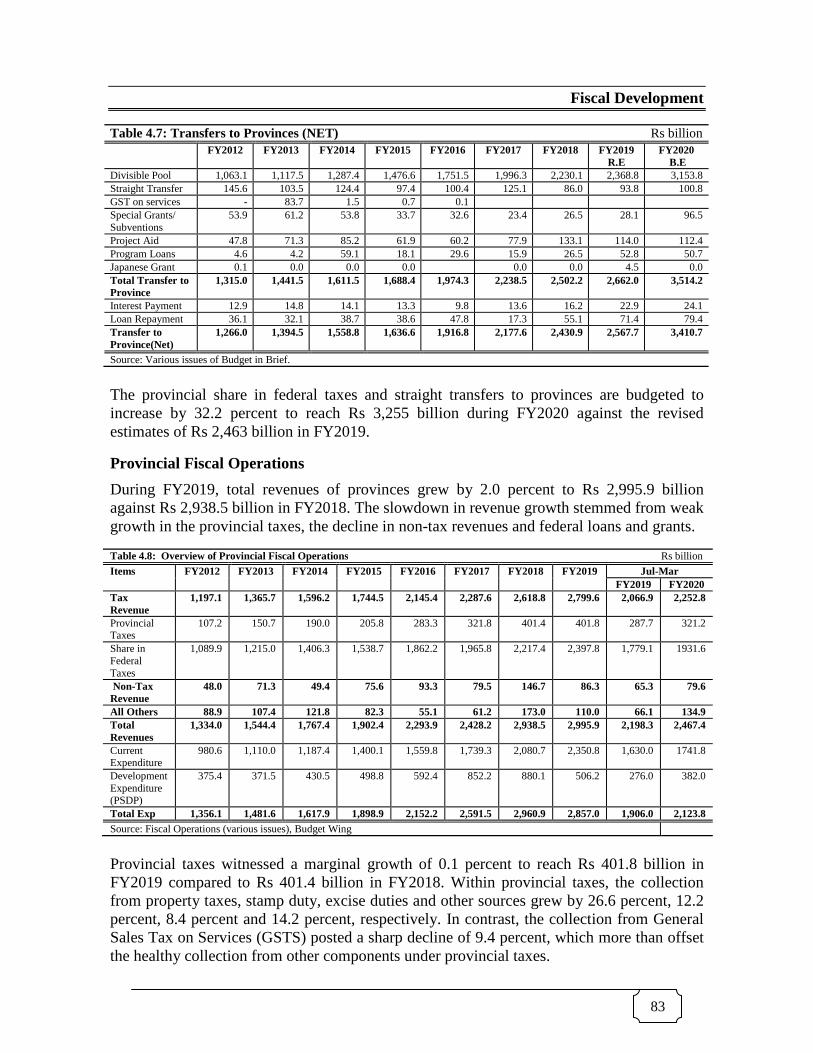
According to the distribution of resources structured by the 7th NFC Award, the net transfers to provinces are Rs 3,410.7 billion in the budget estimates FY2020 indicating an increase of 32.8 percent over revised estimates in FY2019.
Fiscal Development
83
Table 4.7: Transfers to Provinces (NET) Rs billion FY2012 FY2013 FY2014 FY2015 FY2016 FY2017 FY2018 FY2019
R.E FY2020
B.E Divisible Pool 1,063.1 1,117.5 1,287.4 1,476.6 1,751.5 1,996.3 2,230.1 2,368.8 3,153.8 Straight Transfer 145.6 103.5 124.4 97.4 100.4 125.1 86.0 93.8 100.8 GST on services - 83.7 1.5 0.7 0.1 Special Grants/ Subventions
53.9 61.2 53.8 33.7 32.6 23.4 26.5 28.1 96.5
Project Aid 47.8 71.3 85.2 61.9 60.2 77.9 133.1 114.0 112.4 Program Loans 4.6 4.2 59.1 18.1 29.6 15.9 26.5 52.8 50.7 Japanese Grant 0.1 0.0 0.0 0.0 0.0 0.0 4.5 0.0 Total Transfer to Province
1,315.0 1,441.5 1,611.5 1,688.4 1,974.3 2,238.5 2,502.2 2,662.0 3,514.2
Interest Payment 12.9 14.8 14.1 13.3 9.8 13.6 16.2 22.9 24.1 Loan Repayment 36.1 32.1 38.7 38.6 47.8 17.3 55.1 71.4 79.4 Transfer to Province(Net)
1,266.0 1,394.5 1,558.8 1,636.6 1,916.8 2,177.6 2,430.9 2,567.7 3,410.7
Source: Various issues of Budget in Brief.
The provincial share in federal taxes and straight transfers to provinces are budgeted to increase by 32.2 percent to reach Rs 3,255 billion during FY2020 against the revised estimates of Rs 2,463 billion in FY2019.
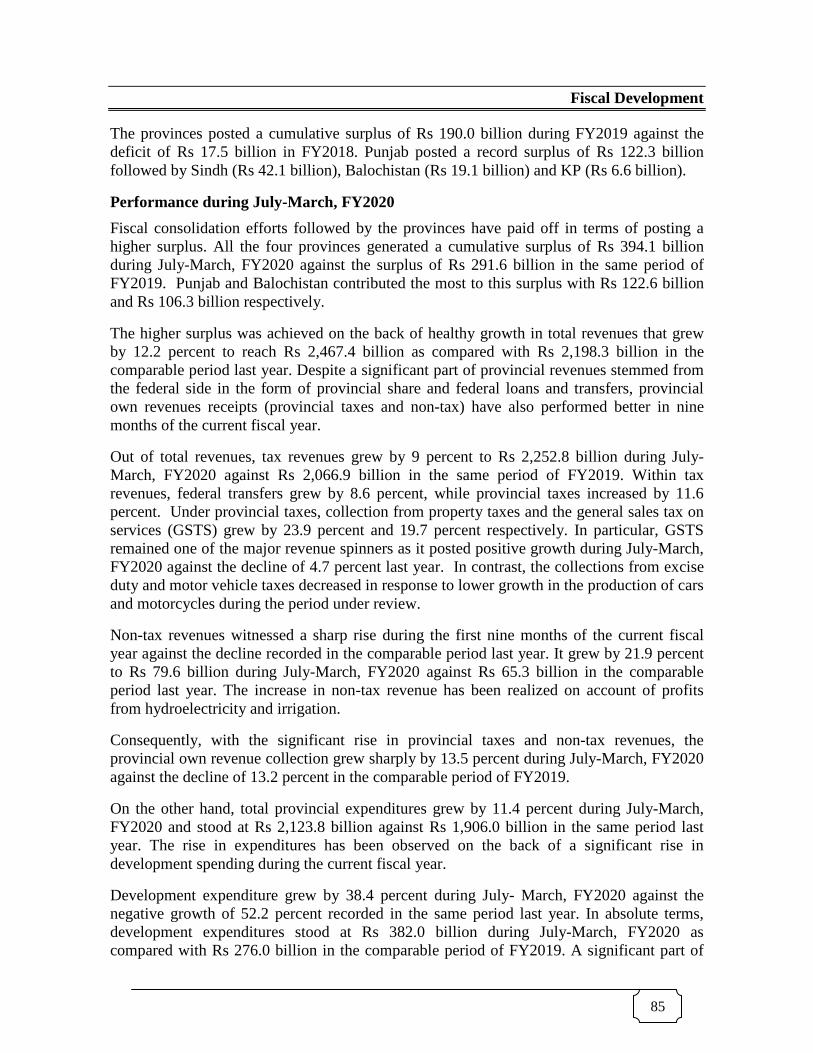
Provincial Fiscal Operations
During FY2019, total revenues of provinces grew by 2.0 percent to Rs 2,995.9 billion against Rs 2,938.5 billion in FY2018. The slowdown in revenue growth stemmed from weak growth in the provincial taxes, the decline in non-tax revenues and federal loans and grants.
Table 4.8: Overview of Provincial Fiscal Operations Rs billion Items FY2012 FY2013 FY2014 FY2015 FY2016 FY2017 FY2018 FY2019 Jul-Mar
FY2019 FY2020 Tax Revenue
1,197.1 1,365.7 1,596.2 1,744.5 2,145.4 2,287.6 2,618.8 2,799.6 2,066.9 2,252.8
Provincial Taxes
107.2 150.7 190.0 205.8 283.3 321.8 401.4 401.8 287.7 321.2
Share in Federal Taxes
1,089.9 1,215.0 1,406.3 1,538.7 1,862.2 1,965.8 2,217.4 2,397.8 1,779.1 1931.6
Non-Tax Revenue
48.0 71.3 49.4 75.6 93.3 79.5 146.7 86.3 65.3 79.6
All Others 88.9 107.4 121.8 82.3 55.1 61.2 173.0 110.0 66.1 134.9 Total Revenues
1,334.0 1,544.4 1,767.4 1,902.4 2,293.9 2,428.2 2,938.5 2,995.9 2,198.3 2,467.4
Current Expenditure
980.6 1,110.0 1,187.4 1,400.1 1,559.8 1,739.3 2,080.7 2,350.8 1,630.0 1741.8
Development Expenditure (PSDP)
375.4 371.5 430.5 498.8 592.4 852.2 880.1 506.2 276.0 382.0
Total Exp 1,356.1 1,481.6 1,617.9 1,898.9 2,152.2 2,591.5 2,960.9 2,857.0 1,906.0 2,123.8 Source: Fiscal Operations (various issues), Budget Wing
Provincial taxes witnessed a marginal growth of 0.1 percent to reach Rs 401.8 billion in FY2019 compared to Rs 401.4 billion in FY2018. Within provincial taxes, the collection from property taxes, stamp duty, excise duties and other sources grew by 26.6 percent, 12.2 percent, 8.4 percent and 14.2 percent, respectively. In contrast, the collection from General Sales Tax on Services (GSTS) posted a sharp decline of 9.4 percent, which more than offset the healthy collection from other components under provincial taxes.

Pakistan Economic Survey 2019-20
84
On the other hand, the federal government was able to transfer 8.1 percent more funds to the provinces from the divisible pool. In absolute terms, it increased to Rs 2,397.8 billion in FY2019 against Rs 2,217.4 billion during FY2018. Non-tax revenues witnessed a sharp decline of 41.2 percent to stand at Rs 86.3 billion during FY2019 as compared to Rs 146.7 billion in FY2018. The major factor responsible for significant decline in non-tax revenue was the reduction in profit from hydroelectricity which stood at Rs 21.1 billion during FY2019 against Rs 61.3 billion recorded in FY2018.
The share of federal transfers stood at 80 percent while provincial own revenue receipts (tax and non-tax) contributed 16.3 percent in total revenues during FY2019.
The growth in provincial expenditures witnessed a significant decline during FY2019 which was largely attributable to a sharp decline in development spending and sluggish growth in current expenditures as compared to the preceding year. Total provincial expenditures stood at Rs 2,857.0 billion during FY2019 against Rs 2,960.9 billion in the comparable period of FY2018, thus posting a decline of 3.5 percent. Within total expenditures, current expenditures grew by 13 percent to stand at Rs 2,350.8 billion in FY2019 against Rs 2,080.7 billion during FY2018. While development expenditures reduced significantly by 42.5 percent to Rs 506.8 billion during FY2019 as compared to Rs 880.1 billion in FY2018.
-500
500
1500
2500
3500
FY2012 FY2013 FY2014 FY2015 FY2016 FY2017 FY2018 FY2019
Fig: 4.8- Composition of Provincial Revenues (Rs billion)
Share in Federal Taxes Federal Loans & Grants Non-Tax Revenue Provincial Taxes
11.6 14.4 13.5 14.8 16.4 16.5 18.7 16.3
81.7 78.7 79.6 80.9 81.2 81.0 75.5 80.0
6.7 7.0 6.9 4.3 2.4 2.5 5.9 3.7
FY2012 FY2013 FY2014 FY2015 FY2016 FY2017 FY2018 FY2019
Fig: 4.9- Contribution in Total Revenues
Own Revenue Receipts Federal Transfers Federal Loan and Grants
Fiscal Development
85
The provinces posted a cumulative surplus of Rs 190.0 billion during FY2019 against the deficit of Rs 17.5 billion in FY2018. Punjab posted a record surplus of Rs 122.3 billion followed by Sindh (Rs 42.1 billion), Balochistan (Rs 19.1 billion) and KP (Rs 6.6 billion).
Performance during July-March, FY2020
Fiscal consolidation efforts followed by the provinces have paid off in terms of posting a higher surplus. All the four provinces generated a cumulative surplus of Rs 394.1 billion during July-March, FY2020 against the surplus of Rs 291.6 billion in the same period of FY2019. Punjab and Balochistan contributed the most to this surplus with Rs 122.6 billion and Rs 106.3 billion respectively.
The higher surplus was achieved on the back of healthy growth in total revenues that grew by 12.2 percent to reach Rs 2,467.4 billion as compared with Rs 2,198.3 billion in the comparable period last year. Despite a significant part of provincial revenues stemmed from the federal side in the form of provincial share and federal loans and transfers, provincial own revenues receipts (provincial taxes and non-tax) have also performed better in nine months of the current fiscal year.
Out of total revenues, tax revenues grew by 9 percent to Rs 2,252.8 billion during July-March, FY2020 against Rs 2,066.9 billion in the same period of FY2019. Within tax revenues, federal transfers grew by 8.6 percent, while provincial taxes increased by 11.6 percent. Under provincial taxes, collection from property taxes and the general sales tax on services (GSTS) grew by 23.9 percent and 19.7 percent respectively. In particular, GSTS remained one of the major revenue spinners as it posted positive growth during July-March, FY2020 against the decline of 4.7 percent last year. In contrast, the collections from excise duty and motor vehicle taxes decreased in response to lower growth in the production of cars and motorcycles during the period under review.
Non-tax revenues witnessed a sharp rise during the first nine months of the current fiscal year against the decline recorded in the comparable period last year. It grew by 21.9 percent to Rs 79.6 billion during July-March, FY2020 against Rs 65.3 billion in the comparable period last year. The increase in non-tax revenue has been realized on account of profits from hydroelectricity and irrigation.
Consequently, with the significant rise in provincial taxes and non-tax revenues, the provincial own revenue collection grew sharply by 13.5 percent during July-March, FY2020 against the decline of 13.2 percent in the comparable period of FY2019.
On the other hand, total provincial expenditures grew by 11.4 percent during July-March, FY2020 and stood at Rs 2,123.8 billion against Rs 1,906.0 billion in the same period last year. The rise in expenditures has been observed on the back of a significant rise in development spending during the current fiscal year.
Development expenditure grew by 38.4 percent during July- March, FY2020 against the negative growth of 52.2 percent recorded in the same period last year. In absolute terms, development expenditures stood at Rs 382.0 billion during July-March, FY2020 as compared with Rs 276.0 billion in the comparable period of FY2019. A significant part of

Pakistan Economic Survey 2019-20
86
the development expenditure has been allocated to economic affairs, mainly to construction and transport, agriculture and food.
Conversely, current expenditures witnessed a slow growth and increased by 6.9 percent during the first nine months of current fiscal year relative to 13.8 percent growth recorded in the same period of last year. In absolute terms, it increased to Rs 1,741.8 billion against Rs 1,630.0 billion last year.
Public Financial Management Reforms in the Federal Government
In FY2020, Government of Pakistan continued its agenda for reforms in Public Financial Management (PFM). In this regard, a major breakthrough is the promulgation of the Public Finance Management Act, 2019. This piece of legislation was long overdue as Article 79 of the constitution of Islamic Republic of Pakistan makes it mandatory to manage public finances through an Act of Parliament.
The Act envisages strengthening management of public finances with the view to improving definition and implementation of fiscal policy for better macroeconomic management, to clarify institutional responsibilities related to financial management, and to strengthen budgetary management. Major thematic areas of the Act include efficient maintenance of public resources/ assets to optimize utilization, effective cash management and precise cash forecasting and institutional integration of concerned public entities to mitigate risks associated with fiscal performance and debt management. The Act also envisages to incorporate international best practices in public accounting to reduce discrepancies in financial records, in making performance-based budgeting, and to enhance transparency in budget making hence increasing the role of Parliament in oversight and accountability of economic decision making.
To implement the PFM Act, 2019 in letter and spirit, the government has notified a Cash Management and Treasury Single Account (TSA) Policy, 2019-29. This policy provides the framework for operationalization of cash consolidation to facilitate federal government to utilize idle cash held outside public coffers.
In order to make PFM reforms a holistic exercise, various other initiatives have already been taken which include the gradual introduction of high-end information technology (IT) to automate Public Procurements with an end-to-end integration with e-Payment system, completely shifting the mode of transaction for payments of pays and pensions of Government employees from manual to Direct Credit Scheme (DCS), alignment of human resource data of health and education sectors with respective financial data in an IT- enabled ecosystem, the introduction of Management Information System (MIS) for auditing health and education sectors, development of Open Public Finance Data Portal for increased citizen access to key fiscal information on health and education sectors, and inclusion of provincial governments in PFM reforms through providing performance grants against the achievement of numerous fiscal performance indicators. Finance Division is leading the implementation of the aforementioned PFM reforms’ initiatives, and it is expected to be completed by the end of FY2021.

Fiscal Development
87
Conclusion
With the government’s stringent fiscal strategy, the imbalances in fiscal accounts reverted to the path of fiscal discipline and fiscal consolidation. Efforts to improve the revenues through comprehensive tax measures and administrative reforms along with expenditure rationalization paid off in terms of a significant decline in the fiscal deficit. The government has successfully brought down the fiscal deficit to 4.0 percent of GDP during July-March, FY2020 against 5.1 percent of GDP in the comparable period last year. Similarly, the primary balance posted a surplus of Rs 194 billion during July-March, FY2020 against the deficit of Rs 463 billion.
However, the COVID-19 pandemic has altered the near-term outlook. It has brought significant challenges for the economy; in particular, fiscal accounts, which have continued to improve substantially, are expected to come under significant pressure. At present, the government is increasing the expenditures on public health and strengthening social safety net programs, along with introducing various other measures to lessen the impact of the COVID-19 on the economy. Resultantly, the budget will therefore temporarily deviate from the initial target. Similarly, achieving revenue targets of both tax and non-tax segments would be challenging due to disruption in economic activity. Hence, the budget deficit is expected to exceed the target set for FY2020.