Embed Size (px)
Citation preview
04 – SOL - 80 – PM R10.4/30.2
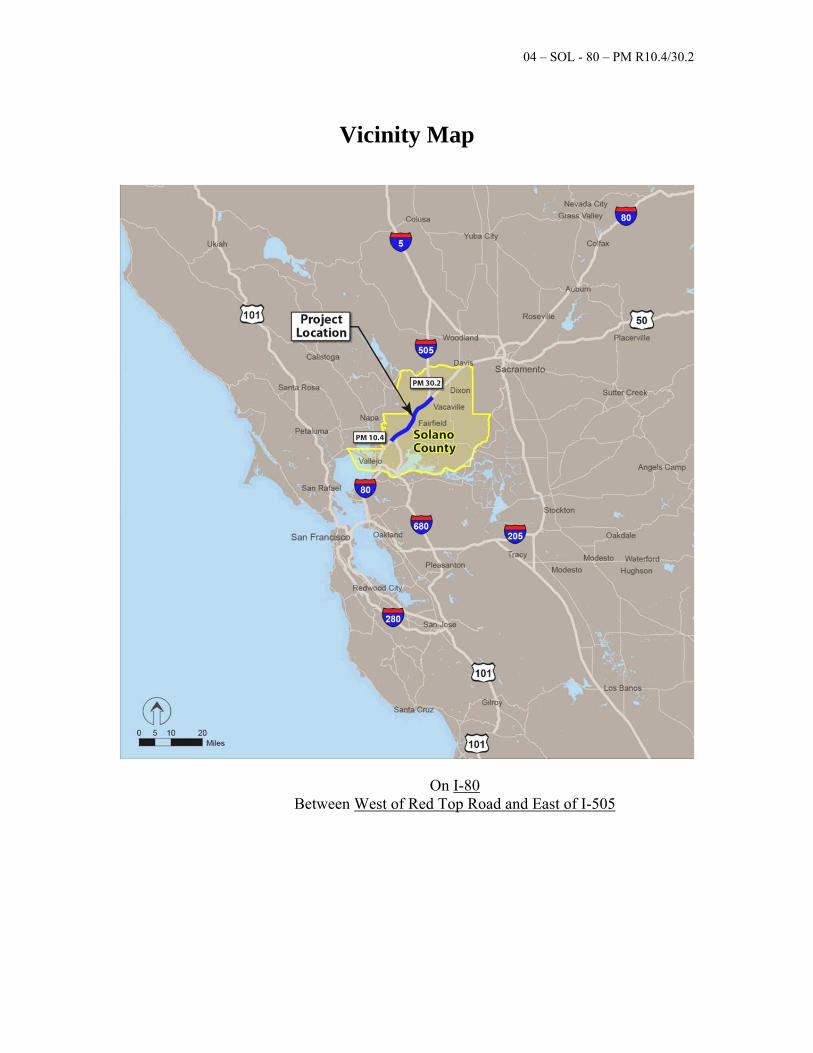
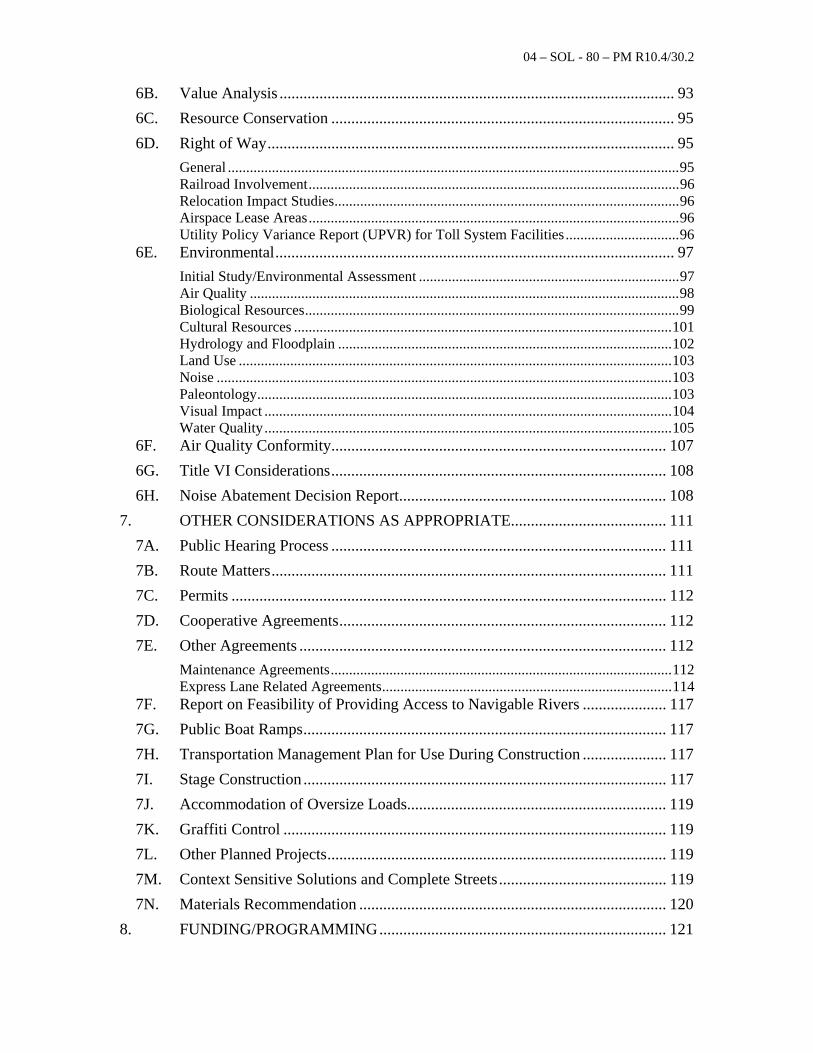
Vicinity Map
On I-80 Between West of Red Top Road and East of I-505
04 – SOL - 80 – PM R10.4/30.2
Table of Contents 1. INTRODUCTION ............................................................................................... 1
2. RECOMMENDATION ....................................................................................... 5
3. BACKGROUND ................................................................................................. 6
3A. Project History ..................................................................................................... 6
3B. Community Interaction ........................................................................................ 7
3C. Existing Facility ................................................................................................... 8
Existing Facility within the Specified Segments ............................................................ 10 4. PURPOSE AND NEED ..................................................................................... 13
Purpose: .......................................................................................................................... 13 Need: .............................................................................................................................. 13
4A. Problem, Deficiencies, Justification .................................................................. 14
4B. Regional and System Planning .......................................................................... 18
Identify Systems ............................................................................................................. 18 State Planning ................................................................................................................ 19 Regional Planning .......................................................................................................... 20 Local Planning ............................................................................................................... 20 Transit Operator Planning .............................................................................................. 21
4C. Traffic ................................................................................................................ 21
Current and Forecasted Traffic ...................................................................................... 21 Collision Analysis .......................................................................................................... 29
5. ALTERNATIVES.............................................................................................. 41
5A. Viable Alternatives ............................................................................................ 41
No Build Alternative ...................................................................................................... 41 Build Alternative (Preferred Alternative) ...................................................................... 41 Other Project Components ............................................................................................. 45 Interim Features ............................................................................................................. 45 Express Lanes Operating Concept ................................................................................. 45 Nonstandard Design Features ........................................................................................ 47 Ramp Metering/Traffic Operations Systems .................................................................. 84 California Highway Patrol Observation and Median Enforcement Areas ..................... 84 Park and Ride Facilities ................................................................................................. 85 Highway Planting ........................................................................................................... 85 Erosion Control .............................................................................................................. 87 Non-Motorized and Pedestrian Features ........................................................................ 87 Utility and Other Owner Involvement ........................................................................... 87 Needed Structure Rehabilitation and Upgrading ........................................................... 88 Cost Estimates ................................................................................................................ 89 Effect of Special Funded Proposal on State Highway ................................................... 91
5B. Rejected Alternatives ......................................................................................... 91
Project Study Report-Project Development Support Alternative ................................... 91 6. CONSIDERATIONS REQUIRING DISCUSSION ......................................... 92
6A. Hazardous Waste ............................................................................................... 92
04 – SOL - 80 – PM R10.4/30.2
6B. Value Analysis ................................................................................................... 93
6C. Resource Conservation ...................................................................................... 95
6D. Right of Way ...................................................................................................... 95
General ........................................................................................................................... 95 Railroad Involvement ..................................................................................................... 96 Relocation Impact Studies .............................................................................................. 96 Airspace Lease Areas ..................................................................................................... 96 Utility Policy Variance Report (UPVR) for Toll System Facilities ............................... 96
6E. Environmental .................................................................................................... 97
Initial Study/Environmental Assessment ....................................................................... 97 Air Quality ..................................................................................................................... 98 Biological Resources ...................................................................................................... 99 Cultural Resources ....................................................................................................... 101 Hydrology and Floodplain ........................................................................................... 102 Land Use ...................................................................................................................... 103 Noise ............................................................................................................................ 103 Paleontology ................................................................................................................. 103 Visual Impact ............................................................................................................... 104 Water Quality ............................................................................................................... 105
6F. Air Quality Conformity .................................................................................... 107
6G. Title VI Considerations .................................................................................... 108
6H. Noise Abatement Decision Report ................................................................... 108
7. OTHER CONSIDERATIONS AS APPROPRIATE....................................... 111
7A. Public Hearing Process .................................................................................... 111
7B. Route Matters ................................................................................................... 111
7C. Permits ............................................................................................................. 112
7D. Cooperative Agreements .................................................................................. 112
7E. Other Agreements ............................................................................................ 112
Maintenance Agreements ............................................................................................. 112 Express Lane Related Agreements ............................................................................... 114
7F. Report on Feasibility of Providing Access to Navigable Rivers ..................... 117
7G. Public Boat Ramps ........................................................................................... 117
7H. Transportation Management Plan for Use During Construction ..................... 117
7I. Stage Construction ........................................................................................... 117
7J. Accommodation of Oversize Loads................................................................. 119
7K. Graffiti Control ................................................................................................ 119
7L. Other Planned Projects ..................................................................................... 119
7M. Context Sensitive Solutions and Complete Streets .......................................... 119
7N. Materials Recommendation ............................................................................. 120
8. FUNDING/PROGRAMMING ........................................................................ 121
04 – SOL - 80 – PM R10.4/30.2
9. SCHEDULE ..................................................................................................... 122
10. RISKS .............................................................................................................. 123
11. FHWA COORDINATION .............................................................................. 123
12. PROJECT REVIEWS ...................................................................................... 123
13. PROJECT PERSONNEL................................................................................. 124
14. ATTACHMENTS ............................................................................................ 125
04 – SOL - 80 – PM R10.4/30.2
1
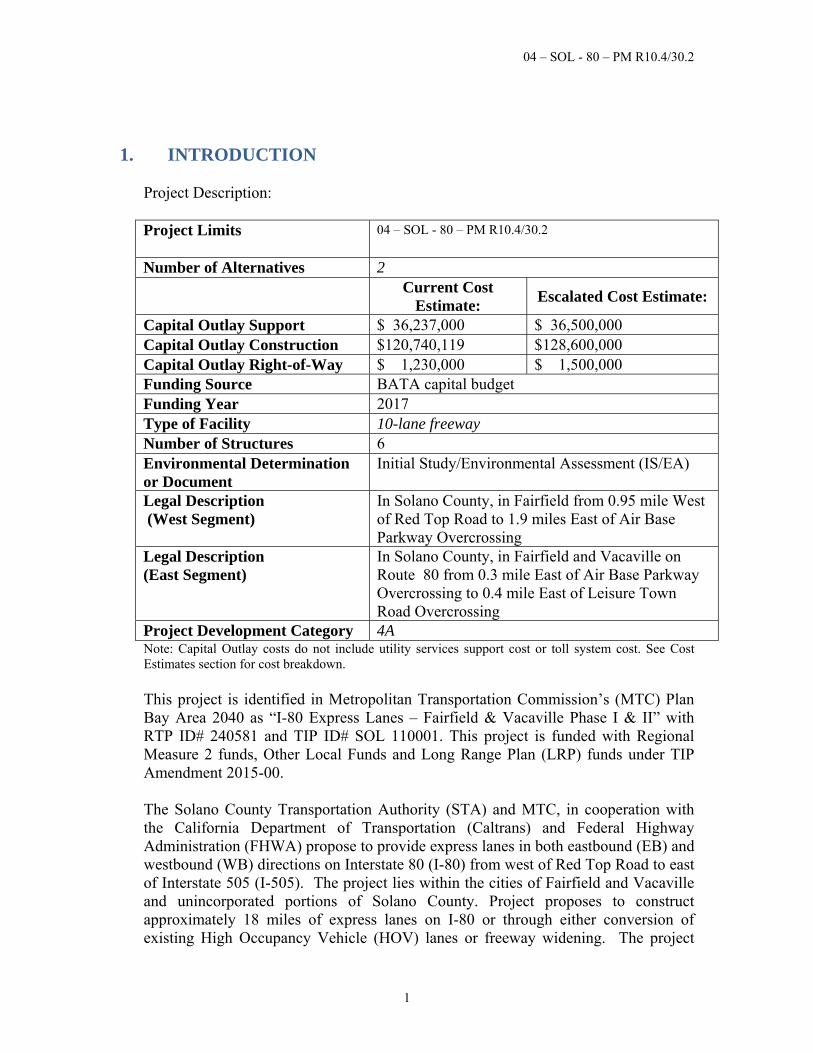
1. INTRODUCTION Project Description: Project Limits
04 – SOL - 80 – PM R10.4/30.2
Number of Alternatives 2
Current Cost
Estimate: Escalated Cost Estimate:
Capital Outlay Support $ 36,237,000 $ 36,500,000 Capital Outlay Construction $120,740,119 $128,600,000 Capital Outlay Right-of-Way $ 1,230,000 $ 1,500,000 Funding Source BATA capital budget Funding Year 2017 Type of Facility 10-lane freeway Number of Structures 6 Environmental Determination or Document
Initial Study/Environmental Assessment (IS/EA)
Legal Description (West Segment)
In Solano County, in Fairfield from 0.95 mile West of Red Top Road to 1.9 miles East of Air Base Parkway Overcrossing
Legal Description (East Segment)
In Solano County, in Fairfield and Vacaville on Route 80 from 0.3 mile East of Air Base Parkway Overcrossing to 0.4 mile East of Leisure Town Road Overcrossing
Project Development Category 4A Note: Capital Outlay costs do not include utility services support cost or toll system cost. See Cost Estimates section for cost breakdown. This project is identified in Metropolitan Transportation Commission’s (MTC) Plan Bay Area 2040 as “I-80 Express Lanes – Fairfield & Vacaville Phase I & II” with RTP ID# 240581 and TIP ID# SOL 110001. This project is funded with Regional Measure 2 funds, Other Local Funds and Long Range Plan (LRP) funds under TIP Amendment 2015-00. The Solano County Transportation Authority (STA) and MTC, in cooperation with the California Department of Transportation (Caltrans) and Federal Highway Administration (FHWA) propose to provide express lanes in both eastbound (EB) and westbound (WB) directions on Interstate 80 (I-80) from west of Red Top Road to east of Interstate 505 (I-505). The project lies within the cities of Fairfield and Vacaville and unincorporated portions of Solano County. Project proposes to construct approximately 18 miles of express lanes on I-80 or through either conversion of existing High Occupancy Vehicle (HOV) lanes or freeway widening. The project
04 – SOL - 80 – PM R10.4/30.2
2
limits are approximately 20 miles because of the need to install express lanes signs and equipment one mile in advance of the actual express lane entrances. A Project Location Map is attached as Attachment A. The project is part of the Bay Area Express Lanes Network (formally called the Regional Express Lane Network), which was adopted in the Transportation 2035 Plan and Plan Bay Area. MTC is implementing express lanes through the Bay Area Infrastructure Financing Authority (BAIFA). BAIFA is a joint exercise of powers authority between MTC and the Bay Area Toll Authority, formed for the purpose of planning, developing and funding transportation and related projects, which includes express lanes. The design of the civil infrastructure components is the responsibility of STA on behalf of BAIFA. An Operation and Maintenance Agreement between Caltrans and BAIFA is being prepared. The agreement will stipulate maintenance responsibilities for the express lanes and the associated tolling equipment. The development and operation of the toll system will be the responsibility of BAIFA. A Toll System Integrator (TSI), under contract with BAIFA, is anticipated to be responsible for implementation and maintenance of the toll collection system. The TSI will install tolling equipment, including cabinets, cameras, sensors, and electric and communication wires. Caltrans is the lead agency for preparing the environmental document in compliance with the National Environmental Protection Act (NEPA) and the California Environmental Quality Act (CEQA). Project funding for the I-80 Express Lanes Project is currently funded by the Bay Area Toll Authority (BATA) with Regional Measure 2 funds and is part of MTC’s Regional Express Lanes Network (RTP ID# 240741). In 2009, the West Segment Project known as “I-80 in Solano County from Red Top Road to Air Base Parkway- Convert HOV lanes to express lanes” was identified in MTC’s Transportation 2035 Plan, Change in Motion (RTP ID # 230660 and TIP ID #SOL 110002). In 2013, the East Segment Project was added to MTC’s Plan Bay Area 2040 (RTP ID# 240581). Later in 2013, MTC updated the Transportation Improvement Program (TIP) to combine the West Segment and East Segment Project now known as “I-80 Express Lanes – Fairfield & Vacaville Phase I & II” with a new RTP ID# 240581 and TIP ID# SOL 110001 under TIP Amendment 2013-16. Also, as part of the 2015 TIP update, MTC updated the I-80 Express Lanes Project to identify a full funding program of $ 236.8 Million for the remaining project phases (Final Design, Right of Way and Construction) with Long Range Plan (LRP) funds (future RM2, STIP and others) and Other Local funds under TIP Amendment 2015-00. Express lanes are designated managed lanes that allow the available capacity in the HOV lanes to be offered to non-carpool eligible drivers for a toll, in order to provide congestion relief. The toll will change dynamically in response to real-time
04 – SOL - 80 – PM R10.4/30.2
3
congestion levels and the available capacity in the HOV lanes. The project will offer non-carpool eligible drivers more reliable travel times, improve transit utilization by reducing overall transit travel times, and increase vehicle and passenger throughput by better utilizing the use of existing HOV lane capacity from Red Top Road to east of Air Base Parkway, and providing a new express lane on I-80 from east of Air Base Parkway to east of I-505 to meet existing and future travel demands. There is only one Build Alternative which will utilize a continuous access design, which means that the express lanes will be contiguous/non-barrier separated from the general purpose lanes and there will be no intermediate ingress and egress locations. The express lanes will be 12 feet wide where feasible and designated using a dashed-stripe pavement marking. The project will consist of the following primary improvements:
Conversion of existing HOV lanes to express lanes by restriping, Construction of new express lanes with freeway widening and striping, Installation of static and dynamic signs, electronic tolling equipment, and toll
collection system, Construction of California Highway Patrol (CHP) Observation and Median
Enforcement Areas, and Installation of ancillary components such as electrical power and
communication conduits and any Caltrans required traffic control devices. The Build Alternative is divided into two segments. The first segment, designated as the West Segment includes conversion of the existing HOV lanes to express lanes. The second segment, designated as the East Segment, includes widening for a new express lane. Both segments are cleared through a single environmental document. Attachment A shows the limits of the two segments. The West Segment (PM R10.44 to PM 21.12), runs along I-80 from west of the Red Top Road Interchange to east of the Air Base Parkway Interchange, including the I-80/I-680 Interchange. In the West Segment, existing HOV lanes in both the EB and WB directions will be restriped and converted into express lanes. Pavement widening work will include the extension of the existing auxiliary lane on EB I-80 between Beck Avenue on-ramp and Travis Boulevard off-ramp, in order to increase the weaving length, which includes the related modification of the existing EB I-80 off-ramps at Travis Boulevard by separating the exit points of the off-ramps to EB Travis Boulevard and WB Travis Boulevard. There will be no impacts to bridge structures and creek crossings. Easements (utility and temporary construction) will be required for the West segment. The East Segment (PM 19.2 to PM 30.2) will construct new express lanes in both the EB and WB directions of I-80 from east of the Air Base Parkway Interchange to east of the I-80/I-505 Interchange. To provide width for the new express lanes, the
04 – SOL - 80 – PM R10.4/30.2
4
freeway will require median widening and outside widening at specific locations. The widening will require new pavement structural section, concrete barriers, retaining walls, Creek Bridge widening at Ulatis Creek and Horse Creek, median widening at Davis Street and Mason Street undercrossings, new tie-back retaining wall at the EB I-80/NB I-505 Connector and a tangent pile retaining wall at the Cherry Glen Overcrossing structure. Drainage culvert extensions, parcel acquisition and utility/temporary construction easements will be required for the East Segment. The total project cost, escalated to 2017, is estimated to be $166,600,000, which includes $107,500,000 for construction and $1,500,000 for right of way acquisitions and utility relocations. The total capital outlay support cost is $35,000,000. The total project costs also include a utility services support cost of $1,500,000 and a toll system cost of $21,100,000. The toll system cost includes the associated support cost. Toll system integration will be under a separate construction contract. Following is the cost breakdown of the two segments:
West Segment – The total escalated project cost for the West Segment is $41,700,000. This includes $24,700,000 in construction cost and $100,000 in right of way cost. The total capital outlay support cost is $7,200,000. The total project costs also include a utility services support cost of $600,000 and a toll system cost of $9,100,000.
East Segment - The total escalated project cost for the East Segment is $124,900,000. This includes $82,800,000 in construction cost and $1,400,000 in R/W cost. The total capital outlay support cost is $27,800,000. The total project costs also include a utility services support cost of $900,000 and a toll system cost of $12,000,000.
Because of funding limitations, it is likely that the project will be constructed in two phases: Phase 1 is the West Segment and Phase 2 is the East Segment. Funding is planned in the Express Lanes element of the BATA capital budget for the West Segment. The East Segment (Phase 2) currently is not funded through Construction. The project was environmental cleared in accordance to CEQA/NEPA on December 1, 2015. Phase 1 Plans, Specifications and Estimate are expected to be completed by October 2017, with construction to begin by February 2018 and express lanes to operate by March 2020. The Project Study Report-Project Development Support (PSR-PDS) approved on April 4, 2012 considered two alternatives, generally described as: (1) Alternative A - continuous access with minimum improvements and (2) Alternative B - restricted/buffer separated access with improvements meeting current design standards. The Build Alternative is comparable to Alternative A.
04 – SOL - 80 – PM R10.4/30.2
5
This project has been assigned the Project Development Processing Category 4A because it will require right of way acquisitions and it increases mobility and capacity.
04 – SOL - 80 – PM R10.4/30.2
6
2. RECOMMENDATION It is recommended that the Project Report be approved with the Build Alternative (Preferred Alternative), and that the project proceed to the design phase. The affected local agencies have been consulted with respect to the recommended plan and their views have been considered. The local agencies are in general accord with the plan as presented.
04 – SOL - 80 – PM R10.4/30.2
7
3. BACKGROUND
On April 22, 2009, the Metropolitan Transportation Commission (MTC) adopted the Transportation 2035 Plan for the San Francisco Bay Area (also referred to as Change in Motion). Plan Bay Area, adopted in July 18, 2013 is the current regional transportation plan (as mentioned later in section 3A).
3A. Project History
In February 2009, the STA Board approved an Express Lanes Priority Project List. This project is included on this list and under Tier 1 of the Transportation 2035 Plan, developed by MTC. The Transportation 2035 Plan was the Regional Transportation Plan (RTP) (adopted on April 22, 2009) until it was superseded by Plan Bat Area on July 18, 2013. The Transportation 2035 Plan identified I-80 as a priority corridor and a major gateway route. The Plan included a project to widen I-80 from Red Top Road to Air Base Parkway to add HOV lanes in both directions (number 230650). To increase the travel speed and reduce congestion on Bay Area highways, the RTP identified a regional network of express lanes. For I-80 in Solano County, the RTP included three express lane projects: (1) Number 230658 – I-80 in Solano County from Route 37 to Carquinez Bridge – widen to add an express lane in each direction, (2) Number 230659 – I-80 in Solano County from Yolo County line to Route 37 – widen to add an express lane in each direction from Yolo County line to Air Base Parkway and from Red Top Road to Route 37, and (3) Number 230660 – I-80 in Solano County from Red Top Road to Air Base Parkway – convert HOV lanes to express lanes. In November 2009, the I-80 HOV Lane Project (EA 04-0A5314) from Red Top Road to Air Base Parkway, in the City of Fairfield, was completed. The project widened the existing I-80 median to add over 9 miles of HOV lanes in both directions and constructed new concrete median barrier. The West Segment will convert these HOV lanes to express lanes. STA started preliminary studies for the conversion (West Segment) and widening (East Segment) segments of the project in 2010. STA is the lead agency responsible for planning, design and construction of the express lanes on I-80 in Solano County, in coordination with the Toll System Integrator design and implementation lead by BAIFA. On September 28, 2011, MTC submitted the Bay Area Express Lanes Public Partnership Application for High Occupancy Toll Lanes to the California Transportation Commission (CTC). The application, submitted in cooperation with Caltrans, requested authority to develop and implement 270 miles of express lanes within the Bay Area. The application included express lanes on I-80 from the San
04 – SOL - 80 – PM R10.4/30.2
8
Francisco/Oakland Bay Bridge to the Solano/Yolo County Line. This project is within these corridor limits and provides the link between I-505 and I-680. In October 2011, CTC approved MTC’s application for the planned integrated express lane network, in order to enhance mobility and afford greater user flexibility. This project is an integral element of the planned Express Lanes Network on I-80. MTC adopted Plan Bay Area on July 18, 2013 as the RTP. It is the successor to Transportation 2035 Plan. Plan Bay Area specifies how anticipated federal, state and local funds will be spent through 2040. Investment Strategy 4 in the Plan is to boost freeway and transit efficiency. Plan Bay Area includes a funding commitment over the next 28 years to support projects and programs that will boost system efficiency, one of which is the Regional Express Lane Network1, which will leverage revenues generated from pricing to improve existing system efficiency while expanding travel choice. The PSR-PDS for the Solano County I-80 Express Lanes Project was approved by Caltrans on April 4, 2012. The following two alternatives were considered:
Alternative A would provide improvements to the existing facility to implement continuous access express lanes in each direction. This alternative provided reduced environmental footprint and minimal right of way impacts but would require justification and approval of non-standard design features. The cost estimate (in 2015 dollars) was $195 million, which included capital outlay support ($44.5 million), right of way ($4.5 million), and construction ($146 million).
Alternative B would provide improvements to implement express lanes in each direction with ingress/egress access locations and a 4-foot buffer, as well as improvements to the existing facility to meet current design standards within the project limits. This alternative provided fewer non-standard design features, but there would be significant environmental and right of way impacts. The cost estimate (in 2015 dollars) was $1.4 billion, which included capital outlay support ($335 million), right of way ($75 million), and construction ($990 million).
The proposed project is comparable to Alternative A.
3B. Community Interaction
1. That Network is now identified as “Bay Area Express Lanes”. It includes the MTC Express Lanes, authorized by the CTC in 2011, as well as Alameda County Express Lanes and the Silicon Valley Express Lanes, for a total of 550 miles.
04 – SOL - 80 – PM R10.4/30.2
9
The communications and outreach plan developed for this project followed the overall BAIFA strategy for the BAIFA Phase 1 Projects. The public communications plan and program included information posted on websites, FAQs, master presentations, fact sheets, email communications and media support. The public information activities coincided with or was included as part of the BAIFA Phase 1 Project outreach activities. A Public Open Forum Hearing was held on August 4, 2015 at the Solano County Events Center. During the open forum hearing attendees were invited to view informational exhibits; maps of the project alignment; preliminary recommended soundwalls; environmental topics evaluated in the IS/EA; and current schedule and cost. Information about express lane operation, toll systems, toll signs and California Highway Patrol (CHP) enforcement areas was provided in that meeting. One comment from a community member, inquired about a possible increased noise level due to a newly constructed on-ramp lane near their residence. This community member requested a new noise survey be conducted once the project is operational.
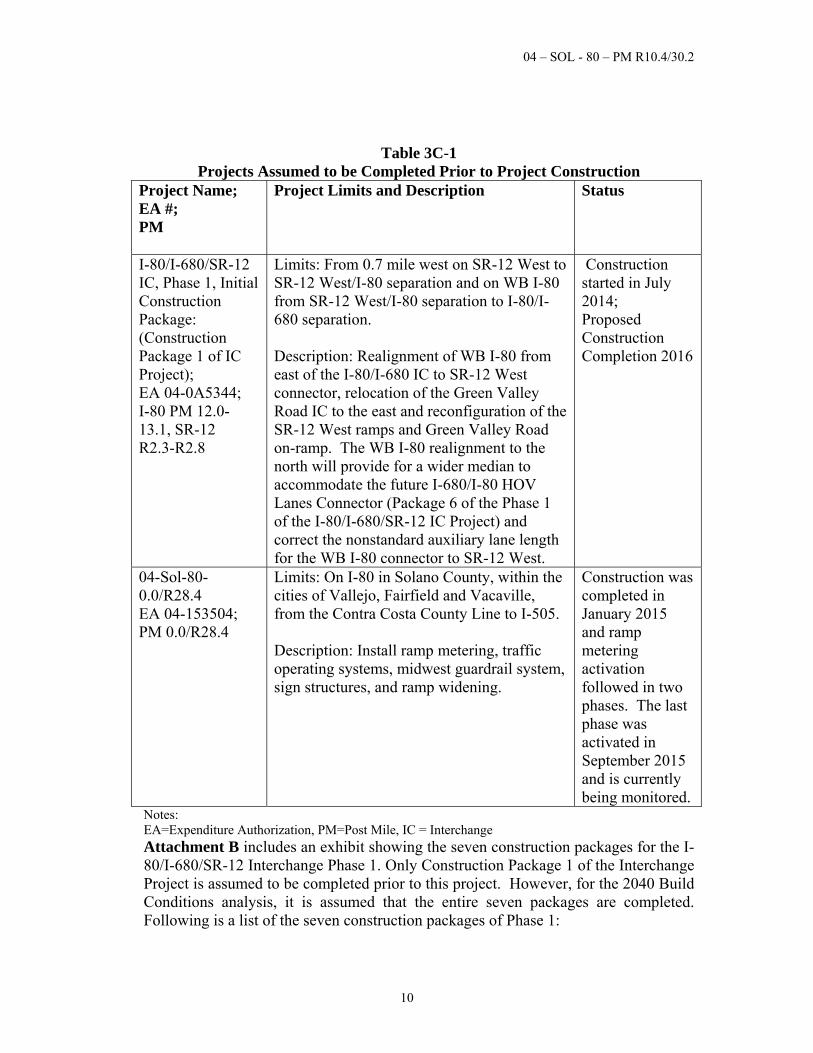
3C. Existing Facility I-80 is the main east-west interregional freeway that connects the San Francisco and Sacramento metropolitan areas, passing through the counties of San Francisco, Alameda, Contra Costa, Solano, and Yolo. The portion of I-80 through the cities of Fairfield and Vacaville is the most heavily-traveled segment of the I-80 corridor within Solano County, as it is utilized by commuters, recreational travelers, public transit services, and for interstate and interregional goods movement. Projects to be Completed Prior to Construction Table 3C-1 lists the projects assumed to be completed prior to construction of the project. The existing highway geometry on I-80 has been adjusted to include proposed improvements from the I-80/I-680/SR-12 Interchange, Phase 1, Initial Construction Package (EA 04-0A5344).
04 – SOL - 80 – PM R10.4/30.2
10
Table 3C-1 Projects Assumed to be Completed Prior to Project Construction
Project Name; EA #; PM
Project Limits and Description Status
I-80/I-680/SR-12 IC, Phase 1, Initial Construction Package: (Construction Package 1 of IC Project); EA 04-0A5344; I-80 PM 12.0-13.1, SR-12 R2.3-R2.8
Limits: From 0.7 mile west on SR-12 West to SR-12 West/I-80 separation and on WB I-80 from SR-12 West/I-80 separation to I-80/I-680 separation. Description: Realignment of WB I-80 from east of the I-80/I-680 IC to SR-12 West connector, relocation of the Green Valley Road IC to the east and reconfiguration of the SR-12 West ramps and Green Valley Road on-ramp. The WB I-80 realignment to the north will provide for a wider median to accommodate the future I-680/I-80 HOV Lanes Connector (Package 6 of the Phase 1 of the I-80/I-680/SR-12 IC Project) and correct the nonstandard auxiliary lane length for the WB I-80 connector to SR-12 West.
Construction started in July 2014; Proposed Construction Completion 2016
04-Sol-80-0.0/R28.4 EA 04-153504; PM 0.0/R28.4
Limits: On I-80 in Solano County, within the cities of Vallejo, Fairfield and Vacaville, from the Contra Costa County Line to I-505. Description: Install ramp metering, traffic operating systems, midwest guardrail system, sign structures, and ramp widening.
Construction was completed in January 2015 and ramp metering activation followed in two phases. The last phase was activated in September 2015 and is currently being monitored.
Notes: EA=Expenditure Authorization, PM=Post Mile, IC = Interchange Attachment B includes an exhibit showing the seven construction packages for the I-80/I-680/SR-12 Interchange Phase 1. Only Construction Package 1 of the Interchange Project is assumed to be completed prior to this project. However, for the 2040 Build Conditions analysis, it is assumed that the entire seven packages are completed. Following is a list of the seven construction packages of Phase 1:
04 – SOL - 80 – PM R10.4/30.2
11
Package 1 – I-80/I-680/SR-12 IC, Phase 1, Initial Construction Package Package 2 – I-680/Red Top Road Interchange, Lopes Road Realignment Package 3 – WB I-80 Connector to SB I-680 Package 4 – NB I-680 & EB SR-12 West Connectors to EB I-80 Package 5 – SR-12 West/Red Top Road/Business Center Drive Improvements Package 6 – I-680/I-80 HOV Connector Package 7 – I-80/UPRR Crossing (Cordelia Underpass) and complete NB I-
680 to WB I-80 and EB I-80 to SB I-680 Connectors
Existing Facility within the Specified Segments The West Segment, from west of Red Top Road to Air Base Parkway, is approximately nine miles long and is located primarily within the City of Fairfield. The East Segment, from Air Base Parkway to east of I-505, is approximately eleven miles long and is located within the cities of Fairfield and Vacaville and unincorporated areas of Solano County. The following subsections describe the existing facility within the specified segments: West Segment: I-80 is a divided freeway separated by a concrete median barrier except for the segment of thrie beam barrier west of SR-12 East Overcrossing (approximately PM 14.77 to PM 15.1). This area is within the base floodplain. The thrie beam barrier allows a flow path across the freeway in the event of overtopping of Suisun Creek. The HOV lane is 11.8 to 14 feet wide and the general purpose lanes vary from 10.8 to 12 feet wide. The outside shoulder is 10 feet wide except at some locations where it varies from 6.5 feet to 9.8 feet. The inside shoulder varies from 2 feet to 10 feet except around Red Top Road Undercrossing where the inside shoulder widens to 18 feet maximum. The median width ranges from 6 to 22 feet wide with a wider median between SR-12 West and the I-680 interchange to accommodate the improvements associated with the I-80/I-680/SR-12 Interchange Project. The alignment is generally on tangent except through the SR-12 West and I-680 interchanges (PM R11.98 thru PM 12.84) and around the West Texas Street Undercrossing (PM 17.20). The freeway is elevated above existing ground level and the WB lanes are slightly higher than the EB lanes west of the Cordelia Truck Scales and around the West Texas Street Undercrossing. The HOV lanes in the West Segment were opened to traffic in 2009 as part of the I-80 HOV Project from Red Top Road to Air Base Parkway (EA 04-0A5314). In the I-80 EB direction, the HOV lane starts approximately 400 feet east of Red Top Road Undercrossing (PM R11.45) and ends east of Air Base Parkway Overcrossing with a sign at PM 19.58 (approximately 2,400 feet west of Putah South Canal), and the lane drops 1,300 feet after the sign. In the WB direction, the HOV lane starts at PM 20.02
04 – SOL - 80 – PM R10.4/30.2
12
(adjacent to Putah South Canal) and ends west of the SR-12 West Overcrossing with a sign at PM R11.92; however, the I-80/I-680/SR-12 Interchange, Phase 1, Initial Construction Package will end the HOV lane east of SR-12 West Overcrossing with a sign at PM 12.38. The HOV lanes are contiguous within the project area and restricted to two or more persons per vehicle during the AM (5:00 AM to 10:00 AM) and PM (3:00 PM to 7:00 PM) peak commute hours on weekdays. Transit, motorcycles, and clean air vehicles with low-emissions, compressed natural gas (CNG) vehicles, and certain hybrid vehicles (with 45 miles per gallon or greater fuel economy highway rating) are allowed in the HOV during AM and PM peak commute time. The HOV lanes are used as general purpose lanes during all other weekday hours and on a 24-hour basis on weekends. West of Red Top Road Undercrossing, the mainline has four general purpose lanes. Between Red Top Road and Air Base Parkway, the mainline has one HOV and four general purpose lanes except between I-680 and SR-12 East where there is a fifth general purpose lane. There are auxiliary lanes within the following locations: from SR-12 West on-ramp to I-680/Green Valley Rd off-ramp; from east of EB Truck Scales off-ramp to SR-12 East off-ramp; from Abernathy Rd on-ramp to Auto Mall Parkway off-ramp; from Beck Ave on-ramp to Travis Blvd off-ramp; and at the approach to Air Base Parkway off-ramp (1200 feet long). From Red Top Road to SR-12 East, the HOV lanes are 11.8 feet wide and from SR-12 East to Air Base Parkway, the HOV lanes are 14 feet wide. West Segment will convert the existing HOV lanes to 12-foot wide express lanes. There is a CHP Observation and Median Enforcement Area on EB I-80 between the SR-12 West and Green Valley Road Overcrossings. There is a bi-directional CHP Observation and Median Enforcement Area on EB and WB I-80 between Suisun Creek Bridge and SR-12 East Overcrossing. There are twelve interchanges and seven creeks within this segment. Within the West Segment, there are four soundwalls along I-80 at the following locations:
1. EB I-80 and south of Travis Boulevard (Sta “M” 443+50 to “ET” 467+80.99) 2. WB I-80 and south of Air Base Parkway (Sta “M” 484+00 to “M” 508+00) 3. EB I-80 and south of Air Base Parkway (Sta “M” 491+00 to “M” 520+00) 4. EB I-80 and north of Air Base Parkway (Sta “M” 539+00 to “M” 576+00)
East Segment: The East Segment will widen I-80 for new express lanes. In the EB direction, the new express lanes will begin at the end of the existing HOV lanes and end at PM 28.9 (east of the I-505 Connector). In the WB direction, the new express lanes begin at PM 29.15 (east of the I-505 Connector) and end at the beginning of the existing HOV lanes. The express lanes will vary from 11 feet to 12 feet. It is expected that the improvement will enhance mobility for all commuters on I-80 further east to I-505; facilitate alternatives to single-occupancy vehicles on I-80;
04 – SOL - 80 – PM R10.4/30.2
13
encourage carpooling by allowing eligible vehicles to bypass congestion in the general purpose lanes thus providing travel time savings for HOV users; increase person throughput (i.e., number of people moved) on I-80 in Solano County between Air Base Parkway and I-505; and improve safety. A traffic study, as described in the Traffic Operations Policy Directive 11-02, Managed Lanes Engineering Study Requirements as a composition of an operational analysis and a safety analysis, was prepared to determine the operational impact due to the proposed express lane and access openings on a continuous-access design and safety impact on operating conditions and the potential for collision due to the proposed improvements. This traffic study replaces the HOV Report per Appendix B of the HOV Guidelines. I-80 has four general purpose lanes in each direction. The general purpose lanes are 12 feet wide, the outside shoulder varies from 8 feet to 10 feet, and the inside shoulder varies from 4 feet to 10 feet. The median width varies from 36 feet to 99 feet with oleanders, temporary railing (Type-K), and thrie-beam barrier in the areas of grade differential between the EB and WB lanes. The barriers are mostly placed at the edge of the pavement within the median. An auxiliary lane exists at EB Allison on-ramp to Nut Tree Boulevard off-ramp. There are eleven interchanges, nine creeks (four creek bridges and five other creek culvert crossings) and one canal within this segment. Within the East Segment, there are five soundwalls along I-80 at the following locations:
1. WB I-80 and south of Goya Drive (Sta "M" 549+11 to 555+70) 2. WB I-80 near Montclair Way (Sta "M" 558+33 to 574+28) 3. WB I-80 and south of Alamo Drive (Sta "M" 840+40 to 846+70) 4. EB I-80 and south of Davis Street (Sta "M" 856+00 to 869+33) 5. WB I-80 and south of Davis Street (Sta "M" 860+54 to 882+33)
04 – SOL - 80 – PM R10.4/30.2
14
4. PURPOSE AND NEED Purpose: I-80 is heavily-traveled by commuters living in Solano County, traffic to and from Sacramento, recreational travelers on weekends, and interstate travel including the movement of freight and goods. The project will provide EB and WB express lanes on I-80 from Red Top Road to I-505, through the cities of Fairfield and Vacaville, which is the most heavily-traveled segment of I-80 within Solano County. This segment of I-80 is physically constrained, including right of way limitations, sensitive resources, and urban development on either side of the corridor. The purpose of the project is to provide an immediate benefit to the traveling public by maximizing the use of the existing infrastructure in a limited/constrained right of way to move vehicles through the corridor efficiently. The project will:
Offer non-carpool eligible drivers more reliable travel times
Improve public transit utilization by reducing public transit travel times in the corridor
Increase vehicle and passenger throughput and decrease congestion by: o Better utilization of existing HOV lane capacity from Red Top Road to
east of Air Base Parkway o Increasing capacity to meet existing and future travel demand from
east of Air Base Parkway to I-505
Need: The existing HOV lanes, between Red Top Road and Air Base Parkway are under-utilized during peak congestion periods. During 2011, passenger occupancy counts were performed. The HOV lane volumes ranged from 198 to 396 vehicles during the AM peak hours and 297 to 561 vehicles during the PM peak hours. Utilization rates were calculated based on the HOV lane capacity of 1,650 vehicles per hour per lane (vphpl), which is the typical acceptable flow rate for an HOV lane. HOV utilization rates ranged from 12 to 24 percent during the AM peak hours and 18 to 34 percent during the PM peak hours. Therefore, the available capacity ranges between 76 to 88 percent during the AM peak hours and 66 to 82 percent during PM peak hours. This under-utilized capacity in the HOV lane, results in increased congestion and slower speeds in the general purpose lanes during peak congestion periods (see Table 4C-5, Existing Freeway Performance)
04 – SOL - 80 – PM R10.4/30.2
15
4A. Problem, Deficiencies, Justification Congestion in the Corridor: Existing Congestion Issues: No significant bottlenecks or traffic congestion was observed along I-80 during weekday peak periods. EB I-80: During both the weekday AM and PM peak hours, some slowing occurs on EB I-80. Factors that contribute to slowing of traffic between the I-680 Interchange and the SR-12 East (to Rio Vista) Interchange include closely spaced ramps, high vehicular volumes merging and diverging at the I-680 and SR-12 East interchanges, and truck movements to and from the Cordelia Truck Scales. Factors that contribute to slowing of traffic between Travis Boulevard and Lagoon Valley Road/Cherry Glen Road include high volumes associated with popular destinations such as Travis Air Force Base and retail areas within the Solano Mall, the curvature of the roadway near Lagoon Valley Road/Cherry Glen Road, and the roadway grades near Lagoon Valley Road/Cherry Glen Road. WB I-80: During both weekday AM and PM peak hours, slowing occurs on WB I-80. Factors that contribute to the slowing of traffic between the SR-12 East and I-680 interchanges include closely spaced ramps, high vehicular volumes entering and exiting at the I-680 and SR-12 interchanges, and truck movements to and from the Cordelia Truck Scales. The factor that contributes to slowing of WB I-80 traffic between Jameson Canyon Road/SR-12 West and Red Top Road is the lane drop from five lanes to four lanes.
Future Congestion Issues: No significant bottlenecks or traffic congestion was observed along I-80 during weekday peak periods.
WB I-80 (2020 No Build Condition): Traffic conditions will get worse in the near-term (2020) in certain segments throughout the WB direction within the project corridor, specifically during the AM peak hour. The level of service (LOS) at the following locations will decrease to LOS D:
o I-80 between Mason Street and Davis Street o I-80 between Davis Street and Alamo Drive o I-80 between Alamo Drive and Cherry Glen Road o I-80 between Cherry Glen Road and Pena Adobe Road/Rivera
Road/Pleasant Valley Road o I-80 between Pena Adobe Road/Rivera Road/Pleasant Valley Road
and Lagoon Valley Road/Cherry Glen Road
04 – SOL - 80 – PM R10.4/30.2
16
o I-80 between Lagoon Valley Road/Cherry Glen Road and Manuel Campos Parkway/N. Texas Street
o I-80 between Manuel Campos Parkway/N. Texas Street and Air Base Parkway/Waterman Boulevard
o I-80 between Air Base Parkway/Waterman Boulevard and Travis Boulevard
o I-80 between W. Texas Street/Rockville Road and Abernathy Road o I-80 between Abernathy Road and SR 12 East o I-80 between SR 12 East and truck scale
I-80 between the truck scale and Suisun Valley Road/Pittman Road will decrease to LOS E. Near-term (2020 No Build condition) decreases in LOS will occur at the following locations during the PM peak hour:
o I-80 between Mason Street and Davis Street o I-80 between Cherry Glen Road and Pena Adobe Road/Rivera
Road/Pleasant Valley o I-80 between Truck Scale and Suisun Valley Road/Pittman Road
Generally, all segments of WB I-80 operate at a LOS D or better except for I-80 between the Truck Scale and Suisun Valley Road/Pittman Road which operates at a LOS E. This segment experiences congestion and queuing because of some merging issues experienced by trucks trying to merge from the westbound truck scale on-ramp.
WB I-80 (2040 No Build Condition): Long-term (2040 No Build condition) decreases in LOS (LOS D or E) will occur at the following locations during AM peak hours:
o I-80 between I-505 and E. Monte Vista Avenue (LOS D) o I-80 between E. Monte Vista Avenue and Mason Street (LOS D) o I-80 between Mason Street and Davis Street (LOS E) o I-80 between Davis Street and Alamo Drive (LOS E) o I-80 between Alamo Drive and Cherry Glen Road (LOS E) o I-80 between Cherry Glen Road and Pena Adobe Road/Rivera
Road/Pleasant Valley Road (LOS D) o I-80 between Pena Adobe Road/Rivera Road/Pleasant Valley Road
and Lagoon Valley Road/Cherry Glen Road (LOS D) o I-80 between Lagoon Valley Road/Cherry Glen Road and Manuel
Campos Parkway/N. Texas Street (LOS D)
04 – SOL - 80 – PM R10.4/30.2
17
o I-80 between Manuel Campos Parkway/N. Texas Street and Air Base Parkway/Waterman Boulevard (LOS D)
o I-80 between Air Base Parkway/Waterman Boulevard and Travis Boulevard (LOS D)
o I-80 between Travis Boulevard and W. Texas Street/Rockville Road (LOS D)
o I-80 between W. Texas Street/Rockville Road and Abernathy Road (LOS E)
o I-80 between Abernathy Road and SR 12 East (LOS D) o I-80 between SR 12 East and Truck Scale (LOS E) o I-80 between Truck Scale and Suisun Valley Road/Pittman Road (LOS
E) o I-80 between Suisun Valley Road/Pittman Road and Green Valley
(LOS D) o I-80 between Red Top Road and American Canyon Road (LOS D)
Long-term (2040 No Build Condition) decreases in LOS (LOS D or E) will occur at the following locations during PM peak hours:
o I-80 between Leisure Town Road and I-505 (LOS D) o I-80 between I-505 and E. Monte Vista Avenue (LOS D) o I-80 between E. Monte Vista Avenue and Mason Street (LOS D) o I-80 between Mason Street and Davis Street (LOS E) o I-80 between Davis Street and Alamo Drive (LOS E) o I-80 between Alamo Drive and Cherry Glen Road (LOS E) o I-80 between Cherry Glen Road and Pena Adobe Road/Rivera
Road/Pleasant Valley (LOS D) o I-80 between Pena Adobe Road/Rivera Road/Pleasant Valley and
Lagoon Valley Road/Cherry Glen Road (LOS D) o I-80 between Lagoon Valley Road/Cherry Glen Road and Manual
Campos Parkway/N. Texas Street (LOS D) o I-80 between Manuel Campos Parkway/N. Texas Street and Air Base
Parkway/Waterman Boulevard (LOS D) o I-80 between Air Base Parkway/Waterman Boulevard and Travis
Boulevard (LOS D) o I-80 between W Texas Street/Rockville Road and Abernathy Road
(LOS D) o I-80 between Abernathy Road and SR-12 East (LOS D) o I-80 between SR 12 East and Truck Scale (LOS D)
04 – SOL - 80 – PM R10.4/30.2
18
o I-80 between Truck Scale and Suisun Valley Road/Pittman Road (LOS E)
o I-80 between Red Top Road and American Canyon Road (LOS D)
EB I-80 (2020 No Build Condition): The EB direction will also experience a decrease in LOS in 2020 during the PM peak hour. Levels of service will decrease to LOS D at the following locations:
o I-80 between SR-12 West and I-680 o I-80 between I-680 and Suisun Valley Road/Pittman Road o I-80 between Suisun Valley Road/Pittman Road and Truck Scales o I-80 between SR-12 East and Abernathy Road o I-80 between Abernathy Road and W Texas Street o I-80 between W Texas Street and Beck Avenue o I-80 between Beck Avenue and Travis Boulevard o I-80 between Travis Boulevard and Air Base Parkway/Waterman
Boulevard o I-80 between Air Base Parkway/Waterman Boulevard and Manuel
Campos Parkway/N. Texas Street o I-80 between Manuel Campos Parkway /N. Texas Street and Lagoon
Valley Road/Cherry Glen Road o I-80 between Lagoon Valley Road/Cherry Glen Road and Pena Adobe
Road/Rivera Road/Cherry Glen Road o I-80 between Pena Adobe Road/Rivera Road/Cherry Glen Road and
Alamo Drive o I-80 between Alamo Drive and Davis Street o I-80 between Davis Street and Peabody Road o I-80 between Peabody Road and Monte Vista Avenue/Allison
Drive/Nut Tree Parkway
EB I-80 (2040 No Build Condition): Long-term (2040 No Build condition) decreases in LOS (LOS D or E) will occur at the following locations during weekday PM peak hours:
o I-80 west of American Canyon Road (LOS D) o I-80 between American Canyon Road and Red Top Road (LOS D) o I-80 between Route 680/SR 12 and Green Valley/Lopes Road (LOS
D) o I-80 between Green Valley/Lopes Road and Suisun Valley
Road/Pittman Road (LOS D) o I-80 between Suisun Valley Road/Pittman Road and Truck Scales
(LOS D)
04 – SOL - 80 – PM R10.4/30.2
19
o I-80 between SR-12 East and Abernathy Road (LOS D) o I-80 between Abernathy Drive and W Texas Street (LOS D) o I-80 between W Texas Street and Beck Avenue (LOS D) o I-80 between Beck Avenue and Travis Boulevard (LOS E) o I-80 between Travis Boulevard and Air Base Parkway/Waterman
Boulevard (LOS D) o I-80 between Air Base Parkway/Waterman Boulevard and Manuel
Campos Parkway/N. Texas Street (LOS D) o I-80 between Manuel Campos Parkway/N. Texas Street and Lagoon
Valley Road/Cherry Glen Road (LOS E) o I-80 between Lagoon Valley Road/Cherry Glen Road and Pena Adobe
Road/Rivera Road/Cherry Glen (LOS E) o I-80 between Pena Adobe Road/Rivera Road/Cherry Glen and Alamo
Drive (LOS E) o I-80 between Alamo Drive and Davis Street (LOS D) o I-80 between Davis Street and Peabody Road (LOS E) o I-80 between Peabody Road and Monte Vista Avenue/Allison
Drive/Nut Tree Parkway (LOS D) o I-80 between I-505/Orange Drive and Leisure Town Road (LOS D)
Public Transit Utilization: A number of public transit operators use the corridor (See Section 4B). By having to travel in the general purpose lanes of the East Segment, transit vehicles do not provide a significant travel time savings over single-occupant vehicles in this portion of the corridor. This reduces the incentive for commuters and other travelers to utilize transit options along the I-80 corridor. This project will enhance transit operations along the I-80 corridor by providing approximately 18 miles of continuous express lane access to Transit Operators from Red Top Road near Fairfield to I-505 in Vacaville. Regional and System Planning Identify Systems I-80 has been identified by the State as part of the Interregional Road System, and is a major transcontinental interstate between the San Francisco Bay Area and the East Coast. I-80 serves as the single freeway connection between the San Francisco Bay Area and the Sacramento metropolitan region. It is vital to commuting, freight and recreational traffic and is one of the most congested freeway facilities in the region. The highway also provides connectivity to I-5 to the north via I-505.
04 – SOL - 80 – PM R10.4/30.2
20
State Planning I-80 is part of the Interregional Road System and is classified as an Urban High Emphasis Route connecting the Bay Area with the Central Valley. With the passage of the Highway Safety, Traffic Reduction, Air Quality and Port Security Bond Act, known as Proposition 1B, in November 2006, Caltrans implemented the Corridor System Management Plan (CSMP) for all corridors with projects funded by the Corridor Mobility Improvement Act (CMIA) Program. Within Solano County, two projects received CMIA and Trade Corridors Improvement Fund (TCIF) funding: (1) CMIA: HOV Lanes, Fairfield (Route 80/680/12 to Putah Creek) and (2) TCIF: WB I-80 to SR 12 (West) Connector and Green Valley Road Interchange Improvements. In coordination with MTC and STA, Caltrans developed a CSMP for the I-80 East Corridor. The corridor limits extend from the Carquinez Bridge (Solano/Contra Costa County line) to the SR-113 North Junction. It is approximately 43 miles in length and intersects Interstates 780, 680, 505, and State Routes 29, 37, 12, and 113. The CSMP also supports the Governor’s Strategic Growth Plan (SGP), which calls for an infrastructure improvement program that includes a major transportation component (GoCalifornia). The I-80 East CSMP was completed in October 2010 and presents a performance assessment of the corridor and recommended strategies and improvements. The project’s limits from Red Top Road to east of I-505, closely align with Segments D and E in the I-80 East CSMP. Two of the top three current congested locations and three of the four current bottlenecks identified in the CSMP’s performance assessment of the corridor fall within the project limits. I-80 East CSMP – Current Congested Locations within Project Limits
PM EB I-80: I-680 to SR-12 East AM WB I-80: W. Texas Street to I-680
I-80 East CSMP – Current Bottleneck Locations within Project Limits
WB I-80/Exit to SR-12 West EB I-80/I-680 on-ramp EB I-80/Between Travis Boulevard on-ramp and Air Base Parkway off-ramp
Consistent with the proposed scope of this project, the I-80 East CSMP recommended corridor management strategies to meet the goals of mobility, reliability and safety by extending the HOV Lanes from Air Base Parkway to I-505 which would encourage additional use of HOV lanes and relieve congestion in the general purpose lanes.
04 – SOL - 80 – PM R10.4/30.2
21
Regional Planning The MTC 2009 Regional Transportation Plan, Transportation 2035, identified a Bay Area Express Lane Network to increase travel speed and reduce congestion on Bay Area Highways. The Plan identified I-80 as a priority corridor and a major gateway route. This project is an integral element of the Bay Area Express Lane Network. Local Planning The STA's Comprehensive Transportation Plan (CTP 2030) for Solano County envisions, directs, and prioritizes the transportation needs of Solano County through the year 2030. It incorporates various STA studies and plans into a 25-year planning document. The CTP 2030 was adopted by the STA Board of Directors on June 8, 2005. The goal for arterials, highways, and freeways is to develop a balanced transportation system that reduces congestion and improves access and travel choices through the enhancement of roads. One of the objectives in meeting that goal is to add HOV lanes through implementation of HOV lane projects on I-80 and I-680, as identified in the I-80/I-680/I-780 Major Investment & Corridor Study. The I-80/I-680/I-780 Major Investment & Corridor Study was adopted by the STA Board in July 2004 and includes the project to construct HOV lanes on I-80 in both directions between Air Base Parkway and I-505 in its long range improvement plan. In 2008, the STA Board authorized an update to CTP 2030, which will cover the 2009-2035 time period. In February 2010, the STA Board adopted the Solano Highways Operations Study (SHOS). Previously called the I-80/I-680/I-780 Corridors Highway Operations Study & Implementation Plan, the study analyzes the performance and safety of Solano County's interstate highway corridors and recommends a variety of operations improvements as well as visual guidelines for landscape and hardscape treatments. This study was developed through the Solano Highways Partnership (SoHIP), which includes staff from STA, MTC, the Sacramento Area Council of Governments, Caltrans Districts 3 and District 4, and the cities of Benicia, Dixon, Fairfield, Vacaville, and Vallejo. Similar to earlier plans, and the East I-80 CSMP, extending the HOV lanes from Air Base Parkway to I-505 is identified as a priority project in the SHOS. The STA Board approved the Express Lanes Priority Project List in February 2009. The top two priority projects are to convert the existing HOV lanes from Red Top Road to Air Base Parkway to express lanes, and to construct express lanes from Air Base Parkway to I-505 in each direction. These two projects are now combined into this project – the proposed I-80 Express Lanes Project from Red Top Road to I-505.
04 – SOL - 80 – PM R10.4/30.2
22
Transit Operator Planning Fairfield and Suisun Transit, Rio Vista Delta Breeze, Vallejo Transit and Yolo Bus operate public bus systems within the project limits. In addition, Fairfield and Suisun Transit operates Solano Express regional routes, Americans with Disabilities Act paratransit service and a reduced fare taxi program. Bus routes utilizing the corridor within the project limits include:
Fairfield and Suisun Transit Express Bus Routes 20, 30, 40, and 90 Delta Breeze Routes 50 and 52 Vallejo Transit Bus Route 85 Yolo Bus Route 220
In addition, private transit services, such as recreational buses to the Lake Tahoe region and the University of California Intercampus Bus between Davis and Berkeley use the corridor.
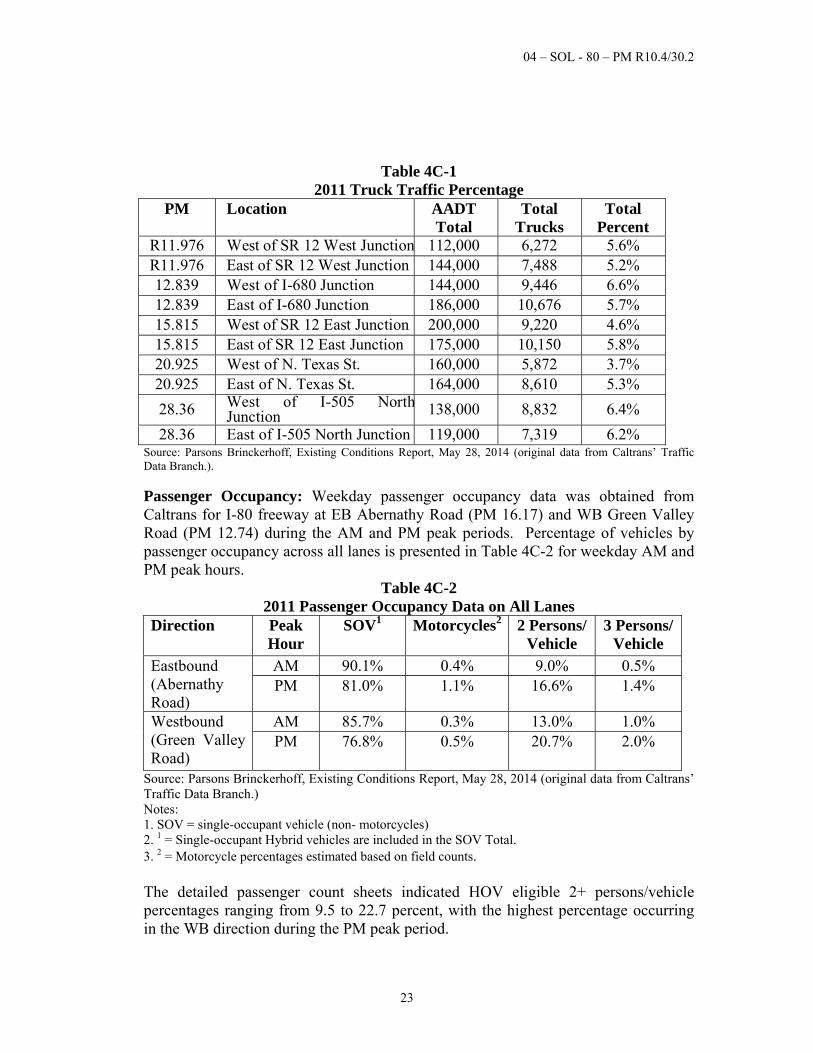
4B. Traffic The 2020 Build Alternative assumed completion of the Initial Construction Package (ICPs) and Package 2 of the (I-80/I-680/SR-12 interchange project, in the approved Traffic Operations Analysis Report (TOAR) dated July 28, 2014. ICP is in construction and is scheduled for completion by the end of 2016. Package 2, the I-680/Red Top Road interchange, was re-designed to a partial interchange (eliminated north side ramps) after the TOAR was approved and is currently in the final design phase. A separate Technical Memorandum to supplement the TOAR will be prepared to determine if the Package 2 re-design significantly impacts traffic at Red Top Road on Route 80 and to evaluate the effect the changes to Package 2 may have on the traffic operations analysis of the I-80 Express Lanes (Build Alternative) project. This Traffic Memorandum will be submitted to Caltrans as part of the I-80 Express Lanes 35% design submittal. Current and Forecasted Traffic Truck Traffic Percentages: 2011 daily heavy vehicle volume survey was conducted by Caltrans. The truck traffic total percentages, ranging from 3.7 to 6.6 percent, are presented in Table 4C-1, with the highest percentage west of I-680 South Junction.
04 – SOL - 80 – PM R10.4/30.2
23
Table 4C-1
2011 Truck Traffic Percentage PM Location AADT
TotalTotal
TrucksTotal
Percent R11.976 West of SR 12 West Junction 112,000 6,272 5.6% R11.976 East of SR 12 West Junction 144,000 7,488 5.2% 12.839 West of I-680 Junction 144,000 9,446 6.6% 12.839 East of I-680 Junction 186,000 10,676 5.7% 15.815 West of SR 12 East Junction 200,000 9,220 4.6% 15.815 East of SR 12 East Junction 175,000 10,150 5.8% 20.925 West of N. Texas St. 160,000 5,872 3.7% 20.925 East of N. Texas St. 164,000 8,610 5.3%
28.36 West of I-505 NorthJunction 138,000 8,832 6.4%
28.36 East of I-505 North Junction 119,000 7,319 6.2% Source: Parsons Brinckerhoff, Existing Conditions Report, May 28, 2014 (original data from Caltrans’ Traffic Data Branch.).
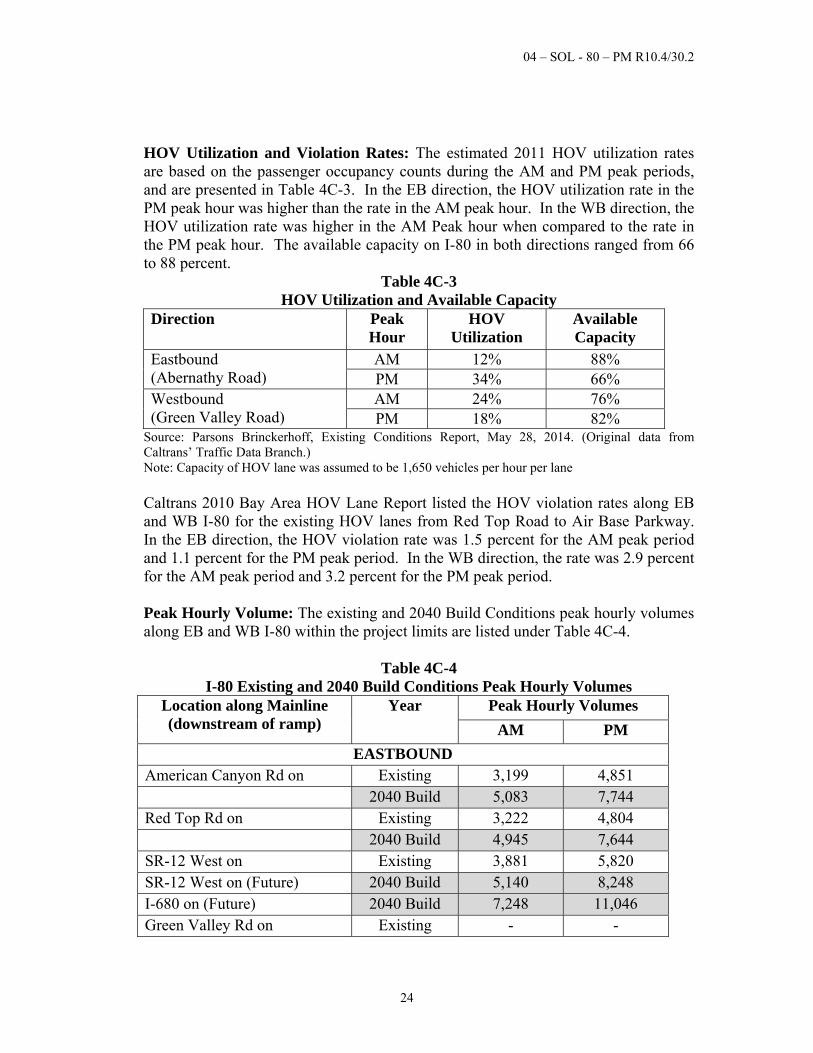
Passenger Occupancy: Weekday passenger occupancy data was obtained from Caltrans for I-80 freeway at EB Abernathy Road (PM 16.17) and WB Green Valley Road (PM 12.74) during the AM and PM peak periods. Percentage of vehicles by passenger occupancy across all lanes is presented in Table 4C-2 for weekday AM and PM peak hours.
Table 4C-2 2011 Passenger Occupancy Data on All Lanes
Direction Peak Hour
SOV1 Motorcycles2 2 Persons/ Vehicle
3 Persons/Vehicle
Eastbound (Abernathy Road)
AM 90.1% 0.4% 9.0% 0.5% PM 81.0% 1.1% 16.6% 1.4%
Westbound (Green Valley Road)
AM 85.7% 0.3% 13.0% 1.0% PM 76.8% 0.5% 20.7% 2.0%
Source: Parsons Brinckerhoff, Existing Conditions Report, May 28, 2014 (original data from Caltrans’ Traffic Data Branch.) Notes: 1. SOV = single-occupant vehicle (non- motorcycles) 2. 1 = Single-occupant Hybrid vehicles are included in the SOV Total. 3. 2 = Motorcycle percentages estimated based on field counts. The detailed passenger count sheets indicated HOV eligible 2+ persons/vehicle percentages ranging from 9.5 to 22.7 percent, with the highest percentage occurring in the WB direction during the PM peak period.
04 – SOL - 80 – PM R10.4/30.2
24
HOV Utilization and Violation Rates: The estimated 2011 HOV utilization rates are based on the passenger occupancy counts during the AM and PM peak periods, and are presented in Table 4C-3. In the EB direction, the HOV utilization rate in the PM peak hour was higher than the rate in the AM peak hour. In the WB direction, the HOV utilization rate was higher in the AM Peak hour when compared to the rate in the PM peak hour. The available capacity on I-80 in both directions ranged from 66 to 88 percent.
Table 4C-3 HOV Utilization and Available Capacity
Direction Peak Hour
HOV Utilization
Available Capacity
Eastbound (Abernathy Road)
AM 12% 88% PM 34% 66%
Westbound (Green Valley Road)
AM 24% 76% PM 18% 82%
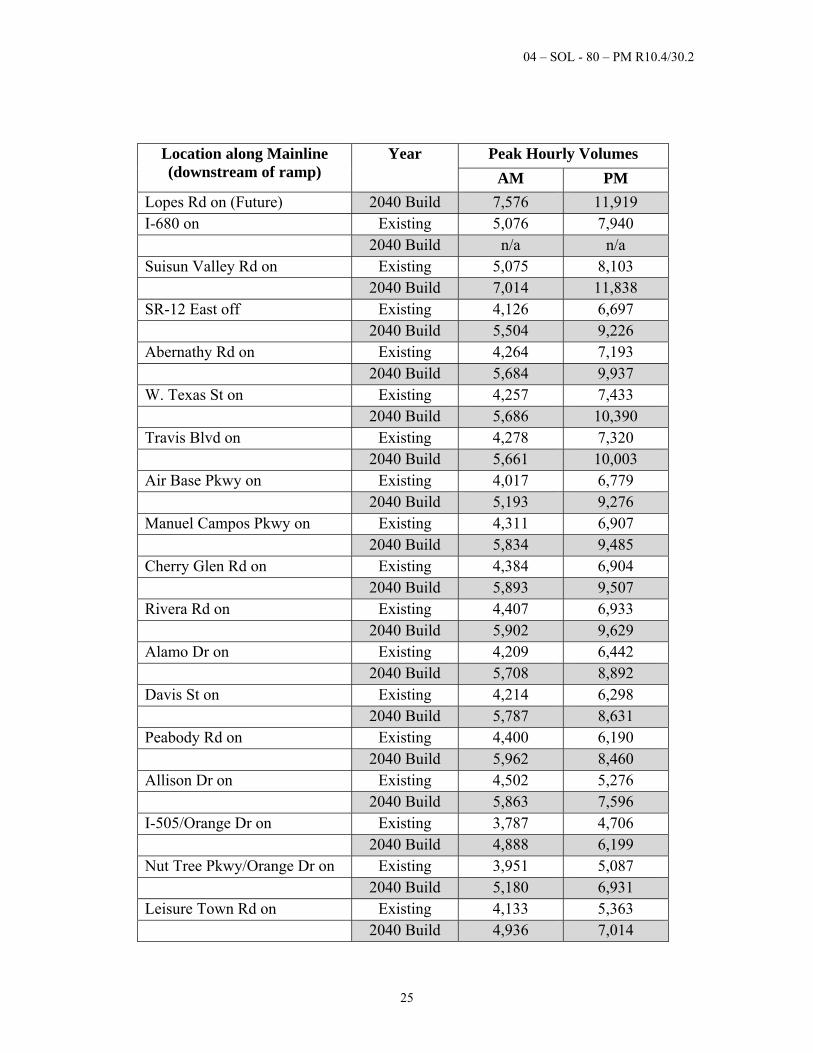
Source: Parsons Brinckerhoff, Existing Conditions Report, May 28, 2014. (Original data from Caltrans’ Traffic Data Branch.) Note: Capacity of HOV lane was assumed to be 1,650 vehicles per hour per lane Caltrans 2010 Bay Area HOV Lane Report listed the HOV violation rates along EB and WB I-80 for the existing HOV lanes from Red Top Road to Air Base Parkway. In the EB direction, the HOV violation rate was 1.5 percent for the AM peak period and 1.1 percent for the PM peak period. In the WB direction, the rate was 2.9 percent for the AM peak period and 3.2 percent for the PM peak period. Peak Hourly Volume: The existing and 2040 Build Conditions peak hourly volumes along EB and WB I-80 within the project limits are listed under Table 4C-4.
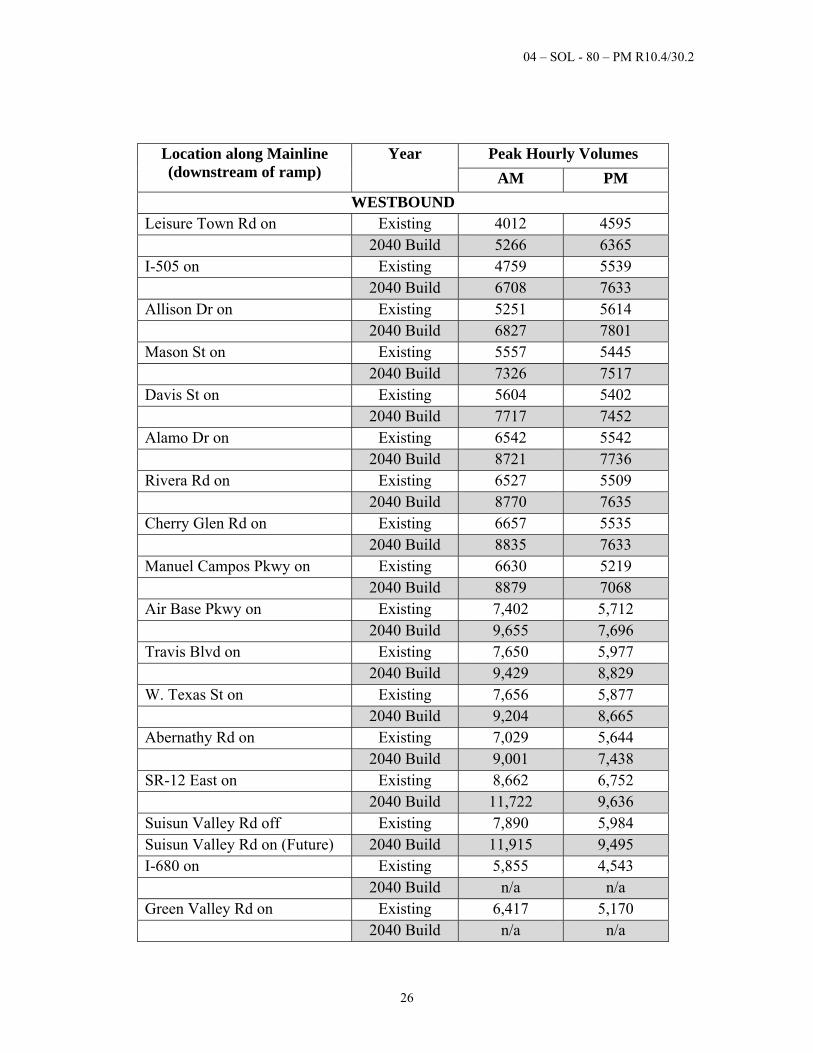
Table 4C-4 I-80 Existing and 2040 Build Conditions Peak Hourly Volumes
Location along Mainline (downstream of ramp)
Year Peak Hourly Volumes
AM PM
EASTBOUND American Canyon Rd on Existing 3,199 4,851 2040 Build 5,083 7,744 Red Top Rd on Existing 3,222 4,804 2040 Build 4,945 7,644 SR-12 West on Existing 3,881 5,820 SR-12 West on (Future) 2040 Build 5,140 8,248 I-680 on (Future) 2040 Build 7,248 11,046 Green Valley Rd on Existing - -
04 – SOL - 80 – PM R10.4/30.2
25
Location along Mainline (downstream of ramp)
Year Peak Hourly Volumes
AM PM
Lopes Rd on (Future) 2040 Build 7,576 11,919 I-680 on Existing 5,076 7,940 2040 Build n/a n/a Suisun Valley Rd on Existing 5,075 8,103 2040 Build 7,014 11,838 SR-12 East off Existing 4,126 6,697 2040 Build 5,504 9,226 Abernathy Rd on Existing 4,264 7,193 2040 Build 5,684 9,937 W. Texas St on Existing 4,257 7,433 2040 Build 5,686 10,390 Travis Blvd on Existing 4,278 7,320 2040 Build 5,661 10,003 Air Base Pkwy on Existing 4,017 6,779 2040 Build 5,193 9,276 Manuel Campos Pkwy on Existing 4,311 6,907 2040 Build 5,834 9,485 Cherry Glen Rd on Existing 4,384 6,904 2040 Build 5,893 9,507 Rivera Rd on Existing 4,407 6,933 2040 Build 5,902 9,629 Alamo Dr on Existing 4,209 6,442 2040 Build 5,708 8,892 Davis St on Existing 4,214 6,298 2040 Build 5,787 8,631 Peabody Rd on Existing 4,400 6,190 2040 Build 5,962 8,460 Allison Dr on Existing 4,502 5,276 2040 Build 5,863 7,596 I-505/Orange Dr on Existing 3,787 4,706 2040 Build 4,888 6,199 Nut Tree Pkwy/Orange Dr on Existing 3,951 5,087 2040 Build 5,180 6,931 Leisure Town Rd on Existing 4,133 5,363 2040 Build 4,936 7,014
04 – SOL - 80 – PM R10.4/30.2
26
Location along Mainline (downstream of ramp)
Year Peak Hourly Volumes
AM PM
WESTBOUND Leisure Town Rd on Existing 4012 4595 2040 Build 5266 6365 I-505 on Existing 4759 5539 2040 Build 6708 7633 Allison Dr on Existing 5251 5614 2040 Build 6827 7801 Mason St on Existing 5557 5445 2040 Build 7326 7517 Davis St on Existing 5604 5402 2040 Build 7717 7452 Alamo Dr on Existing 6542 5542 2040 Build 8721 7736 Rivera Rd on Existing 6527 5509 2040 Build 8770 7635 Cherry Glen Rd on Existing 6657 5535 2040 Build 8835 7633 Manuel Campos Pkwy on Existing 6630 5219 2040 Build 8879 7068 Air Base Pkwy on Existing 7,402 5,712 2040 Build 9,655 7,696 Travis Blvd on Existing 7,650 5,977 2040 Build 9,429 8,829 W. Texas St on Existing 7,656 5,877 2040 Build 9,204 8,665 Abernathy Rd on Existing 7,029 5,644 2040 Build 9,001 7,438 SR-12 East on Existing 8,662 6,752 2040 Build 11,722 9,636 Suisun Valley Rd off Existing 7,890 5,984 Suisun Valley Rd on (Future) 2040 Build 11,915 9,495 I-680 on Existing 5,855 4,543 2040 Build n/a n/a Green Valley Rd on Existing 6,417 5,170 2040 Build n/a n/a
04 – SOL - 80 – PM R10.4/30.2
27
Location along Mainline (downstream of ramp)
Year Peak Hourly Volumes
AM PM
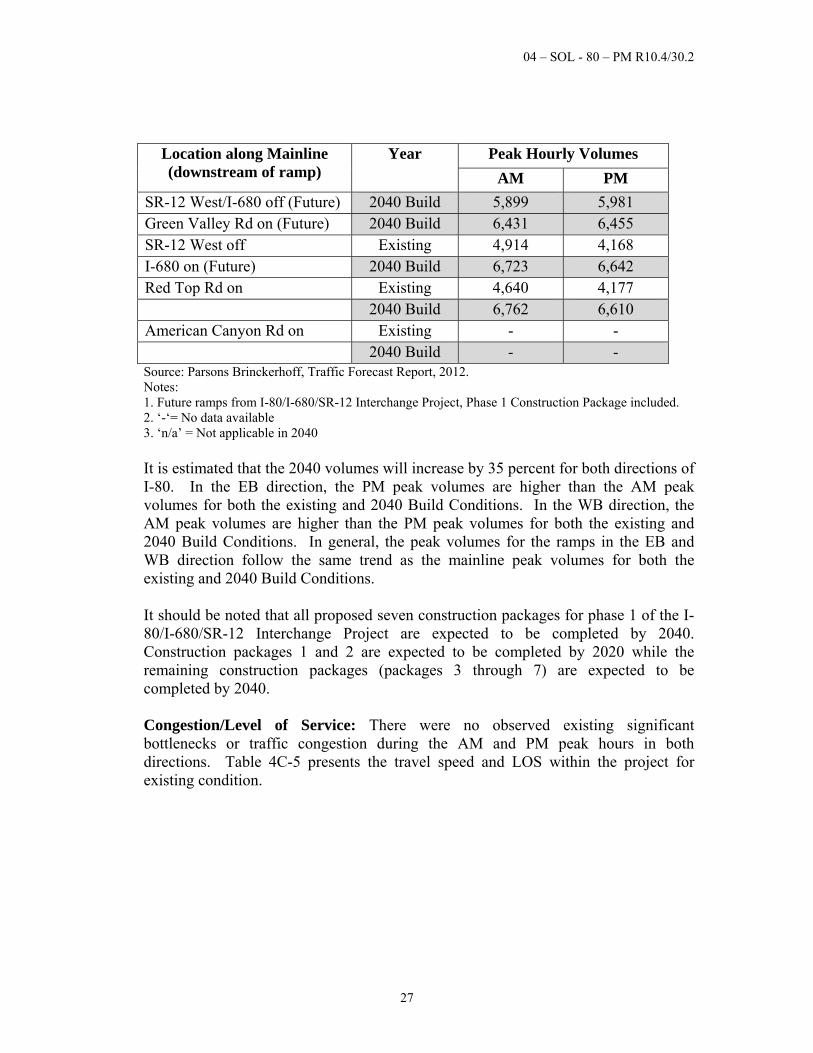
SR-12 West/I-680 off (Future) 2040 Build 5,899 5,981 Green Valley Rd on (Future) 2040 Build 6,431 6,455 SR-12 West off Existing 4,914 4,168 I-680 on (Future) 2040 Build 6,723 6,642 Red Top Rd on Existing 4,640 4,177 2040 Build 6,762 6,610 American Canyon Rd on Existing - - 2040 Build - - Source: Parsons Brinckerhoff, Traffic Forecast Report, 2012. Notes: 1. Future ramps from I-80/I-680/SR-12 Interchange Project, Phase 1 Construction Package included. 2. ‘-‘= No data available 3. ‘n/a’ = Not applicable in 2040 It is estimated that the 2040 volumes will increase by 35 percent for both directions of I-80. In the EB direction, the PM peak volumes are higher than the AM peak volumes for both the existing and 2040 Build Conditions. In the WB direction, the AM peak volumes are higher than the PM peak volumes for both the existing and 2040 Build Conditions. In general, the peak volumes for the ramps in the EB and WB direction follow the same trend as the mainline peak volumes for both the existing and 2040 Build Conditions. It should be noted that all proposed seven construction packages for phase 1 of the I-80/I-680/SR-12 Interchange Project are expected to be completed by 2040. Construction packages 1 and 2 are expected to be completed by 2020 while the remaining construction packages (packages 3 through 7) are expected to be completed by 2040. Congestion/Level of Service: There were no observed existing significant bottlenecks or traffic congestion during the AM and PM peak hours in both directions. Table 4C-5 presents the travel speed and LOS within the project for existing condition.
04 – SOL - 80 – PM R10.4/30.2
28
Table 4C-5
Existing Freeway Performance
Direction Peak Hour
HOV Lanes General Purpose Lanes
Speed (mph)
LOS Speed (mph)
LOS
EB I-80 AM 67-73 B+ 59-65 B PM 63-71 C+ 48-64 D+ WB I-80 AM 64-67 A 52-65 D+ PM 65-69 A 55-64 C+
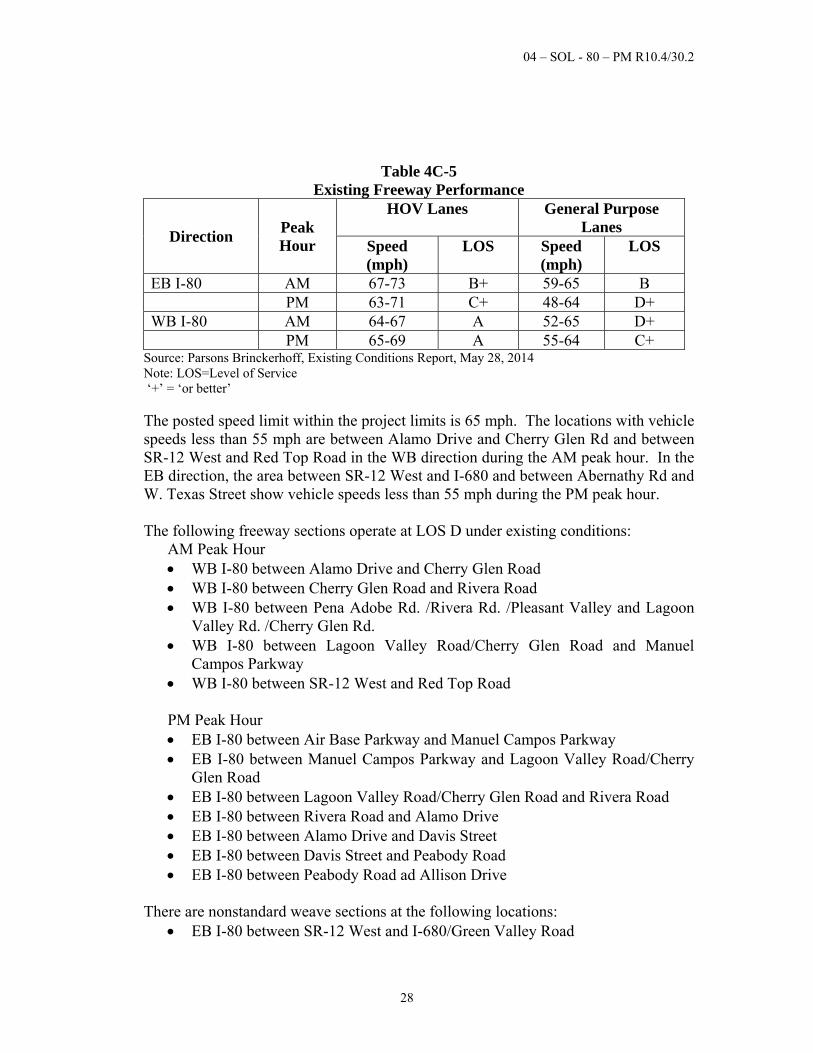
Source: Parsons Brinckerhoff, Existing Conditions Report, May 28, 2014 Note: LOS=Level of Service ‘+’ = ‘or better’ The posted speed limit within the project limits is 65 mph. The locations with vehicle speeds less than 55 mph are between Alamo Drive and Cherry Glen Rd and between SR-12 West and Red Top Road in the WB direction during the AM peak hour. In the EB direction, the area between SR-12 West and I-680 and between Abernathy Rd and W. Texas Street show vehicle speeds less than 55 mph during the PM peak hour. The following freeway sections operate at LOS D under existing conditions:
AM Peak Hour WB I-80 between Alamo Drive and Cherry Glen Road WB I-80 between Cherry Glen Road and Rivera Road WB I-80 between Pena Adobe Rd. /Rivera Rd. /Pleasant Valley and Lagoon
Valley Rd. /Cherry Glen Rd. WB I-80 between Lagoon Valley Road/Cherry Glen Road and Manuel
Campos Parkway WB I-80 between SR-12 West and Red Top Road PM Peak Hour EB I-80 between Air Base Parkway and Manuel Campos Parkway EB I-80 between Manuel Campos Parkway and Lagoon Valley Road/Cherry
Glen Road EB I-80 between Lagoon Valley Road/Cherry Glen Road and Rivera Road EB I-80 between Rivera Road and Alamo Drive EB I-80 between Alamo Drive and Davis Street EB I-80 between Davis Street and Peabody Road EB I-80 between Peabody Road ad Allison Drive
There are nonstandard weave sections at the following locations: EB I-80 between SR-12 West and I-680/Green Valley Road
04 – SOL - 80 – PM R10.4/30.2
29
EB I-80 between I-680/Green Valley Road and Suisun Valley Road EB I-80 between Abernathy Road and W. Texas Street (Auto Mall Parkway) EB I-80 between W. Texas Street (Beck Avenue) and Travis Boulevard EB I-80 between Alamo Drive and Davis Street WB I-80 between Nut Tree Road/I-505 and Monte Vista Avenue WB I-80 between Mason Street and Davis Street WB I-80 between Travis Boulevard and W. Texas Street (Oliver Road) WB I-80 between I-680 and SR-12 West – future condition after I-80/I-
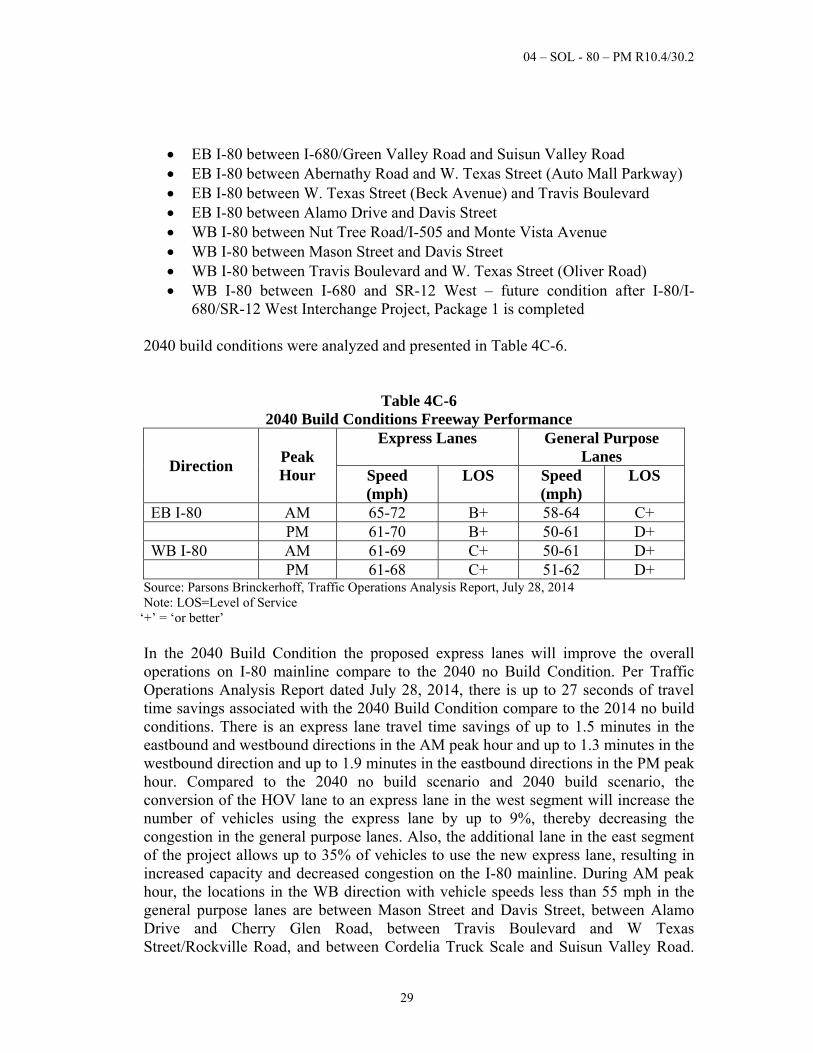
680/SR-12 West Interchange Project, Package 1 is completed 2040 build conditions were analyzed and presented in Table 4C-6.
Table 4C-6 2040 Build Conditions Freeway Performance
Direction Peak Hour
Express Lanes General Purpose Lanes
Speed (mph)
LOS Speed (mph)
LOS
EB I-80 AM 65-72 B+ 58-64 C+ PM 61-70 B+ 50-61 D+ WB I-80 AM 61-69 C+ 50-61 D+ PM 61-68 C+ 51-62 D+
Source: Parsons Brinckerhoff, Traffic Operations Analysis Report, July 28, 2014 Note: LOS=Level of Service
‘+’ = ‘or better’ In the 2040 Build Condition the proposed express lanes will improve the overall operations on I-80 mainline compare to the 2040 no Build Condition. Per Traffic Operations Analysis Report dated July 28, 2014, there is up to 27 seconds of travel time savings associated with the 2040 Build Condition compare to the 2014 no build conditions. There is an express lane travel time savings of up to 1.5 minutes in the eastbound and westbound directions in the AM peak hour and up to 1.3 minutes in the westbound direction and up to 1.9 minutes in the eastbound directions in the PM peak hour. Compared to the 2040 no build scenario and 2040 build scenario, the conversion of the HOV lane to an express lane in the west segment will increase the number of vehicles using the express lane by up to 9%, thereby decreasing the congestion in the general purpose lanes. Also, the additional lane in the east segment of the project allows up to 35% of vehicles to use the new express lane, resulting in increased capacity and decreased congestion on the I-80 mainline. During AM peak hour, the locations in the WB direction with vehicle speeds less than 55 mph in the general purpose lanes are between Mason Street and Davis Street, between Alamo Drive and Cherry Glen Road, between Travis Boulevard and W Texas Street/Rockville Road, and between Cordelia Truck Scale and Suisun Valley Road.
04 – SOL - 80 – PM R10.4/30.2
30
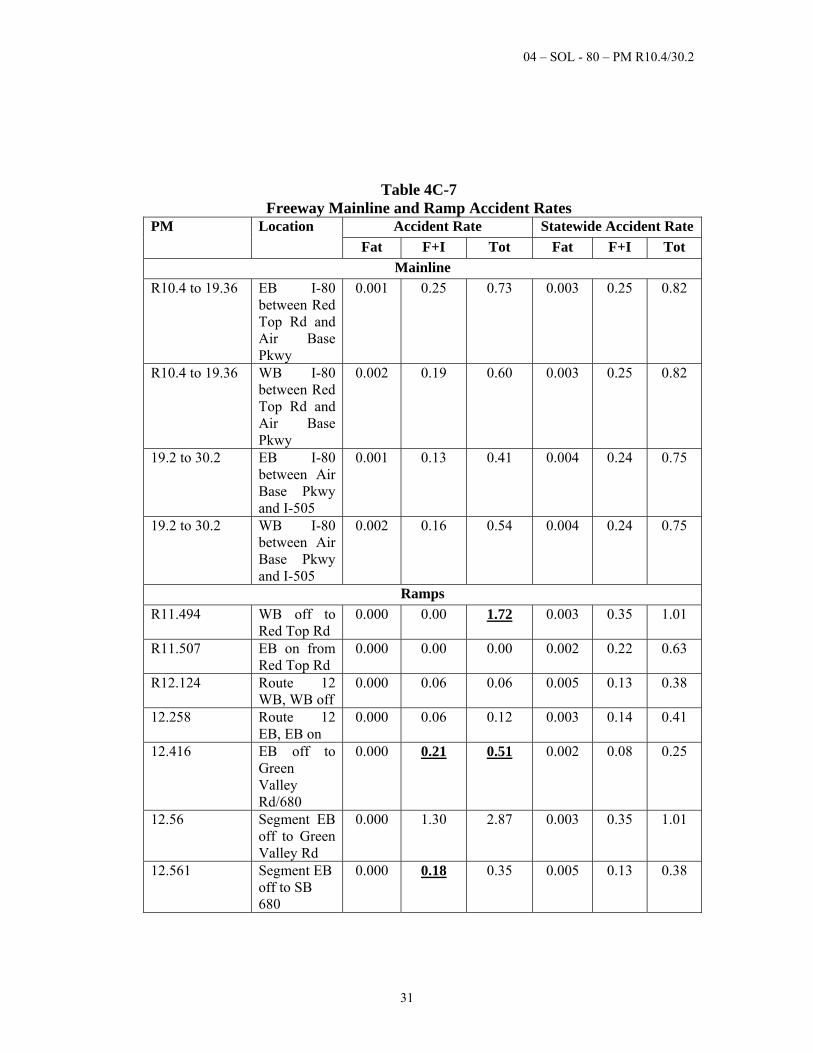
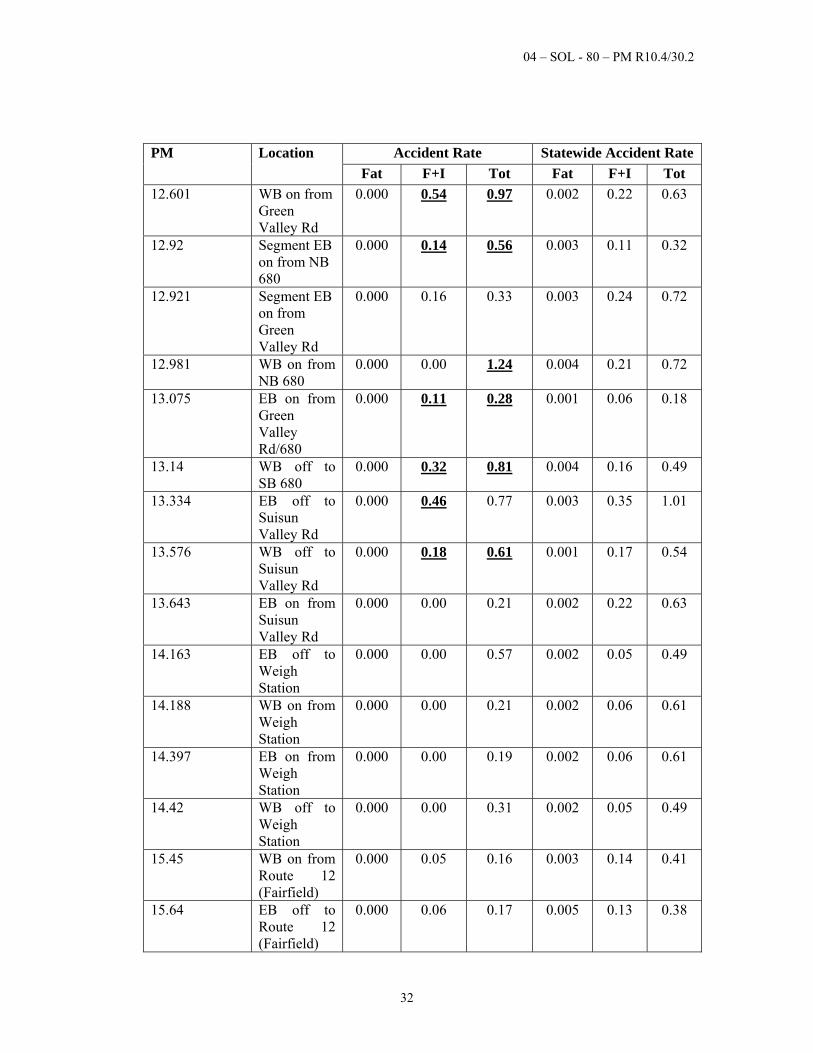
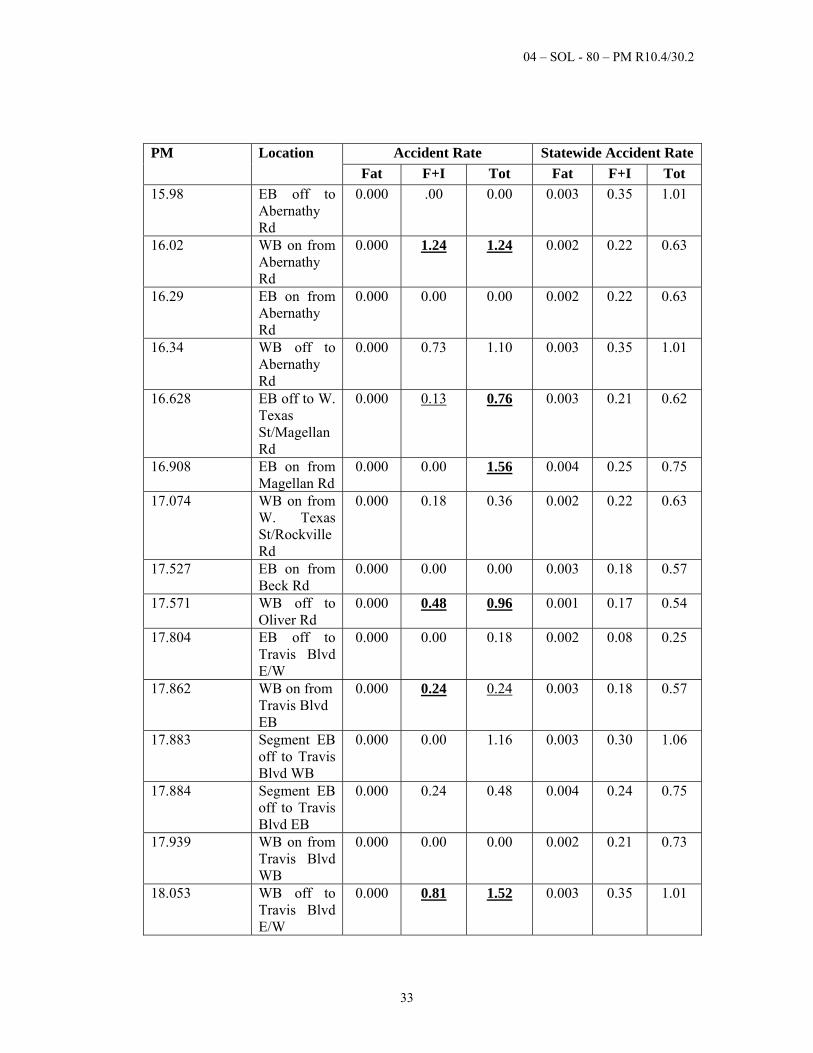
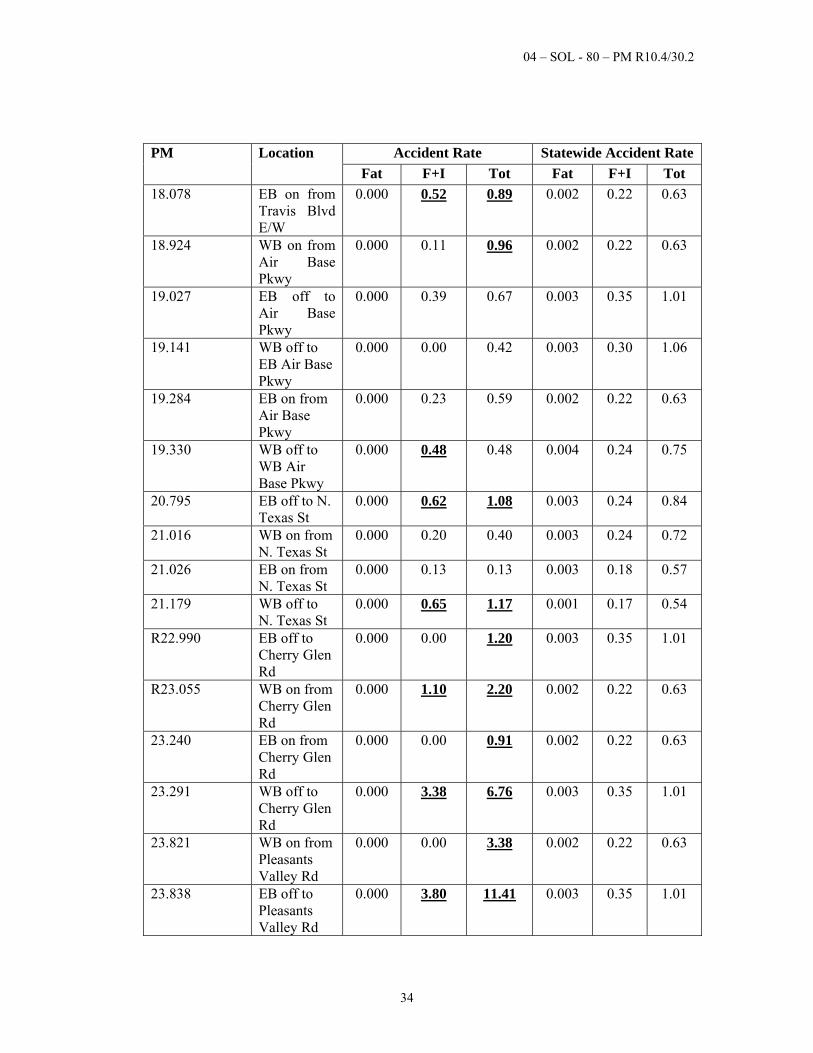
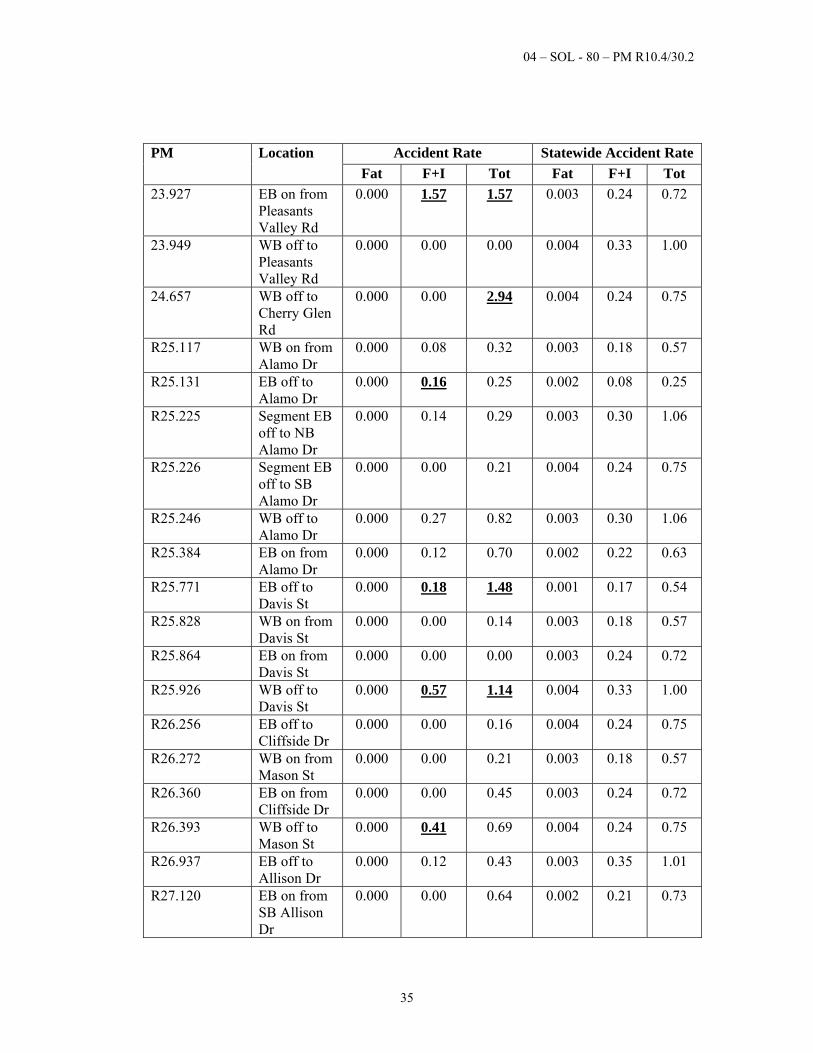
During the PM peak hour, the locations in the WB direction with vehicle speeds less than 55 mph in the general purpose lanes are between Mason Street and Davis Street, between Alamo Drive and Cherry Glen Road, between Travis Boulevard and W. Texas Street, and between Cordelia Truck Scale and Suisun Valley Road. In the EB direction, the areas are between Suisun Valley Road and Cordelia Truck Scale, between SR-12 and Abernathy Road, between Abernathy Road and W. Texas Street, between Alamo Drive and Davis Street, and between Davis Street and Peabody Road. The general purpose lanes on EB and WB I-80 predominantly operate at LOS D during peak periods except during the AM peak hour in the EB direction where all the segments operate at LOS C or better. The existing nonstandard merging and weaving features on EB I-80 between Beck Avenue (W. Texas Street) on-ramp and Travis Boulevard off-ramp will be standardized by the proposed changes to EB I-80/Travis Boulevard off-ramp. The project will extend the auxiliary lane between Beck Avenue and Travis Boulevard, creating a longer weaving length, and separate the off-ramp for Travis Boulevard East and Travis Boulevard West. The traffic analysis for the 2040 Build Conditions also indicated that the I-80 WB Alamo Drive and I-80 EB Manuel Campos on-ramps volumes are not completely served even with the maximum ramp metering rate of 900 vehicles per hour per lane. This issue is not a result of express lane project implementation. Therefore, the resolution for either location has not been identified at this time and will need to be addressed in a separate future project. There are no significant bottlenecks or traffic congestion along I-80 during weekday peak periods for the 2040 Build Condition. There were no major improvements in the ramp queue lengths when compared to the no build alternative, since the ramp geometry is the same between the build and no build alternatives. Transit: Multiple transit agencies operate within the project area. Agencies operating within the project area include Fairfield and Suisun Transit (FAST), the Rio Vista Delta Breeze, Vallejo Transit and Yolo Bus. Collision Analysis Traffic accident data between June 1, 2009 and May 31, 2012 were obtained from Caltrans’ Traffic Accident Surveillance and Analysis Systems (TASAS) database for I-80 between Red Top Road and I-505. Table 4C-7 summarizes the freeway mainline and ramp accident rates.
04 – SOL - 80 – PM R10.4/30.2
31
Table 4C-7 Freeway Mainline and Ramp Accident Rates
PM Location Accident Rate Statewide Accident Rate
Fat F+I Tot Fat F+I Tot
Mainline
R10.4 to 19.36 EB I-80 between Red Top Rd and Air Base Pkwy
0.001 0.25 0.73 0.003 0.25 0.82
R10.4 to 19.36 WB I-80 between Red Top Rd and Air Base Pkwy
0.002 0.19 0.60 0.003 0.25 0.82
19.2 to 30.2 EB I-80 between Air Base Pkwy and I-505
0.001 0.13 0.41 0.004 0.24 0.75
19.2 to 30.2 WB I-80 between Air Base Pkwy and I-505
0.002 0.16 0.54 0.004 0.24 0.75
Ramps
R11.494 WB off to Red Top Rd
0.000 0.00 1.72 0.003 0.35 1.01
R11.507 EB on from Red Top Rd
0.000 0.00 0.00 0.002 0.22 0.63
R12.124 Route 12 WB, WB off
0.000 0.06 0.06 0.005 0.13 0.38
12.258 Route 12 EB, EB on
0.000 0.06 0.12 0.003 0.14 0.41
12.416 EB off to Green Valley Rd/680
0.000 0.21 0.51 0.002 0.08 0.25
12.56 Segment EB off to Green Valley Rd
0.000 1.30 2.87 0.003 0.35 1.01
12.561 Segment EB off to SB 680
0.000 0.18 0.35 0.005 0.13 0.38
04 – SOL - 80 – PM R10.4/30.2
32
PM Location Accident Rate Statewide Accident Rate
Fat F+I Tot Fat F+I Tot
12.601 WB on from Green Valley Rd
0.000 0.54 0.97 0.002 0.22 0.63
12.92 Segment EB on from NB 680
0.000 0.14 0.56 0.003 0.11 0.32
12.921 Segment EB on from Green Valley Rd
0.000 0.16 0.33 0.003 0.24 0.72
12.981 WB on from NB 680
0.000 0.00 1.24 0.004 0.21 0.72
13.075 EB on from Green Valley Rd/680
0.000 0.11 0.28 0.001 0.06 0.18
13.14 WB off to SB 680
0.000 0.32 0.81 0.004 0.16 0.49
13.334 EB off to Suisun Valley Rd
0.000 0.46 0.77 0.003 0.35 1.01
13.576 WB off to Suisun Valley Rd
0.000 0.18 0.61 0.001 0.17 0.54
13.643 EB on from Suisun Valley Rd
0.000 0.00 0.21 0.002 0.22 0.63
14.163 EB off to Weigh Station
0.000 0.00 0.57 0.002 0.05 0.49
14.188 WB on from Weigh Station
0.000 0.00 0.21 0.002 0.06 0.61
14.397 EB on from Weigh Station
0.000 0.00 0.19 0.002 0.06 0.61
14.42 WB off to Weigh Station
0.000 0.00 0.31 0.002 0.05 0.49
15.45 WB on from Route 12 (Fairfield)
0.000 0.05 0.16 0.003 0.14 0.41
15.64 EB off to Route 12 (Fairfield)
0.000 0.06 0.17 0.005 0.13 0.38
04 – SOL - 80 – PM R10.4/30.2
33
PM Location Accident Rate Statewide Accident Rate
Fat F+I Tot Fat F+I Tot
15.98 EB off to Abernathy Rd
0.000 .00 0.00 0.003 0.35 1.01
16.02 WB on from Abernathy Rd
0.000 1.24 1.24 0.002 0.22 0.63
16.29 EB on from Abernathy Rd
0.000 0.00 0.00 0.002 0.22 0.63
16.34 WB off to Abernathy Rd
0.000 0.73 1.10 0.003 0.35 1.01
16.628 EB off to W. Texas St/Magellan Rd
0.000 0.13 0.76 0.003 0.21 0.62
16.908 EB on from Magellan Rd
0.000 0.00 1.56 0.004 0.25 0.75
17.074 WB on from W. Texas St/Rockville Rd
0.000 0.18 0.36 0.002 0.22 0.63
17.527 EB on from Beck Rd
0.000 0.00 0.00 0.003 0.18 0.57
17.571 WB off to Oliver Rd
0.000 0.48 0.96 0.001 0.17 0.54
17.804 EB off to Travis Blvd E/W
0.000 0.00 0.18 0.002 0.08 0.25
17.862 WB on from Travis Blvd EB
0.000 0.24 0.24 0.003 0.18 0.57
17.883 Segment EB off to Travis Blvd WB
0.000 0.00 1.16 0.003 0.30 1.06
17.884 Segment EB off to Travis Blvd EB
0.000 0.24 0.48 0.004 0.24 0.75
17.939 WB on from Travis Blvd WB
0.000 0.00 0.00 0.002 0.21 0.73
18.053 WB off to Travis Blvd E/W
0.000 0.81 1.52 0.003 0.35 1.01
04 – SOL - 80 – PM R10.4/30.2
34
PM Location Accident Rate Statewide Accident Rate
Fat F+I Tot Fat F+I Tot
18.078 EB on from Travis Blvd E/W
0.000 0.52 0.89 0.002 0.22 0.63
18.924 WB on from Air Base Pkwy
0.000 0.11 0.96 0.002 0.22 0.63
19.027 EB off to Air Base Pkwy
0.000 0.39 0.67 0.003 0.35 1.01
19.141 WB off to EB Air Base Pkwy
0.000 0.00 0.42 0.003 0.30 1.06
19.284 EB on from Air Base Pkwy
0.000 0.23 0.59 0.002 0.22 0.63
19.330 WB off to WB Air Base Pkwy
0.000 0.48 0.48 0.004 0.24 0.75
20.795 EB off to N. Texas St
0.000 0.62 1.08 0.003 0.24 0.84
21.016 WB on from N. Texas St
0.000 0.20 0.40 0.003 0.24 0.72
21.026 EB on from N. Texas St
0.000 0.13 0.13 0.003 0.18 0.57
21.179 WB off to N. Texas St
0.000 0.65 1.17 0.001 0.17 0.54
R22.990 EB off to Cherry Glen Rd
0.000 0.00 1.20 0.003 0.35 1.01
R23.055 WB on from Cherry Glen Rd
0.000 1.10 2.20 0.002 0.22 0.63
23.240 EB on from Cherry Glen Rd
0.000 0.00 0.91 0.002 0.22 0.63
23.291 WB off to Cherry Glen Rd
0.000 3.38 6.76 0.003 0.35 1.01
23.821 WB on from Pleasants Valley Rd
0.000 0.00 3.38 0.002 0.22 0.63
23.838 EB off to Pleasants Valley Rd
0.000 3.80 11.41 0.003 0.35 1.01
04 – SOL - 80 – PM R10.4/30.2
35
PM Location Accident Rate Statewide Accident Rate
Fat F+I Tot Fat F+I Tot
23.927 EB on from Pleasants Valley Rd
0.000 1.57 1.57 0.003 0.24 0.72
23.949 WB off to Pleasants Valley Rd
0.000 0.00 0.00 0.004 0.33 1.00
24.657 WB off to Cherry Glen Rd
0.000 0.00 2.94 0.004 0.24 0.75
R25.117 WB on from Alamo Dr
0.000 0.08 0.32 0.003 0.18 0.57
R25.131 EB off to Alamo Dr
0.000 0.16 0.25 0.002 0.08 0.25
R25.225 Segment EB off to NB Alamo Dr
0.000 0.14 0.29 0.003 0.30 1.06
R25.226 Segment EB off to SB Alamo Dr
0.000 0.00 0.21 0.004 0.24 0.75
R25.246 WB off to Alamo Dr
0.000 0.27 0.82 0.003 0.30 1.06
R25.384 EB on from Alamo Dr
0.000 0.12 0.70 0.002 0.22 0.63
R25.771 EB off to Davis St
0.000 0.18 1.48 0.001 0.17 0.54
R25.828 WB on from Davis St
0.000 0.00 0.14 0.003 0.18 0.57
R25.864 EB on from Davis St
0.000 0.00 0.00 0.003 0.24 0.72
R25.926 WB off to Davis St
0.000 0.57 1.14 0.004 0.33 1.00
R26.256 EB off to Cliffside Dr
0.000 0.00 0.16 0.004 0.24 0.75
R26.272 WB on from Mason St
0.000 0.00 0.21 0.003 0.18 0.57
R26.360 EB on from Cliffside Dr
0.000 0.00 0.45 0.003 0.24 0.72
R26.393 WB off to Mason St
0.000 0.41 0.69 0.004 0.24 0.75
R26.937 EB off to Allison Dr
0.000 0.12 0.43 0.003 0.35 1.01
R27.120 EB on from SB Allison Dr
0.000 0.00 0.64 0.002 0.21 0.73
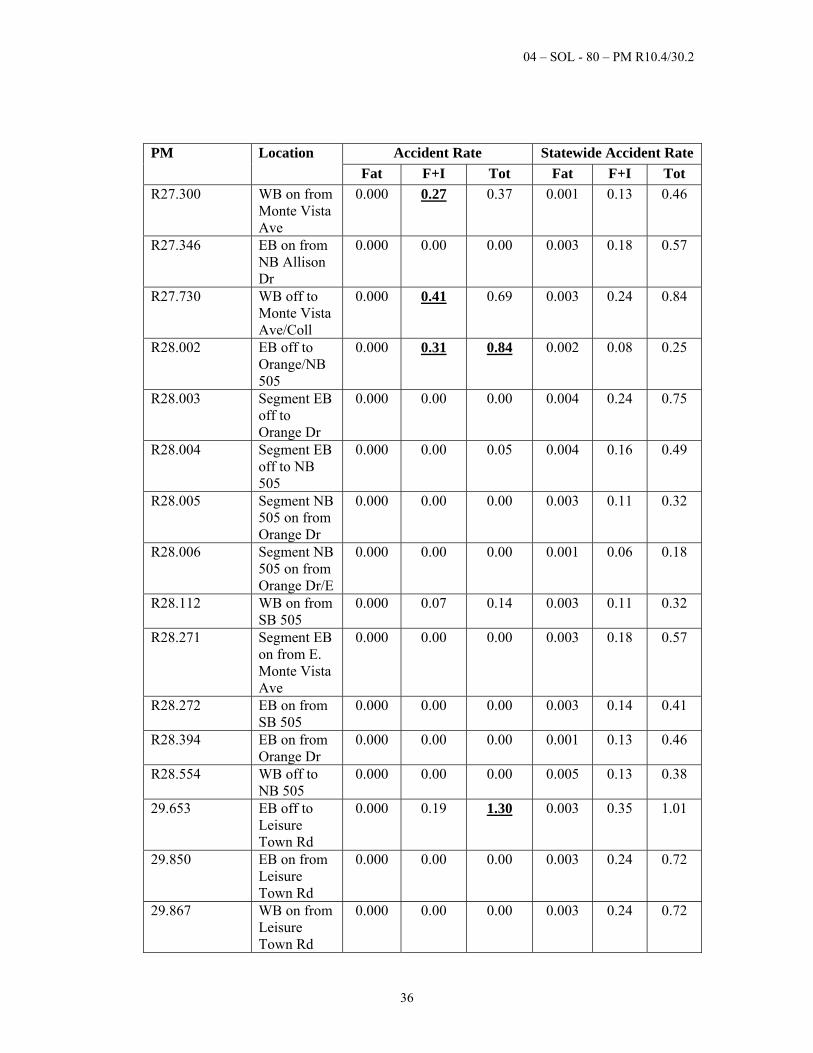
04 – SOL - 80 – PM R10.4/30.2
36
PM Location Accident Rate Statewide Accident Rate
Fat F+I Tot Fat F+I Tot
R27.300 WB on from Monte Vista Ave
0.000 0.27 0.37 0.001 0.13 0.46
R27.346 EB on from NB Allison Dr
0.000 0.00 0.00 0.003 0.18 0.57
R27.730 WB off to Monte Vista Ave/Coll
0.000 0.41 0.69 0.003 0.24 0.84
R28.002 EB off to Orange/NB 505
0.000 0.31 0.84 0.002 0.08 0.25
R28.003 Segment EB off to Orange Dr
0.000 0.00 0.00 0.004 0.24 0.75
R28.004 Segment EB off to NB 505
0.000 0.00 0.05 0.004 0.16 0.49
R28.005 Segment NB 505 on from Orange Dr
0.000 0.00 0.00 0.003 0.11 0.32
R28.006 Segment NB 505 on from Orange Dr/E
0.000 0.00 0.00 0.001 0.06 0.18
R28.112 WB on from SB 505
0.000 0.07 0.14 0.003 0.11 0.32
R28.271 Segment EB on from E. Monte Vista Ave
0.000 0.00 0.00 0.003 0.18 0.57
R28.272 EB on from SB 505
0.000 0.00 0.00 0.003 0.14 0.41
R28.394 EB on from Orange Dr
0.000 0.00 0.00 0.001 0.13 0.46
R28.554 WB off to NB 505
0.000 0.00 0.00 0.005 0.13 0.38
29.653 EB off to Leisure Town Rd
0.000 0.19 1.30 0.003 0.35 1.01
29.850 EB on from Leisure Town Rd
0.000 0.00 0.00 0.003 0.24 0.72
29.867 WB on from Leisure Town Rd
0.000 0.00 0.00 0.003 0.24 0.72
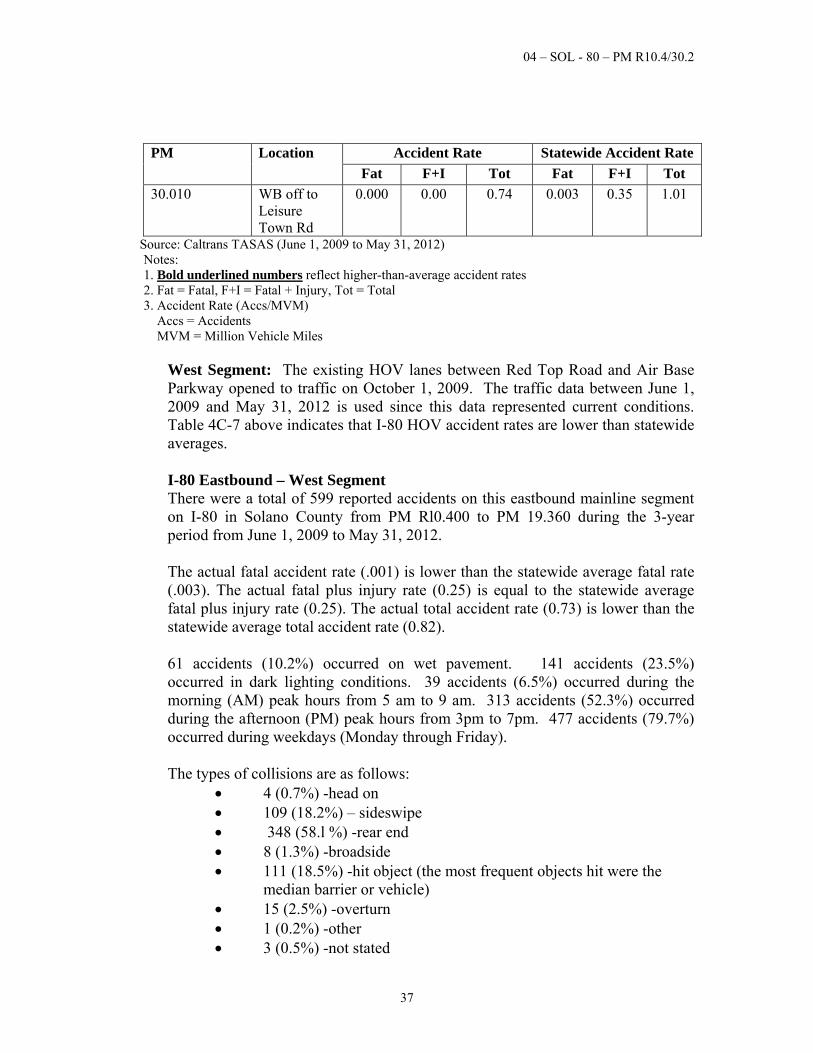
04 – SOL - 80 – PM R10.4/30.2
37
PM Location Accident Rate Statewide Accident Rate
Fat F+I Tot Fat F+I Tot
30.010 WB off to Leisure Town Rd
0.000 0.00 0.74 0.003 0.35 1.01
Source: Caltrans TASAS (June 1, 2009 to May 31, 2012) Notes: 1. Bold underlined numbers reflect higher-than-average accident rates 2. Fat = Fatal, F+I = Fatal + Injury, Tot = Total 3. Accident Rate (Accs/MVM) Accs = Accidents MVM = Million Vehicle Miles
West Segment: The existing HOV lanes between Red Top Road and Air Base Parkway opened to traffic on October 1, 2009. The traffic data between June 1, 2009 and May 31, 2012 is used since this data represented current conditions. Table 4C-7 above indicates that I-80 HOV accident rates are lower than statewide averages. I-80 Eastbound – West Segment There were a total of 599 reported accidents on this eastbound mainline segment on I-80 in Solano County from PM Rl0.400 to PM 19.360 during the 3-year period from June 1, 2009 to May 31, 2012. The actual fatal accident rate (.001) is lower than the statewide average fatal rate (.003). The actual fatal plus injury rate (0.25) is equal to the statewide average fatal plus injury rate (0.25). The actual total accident rate (0.73) is lower than the statewide average total accident rate (0.82). 61 accidents (10.2%) occurred on wet pavement. 141 accidents (23.5%) occurred in dark lighting conditions. 39 accidents (6.5%) occurred during the morning (AM) peak hours from 5 am to 9 am. 313 accidents (52.3%) occurred during the afternoon (PM) peak hours from 3pm to 7pm. 477 accidents (79.7%) occurred during weekdays (Monday through Friday). The types of collisions are as follows:
4 (0.7%) -head on 109 (18.2%) – sideswipe 348 (58.l %) -rear end 8 (1.3%) -broadside 111 (18.5%) -hit object (the most frequent objects hit were the
median barrier or vehicle) 15 (2.5%) -overturn 1 (0.2%) -other 3 (0.5%) -not stated
04 – SOL - 80 – PM R10.4/30.2
38
The most frequent type of collision is rear end collision, which totaled 348 (58.1%). This type of collision is indicative of congested traffic conditions. The primary collision factors are as follows:
26 (4.3%) -influence alcohol 15 (2.5%) -follow too close 1 (0.2%) - failure to yield 92 (15.4%) -improper tum 331 (55.3%) -speeding 107 (17.9%) -other violations 2 (0.3%) -improper driving 19 (3.2%) -other than driver 4 (0.7%) -unknown 2 (0.3%) -not stated
The majority of collisions occurred in the interior lanes followed by collisions occurring in the left and right lane, respectively. I-80 Westbound – West Segment There were a total of 490 reported accidents on this westbound mainline segment on I-80 in Solano County from PM Rl0.400 to PM 19.360 during the 3-year period from June 1, 2009 to May 31, 2012. The actual fatal accident rate (.002) is lower than the statewide average fatal rate (.003). The actual fatal plus injury rate (0.19) is lower than the statewide average fatal plus injury rate (0.25). The actual total accident rate (0.60) is lower than the statewide average total accident rate (0.82). 87 accidents (17.8%) occurred on wet pavement. 135 accidents (27.5%) occurred in dark lighting conditions. 195 accidents (39.9%) occurred during the morning (AM) peak hours from 5am to 9am. 73 accidents (14.9%) occurred during the afternoon (PM) peak hours from 3pm to 7pm. 379 accidents (77.4%) occurred during weekdays (Monday through Friday). The types of collisions are as follows:
112 (22.9%) -sideswipe 205 (41.8%) -rear end 12 (2.4%) -broadside 138 (28.2%) -hit object (the most frequent objects hit were the
median barrier or vehicle)
04 – SOL - 80 – PM R10.4/30.2
39
18 (3.7%) -overturn 1 (0.2%) -auto/pedestrian 3 (0.6%) -other 1 (0.2%) -not stated
The most frequent type of collision is rear end collision, which totaled 205 (41.8%). This type of collision is indicative of congested traffic conditions. The primary collision factors are as follows:
13 (2.7%) -influence alcohol 12 (2.4%) -follow too close 84 (17.1%) -improper tum 202 (41.2%) -speeding 141 (28.8%) -other violations 2 (0.4%) -improper driving 34 (6.9%) -other than driver 1 (0.2%) -unknown 1 (0.2%) -not stated
The majority of collisions occurred in the interior lanes followed by collisions occurring in the right and left lane, respectively.
East Segment: Table 4C-7 above indicates that I-80 between Air Base Parkway and I-505 experienced accident rates lower than the statewide averages for similar facilities. I-80 Eastbound – East Segment There were a total of 368 reported accidents on this eastbound mainline segment on I-80 in Solano County from PM 19.200 to PM 30.200 during the 3-year period from June 1, 2009 to May 31, 2012. The actual fatal accident rate (.001) is lower than the statewide average fatal rate (.004). The actual fatal plus injury rate (0.13) is lower than the statewide average fatal plus injury rate (0.24). The actual total accident rate (0.41) is lower than the statewide average total accident rate (0.75). 36 accidents (9.8%) occurred on wet pavement. 98 accidents (26.6%) occurred in dark lighting conditions. 49 accidents (13.3%) occurred during the morning (AM) peak hours from 5am to 9am. 131 accidents (35.6%) occurred during the afternoon (PM) peak hours from 3pm to 7pm. 268 accidents (72.9%) occurred during weekdays (Monday through Friday).
04 – SOL - 80 – PM R10.4/30.2
40
The types of collisions are as follows: 2 (0.5%) – head on 92 (25%) – sideswipe 144 (39.1%) – rear end 7 (1.9%) – broadside 103 (28%) – hit object (the most frequent objects hit were the
median barrier or vehicle) 17 (4.6%) – overturn 3 (0.8%) – other
The most frequent type of collision is rear end collision, which totaled 144 (39.1%). This type of collision is indicative of congested traffic conditions. The primary collision factors are as follows:
17 (4.6%) – influence alcohol 9 (2.4%) – follow too close 1 (0.3%) – failure to yield 90 (24.5%) – improper turn 148 (40.2%) – speeding 85 (23.1%) – other violations 14 (3.8%) – other than driver 3 (0.8%) – unknown 1 (0.3%) – not stated
The majority of collisions occurred in the interior lanes followed by collisions occurring in the right and left lane, respectively. I-80 Westbound – East Segment
There were a total of 485 reported accidents on this westbound mainline segment on I-80 in Solano County from PM 19.200 to PM 30.200 during the 3-year period from June 1, 2009 to May 31, 2012.
The actual fatal accident rate (.002) is lower than the statewide average fatal rate (.004). The actual fatal plus injury rate (0.16) is lower than the statewide average fatal plus injury rate (0.24). The actual total accident rate (0.54) is lower than the statewide average total accident rate (0.75).
51 accidents (10.5%) occurred on wet pavement. 142 accidents (29.2%) occurred in dark lighting conditions. 113 accidents (23.2%) occurred during the morning (AM) peak hours from 5am to 9am. 148 accidents (30.6%) occurred during the afternoon (PM) peak hours from 3pm to 7pm. 324 accidents (66.7%) occurred weekday (Monday through Friday).
04 – SOL - 80 – PM R10.4/30.2
41
The types of collisions are as follows: 114 (23.5%) - sideswipe 174 (35.9%) – rear end 12 (2.5%) – broadside 156 (32.2%) – hit object (the most frequent objects hit were the
median barrier or vehicle) 23 (4.7%) – overturn 2 (0.4%) – auto/pedestrian 4 (0.8%) – other
The most frequent type of collision is rear end collision, which totaled 174 (35.9%). This type of collision is indicative of congested traffic conditions. The primary collision factors are as follows:
26 (5.4%) – influence alcohol 17 (3.5%) – follow too close 1 (0.2%) – failure to yield 124 (25.6%) – improper turn 169 (34.8%) – speeding 113 (23.3%) – other violations 2 (0.4%) – improper driving 28 (5.8%) – other than driver 5 (1%) – unknown
The majority of collisions occurred in the interior lanes followed by collisions occurring in the left and right lane, respectively. Accident rate as shown on table 4C-7 above for some ramps are higher than state wide accident data. However, since 2011 two ramp metering projects have been constructed. Construction for ramp metering project with EA 0A532 was completed in Feb. 2012. Construction for ramp metering project EA 15350 was completed in Jan. 2015. With construction of these projects, the accident rate for these ramps is expected to improve.
Caltrans District 4 Office of Traffic Safety for Solano County reviewed and approved a Traffic Safety Analysis Report (TSAR) dated November 2014. The TSAR was prepared by a registered professional engineer and includes a collision analysis and recommended mitigation strategies that have been incorporated into this project. Mitigation strategies include providing additional highway lighting and refreshing pavement delineation.
04 – SOL - 80 – PM R10.4/30.2
42
5. ALTERNATIVES
5A. Viable Alternatives No Build Alternative The No-Build Alternative includes all currently planned and programmed projects in the project area as described in the 2035 Transportation Plan. It assumes that the proposed project modifications, in its entirety, will not be built. The existing HOV lanes along I-80 from Red Top Road to Air Base Parkway will remain as they currently exist and no widening of the I-80 mainline east of Air Base Parkway will occur. This alternative does not improve operations or safety, nor would it improve the efficiency of the transportation system. Build Alternative (Preferred Alternative) Proposed Engineering Features
The Build Alternative will construct approximately 18 miles of express lanes on EB and WB I-80 from west of Red Top Road to east of I-505. The West Segment will convert 8.1 miles of HOV lanes along I-80 from the Red Top Road Interchange to east of Air Base Parkway Interchange. The East Segment will construct 9.4 miles of express lanes along I-80 from east of the Air Base Parkway Interchange through the I-80/I-505 Interchange. The detailed engineering features, as depicted in the attached plans for the West Segment (Attachment C) and East Segment (Attachment D), are as follows: Access and Lane Configuration: The access configuration will be continuous access. The express lanes will be contiguous/non-barrier separated from the general purpose lanes and will have no intermediate ingress and egress locations. The express lane width will be 12 feet wide. Pavement Delineation: The express lanes will be designated using a dash stripe pavement marking. The diamond markings on existing HOV lanes will be permanently removed and replaced with an ‘EXPRS LANE’ pavement marking to designate the lanes as express lanes. The I-80 Express Lanes Project proposes a continuous access lane for the entire length of the express lane. It is anticipated that construction of the proposed project features will not result in permanent scarring of the existing pavement. The East Segment proposes an HMA overlay of the entire travel way and new pavement delineation along the segment limits.
04 – SOL - 80 – PM R10.4/30.2
43
As recommended in the Traffic Safety Analysis Report, enhanced traffic striping with high visibility glass bead thermoplastic will be placed at the following locations:
Express lane striping: Detail 25 (left edge of traveled way) and Detail 42 Mod (8” dashed line with Type A and Type G Reflective Markers) (right lane line of the express lane);
All lane line striping in both directions from PM 19.2 and from PM 29.3 (limits of East Segment express lane pavement section overlay and delineation);
All other striping that requires replacement due to project construction. In addition to the high visibility glass bead thermoplastic, median concrete barrier reflective markers will be placed at 48-foot spacing along the project limits for enhanced visibility. It is also recommended that rumble strips be installed in both the eastbound and westbound direction along the inside and outside shoulders where shoulder width is non-standard and at least 4 feet wide. Final locations and length of rumble strips will be determined during PS&E stage. The project, given the addition of the recommended safety features is not expected to have an increase in the crash rates or severity for this corridor. Enforcement: From an express lane perspective, there are two main types of enforcement: (1) toll payment enforcement, and (2) HOV occupancy enforcement. BAIFA will perform toll payment enforcement as documented in the ‘Operating Scenarios’ and ‘Toll Collection’ sections of this document. HOV occupancy enforcement will be performed by the California Highway Patrol as described under the ‘California Highway Patrol Observation and Median Enforcement Areas’ section of this document. Electronic Tolling Equipment: Following are information relating to the zones, tolling equipment types, tolling equipment layout and post/pole types used: Zones and Tolling Equipment: There will be four proposed tolling zones, two within each segment. Each toll zone will include equipment related to toll collection, enforcement for violations, traffic monitoring, and communication with the toll system integrator’s Hosts, where the toll system is controlled and data is processed. Typical equipment includes toll readers, vehicle sensors, enforcement beacons, cameras, vehicle detectors, and related equipment to monitor congestion in the express lane. Tolling Equipment Layout: The first Variable Toll Message Sign (VTMS) will be installed approximately 0.5 to 1- mile before the start of the express lane. Subsequent VTMS will have an approximate spacing of 1 to 2 miles. VTMS will typically be
04 – SOL - 80 – PM R10.4/30.2
44
placed downstream of on-ramps with large traffic volumes so that the drivers have an opportunity to see the toll rate before choosing to enter the express lane and their vehicle is detected and identified by the toll system at a Read Point. The first Read Point will be located within 1000 feet after the express lane begins. Subsequent Read Points will be placed downstream of their respective VTMS. Multiple Read Points may be installed and paired with a single VTMS. The distance between a VTMS and its last Read Point pairing will be no more than 1 to 1.5 miles. The factors which will affect the placement of VTMS and Read Points beyond toll system requirements include: spacing between interchanges, visibily of signs, spacing with existing overhead signs, conficts with existing facilities, and environmental impacts. Pole/Post Types: The tolling equipment will be mounted or attached to an overhead sign structure or overhead structure. Some cameras will be median mounted on standard round steel poles 10 to15 feet tall or 40-feet tall, depending on the specific purpose of the cameras. Signage: Following are information relating to the sign types and post/pole types used: Sign Types: The overhead sign types will either be static or variable. The static signs will display the operating rules (i.e., hours of operations, occupancy requirements, required payment method) at the beginning of the express lane (at 1mile, 0.5-mile and entrance) and at the end of the express lane (at 0.5-mile and termination of the express lane). Where feasible, the tolling equipment will be mounted to the signs displaying express lane regulatory information. The variable signs will display the toll pricing for the current zone as well as the toll pricing to a popular destination at the end of a toll segment. The price will change depending on congestion in the general purpose lanes and available capacity in the express lanes. The panel size will vary depending on the sign type. In addition, barrier-mounted signs will be installed in the freeway median to provide HOV occupancy requirements, hours of operations and toll tag requirements. Pole/Post Types: The signs will be mounted on a single post. Some of the elecronic tolling equipment will be mounted to the signs. Where feasible, the standard Caltrans overhead sign foundation will be used. Ancillary Project Components: The following ancillary components will be used: Electrical Power, Communication, and Lighting: The variable signs and tolling equipment will be connected to electrical power and communication sources that will be independent of Caltrans systems. Some static signs will require electrical power for lighting. The conduits for electrical power and communication fiber will be within the State right of way and will require trenching and/or horizontal directional
04 – SOL - 80 – PM R10.4/30.2
45
drilling. Temporary construction access to power and communication sources outside State right of way may be needed. An agreement is in the process between Caltrans and BAIFA to stipulate maintenance responsibilities. As recommended in the Traffic Safety Analysis Report, electroliers for overhead lighting will be placed in the following locations in both the EB and WB directions:
For 1,000 feet prior to the entrance and 1,000 feet beyond the termination of the express lane;
For 1,000 feet prior to and 1,000 feet following a pricing zone change;
Mounted above proposed VTMS;
At proposed CHP Observation and Median Enforcement Areas where the proposed left shoulder width is approximately 3 feet (2 electroliers in each direction of travel at each proposed CHP Observation and Median Enforcement Areas).
Barriers and Maintenance Vehicle Pullouts: It is planned, where feasible, to place fixed objects (electronic tolling equipment/cabinet and ancillary components) behind existing median barrier. If this cannot be accomplished, then a Caltrans standard barrier (concrete or midwest guardrail system) will be installed if such fixed objects will be within the clear recovery zone. Maintenance vehicle pullouts (MVP) to support maintenance personnel will also be installed. Headlight glare was considered for both the East Segment and West Segment where the median width is 20 feet or less. West Segment: The following locations within the West Segment have existing median widths 20 feet or less: Station “M” 197+00 to Station “M” 261+15 (median width varies from 6’ to 20’) Station “M” 288+00 to Station “M” 307+00 (median width varies from 14’ to
20’) Station “M” 335+00 to Station “M” 574+00 (median width varies from 11’ to
20’) In these areas typically, a type 60C concrete median barrier separates the eastbound and westbound lanes. Because the project does not propose reducing existing median widths in the West Segment no mitigation is proposed for headlight glare on the West Segment. East Segment: The highway widening to accommodate the express lane is proposed in the median and will reduce the existing median to less than 20 feet in many areas. The project proposes to install Type 60G concrete median barrier where the project reduces the median width to less than 20 feet in order to reduce headlight glare,
04 – SOL - 80 – PM R10.4/30.2
46
except in areas where the EB and WB lanes are at different grades and headlight glare would not be an impact. System Integration: The installation of the equipment serving the toll collection systems including the electrical and communication systems (wires, service cabinets and controller cabinets) will be performed by a combination of a Toll System Integrator, PG&E, and a Backhaul Communications Contractor associated under separate contracts with BAIFA. The work will be coordinated with the civil infrastructure work which will include the installation of the overhead sign structure. Additional information relating to system integration and the implementation, maintenance and operation of the express lane toll system is described under Express Lanes Operating Concepts. This information will be refined by BAIFA’s Toll System Integrator. Other Project Components Structure Widening: Structures will not require modification for the West Segment; however, the following four structures within the East Segment will require modification:
1. Davis St Undercrossing, Bridge No. 23-0023L & R, PM R26.00 – The widening will occur in the median of I-80. The widths of the inside widening will be 17 feet-4 inches.
2. Mason St Undercrossing, Bridge No. 23-0051L & R, PM R26.46 – The widening will occur in the median of I-80. The widths of inside widening will be 17 feet-4 inches.
3. Ulatis Creek Bridge, Bridge No. 23-0052L & R, PM R26.61 - The widening will occur in the median of I-80. The widths of the inside widening will be 17 feet-4 inches.
4. Horse Creek Bridge, Bridge No. 23-0011L, PM R28.57 - The widening will occur in the westbound direction of I-80. The width of the right side widening varies from 15 feet-3 inches to 16 feet-6 inches.
The Advance Planning Study drawings for these four structures are included in the East Segment Plans (Attachment D). Interim Features Interim features are not proposed for the Build Alternative. Express Lanes Operating Concept The project will align with BAIFA’s Concept of Operations, Business Requirements and System Requirements.
04 – SOL - 80 – PM R10.4/30.2
47
Operating Scenarios: There are different ways that express lanes can verify only toll-paying and toll-free vehicles use the lanes. Several scenarios were considered for MTC Express Lanes. For toll-paying vehicles, standard FasTrak® transponder, switchable FasTrak® transponder and pay-by-plate account were evaluated. For toll-free vehicles, standard FasTrak® transponder with carpool registration, switchable FasTrak® transponder, pay-by-plate account with carpool registration, and no transponder or account requirement were evaluated. From a toll operations perspective, the preferred approach is for all vehicles traveling in the express lanes during operational hours to carry a FasTrak® toll tag and to require eligible toll-free vehicles to declare their eligibility status using a “switchable” toll tag. This concept allows the toll system to automatically distinguish between toll-paying and toll-free vehicles and for cameras with Automatic License Plate Recognition (ALPR) technology to capture license plate images of any vehicle not carrying a toll tag for automatic toll and violation processing subject to BAIFA’s toll policies. Toll Collection: Consistent with BAIFA’s most recent toll collection strategy and planned Concept of Operations update, tolls will be automatically collected from registered motorists using FasTrak® transponders which are not declared as a qualifying carpool or other toll-free eligible vehicle. All vehicles in the express lane will have FasTrak® toll tags, and toll-free vehicles will have switchable toll tags toggled to the proper setting. If the toll system does not read a toll tag, cameras will capture the license plate image and a violation will be issued if the license plate is not registered to a FasTrak® account. If the license plate is registered to a FasTrak® account, the cost of the express lane trip will be charged to the FasTrak® account. Vehicle Eligibility for Toll-Free Express Lane Use: Per statutes (Streets and Highway Code, Section 149), HOVs are allowed to use express lanes free of charge. The existing HOV lanes within the West Segment limits operate with a two-or-more (2+) person per vehicle occupancy. Other vehicles permited by statute include motorcycles, vehicles that meet specified emission standards with a Department of Motor Vehicles issued decal, and emergency and other exempted vehicles. Single occupancy vehicles will be allowed to use the express lanes during operational hours for a price. Hours of Operation: Bay Area HOV lanes currently operate during the AM and PM peak periods and serve as general purpose lanes during all other times. The existing HOV lanes within the West Segment currently operate Monday to Friday between 5 to 10 AM and 3 to 7 PM. Upon project completion, it is expected that express lane hours of operation will be the same period as the existing HOV lane hours of operation. In the future, the hours of operation may be changed as necessary to provide satisfactory level of service.
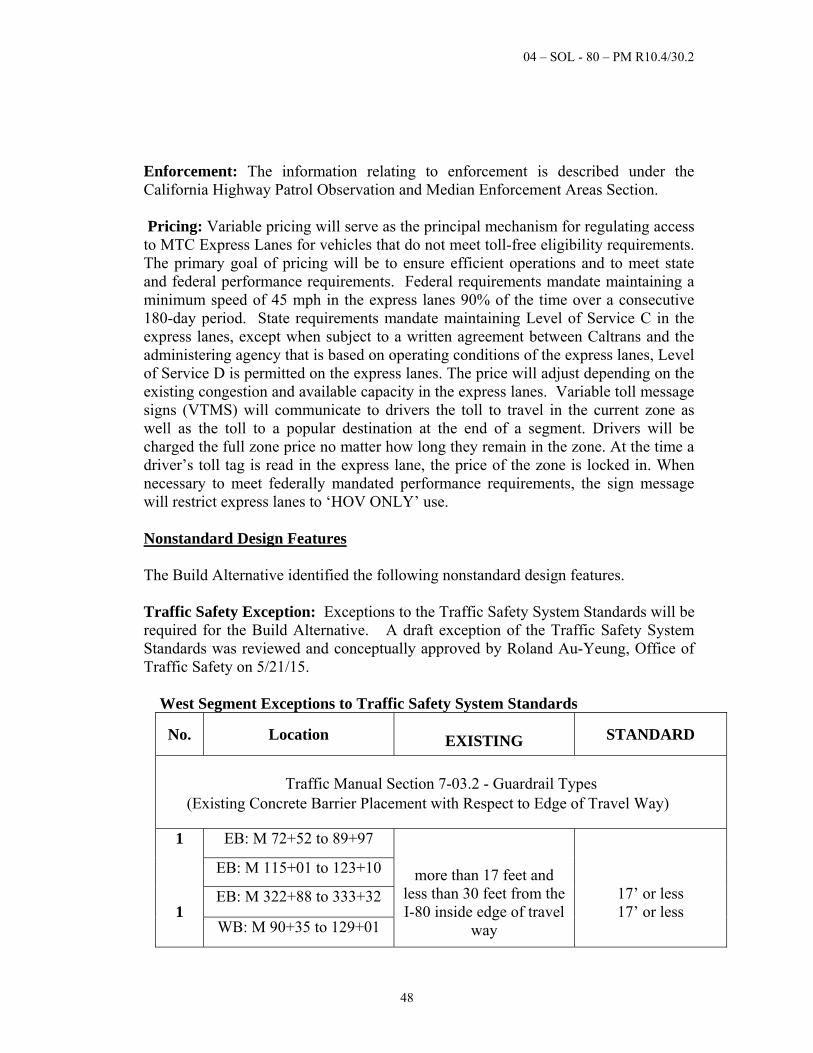
04 – SOL - 80 – PM R10.4/30.2
48
Enforcement: The information relating to enforcement is described under the California Highway Patrol Observation and Median Enforcement Areas Section. Pricing: Variable pricing will serve as the principal mechanism for regulating access to MTC Express Lanes for vehicles that do not meet toll-free eligibility requirements. The primary goal of pricing will be to ensure efficient operations and to meet state and federal performance requirements. Federal requirements mandate maintaining a minimum speed of 45 mph in the express lanes 90% of the time over a consecutive 180-day period. State requirements mandate maintaining Level of Service C in the express lanes, except when subject to a written agreement between Caltrans and the administering agency that is based on operating conditions of the express lanes, Level of Service D is permitted on the express lanes. The price will adjust depending on the existing congestion and available capacity in the express lanes. Variable toll message signs (VTMS) will communicate to drivers the toll to travel in the current zone as well as the toll to a popular destination at the end of a segment. Drivers will be charged the full zone price no matter how long they remain in the zone. At the time a driver’s toll tag is read in the express lane, the price of the zone is locked in. When necessary to meet federally mandated performance requirements, the sign message will restrict express lanes to ‘HOV ONLY’ use. Nonstandard Design Features The Build Alternative identified the following nonstandard design features. Traffic Safety Exception: Exceptions to the Traffic Safety System Standards will be required for the Build Alternative. A draft exception of the Traffic Safety System Standards was reviewed and conceptually approved by Roland Au-Yeung, Office of Traffic Safety on 5/21/15. West Segment Exceptions to Traffic Safety System Standards
No. Location
EXISTING STANDARD
Traffic Manual Section 7-03.2 - Guardrail Types
(Existing Concrete Barrier Placement with Respect to Edge of Travel Way)
1 1
EB: M 72+52 to 89+97
more than 17 feet and less than 30 feet from the I-80 inside edge of travel
way
17’ or less 17’ or less
EB: M 115+01 to 123+10
EB: M 322+88 to 333+32
WB: M 90+35 to 129+01
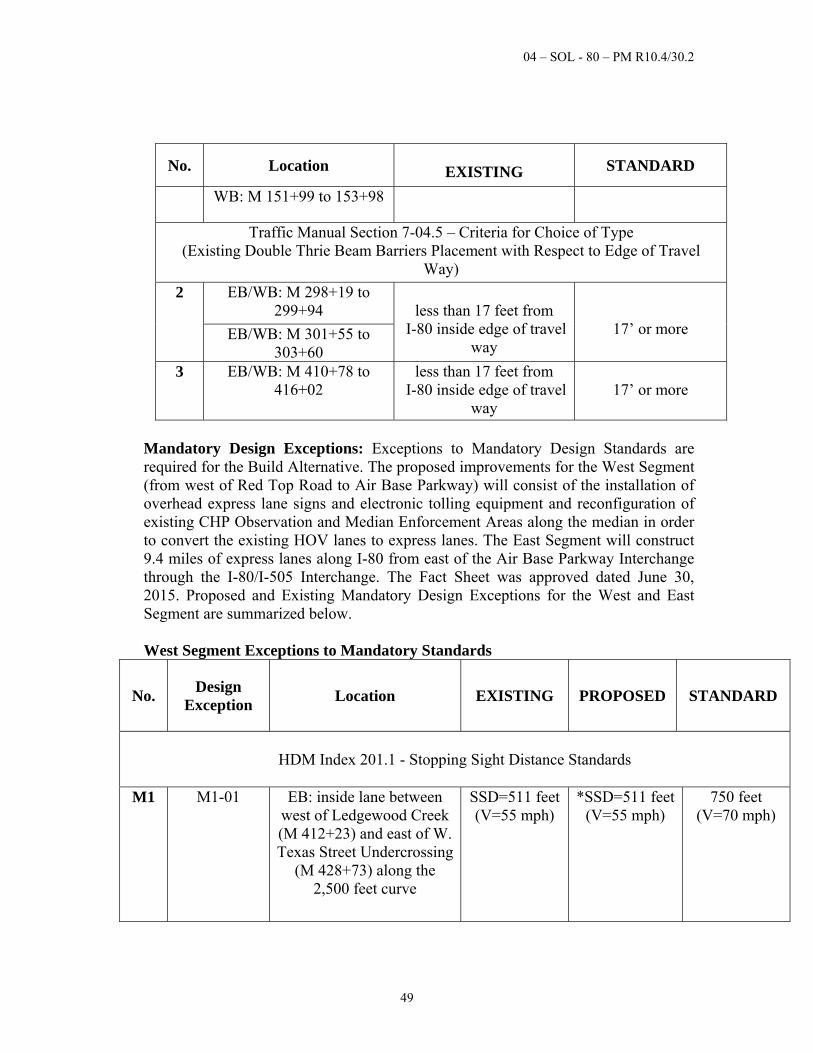
04 – SOL - 80 – PM R10.4/30.2
49
No. Location
EXISTING STANDARD
WB: M 151+99 to 153+98
Traffic Manual Section 7-04.5 – Criteria for Choice of Type (Existing Double Thrie Beam Barriers Placement with Respect to Edge of Travel
Way)
2 EB/WB: M 298+19 to 299+94
less than 17 feet from
I-80 inside edge of travel way
17’ or more EB/WB: M 301+55 to 303+60
3 EB/WB: M 410+78 to 416+02
less than 17 feet from I-80 inside edge of travel
way
17’ or more
Mandatory Design Exceptions: Exceptions to Mandatory Design Standards are required for the Build Alternative. The proposed improvements for the West Segment (from west of Red Top Road to Air Base Parkway) will consist of the installation of overhead express lane signs and electronic tolling equipment and reconfiguration of existing CHP Observation and Median Enforcement Areas along the median in order to convert the existing HOV lanes to express lanes. The East Segment will construct 9.4 miles of express lanes along I-80 from east of the Air Base Parkway Interchange through the I-80/I-505 Interchange. The Fact Sheet was approved dated June 30, 2015. Proposed and Existing Mandatory Design Exceptions for the West and East Segment are summarized below. West Segment Exceptions to Mandatory Standards
No. Design
Exception Location
EXISTING
PROPOSED STANDARD
HDM Index 201.1 - Stopping Sight Distance Standards
M1
M1-01 EB: inside lane between west of Ledgewood Creek (M 412+23) and east of W. Texas Street Undercrossing
(M 428+73) along the 2,500 feet curve
SSD=511 feet(V=55 mph)
*SSD=511 feet(V=55 mph)
750 feet (V=70 mph)
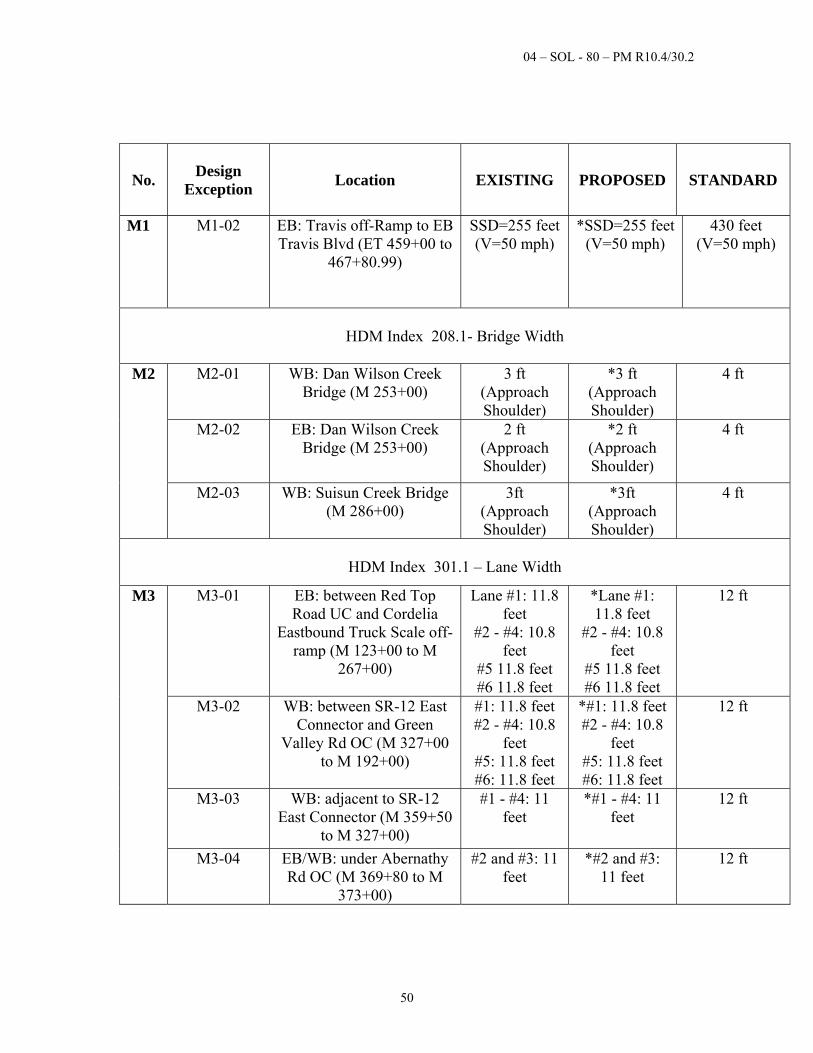
04 – SOL - 80 – PM R10.4/30.2
50
No. Design
Exception Location
EXISTING
PROPOSED STANDARD
M1
M1-02 EB: Travis off-Ramp to EB Travis Blvd (ET 459+00 to
467+80.99)
SSD=255 feet(V=50 mph)
*SSD=255 feet(V=50 mph)
430 feet (V=50 mph)
HDM Index 208.1- Bridge Width
M2
M2-01
WB: Dan Wilson Creek Bridge (M 253+00)
3 ft (Approach Shoulder)
*3 ft (Approach Shoulder)
4 ft
M2-02
EB: Dan Wilson Creek Bridge (M 253+00)
2 ft (Approach Shoulder)
*2 ft (Approach Shoulder)
4 ft
M2-03 WB: Suisun Creek Bridge (M 286+00)
3ft (Approach Shoulder)
*3ft (Approach Shoulder)
4 ft
HDM Index 301.1 – Lane Width
M3
M3-01
EB: between Red Top Road UC and Cordelia
Eastbound Truck Scale off-ramp (M 123+00 to M
267+00)
Lane #1: 11.8 feet
#2 - #4: 10.8 feet
#5 11.8 feet #6 11.8 feet
*Lane #1: 11.8 feet
#2 - #4: 10.8 feet
#5 11.8 feet #6 11.8 feet
12 ft
M3-02
WB: between SR-12 East Connector and Green
Valley Rd OC (M 327+00 to M 192+00)
#1: 11.8 feet #2 - #4: 10.8
feet #5: 11.8 feet #6: 11.8 feet
*#1: 11.8 feet#2 - #4: 10.8
feet #5: 11.8 feet #6: 11.8 feet
12 ft
M3-03
WB: adjacent to SR-12 East Connector (M 359+50
to M 327+00)
#1 - #4: 11 feet
*#1 - #4: 11 feet
12 ft
M3-04
EB/WB: under Abernathy Rd OC (M 369+80 to M
373+00)
#2 and #3: 11 feet
*#2 and #3: 11 feet
12 ft
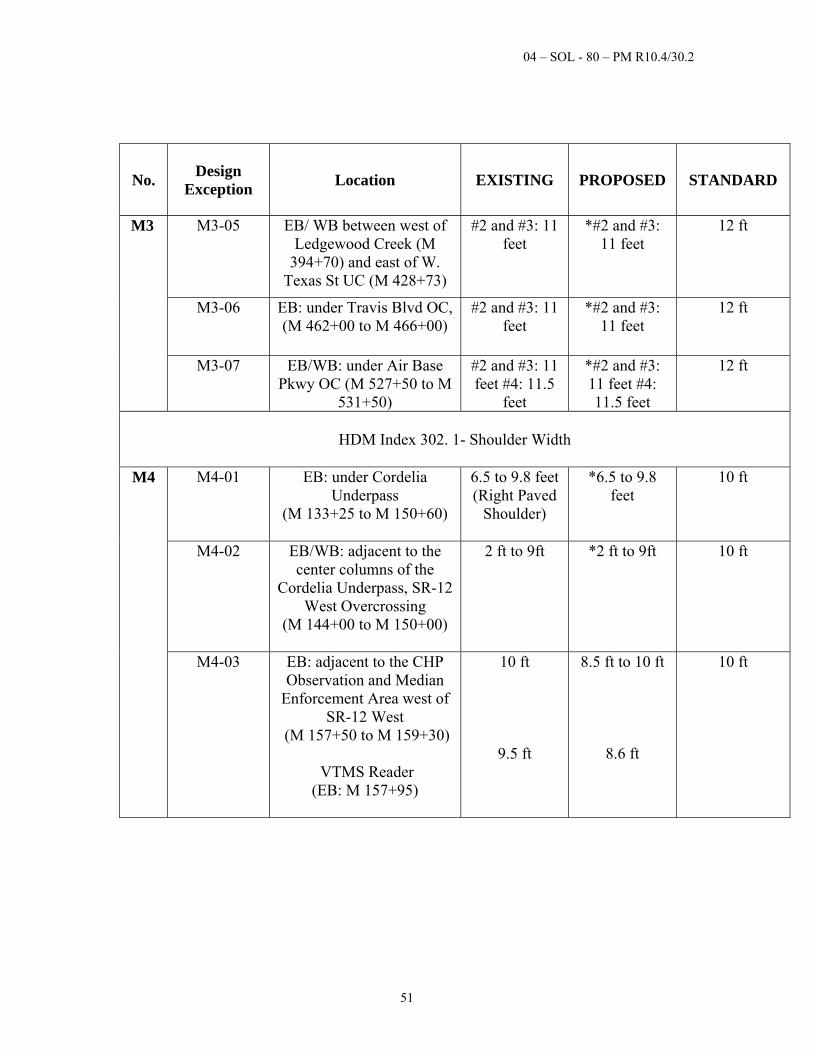
04 – SOL - 80 – PM R10.4/30.2
51
No. Design
Exception Location
EXISTING
PROPOSED STANDARD
M3 M3-05
EB/ WB between west of Ledgewood Creek (M
394+70) and east of W. Texas St UC (M 428+73)
#2 and #3: 11 feet
*#2 and #3: 11 feet
12 ft
M3-06
EB: under Travis Blvd OC, (M 462+00 to M 466+00)
#2 and #3: 11 feet
*#2 and #3: 11 feet
12 ft
M3-07 EB/WB: under Air Base Pkwy OC (M 527+50 to M
531+50)
#2 and #3: 11 feet #4: 11.5
feet
*#2 and #3: 11 feet #4: 11.5 feet
12 ft
HDM Index 302. 1- Shoulder Width
M4
M4-01
EB: under Cordelia Underpass
(M 133+25 to M 150+60)
6.5 to 9.8 feet (Right Paved
Shoulder)
*6.5 to 9.8 feet
10 ft
M4-02 EB/WB: adjacent to the center columns of the
Cordelia Underpass, SR-12 West Overcrossing
(M 144+00 to M 150+00)
2 ft to 9ft
*2 ft to 9ft
10 ft
M4-03 EB: adjacent to the CHP Observation and Median
Enforcement Area west of SR-12 West
(M 157+50 to M 159+30)
VTMS Reader (EB: M 157+95)
10 ft
9.5 ft
8.5 ft to 10 ft
8.6 ft
10 ft
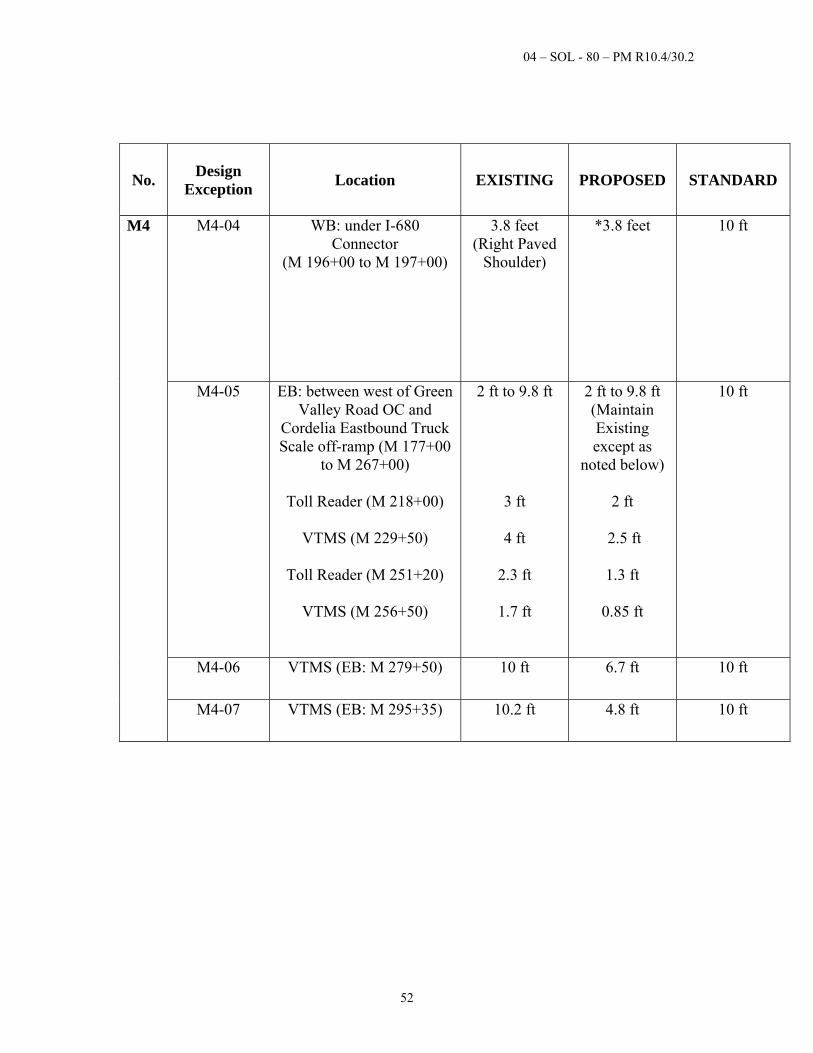
04 – SOL - 80 – PM R10.4/30.2
52
No. Design
Exception Location
EXISTING
PROPOSED STANDARD
M4
M4-04 WB: under I-680 Connector
(M 196+00 to M 197+00)
3.8 feet (Right Paved
Shoulder)
*3.8 feet
10 ft
M4-05 EB: between west of Green Valley Road OC and
Cordelia Eastbound Truck Scale off-ramp (M 177+00
to M 267+00)
Toll Reader (M 218+00)
VTMS (M 229+50)
Toll Reader (M 251+20)
VTMS (M 256+50)
2 ft to 9.8 ft
3 ft
4 ft
2.3 ft
1.7 ft
2 ft to 9.8 ft (Maintain Existing except as
noted below)
2 ft
2.5 ft
1.3 ft
0.85 ft
10 ft
M4-06 VTMS (EB: M 279+50) 10 ft 6.7 ft 10 ft
M4-07 VTMS (EB: M 295+35)
10.2 ft 4.8 ft 10 ft
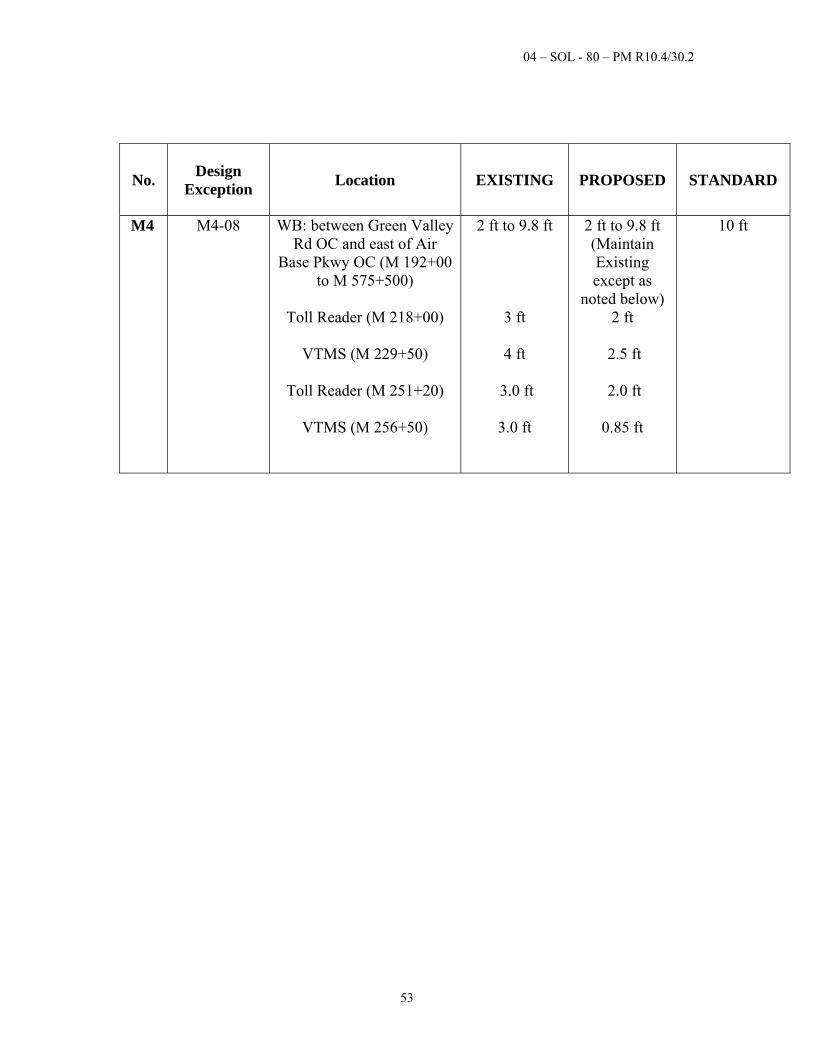
04 – SOL - 80 – PM R10.4/30.2
53
No. Design
Exception Location
EXISTING
PROPOSED STANDARD
M4 M4-08 WB: between Green Valley Rd OC and east of Air
Base Pkwy OC (M 192+00 to M 575+500)
Toll Reader (M 218+00)
VTMS (M 229+50)
Toll Reader (M 251+20)
VTMS (M 256+50)
2 ft to 9.8 ft
3 ft
4 ft
3.0 ft
3.0 ft
2 ft to 9.8 ft (Maintain Existing except as
noted below) 2 ft
2.5 ft
2.0 ft
0.85 ft
10 ft
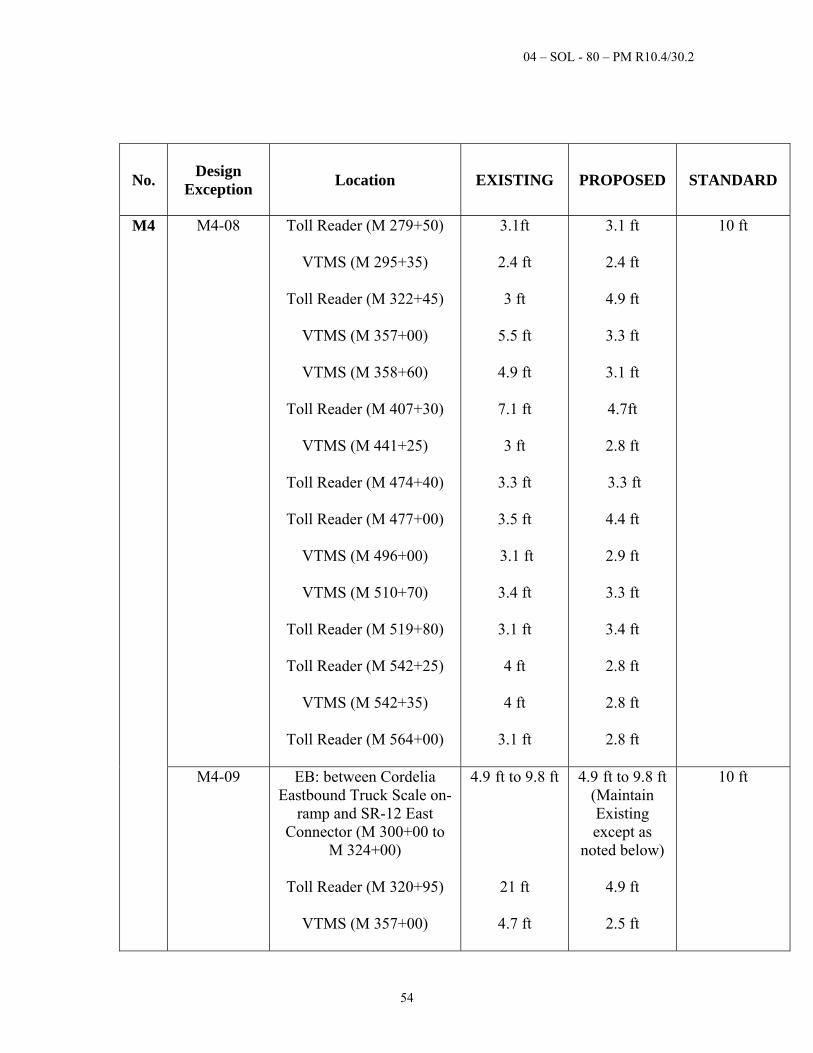
04 – SOL - 80 – PM R10.4/30.2
54
No. Design
Exception Location
EXISTING
PROPOSED STANDARD
M4
M4-08 Toll Reader (M 279+50)
VTMS (M 295+35)
Toll Reader (M 322+45)
VTMS (M 357+00)
VTMS (M 358+60)
Toll Reader (M 407+30)
VTMS (M 441+25)
Toll Reader (M 474+40)
Toll Reader (M 477+00)
VTMS (M 496+00)
VTMS (M 510+70)
Toll Reader (M 519+80)
Toll Reader (M 542+25)
VTMS (M 542+35)
Toll Reader (M 564+00)
3.1ft
2.4 ft
3 ft
5.5 ft
4.9 ft
7.1 ft
3 ft
3.3 ft
3.5 ft
3.1 ft
3.4 ft
3.1 ft
4 ft
4 ft
3.1 ft
3.1 ft
2.4 ft
4.9 ft
3.3 ft
3.1 ft
4.7ft
2.8 ft
3.3 ft
4.4 ft
2.9 ft
3.3 ft
3.4 ft
2.8 ft
2.8 ft
2.8 ft
10 ft
M4-09 EB: between Cordelia Eastbound Truck Scale on-
ramp and SR-12 East Connector (M 300+00 to
M 324+00)
Toll Reader (M 320+95)
VTMS (M 357+00)
4.9 ft to 9.8 ft
21 ft
4.7 ft
4.9 ft to 9.8 ft (Maintain Existing except as
noted below)
4.9 ft
2.5 ft
10 ft
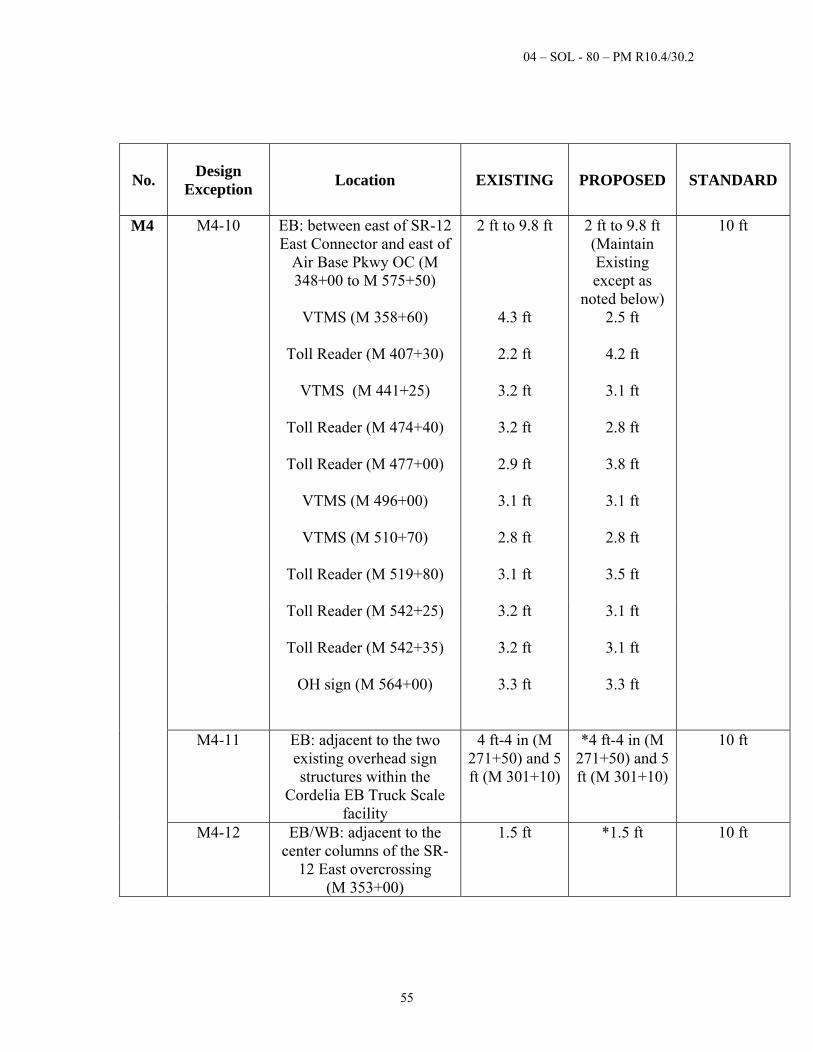
04 – SOL - 80 – PM R10.4/30.2
55
No. Design
Exception Location
EXISTING
PROPOSED STANDARD
M4 M4-10 EB: between east of SR-12 East Connector and east of
Air Base Pkwy OC (M 348+00 to M 575+50)
VTMS (M 358+60)
Toll Reader (M 407+30)
VTMS (M 441+25)
Toll Reader (M 474+40)
Toll Reader (M 477+00)
VTMS (M 496+00)
VTMS (M 510+70)
Toll Reader (M 519+80)
2 ft to 9.8 ft
4.3 ft
2.2 ft
3.2 ft
3.2 ft
2.9 ft
3.1 ft
2.8 ft
3.1 ft
2 ft to 9.8 ft (Maintain Existing except as
noted below) 2.5 ft
4.2 ft
3.1 ft
2.8 ft
3.8 ft
3.1 ft
2.8 ft
3.5 ft
10 ft
Toll Reader (M 542+25)
Toll Reader (M 542+35)
OH sign (M 564+00)
3.2 ft
3.2 ft
3.3 ft
3.1 ft
3.1 ft
3.3 ft
M4-11 EB: adjacent to the two existing overhead sign structures within the
Cordelia EB Truck Scale facility
4 ft-4 in (M 271+50) and 5 ft (M 301+10)
*4 ft-4 in (M 271+50) and 5 ft (M 301+10)
10 ft
M4-12 EB/WB: adjacent to the center columns of the SR-
12 East overcrossing (M 353+00)
1.5 ft *1.5 ft 10 ft
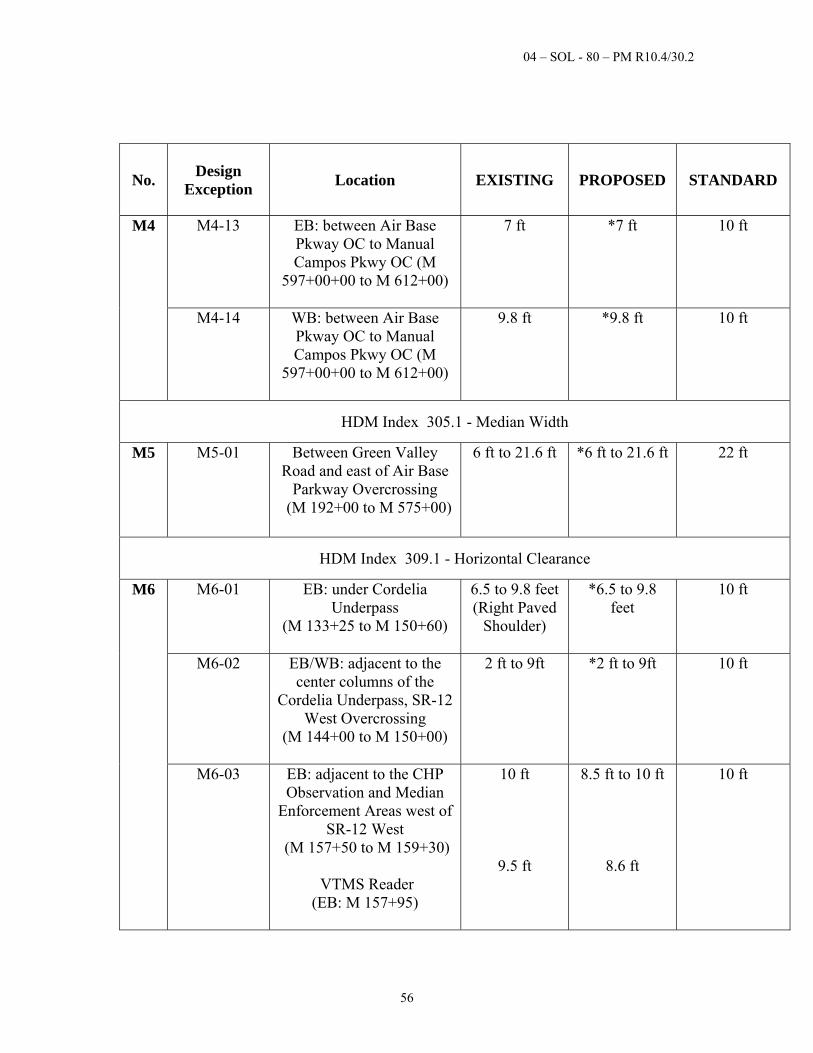
04 – SOL - 80 – PM R10.4/30.2
56
No. Design
Exception Location
EXISTING
PROPOSED STANDARD
M4
M4-13 EB: between Air Base Pkway OC to Manual Campos Pkwy OC (M
597+00+00 to M 612+00)
7 ft *7 ft 10 ft
M4-14 WB: between Air Base Pkway OC to Manual Campos Pkwy OC (M
597+00+00 to M 612+00)
9.8 ft *9.8 ft 10 ft
HDM Index 305.1 - Median Width
M5 M5-01 Between Green Valley Road and east of Air Base
Parkway Overcrossing (M 192+00 to M 575+00)
6 ft to 21.6 ft *6 ft to 21.6 ft 22 ft
HDM Index 309.1 - Horizontal Clearance
M6
M6-01
EB: under Cordelia Underpass
(M 133+25 to M 150+60)
6.5 to 9.8 feet (Right Paved
Shoulder)
*6.5 to 9.8 feet
10 ft
M6-02 EB/WB: adjacent to the center columns of the
Cordelia Underpass, SR-12 West Overcrossing
(M 144+00 to M 150+00)
2 ft to 9ft
*2 ft to 9ft
10 ft
M6-03 EB: adjacent to the CHP Observation and Median
Enforcement Areas west of SR-12 West
(M 157+50 to M 159+30)
VTMS Reader (EB: M 157+95)
10 ft
9.5 ft
8.5 ft to 10 ft
8.6 ft
10 ft
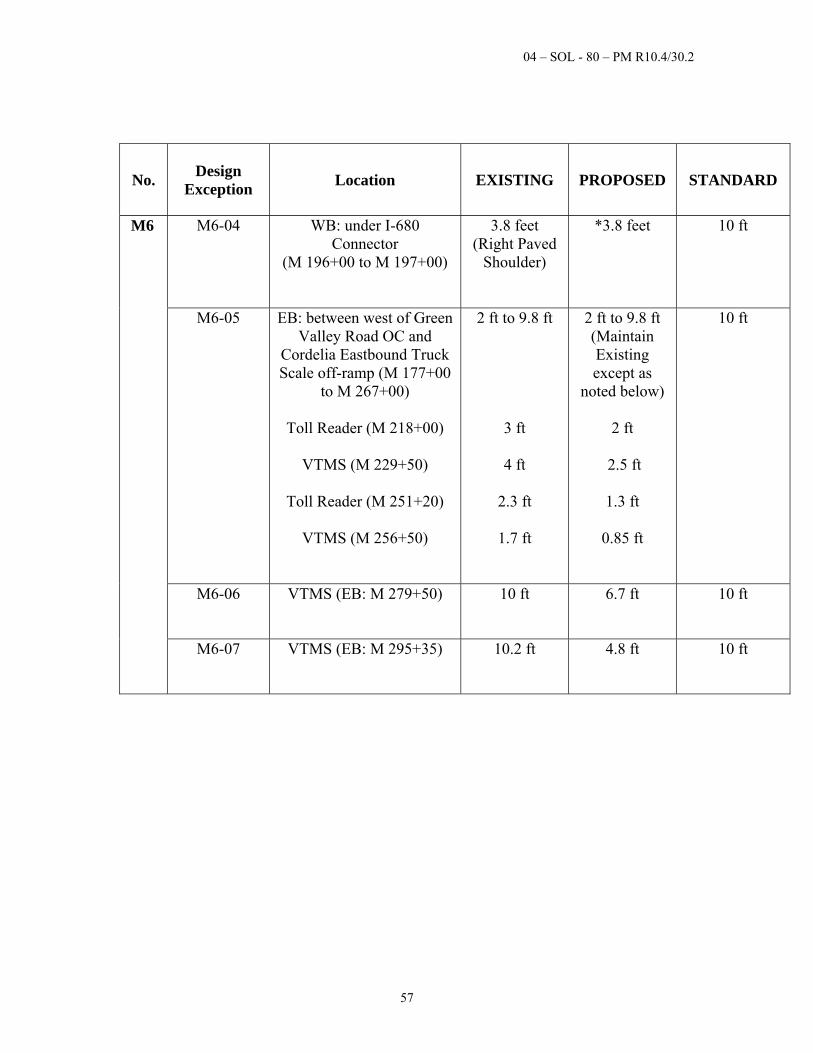
04 – SOL - 80 – PM R10.4/30.2
57
No. Design
Exception Location
EXISTING
PROPOSED STANDARD
M6 M6-04 WB: under I-680 Connector
(M 196+00 to M 197+00)
3.8 feet (Right Paved
Shoulder)
*3.8 feet
10 ft
M6-05 EB: between west of Green Valley Road OC and
Cordelia Eastbound Truck Scale off-ramp (M 177+00
to M 267+00)
Toll Reader (M 218+00)
VTMS (M 229+50)
Toll Reader (M 251+20)
VTMS (M 256+50)
2 ft to 9.8 ft
3 ft
4 ft
2.3 ft
1.7 ft
2 ft to 9.8 ft (Maintain Existing except as
noted below)
2 ft
2.5 ft
1.3 ft
0.85 ft
10 ft
M6-06 VTMS (EB: M 279+50) 10 ft 6.7 ft 10 ft
M6-07 VTMS (EB: M 295+35)
10.2 ft 4.8 ft 10 ft
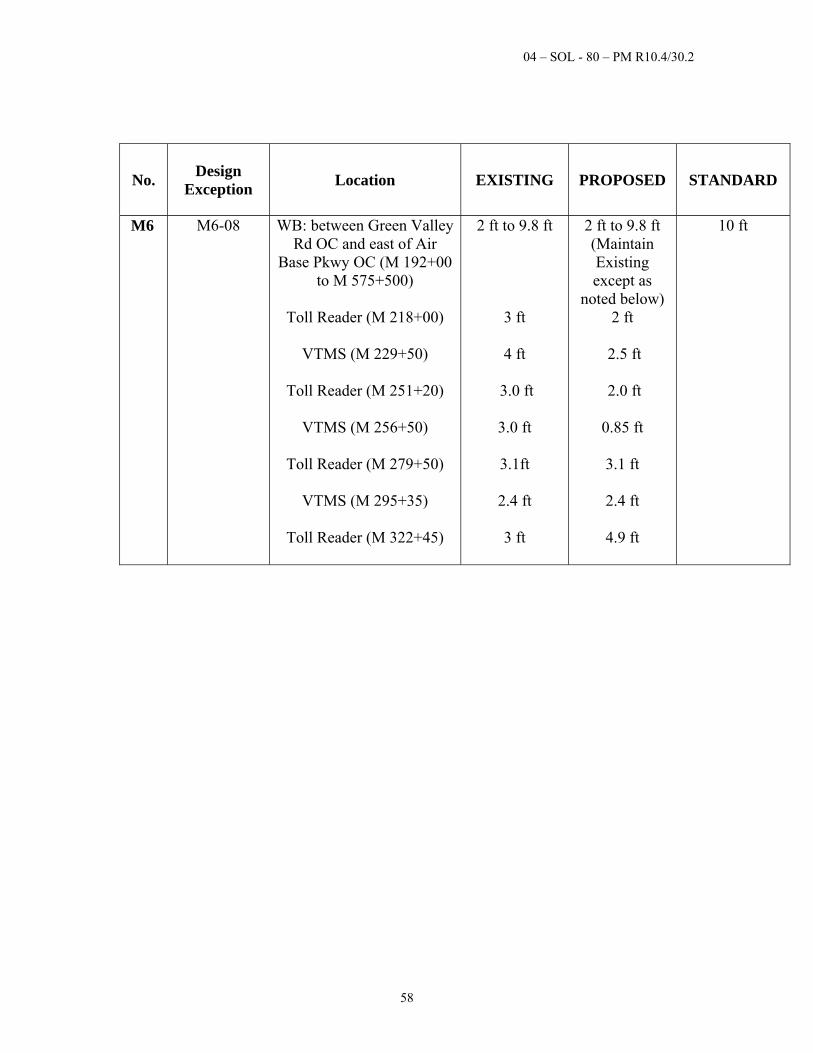
04 – SOL - 80 – PM R10.4/30.2
58
No. Design
Exception Location
EXISTING
PROPOSED STANDARD
M6 M6-08 WB: between Green Valley Rd OC and east of Air
Base Pkwy OC (M 192+00 to M 575+500)
Toll Reader (M 218+00)
VTMS (M 229+50)
Toll Reader (M 251+20)
VTMS (M 256+50)
Toll Reader (M 279+50)
VTMS (M 295+35)
Toll Reader (M 322+45)
2 ft to 9.8 ft
3 ft
4 ft
3.0 ft
3.0 ft
3.1ft
2.4 ft
3 ft
2 ft to 9.8 ft (Maintain Existing except as
noted below) 2 ft
2.5 ft
2.0 ft
0.85 ft
3.1 ft
2.4 ft
4.9 ft
10 ft
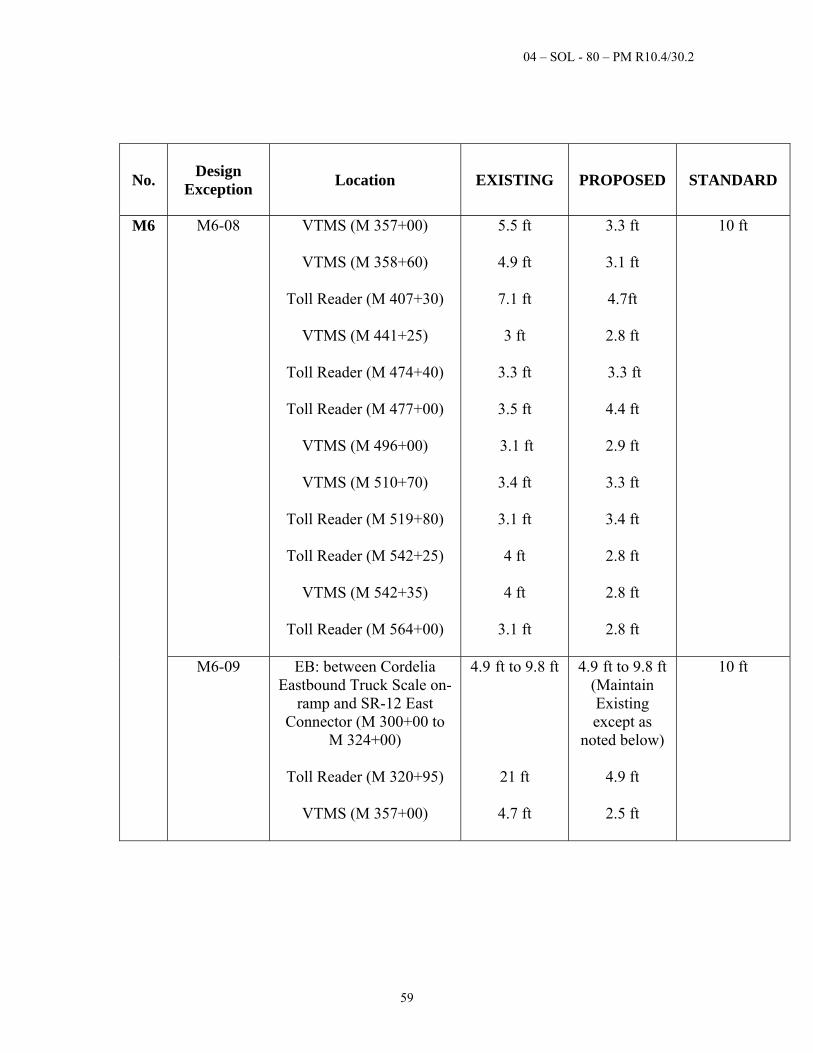
04 – SOL - 80 – PM R10.4/30.2
59
No. Design
Exception Location
EXISTING
PROPOSED STANDARD
M6
M6-08 VTMS (M 357+00)
VTMS (M 358+60)
Toll Reader (M 407+30)
VTMS (M 441+25)
Toll Reader (M 474+40)
Toll Reader (M 477+00)
VTMS (M 496+00)
VTMS (M 510+70)
Toll Reader (M 519+80)
Toll Reader (M 542+25)
VTMS (M 542+35)
Toll Reader (M 564+00)
5.5 ft
4.9 ft
7.1 ft
3 ft
3.3 ft
3.5 ft
3.1 ft
3.4 ft
3.1 ft
4 ft
4 ft
3.1 ft
3.3 ft
3.1 ft
4.7ft
2.8 ft
3.3 ft
4.4 ft
2.9 ft
3.3 ft
3.4 ft
2.8 ft
2.8 ft
2.8 ft
10 ft
M6-09 EB: between Cordelia Eastbound Truck Scale on-
ramp and SR-12 East Connector (M 300+00 to
M 324+00)
Toll Reader (M 320+95)
VTMS (M 357+00)
4.9 ft to 9.8 ft
21 ft
4.7 ft
4.9 ft to 9.8 ft (Maintain Existing except as
noted below)
4.9 ft
2.5 ft
10 ft
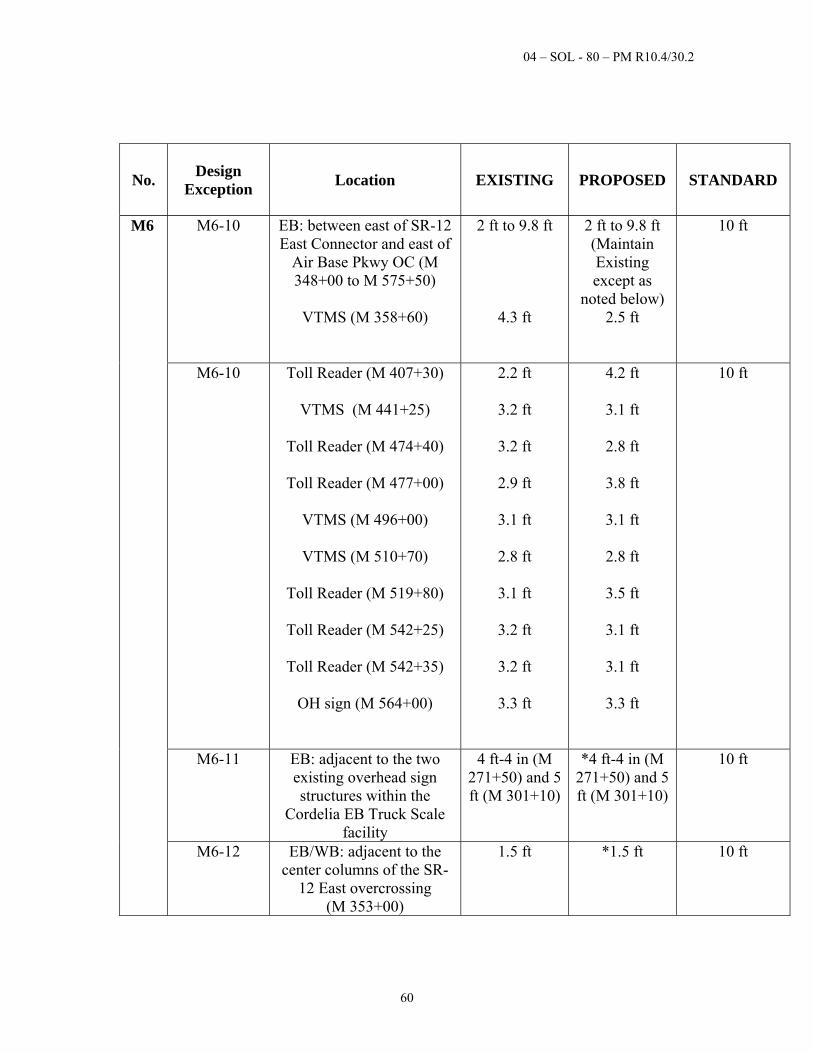
04 – SOL - 80 – PM R10.4/30.2
60
No. Design
Exception Location
EXISTING
PROPOSED STANDARD
M6 M6-10 EB: between east of SR-12 East Connector and east of
Air Base Pkwy OC (M 348+00 to M 575+50)
VTMS (M 358+60)
2 ft to 9.8 ft
4.3 ft
2 ft to 9.8 ft (Maintain Existing except as
noted below) 2.5 ft
10 ft
M6-10 Toll Reader (M 407+30)
VTMS (M 441+25)
Toll Reader (M 474+40)
Toll Reader (M 477+00)
VTMS (M 496+00)
VTMS (M 510+70)
Toll Reader (M 519+80)
Toll Reader (M 542+25)
Toll Reader (M 542+35)
OH sign (M 564+00)
2.2 ft
3.2 ft
3.2 ft
2.9 ft
3.1 ft
2.8 ft
3.1 ft
3.2 ft
3.2 ft
3.3 ft
4.2 ft
3.1 ft
2.8 ft
3.8 ft
3.1 ft
2.8 ft
3.5 ft
3.1 ft
3.1 ft
3.3 ft
10 ft
M6-11 EB: adjacent to the two existing overhead sign structures within the
Cordelia EB Truck Scale facility
4 ft-4 in (M 271+50) and 5 ft (M 301+10)
*4 ft-4 in (M 271+50) and 5 ft (M 301+10)
10 ft
M6-12 EB/WB: adjacent to the center columns of the SR-
12 East overcrossing (M 353+00)
1.5 ft *1.5 ft 10 ft
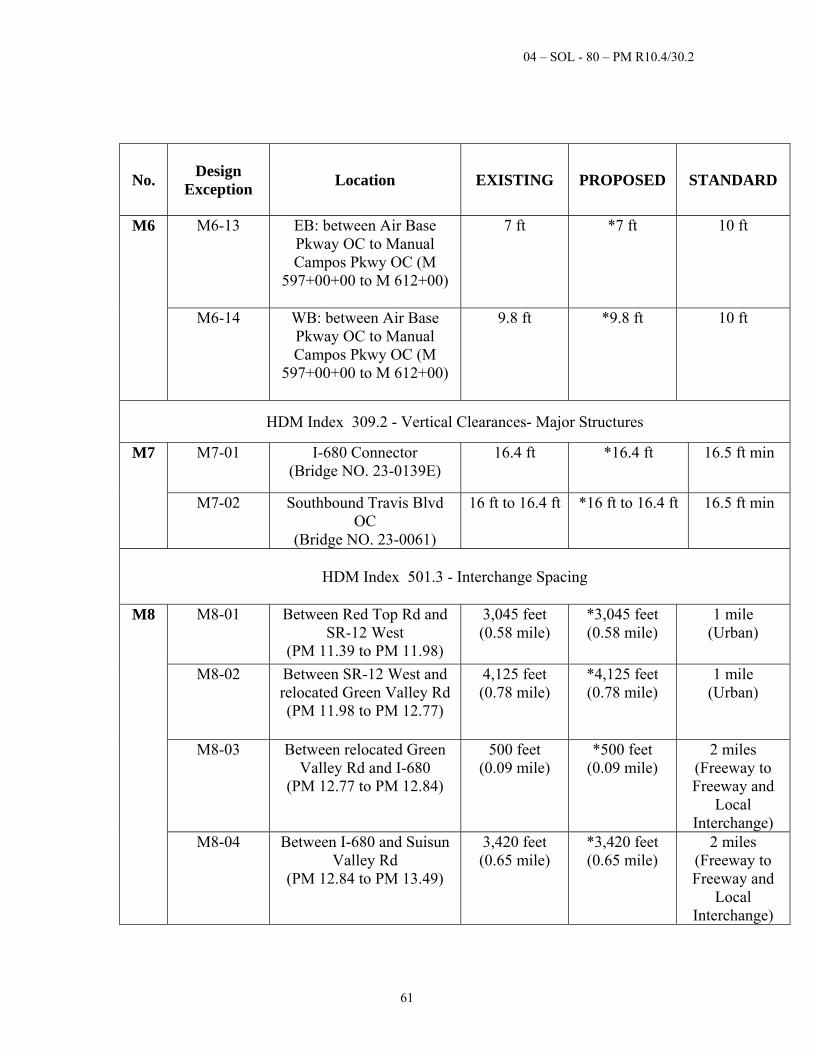
04 – SOL - 80 – PM R10.4/30.2
61
No. Design
Exception Location
EXISTING
PROPOSED STANDARD
M6 M6-13 EB: between Air Base Pkway OC to Manual Campos Pkwy OC (M
597+00+00 to M 612+00)
7 ft *7 ft 10 ft
M6-14 WB: between Air Base Pkway OC to Manual Campos Pkwy OC (M
597+00+00 to M 612+00)
9.8 ft *9.8 ft 10 ft
HDM Index 309.2 - Vertical Clearances- Major Structures
M7 M7-01 I-680 Connector (Bridge NO. 23-0139E)
16.4 ft *16.4 ft 16.5 ft min
M7-02 Southbound Travis Blvd OC
(Bridge NO. 23-0061)
16 ft to 16.4 ft *16 ft to 16.4 ft 16.5 ft min
HDM Index 501.3 - Interchange Spacing
M8
M8-01
Between Red Top Rd and SR-12 West
(PM 11.39 to PM 11.98)
3,045 feet (0.58 mile)
*3,045 feet (0.58 mile)
1 mile (Urban)
M8-02
Between SR-12 West and relocated Green Valley Rd(PM 11.98 to PM 12.77)
4,125 feet (0.78 mile)
*4,125 feet (0.78 mile)
1 mile (Urban)
M8-03
Between relocated Green Valley Rd and I-680
(PM 12.77 to PM 12.84)
500 feet (0.09 mile)
*500 feet (0.09 mile)
2 miles (Freeway to Freeway and
Local Interchange)
M8-04
Between I-680 and Suisun Valley Rd
(PM 12.84 to PM 13.49)
3,420 feet (0.65 mile)
*3,420 feet (0.65 mile)
2 miles (Freeway to Freeway and
Local Interchange)
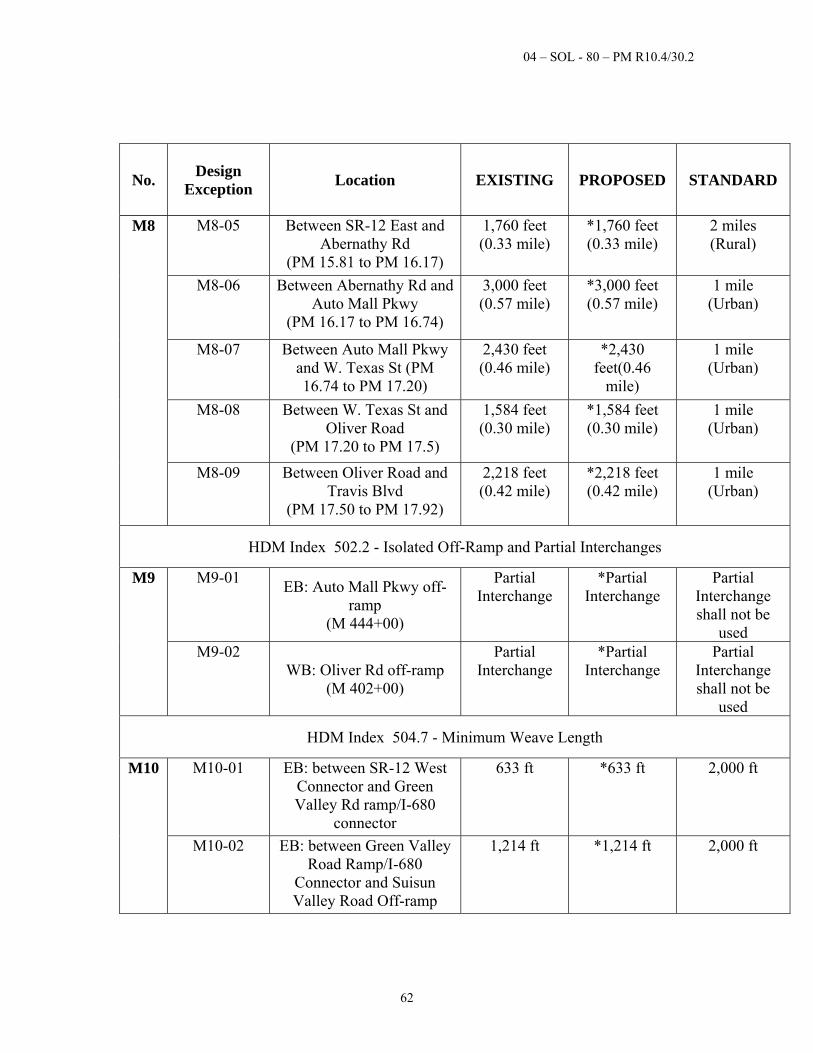
04 – SOL - 80 – PM R10.4/30.2
62
No. Design
Exception Location
EXISTING
PROPOSED STANDARD
M8
M8-05
Between SR-12 East and Abernathy Rd
(PM 15.81 to PM 16.17)
1,760 feet (0.33 mile)
*1,760 feet (0.33 mile)
2 miles (Rural)
M8-06
Between Abernathy Rd and Auto Mall Pkwy
(PM 16.17 to PM 16.74)
3,000 feet (0.57 mile)
*3,000 feet (0.57 mile)
1 mile (Urban)
M8-07
Between Auto Mall Pkwy and W. Texas St (PM 16.74 to PM 17.20)
2,430 feet (0.46 mile)
*2,430 feet(0.46
mile)
1 mile (Urban)
M8-08 Between W. Texas St and Oliver Road
(PM 17.20 to PM 17.5)
1,584 feet (0.30 mile)
*1,584 feet (0.30 mile)
1 mile (Urban)
M8-09 Between Oliver Road and Travis Blvd
(PM 17.50 to PM 17.92)
2,218 feet (0.42 mile)
*2,218 feet (0.42 mile)
1 mile (Urban)
HDM Index 502.2 - Isolated Off-Ramp and Partial Interchanges
M9
M9-01
EB: Auto Mall Pkwy off-ramp
(M 444+00)
Partial Interchange
*Partial Interchange
Partial Interchange shall not be
used M9-02
WB: Oliver Rd off-ramp (M 402+00)
Partial Interchange
*Partial Interchange
Partial Interchange shall not be
used
HDM Index 504.7 - Minimum Weave Length
M10
M10-01 EB: between SR-12 West Connector and Green Valley Rd ramp/I-680
connector
633 ft *633 ft 2,000 ft
M10-02 EB: between Green Valley Road Ramp/I-680
Connector and Suisun Valley Road Off-ramp
1,214 ft *1,214 ft 2,000 ft
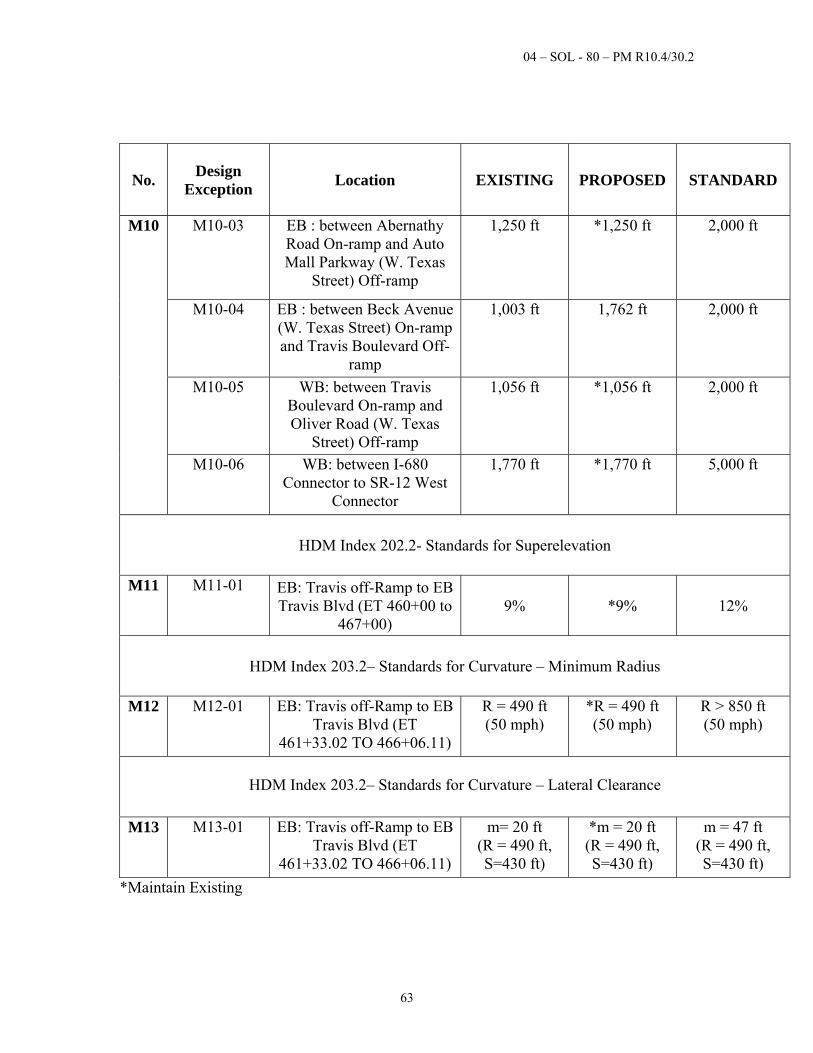
04 – SOL - 80 – PM R10.4/30.2
63
No. Design
Exception Location
EXISTING
PROPOSED STANDARD
M10
M10-03 EB : between Abernathy Road On-ramp and Auto Mall Parkway (W. Texas
Street) Off-ramp
1,250 ft *1,250 ft 2,000 ft
M10-04 EB : between Beck Avenue (W. Texas Street) On-ramp and Travis Boulevard Off-
ramp
1,003 ft
1,762 ft 2,000 ft
M10-05 WB: between Travis Boulevard On-ramp and Oliver Road (W. Texas
Street) Off-ramp
1,056 ft *1,056 ft 2,000 ft
M10-06 WB: between I-680 Connector to SR-12 West
Connector
1,770 ft *1,770 ft 5,000 ft
HDM Index 202.2- Standards for Superelevation
M11 M11-01 EB: Travis off-Ramp to EB Travis Blvd (ET 460+00 to
467+00) 9% *9% 12%
HDM Index 203.2– Standards for Curvature – Minimum Radius
M12 M12-01 EB: Travis off-Ramp to EB Travis Blvd (ET
461+33.02 TO 466+06.11)
R = 490 ft (50 mph)
*R = 490 ft (50 mph)
R > 850 ft (50 mph)
HDM Index 203.2– Standards for Curvature – Lateral Clearance
M13 M13-01 EB: Travis off-Ramp to EB Travis Blvd (ET
461+33.02 TO 466+06.11)
m= 20 ft (R = 490 ft, S=430 ft)
*m = 20 ft (R = 490 ft, S=430 ft)
m = 47 ft (R = 490 ft, S=430 ft)
*Maintain Existing
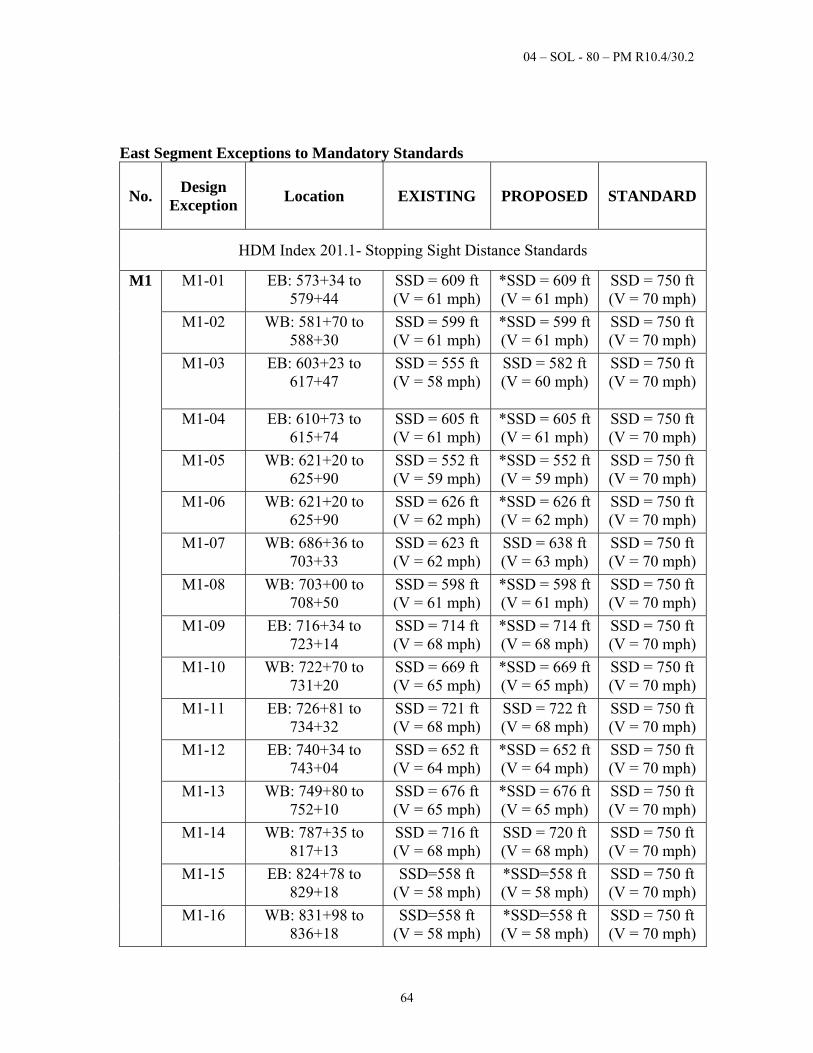
04 – SOL - 80 – PM R10.4/30.2
64
East Segment Exceptions to Mandatory Standards
No. Design
Exception Location EXISTING PROPOSED STANDARD
HDM Index 201.1- Stopping Sight Distance Standards
M1
M1-01 EB: 573+34 to 579+44
SSD = 609 ft (V = 61 mph)
*SSD = 609 ft (V = 61 mph)
SSD = 750 ft (V = 70 mph)
M1-02 WB: 581+70 to 588+30
SSD = 599 ft (V = 61 mph)
*SSD = 599 ft (V = 61 mph)
SSD = 750 ft (V = 70 mph)
M1-03 EB: 603+23 to 617+47
SSD = 555 ft(V = 58 mph)
SSD = 582 ft (V = 60 mph)
SSD = 750 ft (V = 70 mph)
M1-04 EB: 610+73 to 615+74
SSD = 605 ft (V = 61 mph)
*SSD = 605 ft (V = 61 mph)
SSD = 750 ft (V = 70 mph)
M1-05 WB: 621+20 to 625+90
SSD = 552 ft (V = 59 mph)
*SSD = 552 ft (V = 59 mph)
SSD = 750 ft (V = 70 mph)
M1-06 WB: 621+20 to 625+90
SSD = 626 ft (V = 62 mph)
*SSD = 626 ft (V = 62 mph)
SSD = 750 ft (V = 70 mph)
M1-07 WB: 686+36 to 703+33
SSD = 623 ft (V = 62 mph)
SSD = 638 ft (V = 63 mph)
SSD = 750 ft (V = 70 mph)
M1-08 WB: 703+00 to 708+50
SSD = 598 ft (V = 61 mph)
*SSD = 598 ft (V = 61 mph)
SSD = 750 ft (V = 70 mph)
M1-09 EB: 716+34 to 723+14
SSD = 714 ft (V = 68 mph)
*SSD = 714 ft (V = 68 mph)
SSD = 750 ft (V = 70 mph)
M1-10 WB: 722+70 to 731+20
SSD = 669 ft (V = 65 mph)
*SSD = 669 ft (V = 65 mph)
SSD = 750 ft (V = 70 mph)
M1-11 EB: 726+81 to 734+32
SSD = 721 ft (V = 68 mph)
SSD = 722 ft (V = 68 mph)
SSD = 750 ft (V = 70 mph)
M1-12 EB: 740+34 to 743+04
SSD = 652 ft (V = 64 mph)
*SSD = 652 ft (V = 64 mph)
SSD = 750 ft (V = 70 mph)
M1-13 WB: 749+80 to 752+10
SSD = 676 ft (V = 65 mph)
*SSD = 676 ft (V = 65 mph)
SSD = 750 ft (V = 70 mph)
M1-14 WB: 787+35 to 817+13
SSD = 716 ft (V = 68 mph)
SSD = 720 ft (V = 68 mph)
SSD = 750 ft (V = 70 mph)
M1-15 EB: 824+78 to 829+18
SSD=558 ft (V = 58 mph)
*SSD=558 ft (V = 58 mph)
SSD = 750 ft (V = 70 mph)
M1-16 WB: 831+98 to 836+18
SSD=558 ft (V = 58 mph)
*SSD=558 ft (V = 58 mph)
SSD = 750 ft (V = 70 mph)
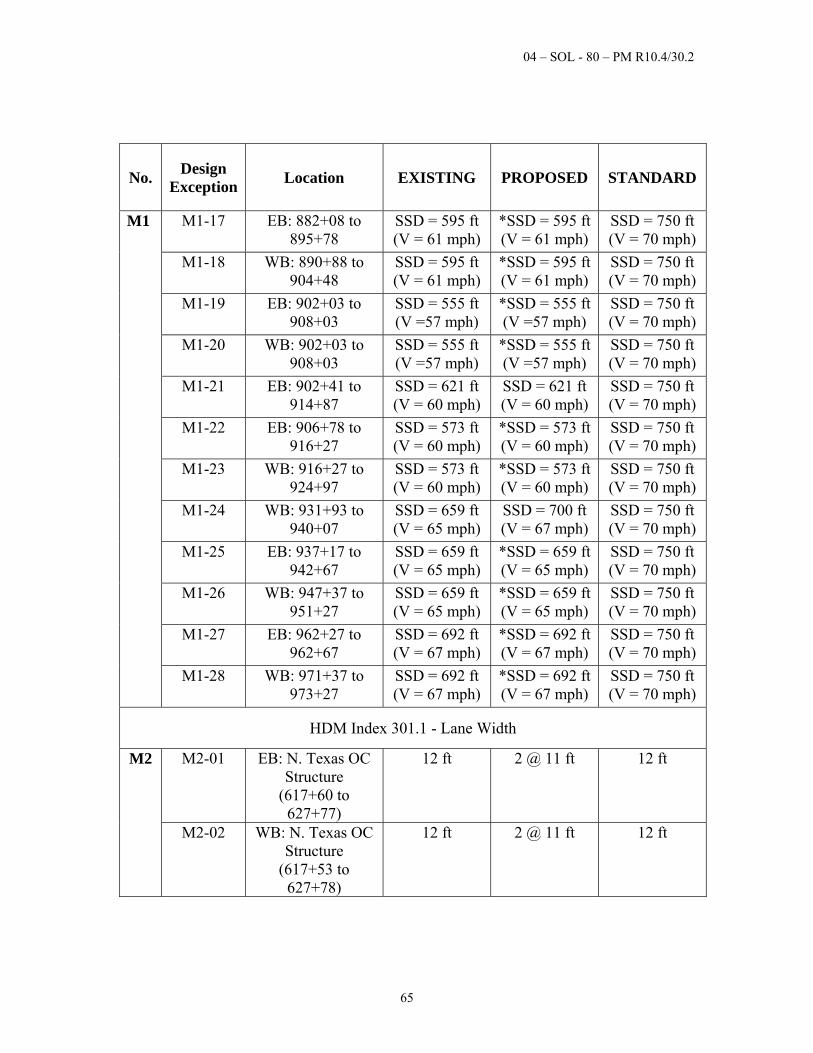
04 – SOL - 80 – PM R10.4/30.2
65
No. Design
Exception Location EXISTING PROPOSED STANDARD
M1 M1-17 EB: 882+08 to 895+78
SSD = 595 ft (V = 61 mph)
*SSD = 595 ft (V = 61 mph)
SSD = 750 ft (V = 70 mph)
M1-18 WB: 890+88 to 904+48
SSD = 595 ft (V = 61 mph)
*SSD = 595 ft (V = 61 mph)
SSD = 750 ft (V = 70 mph)
M1-19 EB: 902+03 to 908+03
SSD = 555 ft (V =57 mph)
*SSD = 555 ft (V =57 mph)
SSD = 750 ft (V = 70 mph)
M1-20 WB: 902+03 to 908+03
SSD = 555 ft (V =57 mph)
*SSD = 555 ft (V =57 mph)
SSD = 750 ft (V = 70 mph)
M1-21 EB: 902+41 to 914+87
SSD = 621 ft (V = 60 mph)
SSD = 621 ft (V = 60 mph)
SSD = 750 ft (V = 70 mph)
M1-22 EB: 906+78 to 916+27
SSD = 573 ft (V = 60 mph)
*SSD = 573 ft (V = 60 mph)
SSD = 750 ft (V = 70 mph)
M1-23 WB: 916+27 to 924+97
SSD = 573 ft (V = 60 mph)
*SSD = 573 ft (V = 60 mph)
SSD = 750 ft (V = 70 mph)
M1-24 WB: 931+93 to 940+07
SSD = 659 ft (V = 65 mph)
SSD = 700 ft (V = 67 mph)
SSD = 750 ft (V = 70 mph)
M1-25 EB: 937+17 to 942+67
SSD = 659 ft (V = 65 mph)
*SSD = 659 ft (V = 65 mph)
SSD = 750 ft (V = 70 mph)
M1-26 WB: 947+37 to 951+27
SSD = 659 ft (V = 65 mph)
*SSD = 659 ft (V = 65 mph)
SSD = 750 ft (V = 70 mph)
M1-27 EB: 962+27 to 962+67
SSD = 692 ft (V = 67 mph)
*SSD = 692 ft (V = 67 mph)
SSD = 750 ft (V = 70 mph)
M1-28 WB: 971+37 to 973+27
SSD = 692 ft (V = 67 mph)
*SSD = 692 ft (V = 67 mph)
SSD = 750 ft (V = 70 mph)
HDM Index 301.1 - Lane Width
M2
M2-01 EB: N. Texas OC Structure
(617+60 to 627+77)
12 ft 2 @ 11 ft 12 ft
M2-02 WB: N. Texas OC Structure
(617+53 to 627+78)
12 ft 2 @ 11 ft 12 ft
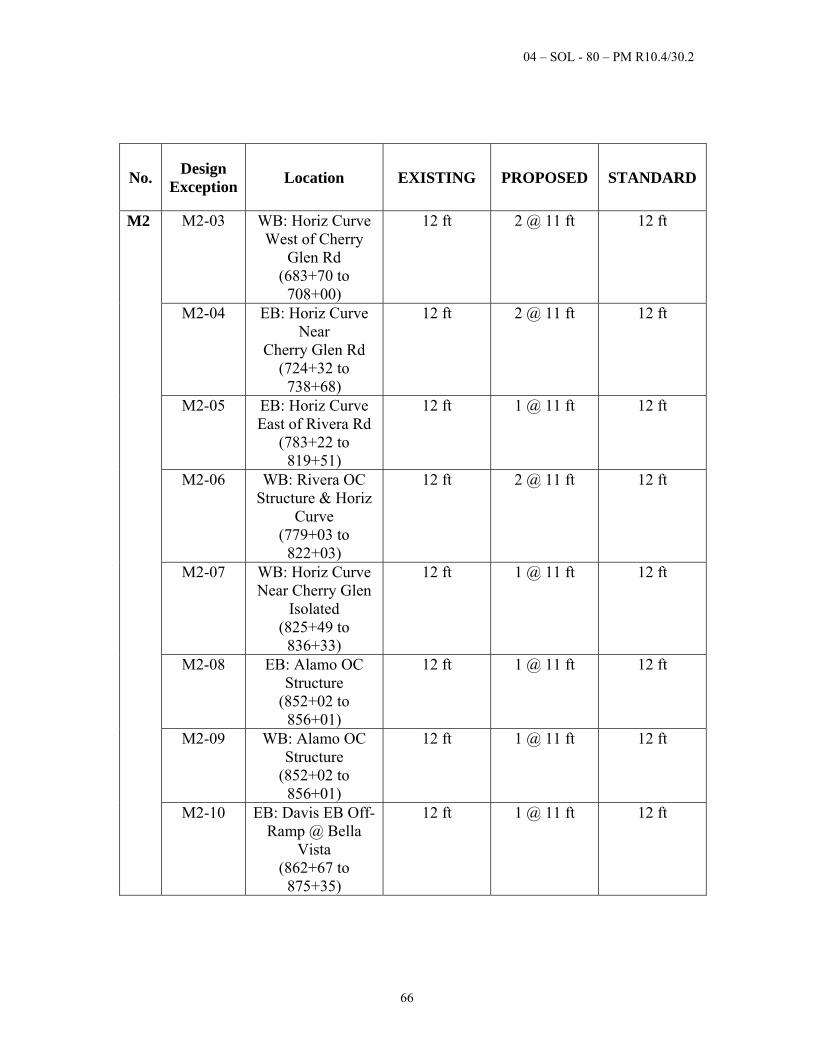
04 – SOL - 80 – PM R10.4/30.2
66
No. Design
Exception Location EXISTING PROPOSED STANDARD
M2
M2-03 WB: Horiz Curve West of Cherry
Glen Rd (683+70 to
708+00)
12 ft 2 @ 11 ft 12 ft
M2-04 EB: Horiz Curve Near
Cherry Glen Rd (724+32 to
738+68)
12 ft 2 @ 11 ft 12 ft
M2-05 EB: Horiz Curve East of Rivera Rd
(783+22 to 819+51)
12 ft 1 @ 11 ft 12 ft
M2-06 WB: Rivera OC Structure & Horiz
Curve (779+03 to
822+03)
12 ft 2 @ 11 ft 12 ft
M2-07 WB: Horiz Curve Near Cherry Glen
Isolated (825+49 to
836+33)
12 ft 1 @ 11 ft 12 ft
M2-08 EB: Alamo OC Structure
(852+02 to 856+01)
12 ft 1 @ 11 ft 12 ft
M2-09 WB: Alamo OC Structure
(852+02 to 856+01)
12 ft 1 @ 11 ft 12 ft
M2-10 EB: Davis EB Off-Ramp @ Bella
Vista (862+67 to
875+35)
12 ft 1 @ 11 ft 12 ft
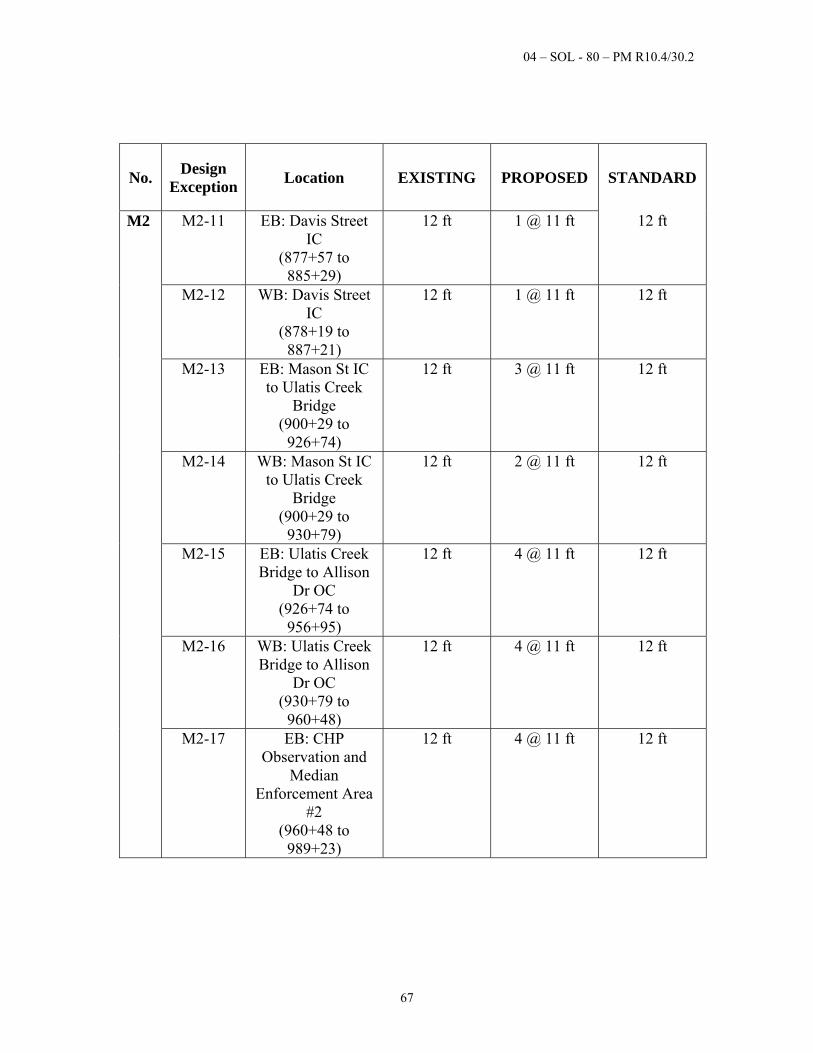
04 – SOL - 80 – PM R10.4/30.2
67
No. Design
Exception Location EXISTING PROPOSED STANDARD
M2 M2-11 EB: Davis Street IC
(877+57 to 885+29)
12 ft 1 @ 11 ft 12 ft
M2-12 WB: Davis Street IC
(878+19 to 887+21)
12 ft 1 @ 11 ft 12 ft
M2-13 EB: Mason St IC to Ulatis Creek
Bridge (900+29 to
926+74)
12 ft 3 @ 11 ft 12 ft
M2-14 WB: Mason St IC to Ulatis Creek
Bridge (900+29 to
930+79)
12 ft 2 @ 11 ft 12 ft
M2-15 EB: Ulatis Creek Bridge to Allison
Dr OC (926+74 to
956+95)
12 ft 4 @ 11 ft 12 ft
M2-16 WB: Ulatis Creek Bridge to Allison
Dr OC (930+79 to
960+48)
12 ft 4 @ 11 ft 12 ft
M2-17 EB: CHP Observation and
Median Enforcement Area
#2 (960+48 to
989+23)
12 ft 4 @ 11 ft 12 ft
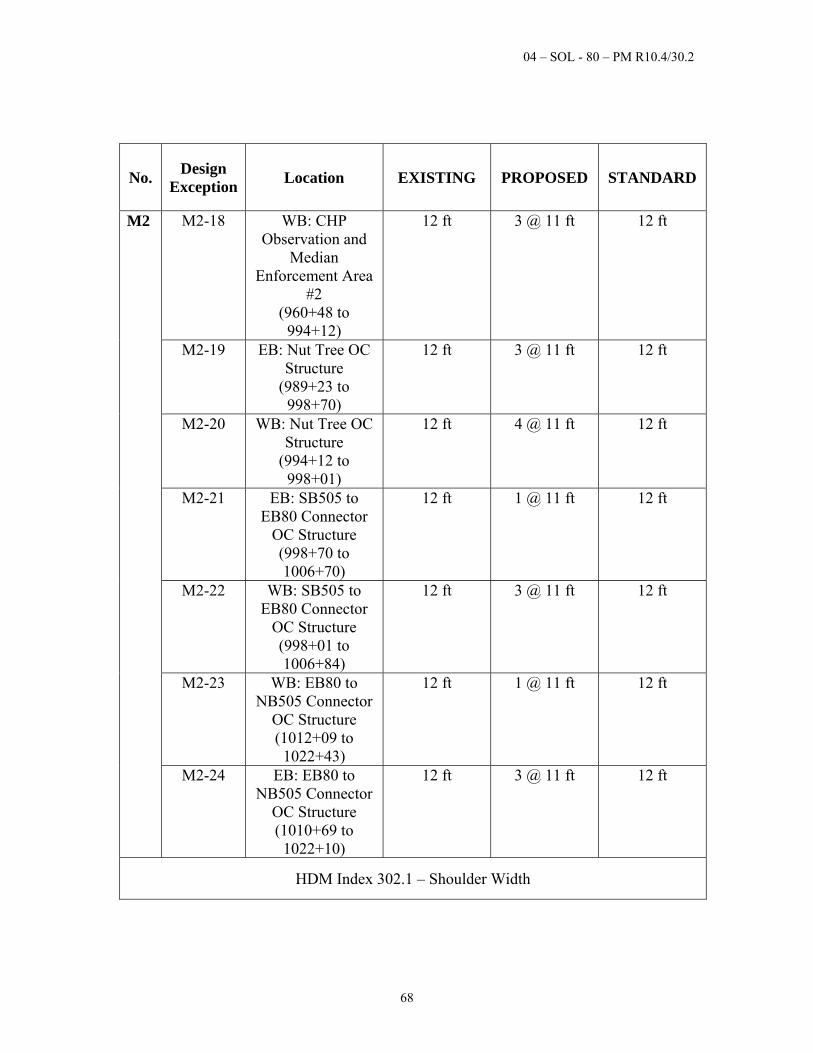
04 – SOL - 80 – PM R10.4/30.2
68
No. Design
Exception Location EXISTING PROPOSED STANDARD
M2 M2-18 WB: CHP Observation and
Median Enforcement Area
#2 (960+48 to
994+12)
12 ft 3 @ 11 ft 12 ft
M2-19 EB: Nut Tree OC Structure
(989+23 to 998+70)
12 ft 3 @ 11 ft 12 ft
M2-20 WB: Nut Tree OC Structure
(994+12 to 998+01)
12 ft 4 @ 11 ft 12 ft
M2-21 EB: SB505 to EB80 Connector
OC Structure (998+70 to 1006+70)
12 ft 1 @ 11 ft 12 ft
M2-22 WB: SB505 to EB80 Connector
OC Structure (998+01 to 1006+84)
12 ft 3 @ 11 ft 12 ft
M2-23 WB: EB80 to NB505 Connector
OC Structure (1012+09 to
1022+43)
12 ft 1 @ 11 ft 12 ft
M2-24 EB: EB80 to NB505 Connector
OC Structure (1010+69 to
1022+10)
12 ft 3 @ 11 ft 12 ft
HDM Index 302.1 – Shoulder Width
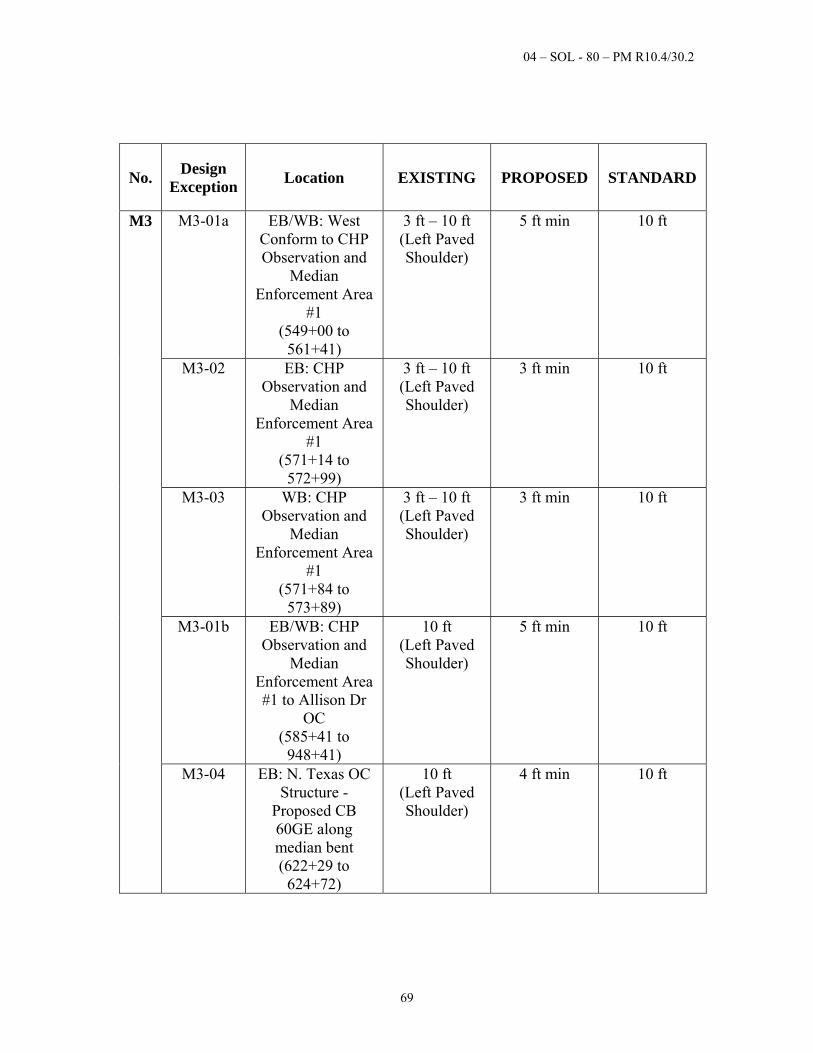
04 – SOL - 80 – PM R10.4/30.2
69
No. Design
Exception Location EXISTING PROPOSED STANDARD
M3
M3-01a EB/WB: West Conform to CHP Observation and
Median Enforcement Area
#1 (549+00 to
561+41)
3 ft – 10 ft (Left Paved Shoulder)
5 ft min
10 ft
M3-02 EB: CHP Observation and
Median Enforcement Area
#1 (571+14 to
572+99)
3 ft – 10 ft (Left Paved Shoulder)
3 ft min 10 ft
M3-03 WB: CHP Observation and
Median Enforcement Area
#1 (571+84 to
573+89)
3 ft – 10 ft (Left Paved Shoulder)
3 ft min 10 ft
M3-01b EB/WB: CHP Observation and
Median Enforcement Area #1 to Allison Dr
OC (585+41 to
948+41)
10 ft (Left Paved Shoulder)
5 ft min 10 ft
M3-04 EB: N. Texas OC Structure -
Proposed CB 60GE along median bent (622+29 to
624+72)
10 ft (Left Paved Shoulder)
4 ft min 10 ft
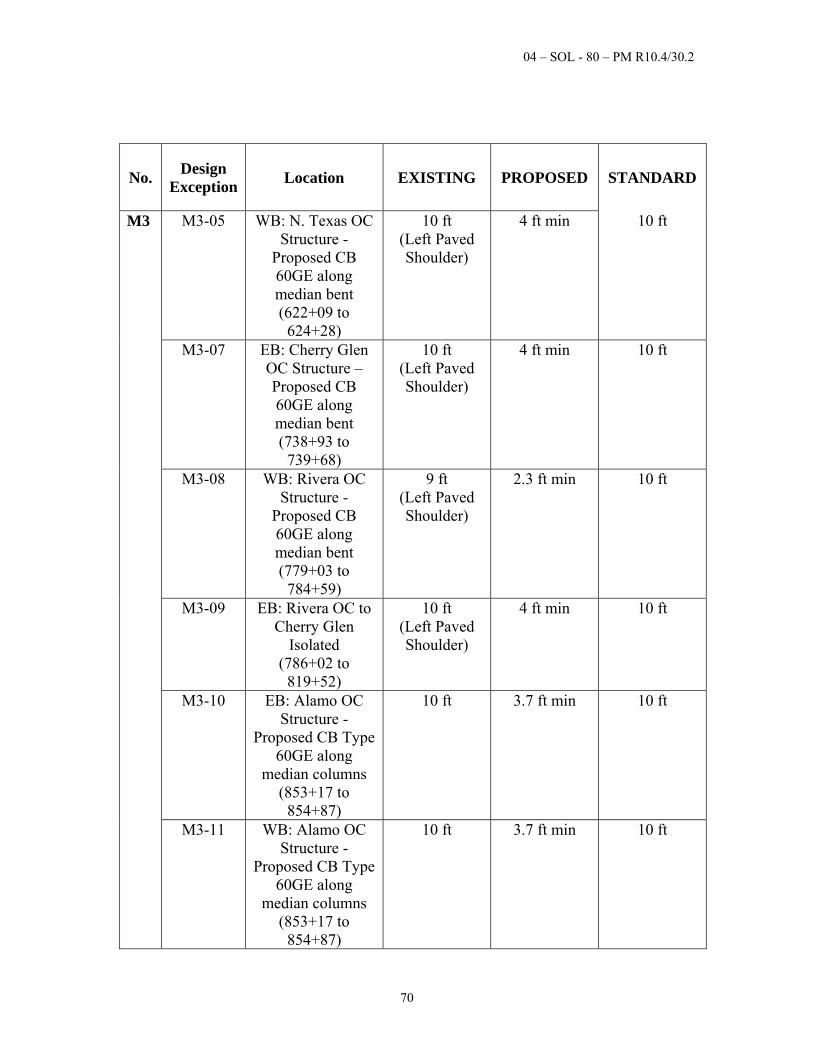
04 – SOL - 80 – PM R10.4/30.2
70
No. Design
Exception Location EXISTING PROPOSED STANDARD
M3
M3-05 WB: N. Texas OC Structure -
Proposed CB 60GE along median bent (622+09 to
624+28)
10 ft (Left Paved Shoulder)
4 ft min 10 ft
M3-07 EB: Cherry Glen OC Structure – Proposed CB 60GE along median bent (738+93 to
739+68)
10 ft (Left Paved Shoulder)
4 ft min 10 ft
M3-08 WB: Rivera OC Structure -
Proposed CB 60GE along median bent (779+03 to
784+59)
9 ft (Left Paved Shoulder)
2.3 ft min 10 ft
M3-09 EB: Rivera OC to Cherry Glen
Isolated (786+02 to
819+52)
10 ft (Left Paved Shoulder)
4 ft min 10 ft
M3-10 EB: Alamo OC Structure -
Proposed CB Type 60GE along
median columns (853+17 to
854+87)
10 ft 3.7 ft min 10 ft
M3-11 WB: Alamo OC Structure -
Proposed CB Type 60GE along
median columns (853+17 to
854+87)
10 ft 3.7 ft min 10 ft
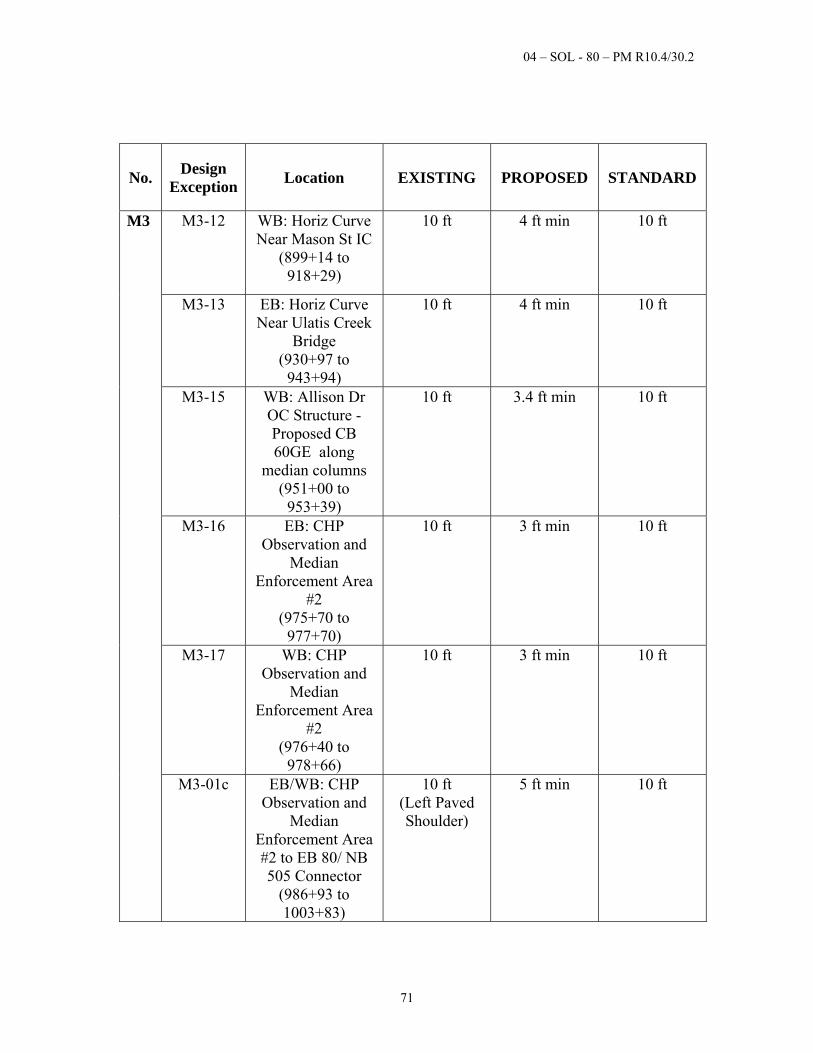
04 – SOL - 80 – PM R10.4/30.2
71
No. Design
Exception Location EXISTING PROPOSED STANDARD
M3
M3-12 WB: Horiz Curve Near Mason St IC
(899+14 to 918+29)
10 ft 4 ft min 10 ft
M3-13 EB: Horiz Curve Near Ulatis Creek
Bridge (930+97 to
943+94)
10 ft 4 ft min 10 ft
M3-15 WB: Allison Dr OC Structure - Proposed CB 60GE along
median columns (951+00 to
953+39)
10 ft 3.4 ft min 10 ft
M3-16 EB: CHP Observation and
Median Enforcement Area
#2 (975+70 to
977+70)
10 ft 3 ft min 10 ft
M3-17 WB: CHP Observation and
Median Enforcement Area
#2 (976+40 to
978+66)
10 ft 3 ft min 10 ft
M3-01c EB/WB: CHP Observation and
Median Enforcement Area #2 to EB 80/ NB 505 Connector
(986+93 to 1003+83)
10 ft (Left Paved Shoulder)
5 ft min
10 ft
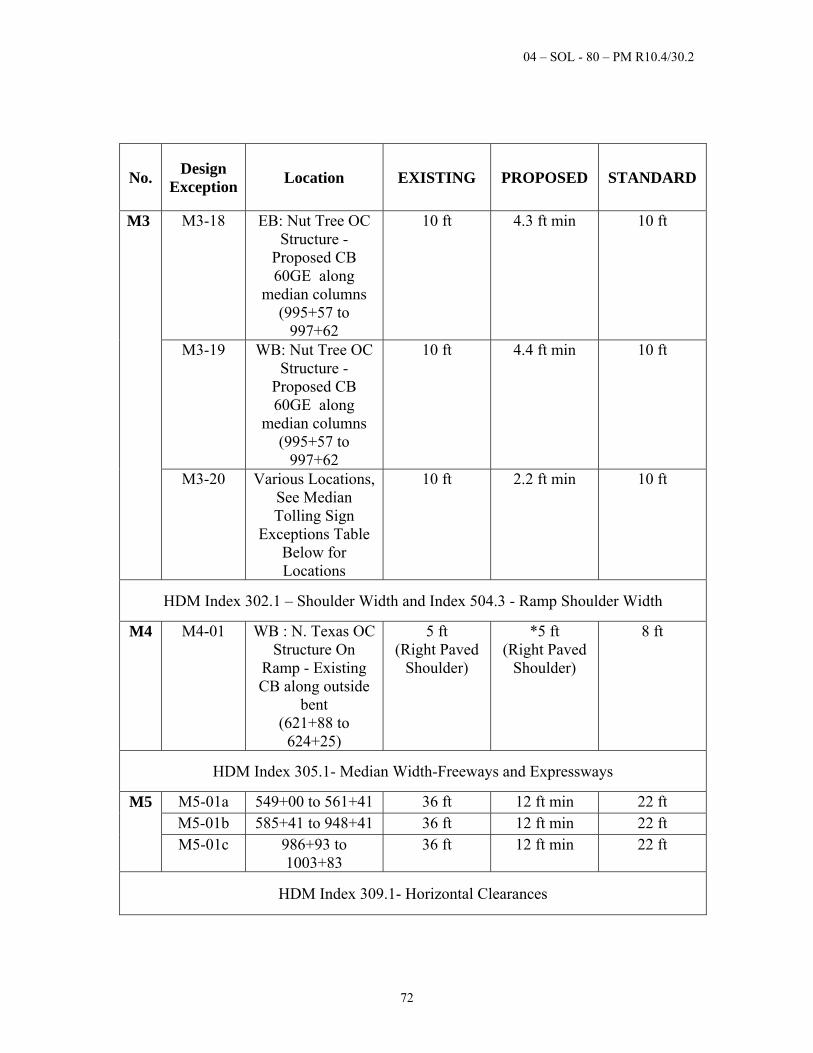
04 – SOL - 80 – PM R10.4/30.2
72
No. Design
Exception Location EXISTING PROPOSED STANDARD
M3 M3-18 EB: Nut Tree OC Structure -
Proposed CB 60GE along
median columns (995+57 to
997+62
10 ft 4.3 ft min 10 ft
M3-19 WB: Nut Tree OC Structure -
Proposed CB 60GE along
median columns (995+57 to
997+62
10 ft 4.4 ft min 10 ft
M3-20 Various Locations, See Median Tolling Sign
Exceptions Table Below for Locations
10 ft 2.2 ft min 10 ft
HDM Index 302.1 – Shoulder Width and Index 504.3 - Ramp Shoulder Width
M4 M4-01 WB : N. Texas OC Structure On
Ramp - Existing CB along outside
bent (621+88 to
624+25)
5 ft (Right Paved
Shoulder)
*5 ft (Right Paved
Shoulder)
8 ft
HDM Index 305.1- Median Width-Freeways and Expressways
M5 M5-01a 549+00 to 561+41 36 ft 12 ft min 22 ft M5-01b 585+41 to 948+41 36 ft 12 ft min 22 ft M5-01c 986+93 to
1003+83 36 ft 12 ft min 22 ft
HDM Index 309.1- Horizontal Clearances
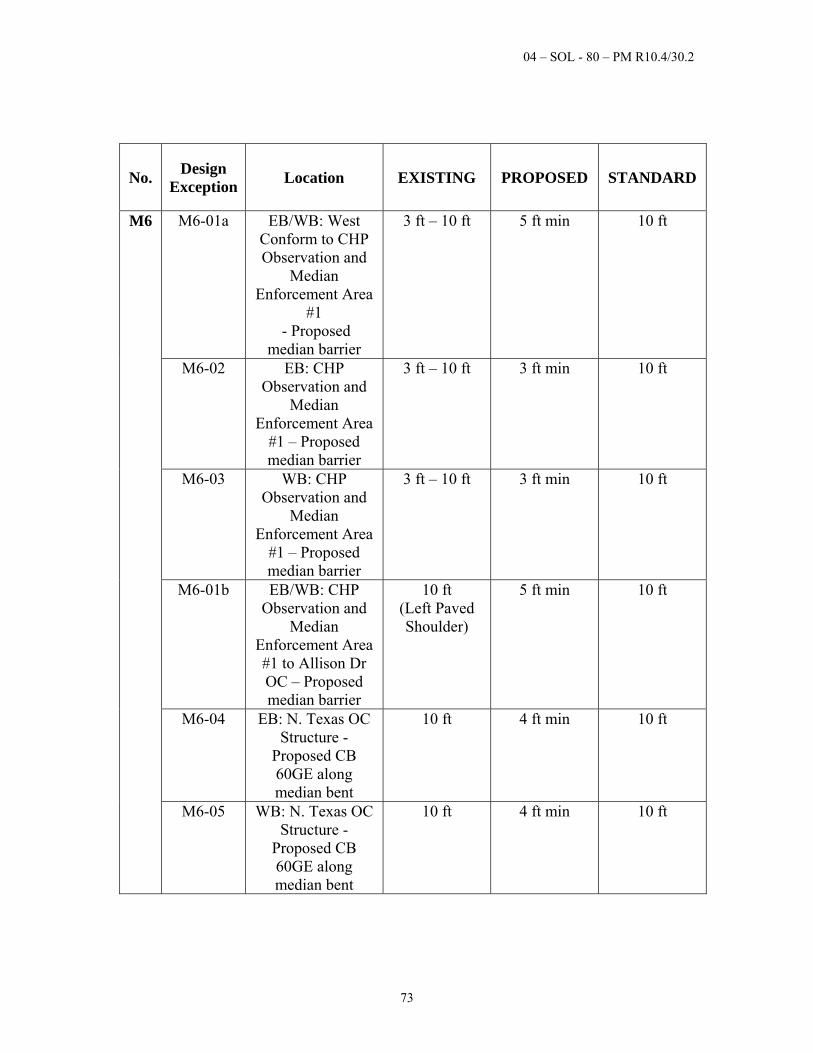
04 – SOL - 80 – PM R10.4/30.2
73
No. Design
Exception Location EXISTING PROPOSED STANDARD
M6
M6-01a EB/WB: West Conform to CHP Observation and
Median Enforcement Area
#1 - Proposed
median barrier
3 ft – 10 ft 5 ft min 10 ft
M6-02 EB: CHP Observation and
Median Enforcement Area
#1 – Proposed median barrier
3 ft – 10 ft 3 ft min 10 ft
M6-03 WB: CHP Observation and
Median Enforcement Area
#1 – Proposed median barrier
3 ft – 10 ft 3 ft min 10 ft
M6-01b EB/WB: CHP Observation and
Median Enforcement Area #1 to Allison Dr OC – Proposed median barrier
10 ft (Left Paved Shoulder)
5 ft min
10 ft
M6-04 EB: N. Texas OC Structure -
Proposed CB 60GE along median bent
10 ft 4 ft min 10 ft
M6-05 WB: N. Texas OC Structure -
Proposed CB 60GE along median bent
10 ft 4 ft min 10 ft
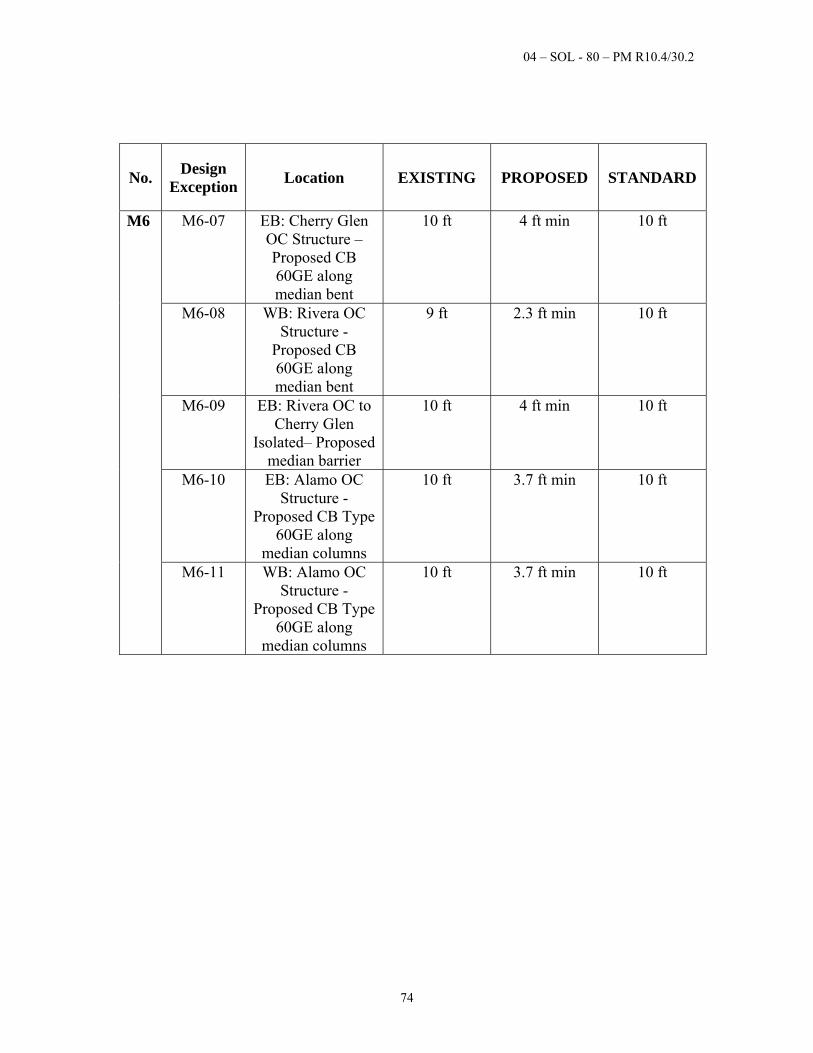
04 – SOL - 80 – PM R10.4/30.2
74
No. Design
Exception Location EXISTING PROPOSED STANDARD
M6
M6-07 EB: Cherry Glen OC Structure – Proposed CB 60GE along median bent
10 ft 4 ft min 10 ft
M6-08 WB: Rivera OC Structure -
Proposed CB 60GE along median bent
9 ft 2.3 ft min 10 ft
M6-09 EB: Rivera OC to Cherry Glen
Isolated– Proposed median barrier
10 ft 4 ft min 10 ft
M6-10 EB: Alamo OC Structure -
Proposed CB Type 60GE along
median columns
10 ft 3.7 ft min 10 ft
M6-11 WB: Alamo OC Structure -
Proposed CB Type 60GE along
median columns
10 ft 3.7 ft min 10 ft
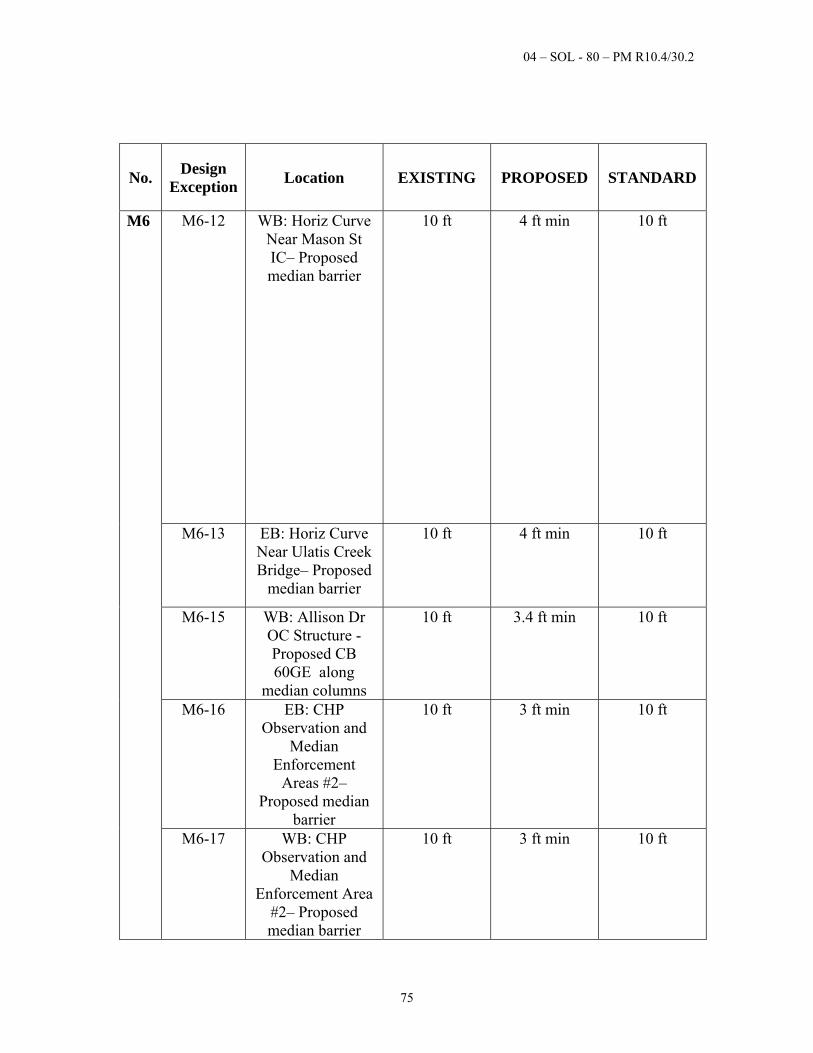
04 – SOL - 80 – PM R10.4/30.2
75
No. Design
Exception Location EXISTING PROPOSED STANDARD
M6
M6-12 WB: Horiz Curve Near Mason St IC– Proposed median barrier
10 ft 4 ft min 10 ft
M6-13 EB: Horiz Curve Near Ulatis Creek Bridge– Proposed
median barrier
10 ft 4 ft min 10 ft
M6-15 WB: Allison Dr OC Structure - Proposed CB 60GE along
median columns
10 ft 3.4 ft min 10 ft
M6-16 EB: CHP Observation and
Median Enforcement
Areas #2– Proposed median
barrier
10 ft 3 ft min 10 ft
M6-17 WB: CHP Observation and
Median Enforcement Area
#2– Proposed median barrier
10 ft 3 ft min 10 ft
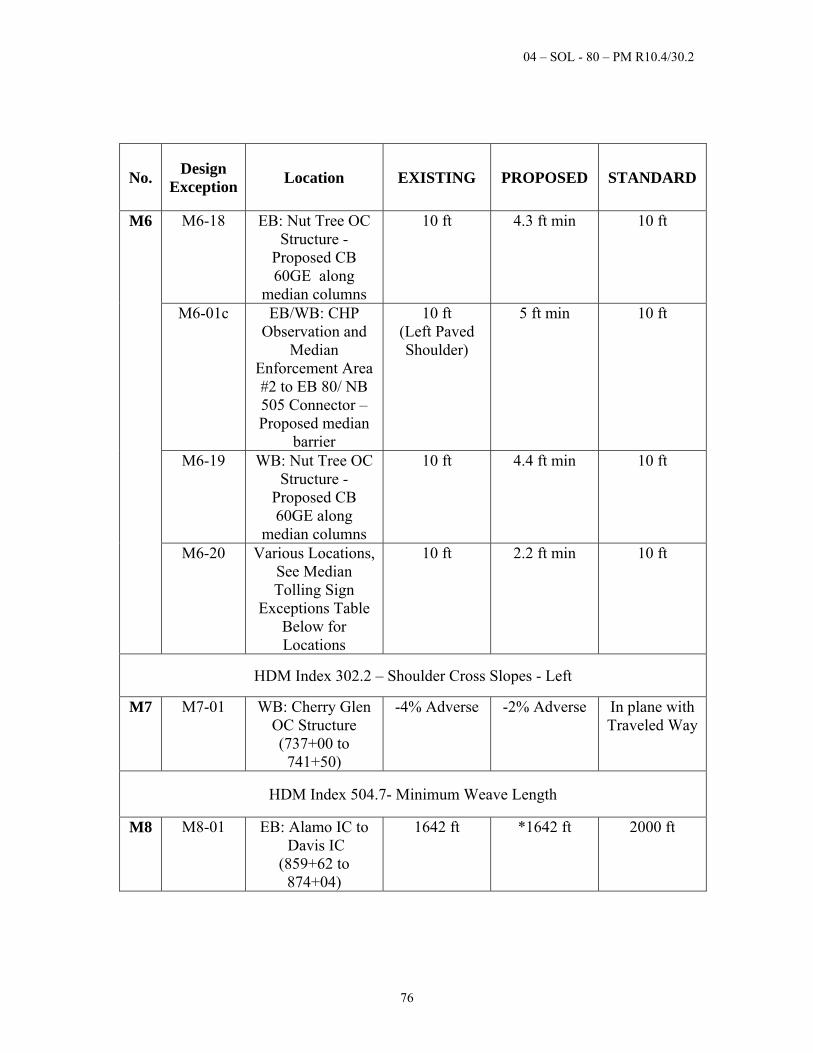
04 – SOL - 80 – PM R10.4/30.2
76
No. Design
Exception Location EXISTING PROPOSED STANDARD
M6 M6-18 EB: Nut Tree OC Structure -
Proposed CB 60GE along
median columns
10 ft 4.3 ft min 10 ft
M6-01c EB/WB: CHP Observation and
Median Enforcement Area #2 to EB 80/ NB 505 Connector – Proposed median
barrier
10 ft (Left Paved Shoulder)
5 ft min
10 ft
M6-19 WB: Nut Tree OC Structure -
Proposed CB 60GE along
median columns
10 ft 4.4 ft min 10 ft
M6-20 Various Locations, See Median Tolling Sign
Exceptions Table Below for Locations
10 ft 2.2 ft min 10 ft
HDM Index 302.2 – Shoulder Cross Slopes - Left
M7 M7-01 WB: Cherry Glen OC Structure (737+00 to
741+50)
-4% Adverse -2% Adverse In plane with Traveled Way
HDM Index 504.7- Minimum Weave Length
M8
M8-01 EB: Alamo IC to Davis IC
(859+62 to 874+04)
1642 ft *1642 ft 2000 ft
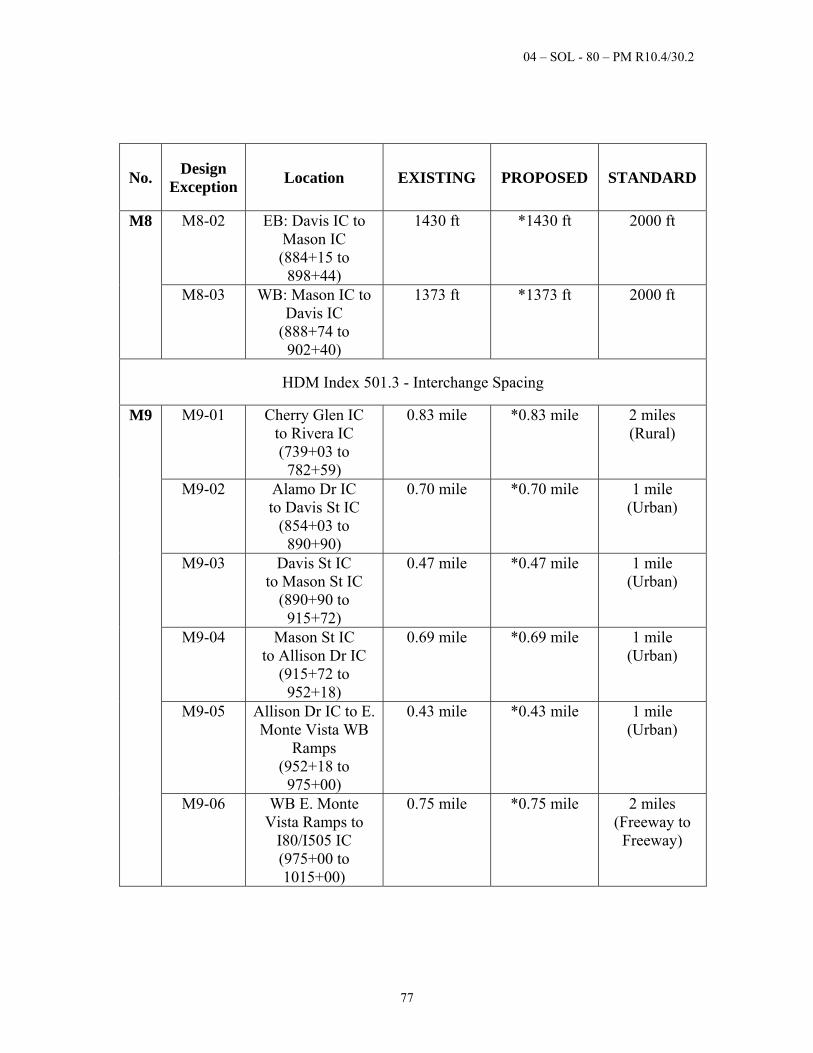
04 – SOL - 80 – PM R10.4/30.2
77
No. Design
Exception Location EXISTING PROPOSED STANDARD
M8 M8-02 EB: Davis IC to Mason IC (884+15 to
898+44)
1430 ft *1430 ft 2000 ft
M8-03 WB: Mason IC to Davis IC
(888+74 to 902+40)
1373 ft *1373 ft 2000 ft
HDM Index 501.3 - Interchange Spacing
M9
M9-01 Cherry Glen IC to Rivera IC (739+03 to
782+59)
0.83 mile *0.83 mile 2 miles (Rural)
M9-02 Alamo Dr IC to Davis St IC
(854+03 to 890+90)
0.70 mile *0.70 mile 1 mile (Urban)
M9-03 Davis St IC to Mason St IC
(890+90 to 915+72)
0.47 mile *0.47 mile 1 mile (Urban)
M9-04 Mason St IC to Allison Dr IC
(915+72 to 952+18)
0.69 mile *0.69 mile 1 mile (Urban)
M9-05 Allison Dr IC to E. Monte Vista WB
Ramps (952+18 to
975+00)
0.43 mile *0.43 mile 1 mile (Urban)
M9-06 WB E. Monte Vista Ramps to
I80/I505 IC (975+00 to 1015+00)
0.75 mile *0.75 mile 2 miles (Freeway to
Freeway)
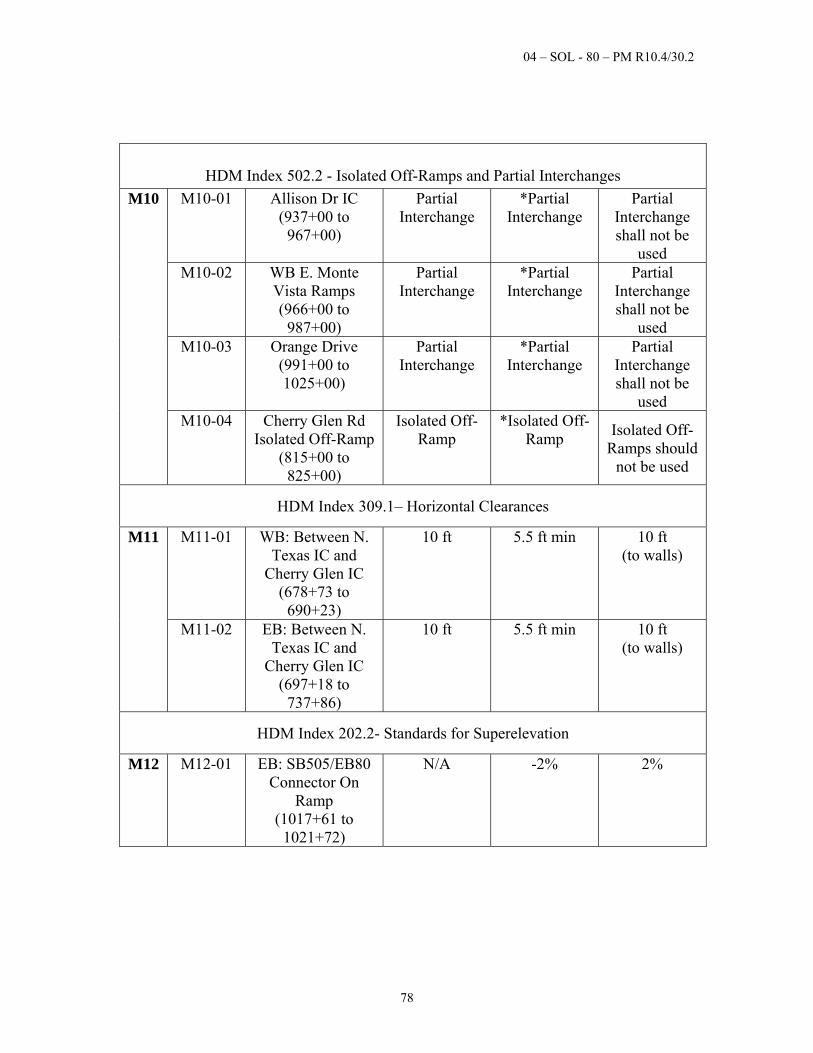
04 – SOL - 80 – PM R10.4/30.2
78
HDM Index 502.2 - Isolated Off-Ramps and Partial Interchanges
M10
M10-01 Allison Dr IC (937+00 to
967+00)
Partial Interchange
*Partial Interchange
Partial Interchange shall not be
used M10-02 WB E. Monte
Vista Ramps (966+00 to
987+00)
Partial Interchange
*Partial Interchange
Partial Interchange shall not be
used M10-03 Orange Drive
(991+00 to 1025+00)
Partial Interchange
*Partial Interchange
Partial Interchange shall not be
used M10-04 Cherry Glen Rd
Isolated Off-Ramp (815+00 to
825+00)
Isolated Off-Ramp
*Isolated Off-Ramp
Isolated Off-Ramps should
not be used
HDM Index 309.1– Horizontal Clearances
M11 M11-01 WB: Between N. Texas IC and
Cherry Glen IC (678+73 to
690+23)
10 ft 5.5 ft min 10 ft (to walls)
M11-02 EB: Between N. Texas IC and
Cherry Glen IC (697+18 to
737+86)
10 ft 5.5 ft min 10 ft (to walls)
HDM Index 202.2- Standards for Superelevation
M12 M12-01 EB: SB505/EB80 Connector On
Ramp (1017+61 to
1021+72)
N/A -2% 2%
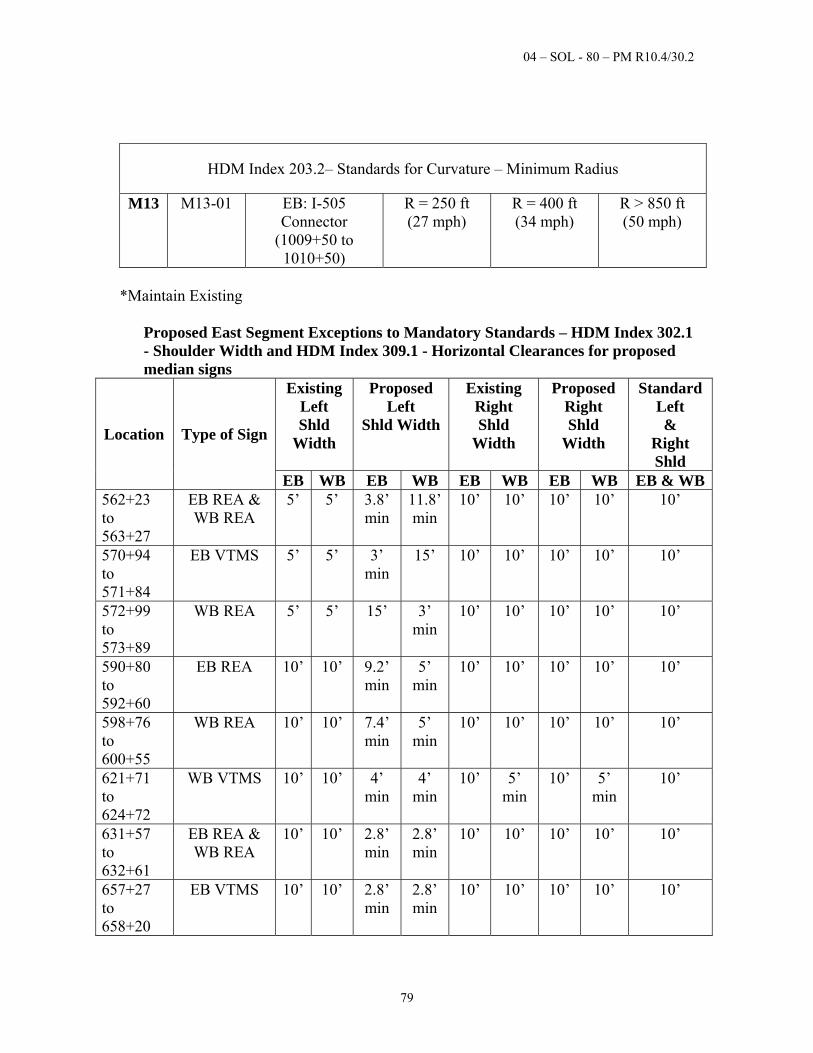
04 – SOL - 80 – PM R10.4/30.2
79
HDM Index 203.2– Standards for Curvature – Minimum Radius
M13 M13-01 EB: I-505 Connector
(1009+50 to 1010+50)
R = 250 ft (27 mph)
R = 400 ft (34 mph)
R > 850 ft (50 mph)
*Maintain Existing
Proposed East Segment Exceptions to Mandatory Standards – HDM Index 302.1 - Shoulder Width and HDM Index 309.1 - Horizontal Clearances for proposed median signs
Location Type of Sign
Existing Left Shld
Width
Proposed Left
Shld Width
Existing Right Shld
Width
Proposed Right Shld
Width
Standard Left &
Right Shld
EB WB EB WB EB WB EB WB EB & WB562+23 to 563+27
EB REA & WB REA
5’ 5’ 3.8’ min
11.8’ min
10’ 10’ 10’ 10’ 10’
570+94 to 571+84
EB VTMS 5’ 5’ 3’ min
15’ 10’ 10’ 10’ 10’ 10’
572+99 to 573+89
WB REA 5’ 5’ 15’ 3’ min
10’ 10’ 10’ 10’ 10’
590+80 to 592+60
EB REA 10’ 10’ 9.2’ min
5’ min
10’ 10’ 10’ 10’ 10’
598+76 to 600+55
WB REA 10’ 10’ 7.4’ min
5’ min
10’ 10’ 10’ 10’ 10’
621+71 to 624+72
WB VTMS 10’ 10’ 4’ min
4’ min
10’ 5’ min
10’ 5’ min
10’
631+57 to 632+61
EB REA & WB REA
10’ 10’ 2.8’ min
2.8’ min
10’ 10’ 10’ 10’ 10’
657+27 to 658+20
EB VTMS 10’ 10’ 2.8’ min
2.8’ min
10’ 10’ 10’ 10’ 10’
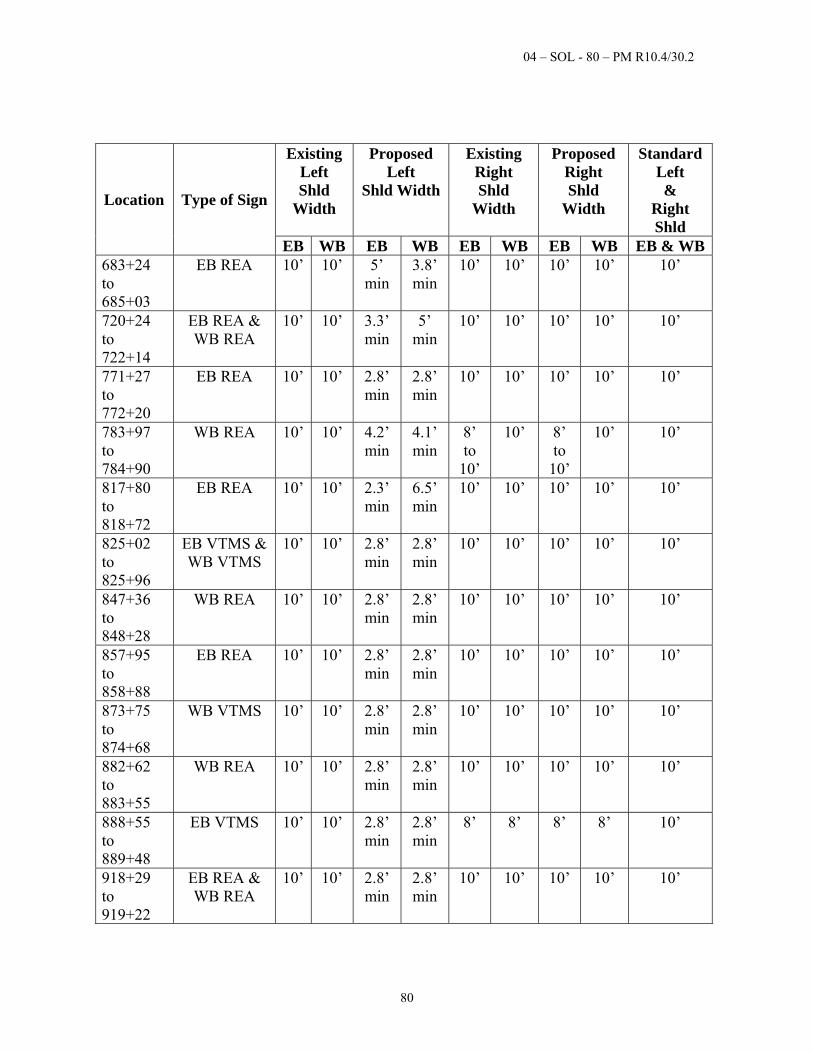
04 – SOL - 80 – PM R10.4/30.2
80
Location Type of Sign
Existing Left Shld
Width
Proposed Left
Shld Width
Existing Right Shld
Width
Proposed Right Shld
Width
Standard Left &
Right Shld
EB WB EB WB EB WB EB WB EB & WB683+24 to 685+03
EB REA 10’ 10’ 5’ min
3.8’ min
10’ 10’ 10’ 10’ 10’
720+24 to 722+14
EB REA & WB REA
10’ 10’ 3.3’ min
5’ min
10’ 10’ 10’ 10’ 10’
771+27 to 772+20
EB REA 10’ 10’ 2.8’ min
2.8’ min
10’ 10’ 10’ 10’ 10’
783+97 to 784+90
WB REA 10’ 10’ 4.2’ min
4.1’ min
8’ to
10’
10’ 8’ to
10’
10’ 10’
817+80 to 818+72
EB REA 10’ 10’ 2.3’ min
6.5’ min
10’ 10’ 10’ 10’ 10’
825+02 to 825+96
EB VTMS & WB VTMS
10’ 10’ 2.8’ min
2.8’ min
10’ 10’ 10’ 10’ 10’
847+36 to 848+28
WB REA 10’ 10’ 2.8’ min
2.8’ min
10’ 10’ 10’ 10’ 10’
857+95 to 858+88
EB REA 10’ 10’ 2.8’ min
2.8’ min
10’ 10’ 10’ 10’ 10’
873+75 to 874+68
WB VTMS 10’ 10’ 2.8’ min
2.8’ min
10’ 10’ 10’ 10’ 10’
882+62 to 883+55
WB REA 10’ 10’ 2.8’ min
2.8’ min
10’ 10’ 10’ 10’ 10’
888+55 to 889+48
EB VTMS 10’ 10’ 2.8’ min
2.8’ min
8’ 8’ 8’ 8’ 10’
918+29 to 919+22
EB REA & WB REA
10’ 10’ 2.8’ min
2.8’ min
10’ 10’ 10’ 10’ 10’
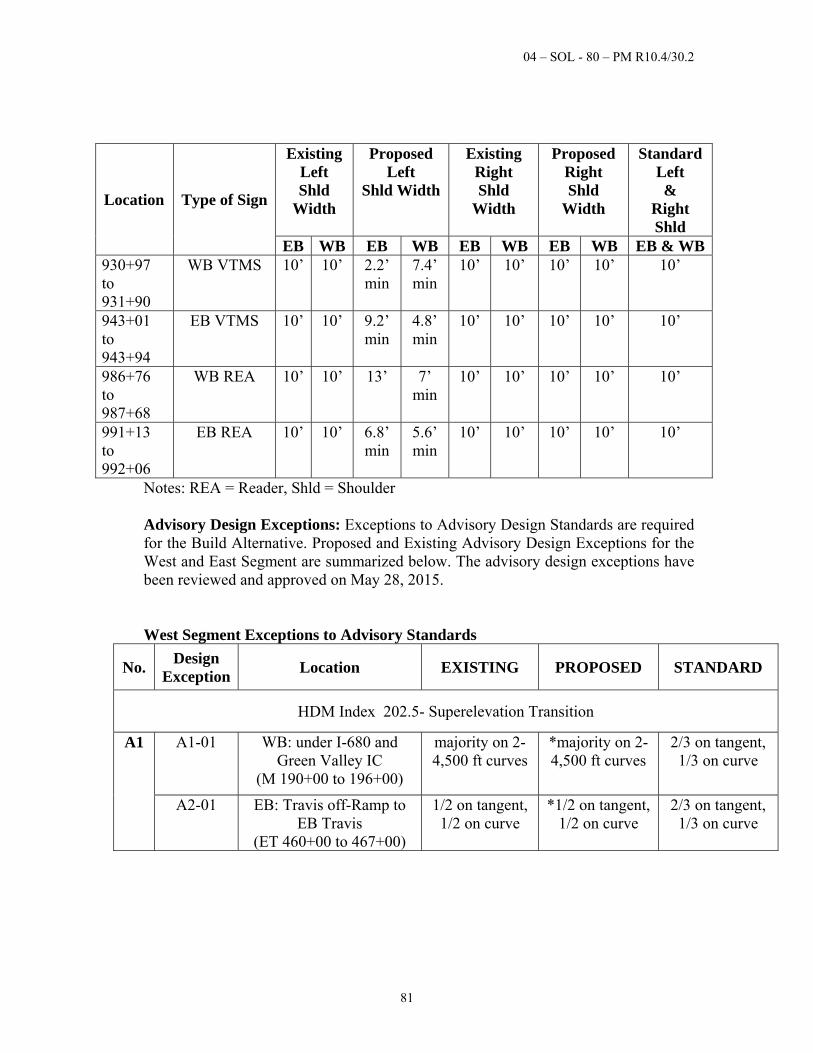
04 – SOL - 80 – PM R10.4/30.2
81
Location Type of Sign
Existing Left Shld
Width
Proposed Left
Shld Width
Existing Right Shld
Width
Proposed Right Shld
Width
Standard Left &
Right Shld
EB WB EB WB EB WB EB WB EB & WB930+97 to 931+90
WB VTMS 10’ 10’ 2.2’ min
7.4’ min
10’ 10’ 10’ 10’ 10’
943+01 to 943+94
EB VTMS 10’ 10’ 9.2’ min
4.8’ min
10’ 10’ 10’ 10’ 10’
986+76 to 987+68
WB REA 10’ 10’ 13’ 7’ min
10’ 10’ 10’ 10’ 10’
991+13 to 992+06
EB REA 10’ 10’ 6.8’ min
5.6’ min
10’ 10’ 10’ 10’ 10’
Notes: REA = Reader, Shld = Shoulder Advisory Design Exceptions: Exceptions to Advisory Design Standards are required for the Build Alternative. Proposed and Existing Advisory Design Exceptions for the West and East Segment are summarized below. The advisory design exceptions have been reviewed and approved on May 28, 2015. West Segment Exceptions to Advisory Standards
No. Design
Exception Location EXISTING PROPOSED STANDARD
HDM Index 202.5- Superelevation Transition
A1 A1-01 WB: under I-680 and Green Valley IC
(M 190+00 to 196+00)
majority on 2-4,500 ft curves
*majority on 2-4,500 ft curves
2/3 on tangent,1/3 on curve
A2-01 EB: Travis off-Ramp to EB Travis
(ET 460+00 to 467+00)
1/2 on tangent,1/2 on curve
*1/2 on tangent, 1/2 on curve
2/3 on tangent,1/3 on curve
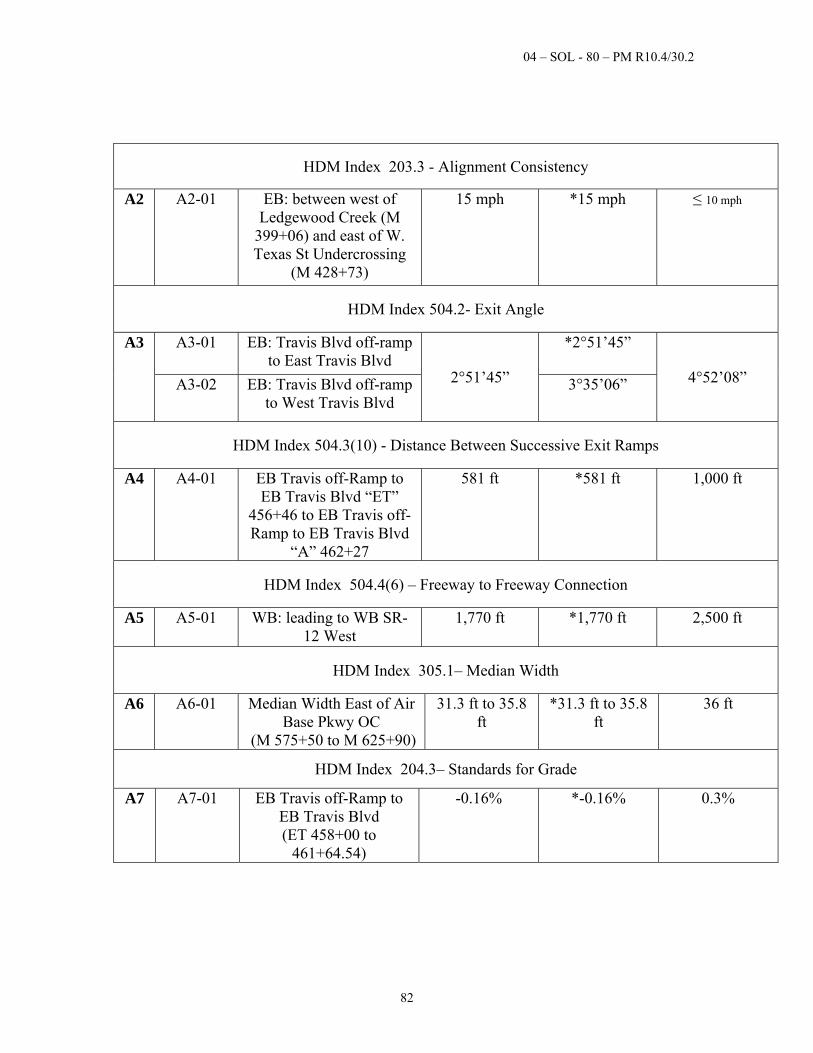
04 – SOL - 80 – PM R10.4/30.2
82
HDM Index 203.3 - Alignment Consistency
A2 A2-01 EB: between west of Ledgewood Creek (M
399+06) and east of W. Texas St Undercrossing
(M 428+73)
15 mph *15 mph ≤ 10 mph
HDM Index 504.2- Exit Angle
A3 A3-01 EB: Travis Blvd off-ramp to East Travis Blvd
2°51’45”
*2°51’45”
4°52’08” A3-02 EB: Travis Blvd off-ramp to West Travis Blvd
3°35’06”
HDM Index 504.3(10) - Distance Between Successive Exit Ramps
A4 A4-01 EB Travis off-Ramp to EB Travis Blvd “ET”
456+46 to EB Travis off-Ramp to EB Travis Blvd
“A” 462+27
581 ft *581 ft 1,000 ft
HDM Index 504.4(6) – Freeway to Freeway Connection
A5 A5-01 WB: leading to WB SR-12 West
1,770 ft *1,770 ft 2,500 ft
HDM Index 305.1– Median Width
A6 A6-01 Median Width East of Air Base Pkwy OC
(M 575+50 to M 625+90)
31.3 ft to 35.8 ft
*31.3 ft to 35.8 ft
36 ft
HDM Index 204.3– Standards for Grade
A7 A7-01 EB Travis off-Ramp to EB Travis Blvd (ET 458+00 to
461+64.54)
-0.16% *-0.16% 0.3%
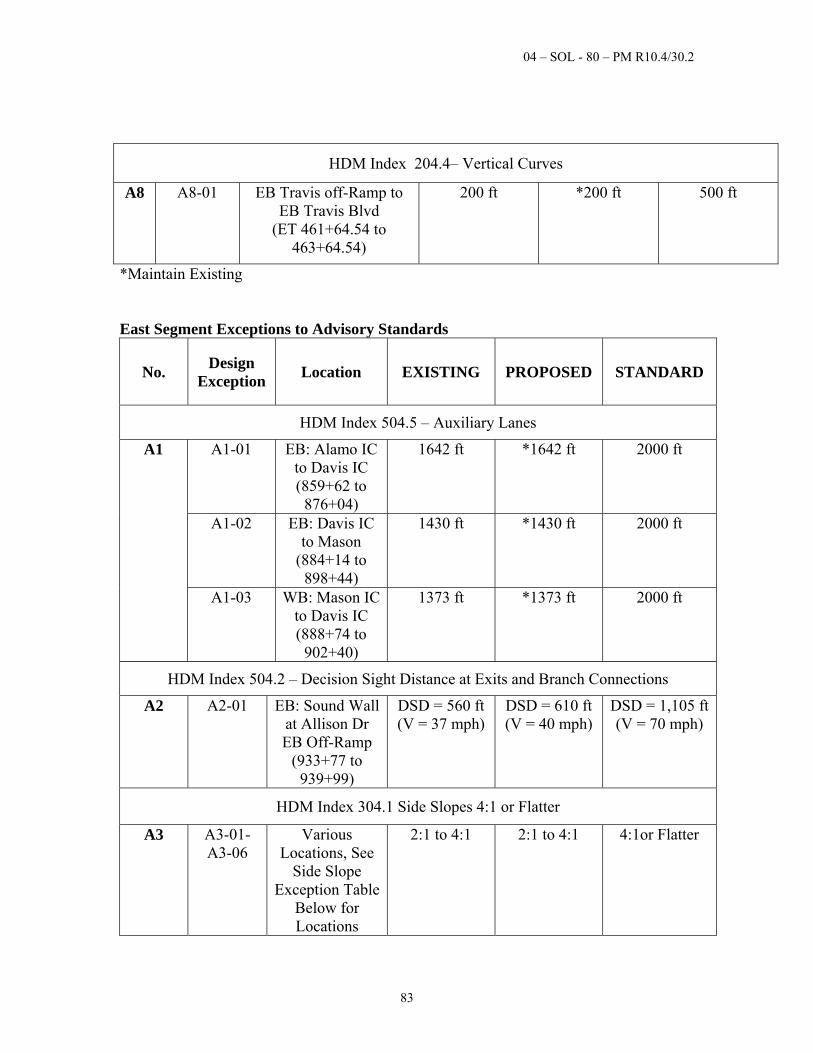
04 – SOL - 80 – PM R10.4/30.2
83
HDM Index 204.4– Vertical Curves
A8 A8-01 EB Travis off-Ramp to EB Travis Blvd
(ET 461+64.54 to 463+64.54)
200 ft *200 ft
500 ft
*Maintain Existing
East Segment Exceptions to Advisory Standards
No. Design
Exception Location EXISTING PROPOSED STANDARD
HDM Index 504.5 – Auxiliary Lanes
A1 A1-01 EB: Alamo IC to Davis IC (859+62 to
876+04)
1642 ft *1642 ft 2000 ft
A1-02 EB: Davis IC to Mason
(884+14 to 898+44)
1430 ft *1430 ft 2000 ft
A1-03 WB: Mason IC to Davis IC (888+74 to
902+40)
1373 ft *1373 ft 2000 ft
HDM Index 504.2 – Decision Sight Distance at Exits and Branch Connections
A2 A2-01 EB: Sound Wall at Allison Dr EB Off-Ramp
(933+77 to 939+99)
DSD = 560 ft (V = 37 mph)
DSD = 610 ft (V = 40 mph)
DSD = 1,105 ft(V = 70 mph)
HDM Index 304.1 Side Slopes 4:1 or Flatter
A3 A3-01-A3-06
Various Locations, See
Side Slope Exception Table
Below for Locations
2:1 to 4:1 2:1 to 4:1 4:1or Flatter
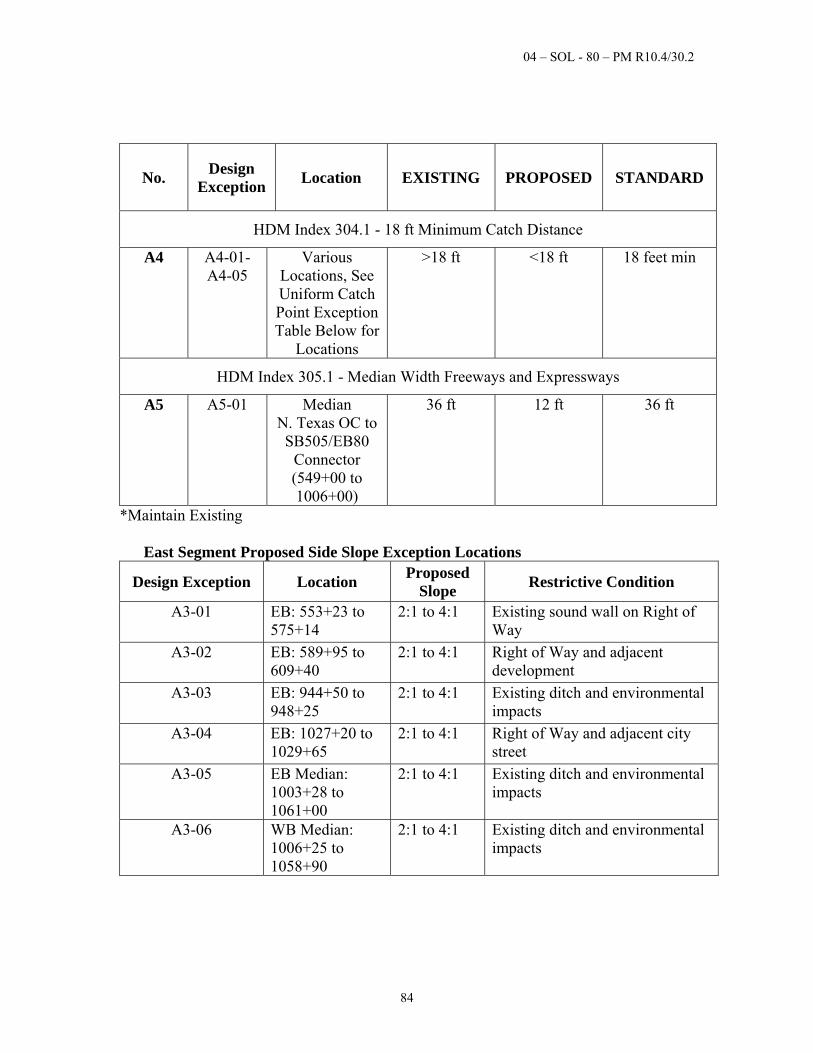
04 – SOL - 80 – PM R10.4/30.2
84
No. Design
Exception Location EXISTING PROPOSED STANDARD
HDM Index 304.1 - 18 ft Minimum Catch Distance
A4 A4-01-A4-05
Various Locations, See Uniform Catch Point Exception Table Below for
Locations
>18 ft <18 ft 18 feet min
HDM Index 305.1 - Median Width Freeways and Expressways
A5 A5-01 Median N. Texas OC to SB505/EB80
Connector (549+00 to 1006+00)
36 ft 12 ft 36 ft
*Maintain Existing East Segment Proposed Side Slope Exception Locations
Design Exception Location Proposed
Slope Restrictive Condition
A3-01 EB: 553+23 to 575+14
2:1 to 4:1 Existing sound wall on Right of Way
A3-02 EB: 589+95 to 609+40
2:1 to 4:1 Right of Way and adjacent development
A3-03 EB: 944+50 to 948+25
2:1 to 4:1 Existing ditch and environmental impacts
A3-04 EB: 1027+20 to 1029+65
2:1 to 4:1 Right of Way and adjacent city street
A3-05 EB Median: 1003+28 to 1061+00
2:1 to 4:1 Existing ditch and environmental impacts
A3-06 WB Median: 1006+25 to 1058+90
2:1 to 4:1 Existing ditch and environmental impacts
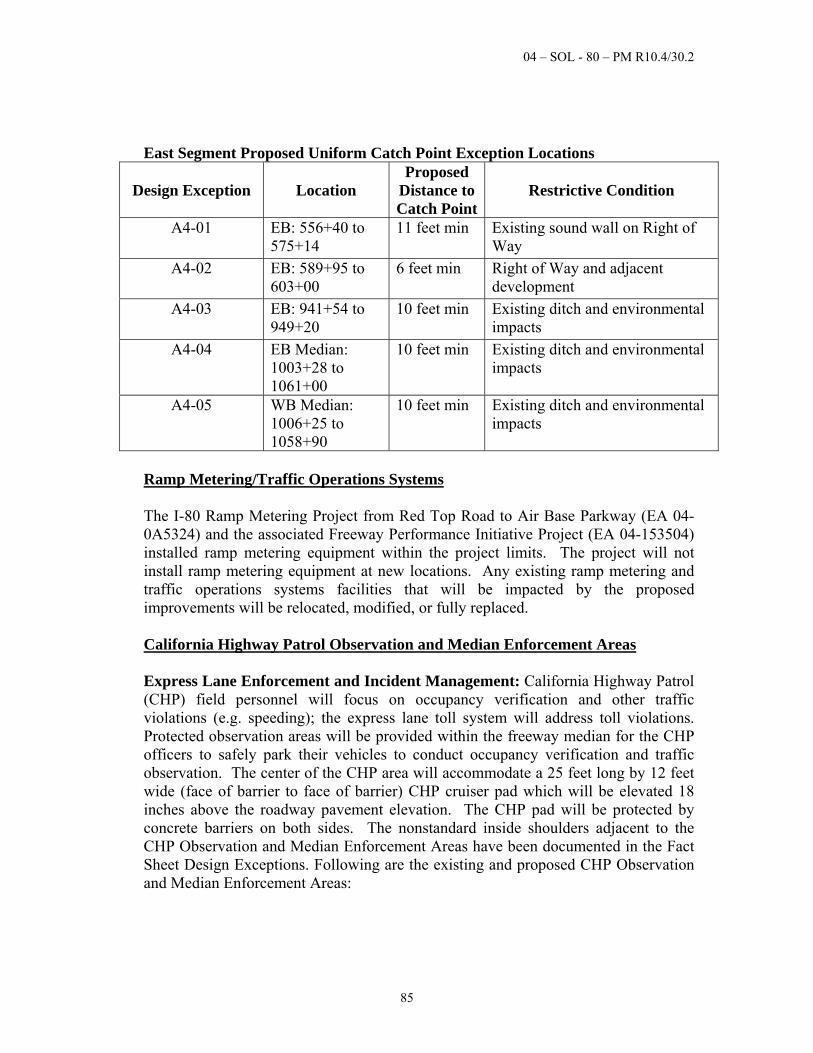
04 – SOL - 80 – PM R10.4/30.2
85
East Segment Proposed Uniform Catch Point Exception Locations
Design Exception Location Proposed
Distance to Catch Point
Restrictive Condition
A4-01 EB: 556+40 to 575+14
11 feet min Existing sound wall on Right of Way
A4-02
EB: 589+95 to 603+00
6 feet min Right of Way and adjacent development
A4-03 EB: 941+54 to 949+20
10 feet min Existing ditch and environmental impacts
A4-04 EB Median: 1003+28 to 1061+00
10 feet min Existing ditch and environmental impacts
A4-05 WB Median: 1006+25 to 1058+90
10 feet min Existing ditch and environmental impacts
Ramp Metering/Traffic Operations Systems The I-80 Ramp Metering Project from Red Top Road to Air Base Parkway (EA 04-0A5324) and the associated Freeway Performance Initiative Project (EA 04-153504) installed ramp metering equipment within the project limits. The project will not install ramp metering equipment at new locations. Any existing ramp metering and traffic operations systems facilities that will be impacted by the proposed improvements will be relocated, modified, or fully replaced. California Highway Patrol Observation and Median Enforcement Areas Express Lane Enforcement and Incident Management: California Highway Patrol (CHP) field personnel will focus on occupancy verification and other traffic violations (e.g. speeding); the express lane toll system will address toll violations. Protected observation areas will be provided within the freeway median for the CHP officers to safely park their vehicles to conduct occupancy verification and traffic observation. The center of the CHP area will accommodate a 25 feet long by 12 feet wide (face of barrier to face of barrier) CHP cruiser pad which will be elevated 18 inches above the roadway pavement elevation. The CHP pad will be protected by concrete barriers on both sides. The nonstandard inside shoulders adjacent to the CHP Observation and Median Enforcement Areas have been documented in the Fact Sheet Design Exceptions. Following are the existing and proposed CHP Observation and Median Enforcement Areas:
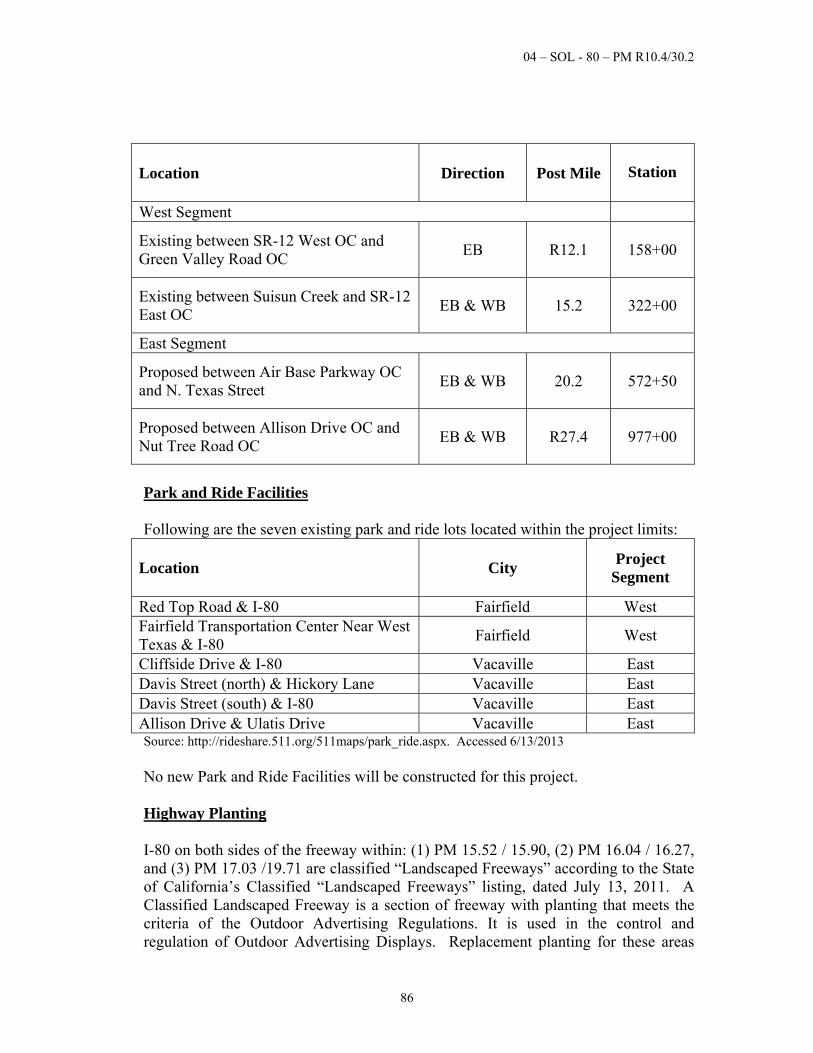
04 – SOL - 80 – PM R10.4/30.2
86
Location Direction Post Mile
Station
West Segment
Existing between SR-12 West OC and Green Valley Road OC
EB R12.1
158+00
Existing between Suisun Creek and SR-12 East OC
EB & WB 15.2
322+00
East Segment
Proposed between Air Base Parkway OC and N. Texas Street
EB & WB 20.2
572+50
Proposed between Allison Drive OC and Nut Tree Road OC
EB & WB R27.4
977+00
Park and Ride Facilities Following are the seven existing park and ride lots located within the project limits:
Location City Project
Segment
Red Top Road & I-80 Fairfield West Fairfield Transportation Center Near West Texas & I-80
Fairfield West
Cliffside Drive & I-80 Vacaville East Davis Street (north) & Hickory Lane Vacaville East Davis Street (south) & I-80 Vacaville East Allison Drive & Ulatis Drive Vacaville East Source: http://rideshare.511.org/511maps/park_ride.aspx. Accessed 6/13/2013 No new Park and Ride Facilities will be constructed for this project. Highway Planting I-80 on both sides of the freeway within: (1) PM 15.52 / 15.90, (2) PM 16.04 / 16.27, and (3) PM 17.03 /19.71 are classified “Landscaped Freeways” according to the State of California’s Classified “Landscaped Freeways” listing, dated July 13, 2011. A Classified Landscaped Freeway is a section of freeway with planting that meets the criteria of the Outdoor Advertising Regulations. It is used in the control and regulation of Outdoor Advertising Displays. Replacement planting for these areas
04 – SOL - 80 – PM R10.4/30.2
87
will take place within 2 years of construction completion to prevent loss of Landscaped Freeway status. In general, the West Segment includes the construction of conduit runs for electrical and communication systems that would be located in areas with little to no vegetation. Where vegetation and tree removal is required, the amount is anticipated to be minimal. The West Segment would impact approximately 0.65 acres of highway landscaping within the Travis Boulevard off-ramp loop. There are no freeway plantings located in the median; a concrete barrier separates the two sides of freeway. In areas of sparse or no vegetation, nearby business, commercial, and industrial developments can be seen along the freeway. These areas are eligible for Highway Planting and may be considered for replacement planting to offset losses in landscaping where space does not allow replacement. Some developments immediately adjacent to the freeway have incorporated perimeter and/or parking lot landscaping on the property close to the existing freeway. Caltrans and the FHWA mandates that a qualitative/aesthetic approach should be taken to reduce visual quality loss in the visual resources study area. Offsetting adverse impacts addressed in visual assessment unit analyses and summarized in the previous section would consist of adhering to the following design requirements in cooperation with the Caltrans District Landscape Architect: 1) Existing landscaping and other roadside vegetation removed by the Build Alternative will be replaced where proper setback exists and where feasible per Caltrans policy. Replacement planting would be accomplished as a separate contract, funded from the parent roadway contract, and would include a three-year plant establishment period. Landscape plans shall be approved by Caltrans. 2) Replacement landscaping within the designated Landscaped Freeway location between post miles 15.52 and 16.27 (between the Cordelia Truck Scales and Abernathy Road overcrossing) and post miles 17.03 and 19.71 (from just west of the West Texas Street undercrossing to the Air Base Parkway overcrossing) will be designed such that the criteria for the Landscaped Freeway will be maintained. In these areas, planting must be continuous (no gaps ≥ 200 feet), ornamental (not functional), a least 1,000 feet long, on at least one side of the freeway, and require reasonable maintenance. The East Segment would impact approximately 0.83 acre of clustered vegetation within interchange ramp loops. The majority of the landscaped areas/ornamental plantings that would be removed as part of the Build Alternative are associated with approximately 10.35 acres (34,800 linear feet or6.6 miles) of median oleander removal.
04 – SOL - 80 – PM R10.4/30.2
88
Existing landscaping and other roadside vegetation removed by the Build Alternative, including the median oleander removal, will be replaced where proper setback exists and where feasible per Caltrans policy. Replacing landscaping and roadside vegetation per Caltrans policy would reduce the potential for significant visual impacts as a result of vegetation removal. If there is limited space for replacement planting due to transportation construction, replacement planting may be installed outside the limits of the parent highway project. Replacement planting may be located outside the State operational right-of-way if it is in a public space within the adjacent community. The district LA and the appropriate public agency should negotiate and agree on the location of this planting and the terms of the maintenance agreement. Replacement planting for the East Segment would be accomplished as a separate contract, funded from the parent roadway contract, and would include a 3-year plant establishment period. Erosion Control All graded and disturbed areas will receive erosion control treatment to minimize surface erosion in accordance with Caltrans policy. For slopes exceeding 4:1, slope stabilization will be implemented, which may include placement of erosion control blanket, helical coil and netting stabilization or other means to stabilize surface slope. During construction, temporary water pollution control measures will be implemented, which may include the use of temporary silt fence, retention of existing vegetation, temporary check dams, temporary plastic cover, temporary drainage inlet protection and temporary erosion control blanket.
Non-Motorized and Pedestrian Features The I-80 Express Lanes project improvement does not impact local streets and intersections within the project limits. There are no impacts to existing non-motorized and pedestrian features within the West and East Segments and no opportunity to improve ADA accessibility with new curb ramps to comply with Caltrans DIB 82, Pedestrian Accessibility Guidelines for Highway Projects. Utility and Other Owner Involvement The project area contains overhead electric and communications lines and underground electric, gas, sanitary sewer, water, reclaimed water, communications, and fiber optic lines. Utilities in the project area were identified through site visits and reviews of utility plans obtained from utility providers, and local municipalities. Utility providers in the project area are listed below by category:
04 – SOL - 80 – PM R10.4/30.2
89
Gas and electric—PG&E
Communications—AT&T, Comcast, Verizon, and MCI.
Water—City of Fairfield, City of Vacaville, Solano Irrigation District. Bureau of Reclamation
Sanitary— City of Fairfield, City of Vacaville
The draft longitudinal encroachment was reviewed by Caltrans and it was conceptually approved on May 15, 2015 by Headquarter Division of Design. Final Encroachment exceptions approval will be obtained during PS&E Phase. The proposed longitudinal encroachment exception includes sewer lines, water lines, 12 KV electrical overhead lines, telephone lines, underground gas lines and underground fiber optic lines.
Verifications of utilities will be required. The need for positive location (potholing) as prescribed by the Policy on High and Low Risk Underground Facilities Within Highway Rights of Way (January, 1997) will be ascertained during PS&E phase. Utility relocations are not anticipated.
Needed Structure Rehabilitation and Upgrading
Based on the April 2014 California Log of Bridges on State Highways, there are ten structures within the West Segment and 12 structures within the East Segment.
Because the project involves minor roadway work for the West Segment, no structure rehabilitation or upgrade will be performed. For the East Segment, the following existing structures will require widening and will be modified:
1. Davis Street Undercrossing, Bridge No. 23-0023L & R, PM R26.00 2. Mason St Undercrossing, Bridge No. 23-0051L & R, PM R26.46 3. Ulatis Creek Bridge, Bridge No. 23-0052L & R, PM R26.61 4. Horse Creek Bridge, Bridge No. 23-0011L, PM R28.57
The Advance Planning Study drawings for these four structures are included in the East Segment Plans (Attachment D).
04 – SOL - 80 – PM R10.4/30.2
90
Cost Estimates The attached Preliminary Project Cost Estimates (Attachment F) provide specific work items that are included in the Build Alternative. Following is a cost breakdown of the main items for both the West Segment and East Segment:
ESTIMATE ROADWAY IMPROVEMENTS Roadway Items $ 101,000,000Structure Items $ 6,500,000Right of Way Items $ 1,500,000
SUBTOTAL CAPITAL $ 109,000,000 CAPITAL OUTLAY SUPPORT Engineering $ 18,100,000Right of Way $ 800,000Construction Support $ 16,100,000
SUBTOTAL CAPITAL OUTLAY SUPPORT $ 35,000,000
TOTAL CAPITAL OUTLAY $ 144,000,000 UTILITY SERVICES $ 1,500,000 TOLL SYSTEM CONSTRUCTION $ 21,100,000
TOTAL PROJECT COST $ 166,600,000
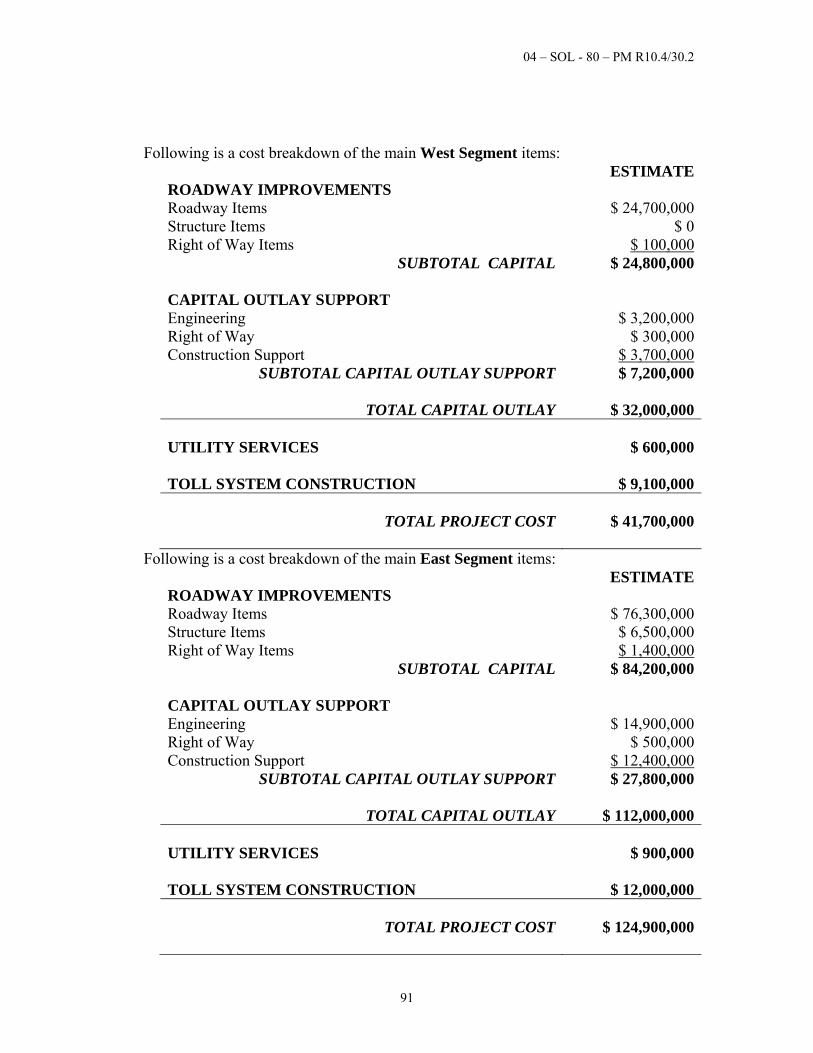
04 – SOL - 80 – PM R10.4/30.2
91
Following is a cost breakdown of the main West Segment items: ESTIMATE ROADWAY IMPROVEMENTS Roadway Items $ 24,700,000Structure Items $ 0Right of Way Items $ 100,000
SUBTOTAL CAPITAL $ 24,800,000 CAPITAL OUTLAY SUPPORT Engineering $ 3,200,000Right of Way $ 300,000Construction Support $ 3,700,000
SUBTOTAL CAPITAL OUTLAY SUPPORT $ 7,200,000
TOTAL CAPITAL OUTLAY $ 32,000,000 UTILITY SERVICES $ 600,000 TOLL SYSTEM CONSTRUCTION $ 9,100,000
TOTAL PROJECT COST $ 41,700,000
Following is a cost breakdown of the main East Segment items: ESTIMATE ROADWAY IMPROVEMENTS Roadway Items $ 76,300,000Structure Items $ 6,500,000Right of Way Items $ 1,400,000
SUBTOTAL CAPITAL $ 84,200,000 CAPITAL OUTLAY SUPPORT Engineering $ 14,900,000Right of Way $ 500,000Construction Support $ 12,400,000
SUBTOTAL CAPITAL OUTLAY SUPPORT $ 27,800,000
TOTAL CAPITAL OUTLAY $ 112,000,000 UTILITY SERVICES $ 900,000 TOLL SYSTEM CONSTRUCTION $ 12,000,000
TOTAL PROJECT COST $ 124,900,000
04 – SOL - 80 – PM R10.4/30.2
92
Effect of Special Funded Proposal on State Highway There will be no special funding to be used for the Build Alternative.
5B. Rejected Alternatives Project Study Report-Project Development Support Alternative The PSR-PDS was prepared and approved for this project in 2012. Two build alternatives were considered. Alternative A would implement continuous access express lanes with minimal improvements to the existing facility while Alternative B would implement 12-foot express lanes with ingress and egress access locations, 4-foot buffer and improvements to the existing facility to meet current design standards. Alternative B was determined to be not viable because it required significant impacts to over 100 urban and rural parcels including displacement of persons/businesses and major relocations of both high and low risks facilities. The project cost was estimated at $1.4 billion (in 2015 dollars) which included $990 million for construction capital, $75 million for right of way capital and $335 million for capital outlay support. The adopted 2011 Traffic Operations Policy Directive (TOPD) for Managed Lane Design requires consideration for both limited-access design and continuous-access design to better assess the capital costs for construction and operating expenses and the freeway’s performance and operations benefits. The TOPD also requires performance of an operational analysis and a safety analysis for any HOV conversion project. The studies would disclose the operational impact due to the proposed express lane and access openings on a limited-access design and safety impact on operating conditions and the potential for collision due to the proposed improvements. STA prepared a Continuous Access White Paper and presented the findings to Caltrans and MTC on March 9, 2011. The white paper discussed standard design, completed and upcoming express lane projects, access options along the I-80 corridor through Fairfield and Vacaville, and issues influencing continuous access. The recommended access option for I-80 was continuous access since this approach would balance the need to closely match current HOV lane legacy access conditions, promote effective utilization of the express lanes, meet bus transit service requirements, provide the opportunity for monitoring and enforcement at toll zones, and achieve a project operation and design that is able to be expeditiously implemented with minimal right of way and environmental impacts. There was consensus to consider a continuous access with limited/restricted access where needed for safety and operations for I-80. The Traffic Operations Analysis Report indicated that a limited or restricted access at any location would not be required. With the above findings, a limited-access design alternative for I-80 would not be a viable alternative.
04 – SOL - 80 – PM R10.4/30.2
93
6. CONSIDERATIONS REQUIRING DISCUSSION
6A. Hazardous Waste The Initial Site Assessment (ISA) was prepared for the project with the following conclusions and recommendations:
It is highly likely that the surface soils along the project corridor are affected by aerially deposited lead (ADL) and should be investigated. A site investigation of surface soils will be prepared to determine which of the surface soils may have been impacted with hazardous levels of ADL in the PS&E phase of the project.
The bridge structures to be modified within the East Segment have the potential for the presence of asbestos containing materials (ACM) and lead based paint. An ACM survey inspection will be performed by a certified inspector during the PS&E phase. Surveys for lead based paint will be conducted prior to demolition or modification of the structures within the right of way. A certified contractor should perform the work.
Several sites within the limits of the East Segment have shown historical or current presence of petroleum hydrocarbons in the groundwater. As these sites are adjacent to the right of way, groundwater underneath the right of way adjacent to these areas is likely impacted with petroleum hydrocarbons. If work involves installation of borings to groundwater level, groundwater impacts will be identified prior to start of work such that proper health and safety and mitigation measures can be developed. These sites are as follows:
o ARCO #2067 Service Station, 310 Orange Drive, Vacaville, CA (EDR ID #2)
o Shell Service Station, 1611 Monte Vista Avenue E, Vacaville, CA (EDR ID #4)
o Former Chevron Service Station, 1615 East Monte Vista, Vacaville, CA (ED ID #4)
o Valero Service Station, 1501 East Monte Vista, Vacaville, CA (EDR ID #7)
o ARCO #2184 Service Station, 3560 Nelson Road, Fairfield, CA (EDR ID #25)
o Stans Service Center, 3350 N. Texas Road, Fairfield, CA (EDR ID# 26)
The area adjacent to the project corridor within the limits of the East Segment was previously used for agricultural purposes. In the 1990s and early 2000s, the area turned into a mix use of agricultural, residential and commercial purposes. Soils may contain hazardous levels of pesticides and herbicides. A soil investigation work plan will be prepared as a guide in the sampling,
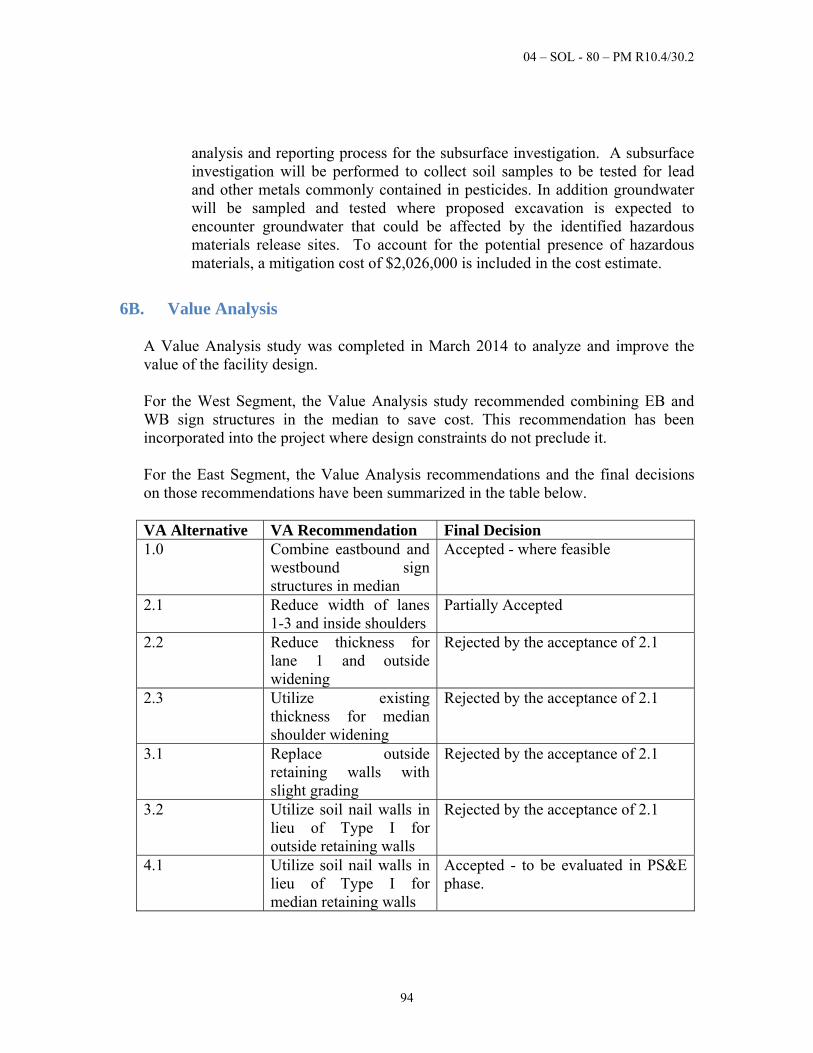
04 – SOL - 80 – PM R10.4/30.2
94
analysis and reporting process for the subsurface investigation. A subsurface investigation will be performed to collect soil samples to be tested for lead and other metals commonly contained in pesticides. In addition groundwater will be sampled and tested where proposed excavation is expected to encounter groundwater that could be affected by the identified hazardous materials release sites. To account for the potential presence of hazardous materials, a mitigation cost of $2,026,000 is included in the cost estimate.
6B. Value Analysis A Value Analysis study was completed in March 2014 to analyze and improve the value of the facility design. For the West Segment, the Value Analysis study recommended combining EB and WB sign structures in the median to save cost. This recommendation has been incorporated into the project where design constraints do not preclude it. For the East Segment, the Value Analysis recommendations and the final decisions on those recommendations have been summarized in the table below. VA Alternative VA Recommendation Final Decision 1.0 Combine eastbound and
westbound sign structures in median
Accepted - where feasible
2.1 Reduce width of lanes 1-3 and inside shoulders
Partially Accepted
2.2 Reduce thickness for lane 1 and outside widening
Rejected by the acceptance of 2.1
2.3 Utilize existing thickness for median shoulder widening
Rejected by the acceptance of 2.1
3.1 Replace outside retaining walls with slight grading
Rejected by the acceptance of 2.1
3.2 Utilize soil nail walls in lieu of Type I for outside retaining walls
Rejected by the acceptance of 2.1
4.1 Utilize soil nail walls in lieu of Type I for median retaining walls
Accepted - to be evaluated in PS&E phase.
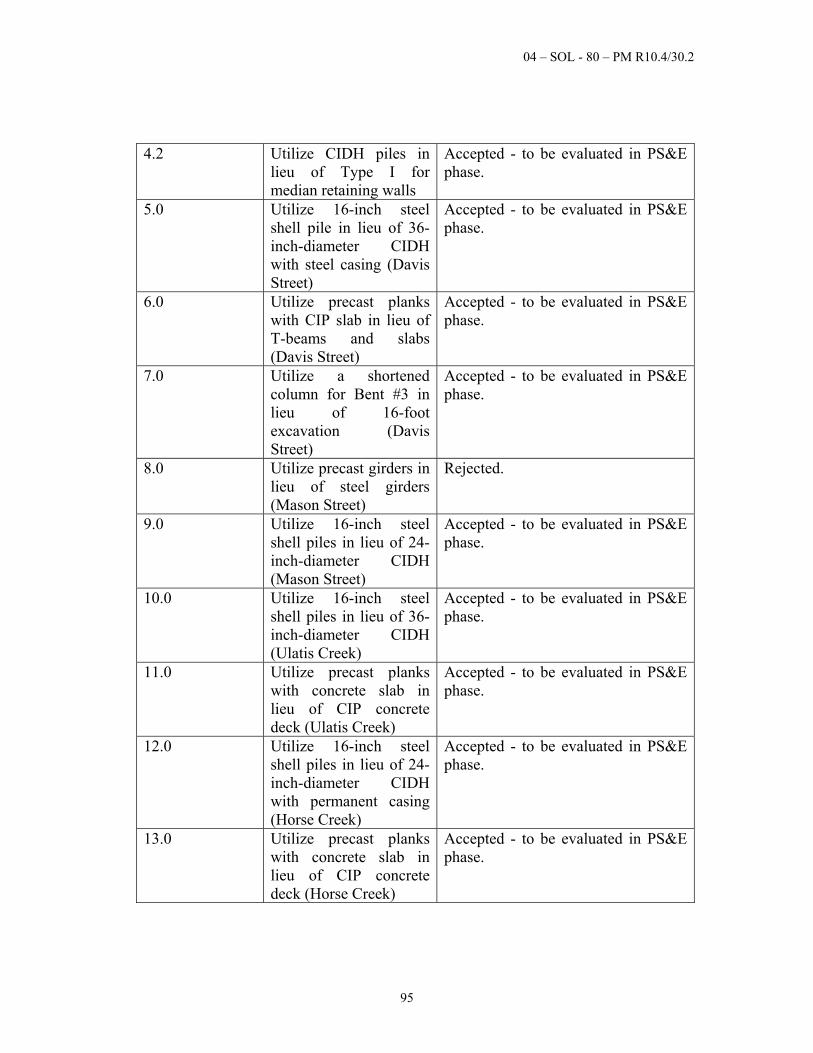
04 – SOL - 80 – PM R10.4/30.2
95
4.2 Utilize CIDH piles in lieu of Type I for median retaining walls
Accepted - to be evaluated in PS&E phase.
5.0 Utilize 16-inch steel shell pile in lieu of 36-inch-diameter CIDH with steel casing (Davis Street)
Accepted - to be evaluated in PS&E phase.
6.0 Utilize precast planks with CIP slab in lieu of T-beams and slabs (Davis Street)
Accepted - to be evaluated in PS&E phase.
7.0 Utilize a shortened column for Bent #3 in lieu of 16-foot excavation (Davis Street)
Accepted - to be evaluated in PS&E phase.
8.0 Utilize precast girders in lieu of steel girders (Mason Street)
Rejected.
9.0 Utilize 16-inch steel shell piles in lieu of 24-inch-diameter CIDH (Mason Street)
Accepted - to be evaluated in PS&E phase.
10.0 Utilize 16-inch steel shell piles in lieu of 36-inch-diameter CIDH (Ulatis Creek)
Accepted - to be evaluated in PS&E phase.
11.0 Utilize precast planks with concrete slab in lieu of CIP concrete deck (Ulatis Creek)
Accepted - to be evaluated in PS&E phase.
12.0 Utilize 16-inch steel shell piles in lieu of 24-inch-diameter CIDH with permanent casing (Horse Creek)
Accepted - to be evaluated in PS&E phase.
13.0 Utilize precast planks with concrete slab in lieu of CIP concrete deck (Horse Creek)
Accepted - to be evaluated in PS&E phase.
04 – SOL - 80 – PM R10.4/30.2
96
6C. Resource Conservation With the projected growth, traffic conditions are expected to get worse. The proposed express lane construction will maximize the freeway efficiency by utilizing the available unused capacity in the HOV lanes thus providing congestion relief and travel time savings for all users on I-80. This will likely reduce vehicle energy use, whether in the form of petroleum fuels or alternative sources of energy. Measures that will be taken to conserve energy and nonrenewable resources during construction for the proposed project are as follows:
Stage construction of the project improvements will be planned and scheduled to minimize impacts to existing traffic flows along I-80 and local streets.
Activities will be planned and scheduled to maximize the efficient use of construction manpower and equipment to reduce the use of fuel and power consumption.
Existing pavement sections to be removed will be recycled and incorporated into new pavement sections.
Gap graded (RHMA-G) rubberized hot mix asphalt, a blend of asphalt cement, reclaimed tire rubber and certain additives in which the rubber component is at least 15 percent by weight of the total blend, will be used as part of the new pavement structural section to retard reflection cracking and resist thermal stresses created by wide temperature variations.
6D. Right of Way General A Right of Way Data Sheet has been prepared based on the Build Alternative and is attached as Attachment H for reference. Ten (10) easements will be required for the West Segment. They are required for the installation of electrical and communication conduits outside the State right of way to provide electrical power and communication to overhead signs and electronic tolling equipment. The mainline widening for the East Segment will require partial property acquisition from 1 parcel. In addition ten (10) utility service easements and eight (8) temporary construction easements (TCEs) will be required. The easements will be required for construction purposes and for the installation of electrical and communication conduits outside the State right of way to provide electrical power and communication to overhead signs and electronic tolling equipment.
04 – SOL - 80 – PM R10.4/30.2
97
Staging Areas: Staging area for construction will be within the State right of way, possibly within existing interchanges. Temporary construction easements will be required for utility work and the construction of the retaining walls. Railroad Involvement There is a railroad crossing between Red Top Road and SR-12 West, located within the limits of the West Segment. The railroad tracks are over I-80 on the Cordelia Underpass structure (PM R11.92). There will be no impact to the structure; therefore, railroad involvement is not anticipated. However a railroad short clause will be included in the contract special provisions in the PS&E phase. The short clause instructs the contractor to stay out of the railroad right of way. Relocation Impact Studies Acquisitions of residential or commercial parcels are not required; therefore, relocation impacts are not anticipated. Airspace Lease Areas Impacts to existing airspace lease areas are not anticipated. Utility Policy Variance Report (UPVR) for Toll System Facilities Proposed I-80 Express Lanes overhead signs in the median, tolling equipment, and lighting will be connected to electrical power sources that are independent of the Caltrans system. The majority of the conduits for electrical power and fiber will be located in the State right of way except some electrical and communication service connections for Express Lanes (to be owned by MTC) may be installed within public’s right of way (local street and frontage road). The installation of service connections within public right of way may require encroachment permit from local city. The facilities within Caltrans’ right of way will require approval from Caltrans and documented in the Utility Policy Variance Report (UPVR). The exact location of these toll facilities will be determined in the PS&E phase. The draft UPVR was submitted and reviewed by Caltrans District 4 Right of Way and Headquarters Division of Design on October 28, 2014. Caltrans Headquarters have concurred with the UPVR and deferral of the final UPVR approval to PS&E Phase on May 15, 2015. The request for access and maintenance of these toll facilities by MTC will be covered under a separate maintenance and operations agreement. There will be no anticipated utility relocation due to proposed improvements for the West Segment. The exact locations of the toll signs and facilities are flexible. After positive verification of existing utilities (potholing), the toll signs and equipment can
04 – SOL - 80 – PM R10.4/30.2
98
be placed and located to avoid any utility conflicts. However, 52 transverse utility lines will be potentially impacted by the proposed East Segment widening and retaining wall construction. These include facilities owned by AT&T, Comcast, City of Fairfield, City of Vacaville, Solano Irrigation District, the Bureau of Reclamation, and PG&E. Potholing will be performed in accordance with Caltrans policy during the PS&E phase to identify the actual impacts. The project alternative proposes one utility conflict of a PG&E owned 12kV distribution overhead electric line at the I-505/I-80 connector ramp near the eastern limit of the project limits. The existing electric line is in conflict with the proposed on-ramp realignment and the right of way fee takes in that area. The electric line will be relocated outside of the new Caltrans right of way during construction. Costs have been included in the right of way data sheet for the proposed and potential utility relocations within the East Segment. The attached Right of Way Data Sheet (Attachment H) provides more information regarding the proposed right of way acquisitions and utility relocations.
6E. Environmental Initial Study/Environmental Assessment
The Mitigated Negative Declaration (MND) has been prepared in accordance with Caltrans' environmental procedure, as well as State and Federal environmental regulations. The attached MND is the appropriate document for the proposal. An Initial Study/Environmental Assessment (IS/EA), to satisfy the requirements of the California Environmental Quality Act (CEQA) and the National Environmental Protection Act (NEPA), respectively, was approved on July 13, 2015. The Draft Project Report was approved on July 13, 2015 to authorize the IS/EA public circulation. The IS/EA was publicly circulated for 30-days between July 20, 2015 to August 18, 2015 and a Public Open Forum Hearing was held on August 4, 2015. Two comments were received during the 30-day circulation period of the Draft Environmental Document. Based on the comments received, revisions (corrections and clarifications) have been made to the Environmental Document,
The findings of the technical studies, the IS/EA, public review comments and the final environmental document for this project support the determination that the proposed project would not have a significant effect on the environment and that the project is cleared for final design and construction. The Initial Study/Mitigated Negative Declaration (IS/MND) and Findings of No Significant Impacts (FONSI) were both approved on December 1, 2015. The Introductory page, Approval page
04 – SOL - 80 – PM R10.4/30.2
99
and Cumulative Impacts and Mitigation page of the document are included as Attachment I for reference. The following detailed technical studies have been prepared to support the environmental document:
Air Quality Study Report Air Quality Conformity Analysis Biological Resources Studies: Bat Report, Botanical Report California Red-
legged Frog Assessment and Protocol-Level Survey, Fairy Shrimp Report, Fish Passage, Riparian Tree Survey, Swainson Hawk Report, California Tiger Salamander Report and Wetland Report; Summarized in the Natural Environment Study and Biological Assessment
Cultural Resources Studies: Archaeological Survey Report, Historical Resources Evaluation Report, Historic Property Survey Report, and State Historic Preservation Officer (SHPO) concurrence received on July 02, 2015
Hazardous Waste: Initial Site Assessment, Soil Investigation Work Plan and Hazardous Report
Hydrology and Floodplain: Location Hydraulic Study Land Use: Community Impact Assessment Noise: Noise Study Report and Noise Abatement Decision Report Paleontological Evaluation Report Traffic Operations Analysis Report, Existing Conditions Report Visual Impact Assessment Water Quality: Hydromodification Report, Storm Water Data Report and
Water Quality Report The environmental project impacts and minimization/mitigation measures from the studies are described in the following subsections. Air Quality The project is located in two different air basins: the San Francisco Bay Area air basin (SF Air Basin) and the Sacramento Valley Air Basin (SV Air Basin), both of which have been designated by the United States Environmental Protection Agency as nonattainment for ground level ozone and fine particulate matter (PM2.5). The SF Air Basin has been designated as an attainment/maintenance area for carbon monoxide (CO), while the SV Air Basin has been designated partial nonattainment for CO. The two air basins do not meet State ozone and particulate matter standards set by the California Air Resources Board. The Bay Area Air Quality Management District along with the MTC and the Association of Bay Area Governments are the agencies responsible for developing plans to attain and maintain ambient air quality standards in the SF Air Basic, while Yolo-Solano Air Quality Management District
04 – SOL - 80 – PM R10.4/30.2
100
(YSAQMD) is responsible for the SV Air Basin. MTC’s Air Quality Conformity Task Force met on September 25, 2012 as part of interagency consultation for the proposed project and took action to conclude that the proposed project was not a project of air quality concern (POAQC) and a qualitative analysis of the project shows that the proposed project would not have an adverse effect on PM2.5 concentrations. As a result of that action, a project-level PM2.5 Hot Spot Analysis was not required.
The air quality study has the following results:
The project would not cause or contribute to any new localized PM2.5 or CO violations.
The project was determined not to be a POAQC and a qualitative analysis of the project shows that the proposed project would not have an adverse effect on PM2.5 concentrations.
CO hot-spot modeling found that local hot spot violations would not occur as a result of the project.
Construction emissions would not be significant with the implementation of appropriate dust control measures along with measures to reduce diesel exhaust. Caltrans special provisions and standard specifications will include the requirement to minimize or eliminate dust through application of water or dust palliatives.
Changes to mobile source air toxics (MSAT) and greenhouse gas (GHG) emissions were modeled using estimates of peak period and off-peak period traffic volumes and speeds. Emissions for all MSATs are projected to be decrease considerably over existing conditions. The slightly higher traffic volumes and speeds will result in slightly higher MSAT and GHG emissions when compared to the no-build scenario. Although increases in operation-related emissions may contribute to climate change, this project is intended to maximize the freeway facility efficiency by utilizing available unused capacity in the HOV lanes thus providing congestion relief and travel time savings for all users on I-80.
Biological Resources Natural Environment: The biological survey area (BSA) for the project includes the footprint of the completed project, new right of way limits, areas needed for utility relocation, construction access roads, driveway alignments and construction easements. Following is a summary of the impacts outlined in the Natural Environment Study:
Federally Protected Species: o No special status plants were detected or expected in the BSA, and no
special status plant critical habitat overlaps the BSA.
04 – SOL - 80 – PM R10.4/30.2
101
o The proposed improvements are expected to have no effect on the California tiger salamander; Conservancy fairy shrimp; vernal pool tadpole shrimp; vernal pool fairy shrimp; Delta green ground beetle; and Callippe silverspot butterfly or their designated critical habitat.
o The proposed improvements may affect, but are not likely to adversely affect, the following species or their designated critical habitat: Townsend’s western big-eared bat; Yuma myotis migratory birds; golden eagle; Swainson’s hawk; Central Valley steelhead; Central California coastal steelhead; and Valley elderberry longhorn beetle (VELB).
o The direct effects of the project include permanent and temporary loss of host plant habitat. Project construction will result in the permanent and temporary loss of potential VELB riparian woodland habitat. Two of the 38 elderberry shrubs mapped within the BSA were determined to be located within 100 feet of project temporary impact areas.
o The proposed improvements are likely to adversely affect the California red-legged frog or their designated critical habitat.
State Protected Species: o One special-status plant was identified during the protocol-level surveys,
Ferris’ goldfields (Lasthenia ferrisiae), which is listed as a California Rare Plant. This population is unlikely to persist, even in the absence of additional construction disturbance. This species was not observed during a reconnaissance site visit on May 9, 2014. Further, this species is widely distributed across California (including Solano County). Thus, project activities would potentially affect only a very small proportion of the regional populations of this species, and possibly would not affect this species at all. Therefore, this project would not result in substantial adverse effects on Ferris’ goldfields. The proposed improvements are expected to have no effect on the Short-eared owl or pallid bat or their designated critical habitat.
o The proposed improvements may affect, but are not likely to adversely affect, the following species: American badger; western red bat; western burrowing owl; northern harrier; American peregrine falcon; white-tailed kite; tricolored blackbird; grasshopper sparrow; loggerhead shrike; western pond turtle
A total of 43 invasive plant species such as eucalyptus, poison hemlock and sweet fennel were detected in the BSA.
Biological Assessment: A biological assessment (BA) was prepared to address federal special-status species that occur or have potential to occur in the project area for the US Fish and Wildlife Services (USFWS). Avoidance, minimization, and mitigation measures that are appropriate for each species determined to be present or which has the potential to occur within the project area were identified in the biological assessment.
04 – SOL - 80 – PM R10.4/30.2
102
Biological Opinion: A biological opinion (BO) was issued by USFWS on August 17, 2015, which concurred on the findings in the Biological Assessment. Caltrans also initiates consultation with the National Marine Fisheries Service (NMFS) when a project has the potential to affect a federally listed anadromous fish species and/or adversely affect designated critical habitat. As the project has the potential to affect Central Valley steelhead and Central California Coast steelhead, federally listed anadromous fish, informal consultation with the NMFS was initiated in March 2015 with the submission of a BA prepared for the project. The NMFS agreed that because the project did not propose pile driving, there would be no likely impacts to the Central Valley steelhead and Central California Coast steelhead. Accordingly, NMFS agreed that under the Programmatic Biological Opinion for Caltrans' Routine Maintenance and Repair Activities Program in Caltrans' Districts 1, 2, and 4 issued to Caltrans by NOAA, the project is covered under Category 3. As such, no further opinion was needed. Cultural Resources Archaeological: An archival records search and archaeological survey was conducted within the Area of Potential Effects (APE). Four archaeological sites are known to occur within the APE. One of the known sites within the APE will not be affected by the project. The remaining three sites will be considered eligible for the National Register and protected from inadvertent project impacts with ESAs.
Because the Build Alternative would involve construction activities near the archaeological sites, an ESA plan was prepared to protect known resources. Due to access issues, a testing/treatment plan was established to test for potential cultural resources during project construction. The project resulted in a finding of No Adverse Effect without Standard Conditions with concurrence by the State Historic Preservation Officer (SHPO) received on July 2, 2015. Consultation with the SHPO will be ongoing throughout the testing phase.
If cultural resources are identified, protocol as stipulated in the testing/treatment plan will be followed. If buried cultural materials are encountered during construction, it is Caltrans policy that work stop in the area until a qualified archaeologist can evaluate the nature and significance of the find.
Architectural History: Seven properties within the APE required formal historical resources evaluation. The properties are as follows:
1. 4004-4018 Russell Road, Fairfield, built 1946, within West Segment 2. Cherry Glen Road Overcrossing, Vacaville, built 1965, within East Segment 3. Rivera Road Overcrossing, Vacaville, built 1965, within East Segment
04 – SOL - 80 – PM R10.4/30.2
103
4. 5956 Cherry Glen Road, Vacaville, built 1890s/1950s, within East Segment 5. 290, 300, 316 Butcher Road, Vacaville, built 1930s-1950s, within East
Segment 6. 280, 310, 312 Butcher Road, Vacaville, built 1930s-1940s, within East
Segment 7. 270 and 272 Butcher Road, Vacaville, built 1950, within East Segment
These properties were determined no eligible for the National Register of Historic Places (NRHP). In addition, the properties were determined no eligible for listing in the California Register of Historical Resources (CRHR) and are not historical resources for the purposes of CEQA compliance. The Pena Adobe (adobe built 1842, annex built 1880) is located within the APE and within East Segment. The property is on the east side of I-80 within the City of Vacaville’s Lagoon Valley/Pena Adobe Regional Park. The Pena Adobe is designated as California Historical Landmark (Historical Landmark No. 534) and is listed in the NRHP. As a listed NRHP property, the Pena Adobe is automatically listed in the CRHR and is considered a historical resource under CEQA. The Pena Adobe was found significant under Criterion B for its association with Solano County pioneer Juan Felipe Pena. A field check of the adobe and the annex in August 2013 found no alterations that would warrant a change in its current NRHP listing. The project has a finding of no adverse effect. Hydrology and Floodplain Eight waterways cross I-80 within the West Segment. Four of these crossings are bridges and the rest cross the freeway in concrete culverts. Work for the West Segment will not add fill, retaining walls, and structures within the existing floodplain. Therefore, there is no adverse impact to the floodplain. Ten major waterways cross I-80 within the East Segment with Putah South Canal crossing I-80 twice, for a total of eleven crossings. Four of these crossings are bridges and the remaining seven are concrete culverts. The East Segment improvements do not result in any longitudinal encroachment of the base floodplains. Concrete barriers will not be placed in the base floodplains within the East Segment. The only location where there will be fill in the base floodplain within the East Segment is at the Ulatis Creek crossing of I-80 in the City of Vacaville. The fill is a result of the new 3 foot wide bridge piers proposed for the inside bridge widening (existing are between 12in. and 16in. diameter) and is estimated to be 20 cubic yards, which is insignificant compared to the overall storage volume of the floodplain. Base on the Location Hydraulic Study the proposed inside bridge widening would result in an increase in water surface elevation of 0.6 ft upstream of the bridge for a 100-year event that tapers to 0 ft at approximately 1,500 ft upstream of the bridge, just downstream of the next upstream bridge at Depot Street. These base floodplain impacts appear to be
04 – SOL - 80 – PM R10.4/30.2
104
contained within the existing channel. There is no change or the water surface elevation downstream of I-80. Mitigation for the added fill will be provided by removing material from this floodplain. Potential locations for this mitigation include, but are not limited to, the channel banks upstream and downstream of this creek crossing. Final mitigation will be determined in the design phase. The roadway widening will increase impervious areas; however, compared to the overall size of the watersheds for each floodplain, the increase in the water surface elevation resulting from the increase in impervious area is insignificant that no mitigation will be required. Land Use The East Segment will include property acquisition and easements (utility and TCE) from 17 total parcels. Residential or business relocation is not required. This project is listed in the 2013 Transportation Improvement Program for the San Francisco Bay Area. Noise The noise study analysis has the following results:
Typical noise increases resulting from the project were calculated to be zero to two A-weighted decibels of equivalent sound level over an hour (or dBA Leq (h) levels higher than existing noise levels).
The noise level increases predicted from the project will not generally be substantial.
Noise levels at many receptors will continue to approach or exceed the noise abatement criteria. The noise abatement analysis and results are discussed under the Noise Abatement Decision Report section.
Paleontology Potential impacts on paleontological resources resulting from project construction will primarily involve terrain modification such as clearing and grubbing, grading, excavations, augering, and drainage diversion measures. Construction activities that may involve terrain modification include installation of overhead sign foundation, electronic tolling equipment foundation, modification or construction of drainage ditches, modification of existing structures and construction of retaining walls. Excavation for the West Segment can impact the Sites Formation of the Great Valley Sequence, the Markley Formation, the Sonoma Volcanics, and Pleistocene and Holocene alluvial deposits. Excavation for the East Segment can impact the Sites, Funks and Guinda formations of the Great Valley Sequence, the Markley, Neroly and Tehama formations, and Pleistocene and Holocene alluvial deposits. Of these
04 – SOL - 80 – PM R10.4/30.2
105
stratigraphic units, the Markley, Neroly and Tehama formations as well as the Sonoma Volcanics and Pleistocene alluvial deposits have a high potential for producing significant paleontological resources.
Mitigation measures described in the paleontological evaluation report will reduce the potential adverse impacts to significant paleontological resources by allowing for the salvage of fossil remains and associated specimen data and corresponding geologic and geographic site data that otherwise might be lost to earth-moving and unauthorized fossil collection.
Visual Impact The design and location of all proposed signs and equipment were analyzed for the freeway signing system rather than just the signing for the express lanes. Installation of overhead signs and electronic tolling equipment are proposed from one mile prior to the express lane entrances to the end of the express lanes. The proposed overhead express lane signs will have varying degrees of visual impact throughout the study area, depending on the existing scenery and backdrop. There are few areas where new signs will be visible to highway neighbors. While overhead signs may obstruct views of scenic vistas in some areas, highway users travel at fast speeds and spend limited time at each particular viewpoint; thus, limiting the change to visual character. While the proposed signage will slightly disrupt the unity of the landscape, the overall character and quality will remain relatively unchanged. The visual impact for both the West Segment and East Segment from the installation of the overhead signs and electronic tolling equipment will be moderately low. Proposed overhead express lane signs would have varying degrees of impact throughout the study area, depending on the existing scenery and backdrop. There are few areas where new signs would be visible to highway neighbors. The visual simulations for the Build Alternative show proposed express lane signage. While the proposed signage would disrupt the unity of the landscape, the overall character and quality would remain relatively unchanged. Inside and outside widening within the East Segment will produce moderately noticeable visual impacts by extending the paved surfaces and removing vegetation. In certain areas within the study area, removal of trees or vegetation allows for higher visibility of surrounding scenic resources. In other areas, vegetation removal will expose less visually appealing urban development. Median oleander removal will expose views of vehicles traveling in the opposite direction in certain areas. The magnitude of change will be notable, but will not substantially alter scenic vistas, scenic resources, or degrade the existing character and quality of the study area. Additional lighting infrastructure will not substantially introduce new sources of light because there are existing street lights in the immediate area throughout most of the project study limits, consistent with major highway corridors. Furthermore,
04 – SOL - 80 – PM R10.4/30.2
106
commercial, industrial, and residential areas nearby also contribute to sources of light along the corridor. The visual impact for the East Segment from the inside and outside widening will be high. Measures noted in the Visual Impact Assessment will avoid or minimize visual impacts. Water Quality Based on review of the available information from the United State Geological Survey and Federal Emergency Management Agency, multiple waterway crossings have been identified. The waterways that cross the West Segment are Jameson Canyon Creek, Green Valley Creek, Dan Wilson Creek, Suisun Creek, Rain Drains, Alonzo Drains, Ledgewood Creek and Pennsylvania Creek. The waterways that cross the East Segment are Putah South Canal, Union Avenue Creek, Soda Springs Creek, Laurel Creek, Lagoon Drain, Laguna Creek, Alamo Creek, Ulatis Creek, Pine Tree Creek and Horse Creek. The project will disturb more than one acre of soil; therefore, it will be subject to the requirements stated within the State Water Resources Control Board, National Pollutant Discharge Elimination System (NPDES) general permit (Order No. 2012-0011-DWQ, NPDES No. CAS000002). To comply with the conditions of NPDES No. CAS000002 and the Caltrans NPDES Permit (NPDES No. CAS000003), and address the temporary water quality impacts resulting from the construction activities in this project, compliance with the Storm Water Pollution Prevention Plan (SWPPP) Standard Specifications is required. The Standard Specifications will address the preparation of the SWPPP document and the implementation of SWPPP during construction. A risk level determination for construction activities was performed based on the planned construction period and location. Projects can be designated as risk level 1, 2, or 3. All risk levels are subject to temporary construction site best management practice implementation and visual monitoring requirements. Risk levels 2 and 3 would be the highest water quality risk, and require stormwater sampling at all discharge locations, with samples subject to numeric action levels for pH and turbidity. Risk level 3 is subject to receiving water monitoring triggers for pH, turbidity and suspended sediment concentrations. The entire West Segment has been determined to be Risk Level 2. The estimated predominant risk level for the East Segment is risk level 3. The East Segment will have multiple risk levels for the different watersheds within the project limits (a total of five). During the PS&E Phase, separate NOI submittals will be required for each watershed. A Storm Water Data Report has been prepared to summarize all the proposed measures for the project. The signed cover page of the Storm Water Data Report
04 – SOL - 80 – PM R10.4/30.2
107
(SWDR) is included as Attachment J for reference. Best Management Practices (BMPs) will be considered and implemented for utilization in the project to address temporary water quality impacts resulting from the construction activities for the project, and are discussed in the SWDR. The project will include four different types of BMPs: Construction Site BMPs, Design Pollution Prevention BMPs, Permanent Treatment BMPs and Maintenance BMPs. Construction Site BMPs will include the measures of soil stabilization, sediment control, wind erosion control, tracking control, non-storm water management, and waste management/materials pollution control. Appropriate BMPs and their quantities need to be developed during the PS&E phase. In addition, depending on project risk level, certain monitoring and reporting will be required. Permanent Erosion Control measures will be implemented in the project to stabilize all the disturbed area as a means of source control. Permanent treatment BMPs will also be constructed to treat storm water. The specific types and locations of Treatment BMPS will be decided during the PS&E phase of the project. The estimated cost of the potential Treatment BMPs is noted in the attached Preliminary Project Cost Estimates (Attachment F). Caltrans current NPDES permit also requires permanent stormwater treatment BMPs be constructed to treat stormwater for generated runoff. Because the project will add more than one acre of impervious area and drainage facilities within the State right of way discharge to local drainage facilities, hydromodification management will be required in accordance with California Regional Water Quality Control Board, San Francisco Bay Region Municipal Regional Stormwater NPDES (NPDES No. CAS612008). The hydromodification analysis has the following results:
The West Segment receiving water bodies have low risk for hydromodification; therefore, the West Segment will not be required to implement hydromodification mitigation.
Eight of the nine East Segment receiving water bodies have low risk for hydromodification. One of the nine has a moderate risk for hydromodification. When compared to the overall receiving creek watersheds, the added impervious area for each creek will be insignificant. In addition, the creeks either have lined segments, evidence of aggradation, vegetated side slopes, low channel slopes or channel armoring; all of which are items that will decrease the likelihood of channel erosion.
To address the East Segment’s water quality impacts, bio/hydromodification swales will be included as part of the project. Additional mitigation measures may include underground detention, detention basins and Austin vault sand filters. In addition, mitigation measures will be incorporated in the design of the ten preliminary outfalls. The project limits include multiple waterways; bridge widening at Ulatis and Horse creeks is anticipated. If any work occurs within water bodies, temporary creek
04 – SOL - 80 – PM R10.4/30.2
108
diversion systems (TCDS) will be required. Early discussion with Caltrans Branch of Water Pollution Control will be needed for the design details, impact areas, water quality monitoring, and non-standard special provisions of the TCDS. The project involves structure widening at the Davis Street and Mason Street undercrossing. If significant amount of groundwater will be encountered in the deep excavations, such as construction of the footing elements, dewatering and non-storm water discharges may be required. As part of the Hazardous Waste Site Investigation, ground water testing may be required to determine if it is contaminated to develop contract provisions for its handling and disposal during construction. If significant amount of groundwater will be encountered in the deep excavations, dewatering may be required. As part of the Hazardous Waste Site Investigation, ground water testing may be required to determine if it is contaminated to develop contract provisions for its handling and disposal during construction. If construction is scheduled in water bodies, creek diversion may be needed. Early discussion with Water Pollution Control Branch is required for Temporary Creek Diversion System
6F. Air Quality Conformity The project as listed in the current Regional Transportation Plan (RTP) for the Bay Area, known as Plan Bay Area, was found to conform by MTC on July 18, 2013. The FHWA and Federal Transit Administration made a regional conformity determination on August 12, 2013. The proposed project (Project Reference Nos. 230659 and 230660 and TIP ID SOL 110001) was included in the regional emissions analysis conducted by MTC for Plan Bay Area and the 2015 Regional Transportation Improvement Plan (RTIP). The MTC 2015 RTIP was determined to conform by FHWA and FTA on December 15, 2014. The project's design concept and scope have not changed significantly from those described in the current 2013 RTP, and 2015 RTIP. All applicable Transportation Control Measures are included in the project. The project would not cause or contribute to any new localized fine particulate matter or carbon monoxide violations; therefore, meeting the “hot-spot” conformity requirements of 40 CFR 93.116(a). The hot-spot modeling results satisfy the Project Level Conformity requirements identified in 40 CFR 93.116(a).
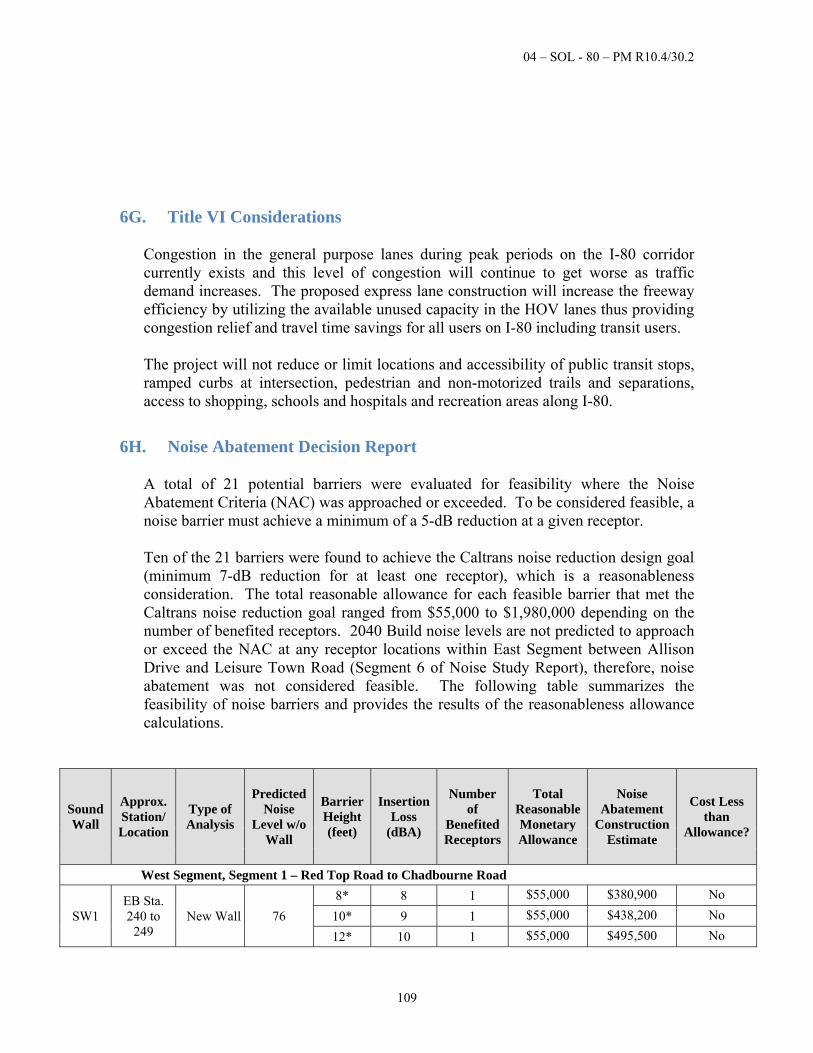
04 – SOL - 80 – PM R10.4/30.2
109
6G. Title VI Considerations Congestion in the general purpose lanes during peak periods on the I-80 corridor currently exists and this level of congestion will continue to get worse as traffic demand increases. The proposed express lane construction will increase the freeway efficiency by utilizing the available unused capacity in the HOV lanes thus providing congestion relief and travel time savings for all users on I-80 including transit users. The project will not reduce or limit locations and accessibility of public transit stops, ramped curbs at intersection, pedestrian and non-motorized trails and separations, access to shopping, schools and hospitals and recreation areas along I-80.
6H. Noise Abatement Decision Report A total of 21 potential barriers were evaluated for feasibility where the Noise Abatement Criteria (NAC) was approached or exceeded. To be considered feasible, a noise barrier must achieve a minimum of a 5-dB reduction at a given receptor. Ten of the 21 barriers were found to achieve the Caltrans noise reduction design goal (minimum 7-dB reduction for at least one receptor), which is a reasonableness consideration. The total reasonable allowance for each feasible barrier that met the Caltrans noise reduction goal ranged from $55,000 to $1,980,000 depending on the number of benefited receptors. 2040 Build noise levels are not predicted to approach or exceed the NAC at any receptor locations within East Segment between Allison Drive and Leisure Town Road (Segment 6 of Noise Study Report), therefore, noise abatement was not considered feasible. The following table summarizes the feasibility of noise barriers and provides the results of the reasonableness allowance calculations.
Sound Wall
Approx. Station/ Location
Type of Analysis
Predicted Noise
Level w/o Wall
Barrier Height (feet)
Insertion Loss
(dBA)
Number of
Benefited Receptors
Total Reasonable Monetary Allowance
Noise Abatement
Construction Estimate
Cost Less than
Allowance?
West Segment, Segment 1 – Red Top Road to Chadbourne Road
SW1 EB Sta. 240 to
249 New Wall 76
8* 8 1 $55,000 $380,900 No
10* 9 1 $55,000 $438,200 No
12* 10 1 $55,000 $495,500 No
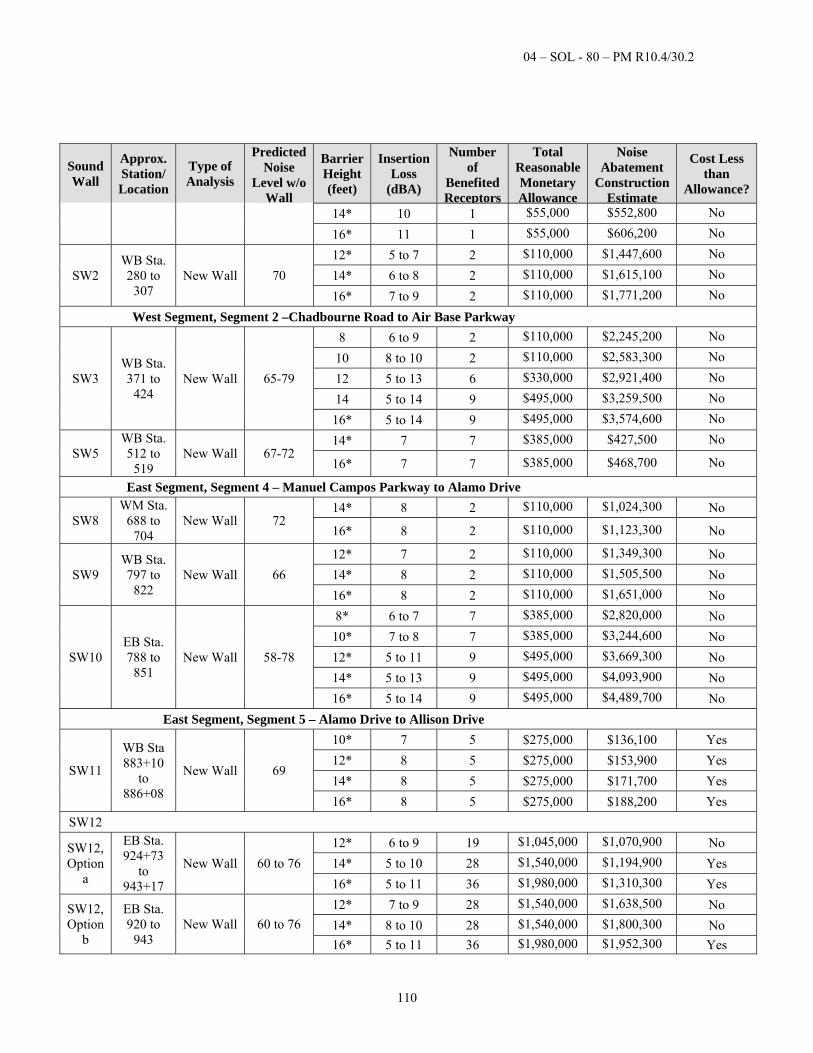
04 – SOL - 80 – PM R10.4/30.2
110
Sound Wall
Approx. Station/ Location
Type of Analysis
Predicted Noise
Level w/o Wall
Barrier Height (feet)
Insertion Loss
(dBA)
Number of
Benefited Receptors
Total Reasonable Monetary Allowance
Noise Abatement
Construction Estimate
Cost Less than
Allowance?
14* 10 1 $55,000 $552,800 No
16* 11 1 $55,000 $606,200 No
SW2 WB Sta. 280 to
307 New Wall 70
12* 5 to 7 2 $110,000 $1,447,600 No
14* 6 to 8 2 $110,000 $1,615,100 No
16* 7 to 9 2 $110,000 $1,771,200 No
West Segment, Segment 2 –Chadbourne Road to Air Base Parkway
SW3 WB Sta. 371 to
424 New Wall 65-79
8 6 to 9 2 $110,000 $2,245,200 No
10 8 to 10 2 $110,000 $2,583,300 No
12 5 to 13 6 $330,000 $2,921,400 No
14 5 to 14 9 $495,000 $3,259,500 No
16* 5 to 14 9 $495,000 $3,574,600 No
SW5 WB Sta. 512 to
519 New Wall 67-72
14* 7 7 $385,000 $427,500 No
16* 7 7 $385,000 $468,700 No
East Segment, Segment 4 – Manuel Campos Parkway to Alamo Drive
SW8 WM Sta.
688 to 704
New Wall 72 14* 8 2 $110,000 $1,024,300 No
16* 8 2 $110,000 $1,123,300 No
SW9 WB Sta. 797 to
822 New Wall 66
12* 7 2 $110,000 $1,349,300 No
14* 8 2 $110,000 $1,505,500 No
16* 8 2 $110,000 $1,651,000 No
SW10 EB Sta. 788 to
851 New Wall 58-78
8* 6 to 7 7 $385,000 $2,820,000 No
10* 7 to 8 7 $385,000 $3,244,600 No
12* 5 to 11 9 $495,000 $3,669,300 No
14* 5 to 13 9 $495,000 $4,093,900 No
16* 5 to 14 9 $495,000 $4,489,700 No
East Segment, Segment 5 – Alamo Drive to Allison Drive
SW11
WB Sta 883+10
to 886+08
New Wall 69
10* 7 5 $275,000 $136,100 Yes
12* 8 5 $275,000 $153,900 Yes
14* 8 5 $275,000 $171,700 Yes
16* 8 5 $275,000 $188,200 Yes
SW12
SW12, Option
a
EB Sta. 924+73
to 943+17
New Wall 60 to 76
12* 6 to 9 19 $1,045,000 $1,070,900 No
14* 5 to 10 28 $1,540,000 $1,194,900 Yes
16* 5 to 11 36 $1,980,000 $1,310,300 Yes
SW12, Option
b
EB Sta. 920 to
943 New Wall 60 to 76
12* 7 to 9 28 $1,540,000 $1,638,500 No
14* 8 to 10 28 $1,540,000 $1,800,300 No
16* 5 to 11 36 $1,980,000 $1,952,300 Yes
04 – SOL - 80 – PM R10.4/30.2
111
Sound Wall
Approx. Station/ Location
Type of Analysis
Predicted Noise
Level w/o Wall
Barrier Height (feet)
Insertion Loss
(dBA)
Number of
Benefited Receptors
Total Reasonable Monetary Allowance
Noise Abatement
Construction Estimate
Cost Less than
Allowance?
*Barrier is calculated to break line-of-sight between truck stacks and receptors
Noise Abatement Decision: The preliminary recommendation and decision of the project is to not include noise barriers in the proposed project design for the West Segment and to include noise barriers in the form of Soundwalls No. 11 and 12a for the East Segment. In the West Segment, the cost of construction for each of the sound barriers compared to the number of benefited receptors and the cost allowance for each benefited receptor makes including noise barriers unreasonable. Although the Caltrans design goal of 7-dB noise reduction loss is met, the high cost of noise abatement as well as the low number of benefited receptors make including the sound barriers unreasonable for the West Segment design. In the East Segment, the cost of construction for each of the sound barriers compared to the number of benefited receptors and the cost allowance for each benefited receptor makes including noise barriers unreasonable for Soundwalls 8, 9 and 10. Although the Caltrans design goal of 7-dB noise reduction loss is met for these barriers, the high cost of noise abatement as well as the low number of benefited receptors make including the sound barriers SW-8, 9 and 10 unreasonable for the East Segment design. For Soundwalls 11 and 12a, the cost of construction for each of the sound barriers compared to the number of benefited receptors and the cost allowance for each benefited receptor was found to be reasonable. Soundwall 12 was studied as two different wall limits (12a and 12b); while both are reasonable, option 12a is significantly less expensive while providing the same noise abatement benefits as option 12b. The longer wall (option 12b) adds significant cost to cross the Ulatis Creek Bridge and construct the associated retaining walls, yet provides no additional benefits to the associated receptors based on comparing the 16 foot wall height to that of option 12a. The Noise Abatement Decision Report, dated October 15, 2014 concluded that new soundwalls SW11 and SW12a were warranted within the East Segment. These wall locations were found to be reasonable under the monetary reasonableness criteria. The preliminary noise abatement decision presented in this report is based on preliminary project alignments and profiles, which may be subject to change. As such, the physical characteristics of noise abatement described herein also may be subject to change. If pertinent parameters change substantially during the final project
04 – SOL - 80 – PM R10.4/30.2
112
design, the preliminary noise abatement decision may be changed or eliminated from the final project design. A final decision to construct noise abatement will be made upon completion of the project design. The preliminary noise abatement decision presented here was included in the draft environmental document, which circulated for public review.
04 – SOL - 80 – PM R10.4/30.2
113
7. OTHER CONSIDERATIONS AS APPROPRIATE
7A. Public Hearing Process A Public Open Forum Hearing was held on August 4, 2015 from 6:00 PM to 8:00 PM at the Solano County Events Center. During the open forum hearing attendees were invited to view informational exhibits; maps of the project alignment; preliminary recommended soundwalls; environmental topics evaluated in the IS/EA; and current schedule and cost. Information about express lane operation, toll systems, toll signs and California Highway Patrol enforcement areas was provided in that meeting. One comment from a community member, inquired about a possible increased noise level due to a newly constructed on-ramp lane near their residence at 318 Creekview Court in Vacaville. This community member requested a new noise survey be conducted once the project is operational. During the 30-day circulation period a written comment was received. This comment from the California Department of Water Resources (DWR) noted the North Bay Aqueduct (NBA) crosses the project limits and stated that any construction activity in the vicinity of the NBA may require an encroachment permit issued by DWR. Comments have been addressed in the Final IS/EA. A detailed Noise Study Report was conducted for this project that evaluated existing and future noise levels with and without the project. The loudest hour noise levels calculated at the receptor position in question were 64 dBA Leq for existing conditions and 65 dBA Leq for future No-Build and future Build conditions. The predicted noise levels were below the Noise Abatement Criterion of 67 dBA Leq for Category B residential land uses. In response to the other comment, the project will obtain all appropriate permits prior to construction. Should the project result in any construction activity in the vicinity of the North Bay Aqueduct (NBA), it will be determined if an encroachment permit issued by the Department of Water Resources (DWR) is necessary.
7B. Route Matters No revisions to the existing freeway agreements are anticipated for this project.
7C. Permits The following permits are anticipated for the project:
1. Caltrans Construction Encroachment Permit
2. Local agency encroachment permits
04 – SOL - 80 – PM R10.4/30.2
114
3. 404 Permit from the United States of America Army Corps of Engineers
4. 401 Water Quality Certification from the San Francisco Bay Regional Water Quality Control Board
5. National Pollutant Discharge Elimination System Permit from the State Water Resources Control Board
6. 1602 Streambed Alteration Agreement from California Department of Fish and Game
7D. Cooperative Agreements Cooperative Agreement No. 04-2455 between the State of California (Caltrans) and the Solano Transportation Authority (STA) was executed on May 3, 2012. The Cooperative Agreement outlines the obligations and responsibilities of both Caltrans and STA to complete the PA&ED and PS&E components of the project. A copy of the executed Cooperative Agreement is included as Attachment K for reference. STA is the SPONSOR of the project and will be the implementing agency for PA&ED and PS&E. Caltrans is the CEQA and NEPA lead agency for the project. The responsibility to advertise, open bids, award, approve and administer the construction contract will be handled under a separate agreement in the PS&E Phase.
7E. Other Agreements Maintenance Agreements For the West Segment, new or revision(s) to existing maintenance agreements will not be required. For the East Segment, new or revision(s) to existing signal maintenance agreement will not be required since there is no signal modification at ramp terminus. However, the East Segment is proposing new retaining walls along City of Vacaville property. New or revision(s) to the existing maintenance agreements with the City of Vacaville will be required. The Existing Agreements within the project limit are listed in Table 7E-1.
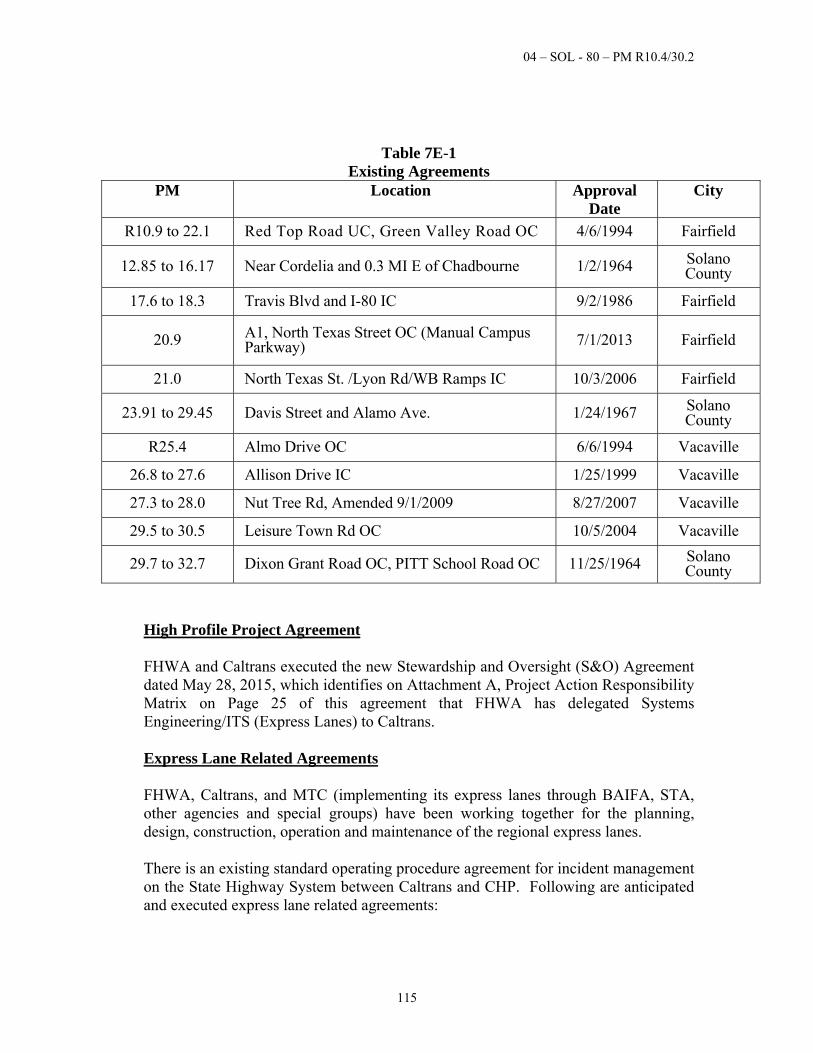
04 – SOL - 80 – PM R10.4/30.2
115
Table 7E-1 Existing Agreements
PM Location Approval Date
City
R10.9 to 22.1 Red Top Road UC, Green Valley Road OC 4/6/1994 Fairfield
12.85 to 16.17 Near Cordelia and 0.3 MI E of Chadbourne 1/2/1964 Solano County
17.6 to 18.3 Travis Blvd and I-80 IC 9/2/1986 Fairfield
20.9 A1, North Texas Street OC (Manual Campus Parkway) 7/1/2013 Fairfield
21.0 North Texas St. /Lyon Rd/WB Ramps IC 10/3/2006 Fairfield
23.91 to 29.45 Davis Street and Alamo Ave. 1/24/1967 Solano County
R25.4 Almo Drive OC 6/6/1994 Vacaville
26.8 to 27.6 Allison Drive IC 1/25/1999 Vacaville
27.3 to 28.0 Nut Tree Rd, Amended 9/1/2009 8/27/2007 Vacaville
29.5 to 30.5 Leisure Town Rd OC 10/5/2004 Vacaville
29.7 to 32.7 Dixon Grant Road OC, PITT School Road OC 11/25/1964 Solano County
High Profile Project Agreement FHWA and Caltrans executed the new Stewardship and Oversight (S&O) Agreement dated May 28, 2015, which identifies on Attachment A, Project Action Responsibility Matrix on Page 25 of this agreement that FHWA has delegated Systems Engineering/ITS (Express Lanes) to Caltrans.
Express Lane Related Agreements FHWA, Caltrans, and MTC (implementing its express lanes through BAIFA, STA, other agencies and special groups) have been working together for the planning, design, construction, operation and maintenance of the regional express lanes. There is an existing standard operating procedure agreement for incident management on the State Highway System between Caltrans and CHP. Following are anticipated and executed express lane related agreements:
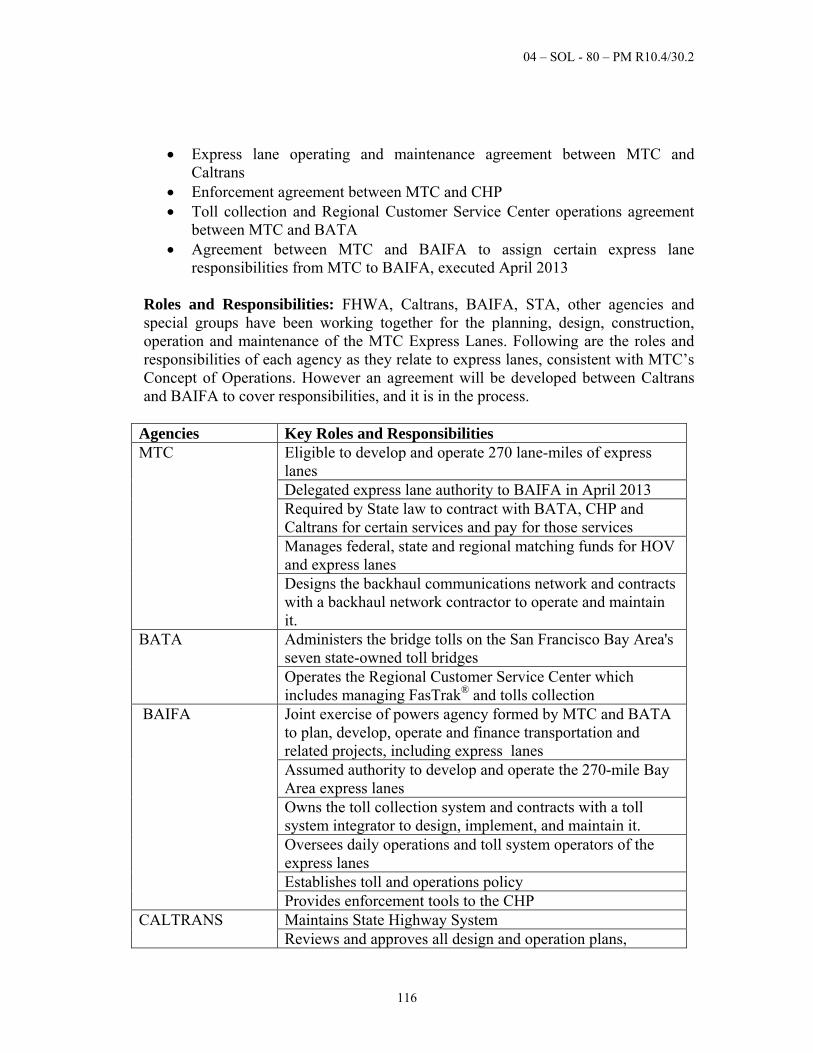
04 – SOL - 80 – PM R10.4/30.2
116
Express lane operating and maintenance agreement between MTC and Caltrans
Enforcement agreement between MTC and CHP Toll collection and Regional Customer Service Center operations agreement
between MTC and BATA Agreement between MTC and BAIFA to assign certain express lane
responsibilities from MTC to BAIFA, executed April 2013
Roles and Responsibilities: FHWA, Caltrans, BAIFA, STA, other agencies and special groups have been working together for the planning, design, construction, operation and maintenance of the MTC Express Lanes. Following are the roles and responsibilities of each agency as they relate to express lanes, consistent with MTC’s Concept of Operations. However an agreement will be developed between Caltrans and BAIFA to cover responsibilities, and it is in the process.
Agencies Key Roles and Responsibilities MTC Eligible to develop and operate 270 lane-miles of express
lanes Delegated express lane authority to BAIFA in April 2013 Required by State law to contract with BATA, CHP and Caltrans for certain services and pay for those services Manages federal, state and regional matching funds for HOV and express lanes Designs the backhaul communications network and contracts with a backhaul network contractor to operate and maintain it.
BATA Administers the bridge tolls on the San Francisco Bay Area's seven state-owned toll bridges Operates the Regional Customer Service Center which includes managing FasTrak® and tolls collection
BAIFA Joint exercise of powers agency formed by MTC and BATA to plan, develop, operate and finance transportation and related projects, including express lanes Assumed authority to develop and operate the 270-mile Bay Area express lanes Owns the toll collection system and contracts with a toll system integrator to design, implement, and maintain it. Oversees daily operations and toll system operators of the express lanes Establishes toll and operations policy Provides enforcement tools to the CHP
CALTRANS Maintains State Highway System Reviews and approves all design and operation plans,
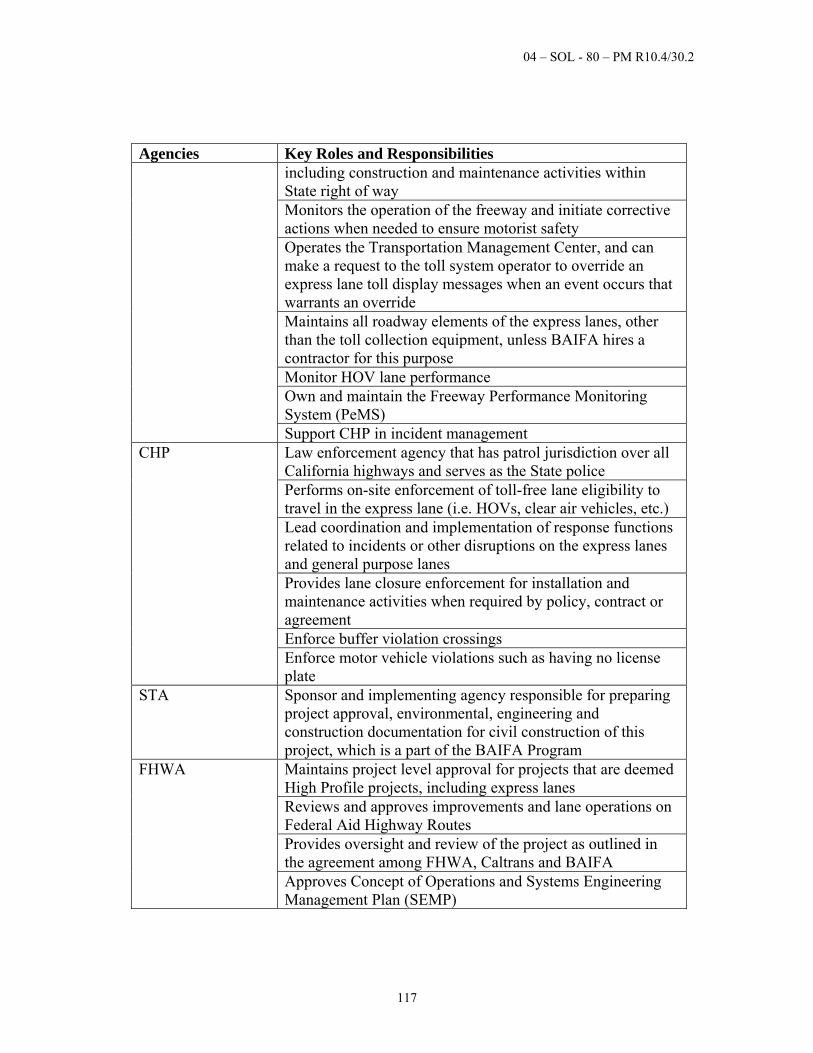
04 – SOL - 80 – PM R10.4/30.2
117
Agencies Key Roles and Responsibilities including construction and maintenance activities within State right of way Monitors the operation of the freeway and initiate corrective actions when needed to ensure motorist safety Operates the Transportation Management Center, and can make a request to the toll system operator to override an express lane toll display messages when an event occurs that warrants an override Maintains all roadway elements of the express lanes, other than the toll collection equipment, unless BAIFA hires a contractor for this purpose Monitor HOV lane performance Own and maintain the Freeway Performance Monitoring System (PeMS) Support CHP in incident management
CHP Law enforcement agency that has patrol jurisdiction over all California highways and serves as the State police Performs on-site enforcement of toll-free lane eligibility to travel in the express lane (i.e. HOVs, clear air vehicles, etc.) Lead coordination and implementation of response functions related to incidents or other disruptions on the express lanes and general purpose lanes Provides lane closure enforcement for installation and maintenance activities when required by policy, contract or agreement Enforce buffer violation crossings Enforce motor vehicle violations such as having no license plate
STA Sponsor and implementing agency responsible for preparing project approval, environmental, engineering and construction documentation for civil construction of this project, which is a part of the BAIFA Program
FHWA Maintains project level approval for projects that are deemed High Profile projects, including express lanes Reviews and approves improvements and lane operations on Federal Aid Highway Routes Provides oversight and review of the project as outlined in the agreement among FHWA, Caltrans and BAIFA Approves Concept of Operations and Systems Engineering Management Plan (SEMP)
04 – SOL - 80 – PM R10.4/30.2
118
7F. Report on Feasibility of Providing Access to Navigable Rivers There are no navigable rivers within the project limits; therefore, no report on feasibility of providing access to navigable rivers will be required.
7G. Public Boat Ramps Public boat ramps are not within the project limits.
7H. Transportation Management Plan for Use During Construction A Transportation Management Plan (TMP) will be prepared during the PS&E phase to address traffic impacts from staged construction, detours, and specific traffic handling concerns during the construction of the project. The attached TMP Data Sheets (Attachment L) outline costs for a public information program, changeable message signs, ground mounted signs, highway advisory radio, Construction Zone Enhanced Enforcement Program and freeway service patrol for any required lane closures during construction. The public information program will include preparation of press releases and other documents necessary to adequately inform the public of traffic delays associated with the project. Advance notification of construction activity will be given to local newspaper, television and radio stations, and emergency response providers. Weekly information updates will also be given by the Caltrans District 4 Public Information Office for use in Caltrans Weekly Traffic Updates. Traffic impact will be minimized by scheduling construction activities for the installation of the overhead signs and electronic tolling equipment in the median during non-peak commute periods, as well as during nighttime. Significant traffic delays, due to East Segment construction, are not anticipated because the majority of work will occur behind temporary railing. Some of the work on the ramps can be staged to maintain freeway access and minimize impacts to local traffic. In general, impacts to traffic on the mainline will be minimal; however, the resurfacing and restriping will result in temporary freeway night closures of multiple lanes.
7I. Stage Construction In order to minimize delays and congestion caused by construction, it is anticipated that the segments will be constructed in multiple stages and/or multiple work crews. The existing lanes on I-80 will be maintained in each direction except during critical short-term construction activities requiring temporary closure to perform construction
04 – SOL - 80 – PM R10.4/30.2
119
or for safety reasons. Generally, closures will be allowed only during periods of low traffic volume defined through traffic studies made during the design. Construction for the West Segment will take approximately 14 months to complete. The work to install the overhead signs and electronic tolling equipment in the median will be coordinated between the civil infrastructure components, including pavement, signs, striping, concrete barrier modifications, poles, overhead sign structures, communication and electric conduits, pull boxes, and concrete pads for toll equipment cabinets. At areas where the existing median is eight feet wide or less, it is anticipated that the work will be performed during nighttime with temporary freeway lanes and shoulder closures. Where there is substantial space in the median to install temporary railing, work can be performed behind the railing during the daytime and nighttime hours. The remaining activities, such as mainline restriping, work adjacent to the outside shoulders and modification of EB Travis Boulevard off-ramp will be completed after the median construction is completed. These activities will also require temporary freeway lane, shoulder or off-ramp closure. Construction for the East Segment will take approximately two years to complete. The segment will be constructed in one major stage with two phases. The first phase will include the median widening and other activities within the median such as installation of overhead signs and electronic tolling equipment. This work will be performed behind temporary railing. The second phase will include the areas of outside pavement widening and other activities to be performed adjacent to the outside shoulder. The work on the outside of I-80 will also be completed behind temporary railing. The proposed minor ramp work will be accomplished during the second phase of work. Retaining walls and structure modifications will be constructed with the associated widening work in each phase. It is expected that the majority of the work will be done during daytime hours. Some nighttime work may require temporary closures for tasks that could interfere with mainline traffic or create safety hazards such as the proposed pavement resurfacing and mainline restriping. Some temporary nighttime ramp closures may be necessary during paving and striping operations as well. As discussed in Section 7H, a Transportation Management Plan will be developed, in cooperation with the cities of Fairfield and Vacaville, to provide advance notice to motorists and transportation and emergency service providers of information on construction activities and durations, detours, and access issues during each stage of construction. Specific construction staging requirements will be defined during the PS&E phase and construction staging plan will be developed by the contractor.
04 – SOL - 80 – PM R10.4/30.2
120
7J. Accommodation of Oversize Loads The project will not restrict the movement of oversized loads through the area. The project does not place any new height limitations on loads moving in or out of the area. New nonstandard vertical clearances are not proposed within the West Segment. The existing nonstandard vertical clearance under Cherry Glen Road Overcrossing will be reduced to 16.0 feet (from 16.4 feet) due to the proposed East Segment improvements. Standard outside shoulder will be provided along the freeway where feasible.
7K. Graffiti Control Portions of this project are within the urbanized areas of Solano County, which are considered graffiti-prone. To deter and discourage graffiti, new freeway signs may be coated with anti-graffiti coating, retaining walls may be stained or colored and areas adjacent to retaining walls may be planted with vines. Concrete barrier should also be sand blasted to a medium finish to deter graffiti. Specific design features will be defined during the PS&E phase.
7L. Other Planned Projects The Project Report for the preferred alternative for the I-80/I-680/SR-12 Interchange Project (EA 04-0A5300) was approved in October 2012. The project will include numerous improvements to address existing and future traffic operations and congestion, including relocation of the Cordelia Westbound Truck Inspection Facility. Proposed improvements are intended to add freeway capacity, reduce cut through traffic on local roads, improve local access to and from the freeway, accommodate current and future truck volumes, improve safety, and increase the use of HOV and ridesharing. Attachment B includes an exhibit showing the seven construction packages. Package 1 is assumed to be completed prior to construction of this project. See Background and Existing Facility sections for additional information.
7M. Context Sensitive Solutions and Complete Streets The I-80 Express Lanes project improvement does not impact local streets and intersections within the project limits. During PS&E design phase, opportunities to implement context sensitive solutions will be evaluated to integrate community,
04 – SOL - 80 – PM R10.4/30.2
121
aesthetic and environmental values into the design in balance with safety, maintenance and funding feasibility goals. Some context sensitive solutions such as architectural treatment will be evaluated during the PS&E design phase. To reduce the visual impact of new retaining walls, aesthetic treatments consisting of color, texture and/or patterning will be applied. The aesthetic treatment will be context sensitive to the location and will be compatible with existing walls in the project area. The freeway does not function as a local street within the project limit; therefore, context sensitive solutions and complete streets design do not apply for this project (per Directive Policy-22).
7N. Materials Recommendation The East Segment of the project will require median widening and localized outside widening for the addition of the express lanes. Pavement section alternatives were determined from the TI- values and the soil R- value provided in the Preliminary Geotechnical Report. A Life-Cycle Cost Analysis was prepared and approved on 6/25/2014. Based on its results, the following pavement sections were selected as the preferred alternatives based on 20 year life cycle:
Median Widening (Lane 1): 0.10’ Hot Mixed Asphalt Open Graded (HMA-
O), 0.20’ Rubberized Hot Mixed Asphalt Gap Graded (RHMA-G), 0.40' Hot Mixed Asphalt (Type A), 0.65' Lean Concrete Base (LCB), and 1.40' Aggregate Subbase (AS) (Class 2)
Outside Widening (Lane 4 or 5): 0.10’ Hot Mixed Asphalt Open Graded (HMA-O), 0.20’ Rubberized Hot Mixed Asphalt Gap Graded (RHMA-G), 0.50' Hot Mixed Asphalt (Type A), 0.75' Lean Concrete Base (LCB), and 1.65' Aggregate Subbase (AS) (Class 2)
.Ramps: 0.10’ Hot Mixed Asphalt Open Graded (HMA-O), 0.20’ Rubberized Hot Mixed Asphalt Gap Graded (RHMA-G), 0.30' Hot Mixed Asphalt (Type A), 0. 50' Lean Concrete Base (LCB), and 1.05' Aggregate Subbase (AS) (Class 2)
The Pavement Selection Review Committee Checklist is included as Attachment E for reference.
04 – SOL - 80 – PM R10.4/30.2
122
8. FUNDING/PROGRAMMING The preliminary escalated project cost estimate is $166.6 million; see Attachment F for more details. This project is identified in Metropolitan Transportation Commission’s (MTC) Plan Bay Area 2040 as “I-80 Express Lanes – Fairfield & Vacaville Phase I & II” with RTP ID# 240581 and TIP ID# SOL 110001. This project is funded with Regional Measure 2 funds, Other Local Funds and Long Range Plan (LRP) funds under TIP Amendment 2015-00. It is anticipated that this project will be constructed in two phases, which are as follows: Phase 1: West Segment – HOV conversion from Red Top Road to Air Base
Parkway Phase 2: East Segment – Express lane widening from Air Base Parkway to I-505 The support cost ratio is 28%.
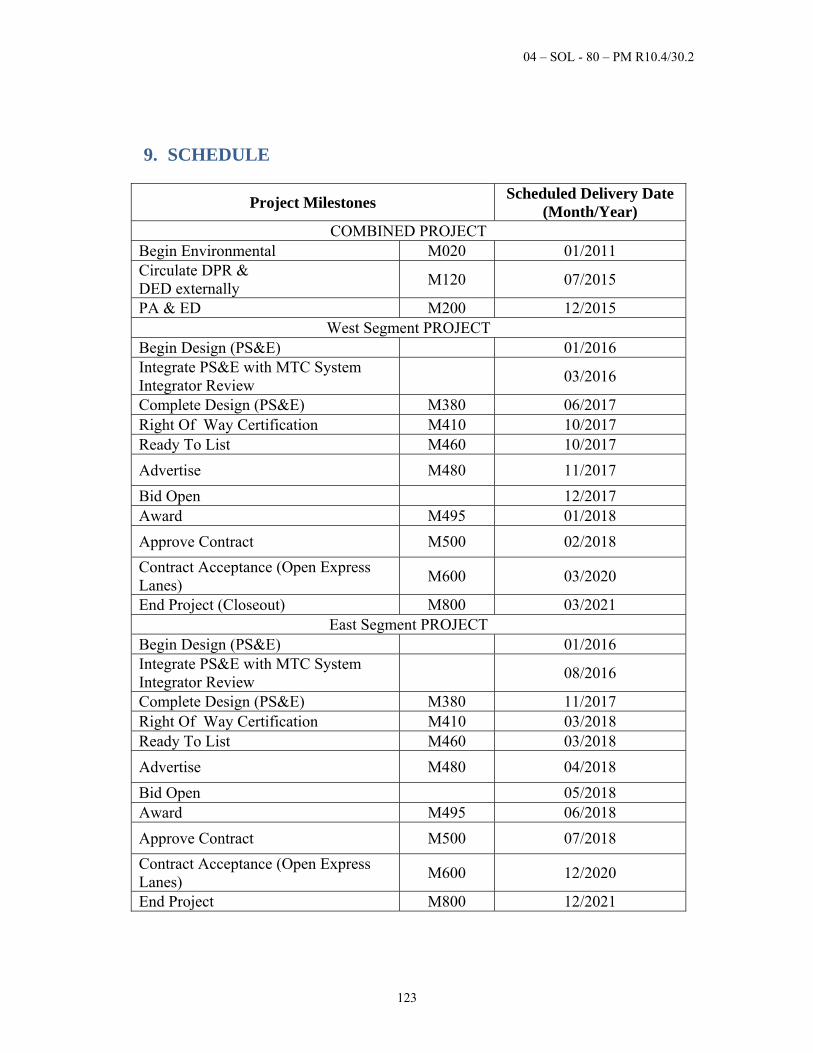
04 – SOL - 80 – PM R10.4/30.2
123
9. SCHEDULE
Project Milestones Scheduled Delivery Date
(Month/Year) COMBINED PROJECT
Begin Environmental M020 01/2011 Circulate DPR & DED externally
M120 07/2015
PA & ED M200 12/2015 West Segment PROJECT
Begin Design (PS&E) 01/2016 Integrate PS&E with MTC System Integrator Review
03/2016
Complete Design (PS&E) M380 06/2017 Right Of Way Certification M410 10/2017 Ready To List M460 10/2017
Advertise M480 11/2017
Bid Open 12/2017 Award M495 01/2018
Approve Contract M500 02/2018
Contract Acceptance (Open Express Lanes)
M600 03/2020
End Project (Closeout) M800 03/2021 East Segment PROJECT
Begin Design (PS&E) 01/2016 Integrate PS&E with MTC System Integrator Review
08/2016
Complete Design (PS&E) M380 11/2017 Right Of Way Certification M410 03/2018 Ready To List M460 03/2018
Advertise M480 04/2018
Bid Open 05/2018 Award M495 06/2018
Approve Contract M500 07/2018
Contract Acceptance (Open Express Lanes)
M600 12/2020
End Project M800 12/2021
04 – SOL - 80 – PM R10.4/30.2
124
10. RISKS A risk register has been prepared for the project to assist the project team in identifying, analyzing, and managing negative impacts on the schedule, cost, scope and quality of the project. The required Risk Register is attached as Attachment M for reference. As the project moves into design and construction phases, the identified risks include obtaining utility easements and the timely installation of utility services to avoid delays to the start of construction, and the coordination of the civil and toll system designs to mitigate construction costs and delay risks.

04 – SOL - 80 – PM R10.4/30.2
125
11. FHWA COORDINATION
There is no federal funding for the project. This project is assigned to Caltrans under the current Federal Highway Administration (FHWA) and Department of Transportation (Caltrans) Joint Stewardship and Oversight Agreement, dated May 28, 2015.
04 – SOL - 80 – PM R10.4/30.2
126
12. PROJECT REVIEWS Geometric Drawings Review: Larry Moore, Caltrans HQ Project Delivery Coordinator, has reviewed the West and East Segment Geometric Drawings and concurred with them. The noted mandatory design exceptions has been reviewed and approved by Larry Moore on June 30, 2015. The noted advisory design exceptions have been reviewed and approved by Ziad Abubekr, District Office Chief, North Counties on May 28, 2015. Constructability Review: Frank Guros of District 4 Constructability Review has reviewed the Draft Project Report on March 21, 2014 and has no comments. Further Constructability Reviews will be performed at the 65% and 95% of PS&E phase. Comments and recommendations from those reviews will be incorporated into the final PS&E. Traffic Operations Analysis Review: The Traffic Operations Analysis was reviewed by Evelyn Gestuvo with final comments provided on July 25, 2014, which were subsequently incorporated. Traffic Safety Analysis Review: Roland Au-Yeung, Traffic Safety approved the TSAR on November 16, 2014. Traffic Safety prepared a Collison Analysis on April 23, 2015 for the proposed nonstandard features, which was updated by Katie Yim on April 30, 2015. Program Advisory Review: Nicolas Endrawos, Caltrans Regional Project Manager reviewed the Draft Project Report and provide comments on March 26, 2015, which were subsequently incorporated. MTC Review: Numerous coordination meetings have occurred between MTC and STA to discuss the express lane facility design, operating concept, technical requirements, and enforcement and incident management to ensure that the project conforms to the guidelines set by MTC. MTC has reviewed the Draft Project Report on October 23, 2014and comments have been incorporated.
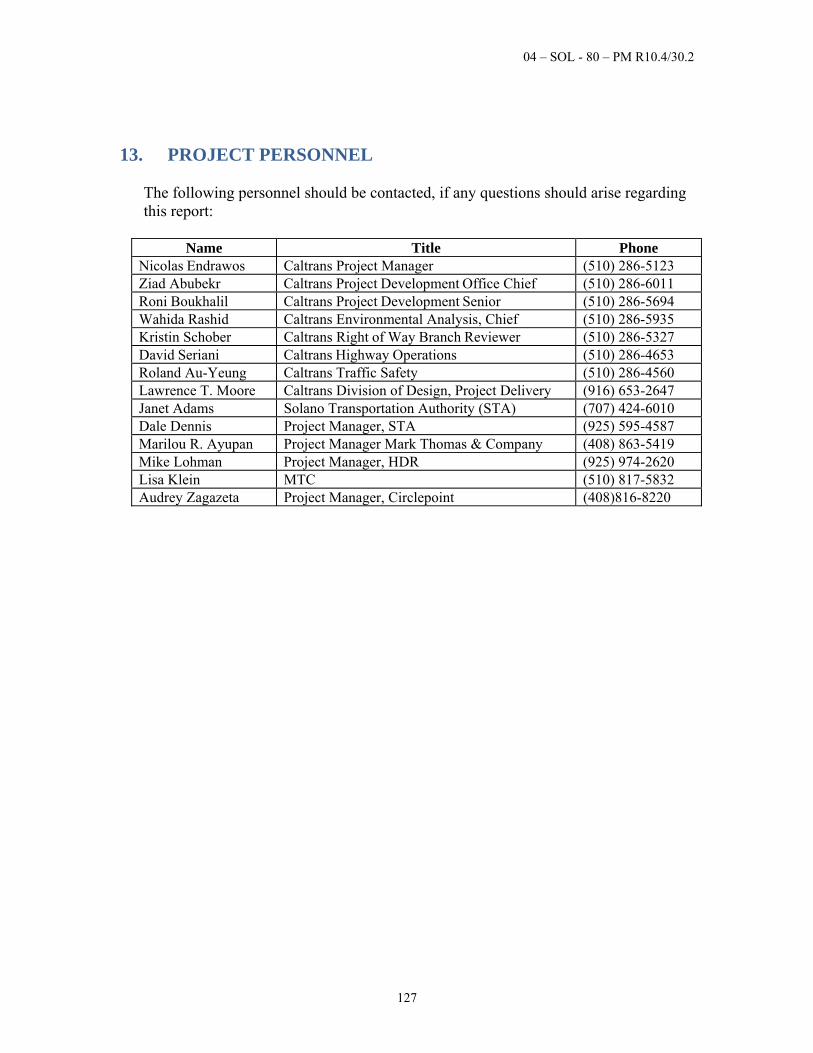
04 – SOL - 80 – PM R10.4/30.2
127
13. PROJECT PERSONNEL The following personnel should be contacted, if any questions should arise regarding this report:
Name Title Phone Nicolas Endrawos Caltrans Project Manager (510) 286-5123Ziad Abubekr Caltrans Project Development Office Chief (510) 286-6011 Roni Boukhalil Caltrans Project Development Senior (510) 286-5694 Wahida Rashid Caltrans Environmental Analysis, Chief (510) 286-5935 Kristin Schober Caltrans Right of Way Branch Reviewer (510) 286-5327 David Seriani Caltrans Highway Operations (510) 286-4653 Roland Au-Yeung Caltrans Traffic Safety (510) 286-4560 Lawrence T. Moore Caltrans Division of Design, Project Delivery (916) 653-2647 Janet Adams Solano Transportation Authority (STA) (707) 424-6010 Dale Dennis Project Manager, STA (925) 595-4587 Marilou R. Ayupan Project Manager Mark Thomas & Company (408) 863-5419 Mike Lohman Project Manager, HDR (925) 974-2620 Lisa Klein MTC (510) 817-5832 Audrey Zagazeta Project Manager, Circlepoint (408)816-8220
04 – SOL - 80 – PM R10.4/30.2
128
14. ATTACHMENTS A. Location Map
B. I-80/I-680/SR-12 Interchange Project (EA04-0A5300), Phase 1 Construction Packages (Alternative C- Preferred Alternative)
C. West Segment Plans – Title and Location Map, Typical Cross Sections, Key Map and Line Index, Layouts/Pavement Delineations, Construction Details and Sign Plans
D. East Segment Plans – Title and Location Map, Typical Cross Sections, Key Map and Line Index, Layouts, Profiles and Superelevation Diagrams, Pavement Delineation and Sign Plans, and Advance Planning Study Drawings
E. East Segment Pavement Selection Review Committee Checklist
F. Project Cost Estimate
F1 Project Cost Estimate Summary
F2 West Segment Project Cost Estimate
F3 East Segment Project Cost Estimate
G. Not Used
H. Right of Way Data Sheet
H1. West Segment Right of Way Data Sheet
H2. East Segment Right of Way Data Sheet
I. Final Environmental Document (Introductory and Approval pages)
J. Storm Water Data Report (Cover Page Only)
K. Executed PA&ED and PS&E Cooperative Agreement
L. Transportation Management Plan (TMP) Data Sheet
L1. West Segment TMP Data Sheet
L2. East Segment TMP Data Sheet
M. Risk Register