Embed Size (px)
Citation preview
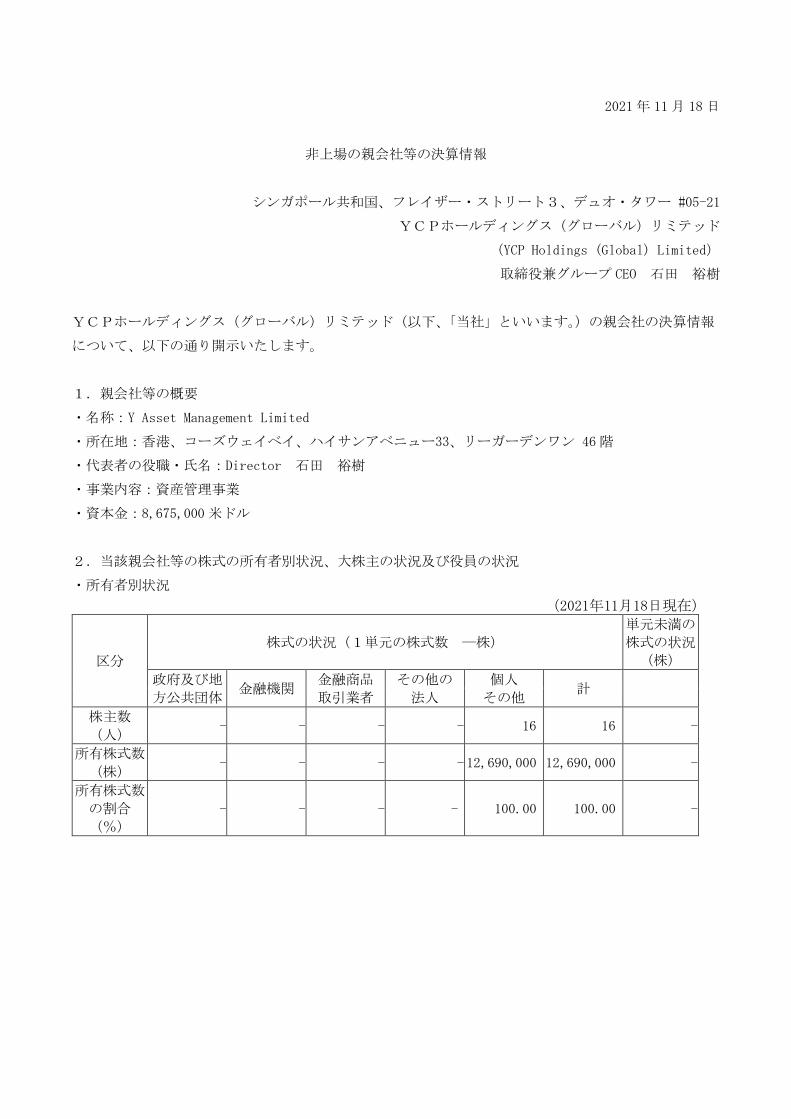
2021年 11月 18日
非上場の親会社等の決算情報
シンガポール共和国、フレイザー・ストリート3、デュオ・タワー #05-21
YCPホールディングス(グローバル)リミテッド
(YCP Holdings (Global) Limited)
取締役兼グループ CEO 石田 裕樹
YCPホールディングス(グローバル)リミテッド(以下、「当社」といいます。)の親会社の決算情報
について、以下の通り開示いたします。
1.親会社等の概要
・名称:Y Asset Management Limited
・所在地:香港、コーズウェイベイ、ハイサンアベニュー33、リーガーデンワン 46階
・代表者の役職・氏名:Director 石田 裕樹
・事業内容:資産管理事業
・資本金:8,675,000米ドル
2.当該親会社等の株式の所有者別状況、大株主の状況及び役員の状況
・所有者別状況
(2021年11月18日現在)
区分
株式の状況(1単元の株式数 ―株)
単元未満の
株式の状況
(株)
政府及び地
方公共団体 金融機関
金融商品
取引業者
その他の
法人
個人
その他 計
株主数
(人) - - - - 16 16 -
所有株式数
(株) - - - - 12,690,000 12,690,000 -
所有株式数
の割合
(%)
- - - - 100.00 100.00 -
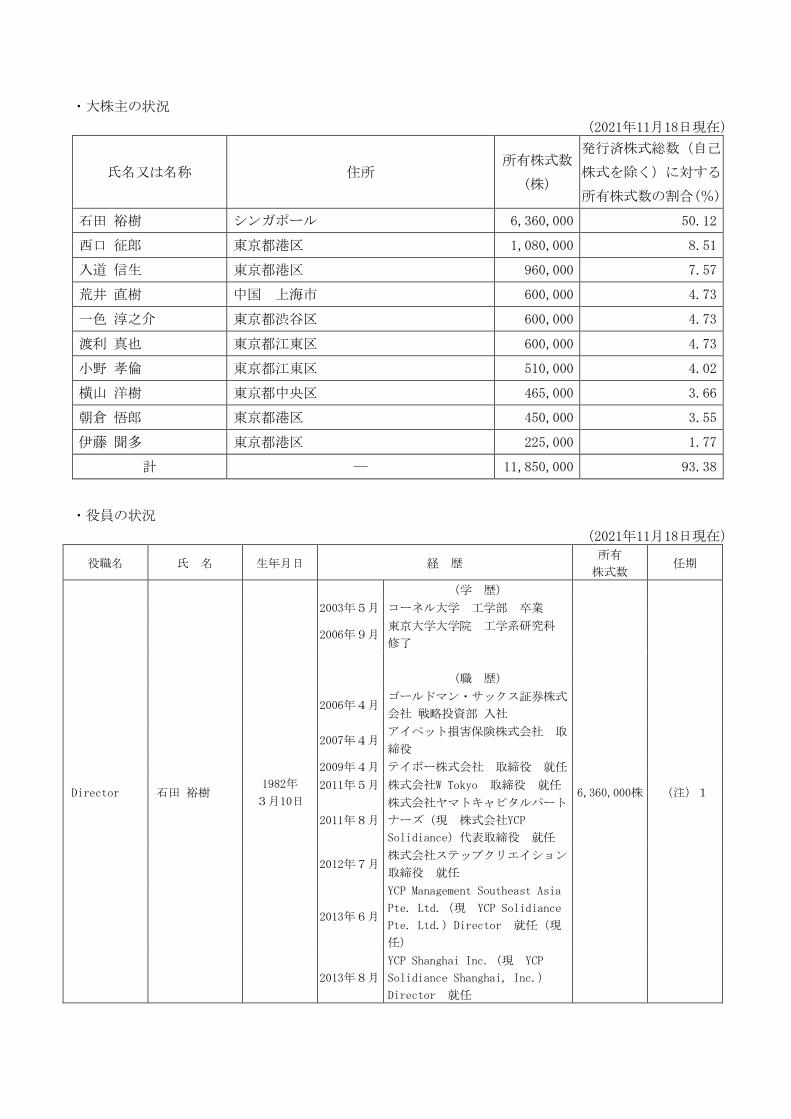
・大株主の状況
(2021年11月18日現在)
氏名又は名称 住所 所有株式数
(株)
発行済株式総数(自己
株式を除く)に対する
所有株式数の割合(%)
石田 裕樹 シンガポール 6,360,000 50.12
西口 征郎 東京都港区 1,080,000 8.51
入道 信生 東京都港区 960,000 7.57
荒井 直樹 中国 上海市 600,000 4.73
一色 淳之介 東京都渋谷区 600,000 4.73
渡利 真也 東京都江東区 600,000 4.73
小野 孝倫 東京都江東区 510,000 4.02
横山 洋樹 東京都中央区 465,000 3.66
朝倉 悟郎 東京都港区 450,000 3.55
伊藤 聞多 東京都港区 225,000 1.77
計 ― 11,850,000 93.38
・役員の状況
(2021年11月18日現在)
役職名 氏 名 生年月日 経 歴 所有
株式数 任期
Director 石田 裕樹 1982年
3月10日
(学 歴)
6,360,000株 (注)1
2003年5月 コーネル大学 工学部 卒業
2006年9月 東京大学大学院 工学系研究科
修了
(職 歴)
2006年4月 ゴールドマン・サックス証券株式
会社 戦略投資部 入社
2007年4月 アイペット損害保険株式会社 取
締役
2009年4月 テイボー株式会社 取締役 就任
2011年5月 株式会社W Tokyo 取締役 就任
2011年8月
株式会社ヤマトキャピタルパート
ナーズ(現 株式会社YCP
Solidiance)代表取締役 就任
2012年7月 株式会社ステップクリエイション
取締役 就任
2013年6月
YCP Management Southeast Asia
Pte. Ltd.(現 YCP Solidiance
Pte. Ltd.)Director 就任(現
任)
2013年8月
YCP Shanghai Inc.(現 YCP
Solidiance Shanghai, Inc.)
Director 就任
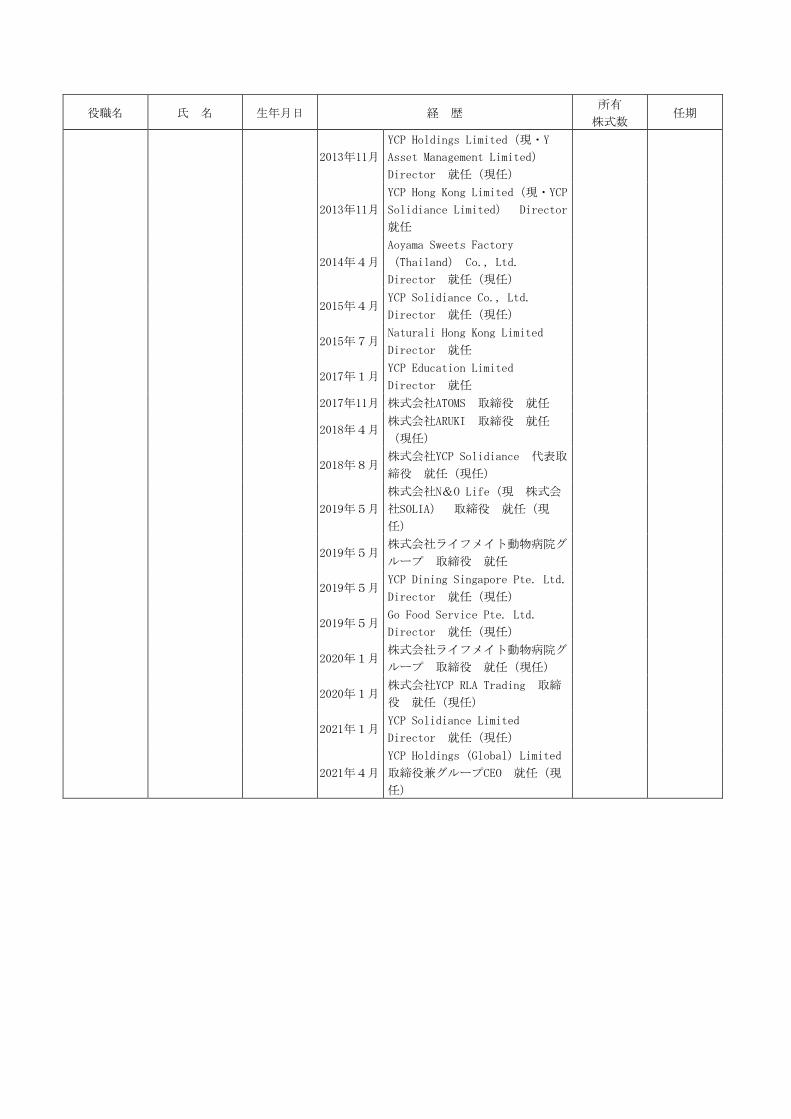
役職名 氏 名 生年月日 経 歴 所有
株式数 任期
2013年11月
YCP Holdings Limited(現・Y
Asset Management Limited)
Director 就任(現任)
2013年11月
YCP Hong Kong Limited(現・YCP
Solidiance Limited) Director
就任
2014年4月
Aoyama Sweets Factory
(Thailand) Co., Ltd.
Director 就任(現任)
2015年4月 YCP Solidiance Co., Ltd.
Director 就任(現任)
2015年7月 Naturali Hong Kong Limited
Director 就任
2017年1月 YCP Education Limited
Director 就任
2017年11月 株式会社ATOMS 取締役 就任
2018年4月 株式会社ARUKI 取締役 就任
(現任)
2018年8月 株式会社YCP Solidiance 代表取
締役 就任(現任)
2019年5月
株式会社N&O Life(現 株式会
社SOLIA) 取締役 就任(現
任)
2019年5月 株式会社ライフメイト動物病院グ
ループ 取締役 就任
2019年5月 YCP Dining Singapore Pte. Ltd.
Director 就任(現任)
2019年5月 Go Food Service Pte. Ltd.
Director 就任(現任)
2020年1月 株式会社ライフメイト動物病院グ
ループ 取締役 就任(現任)
2020年1月 株式会社YCP RLA Trading 取締
役 就任(現任)
2021年1月 YCP Solidiance Limited
Director 就任(現任)
2021年4月
YCP Holdings (Global) Limited
取締役兼グループCEO 就任(現
任)
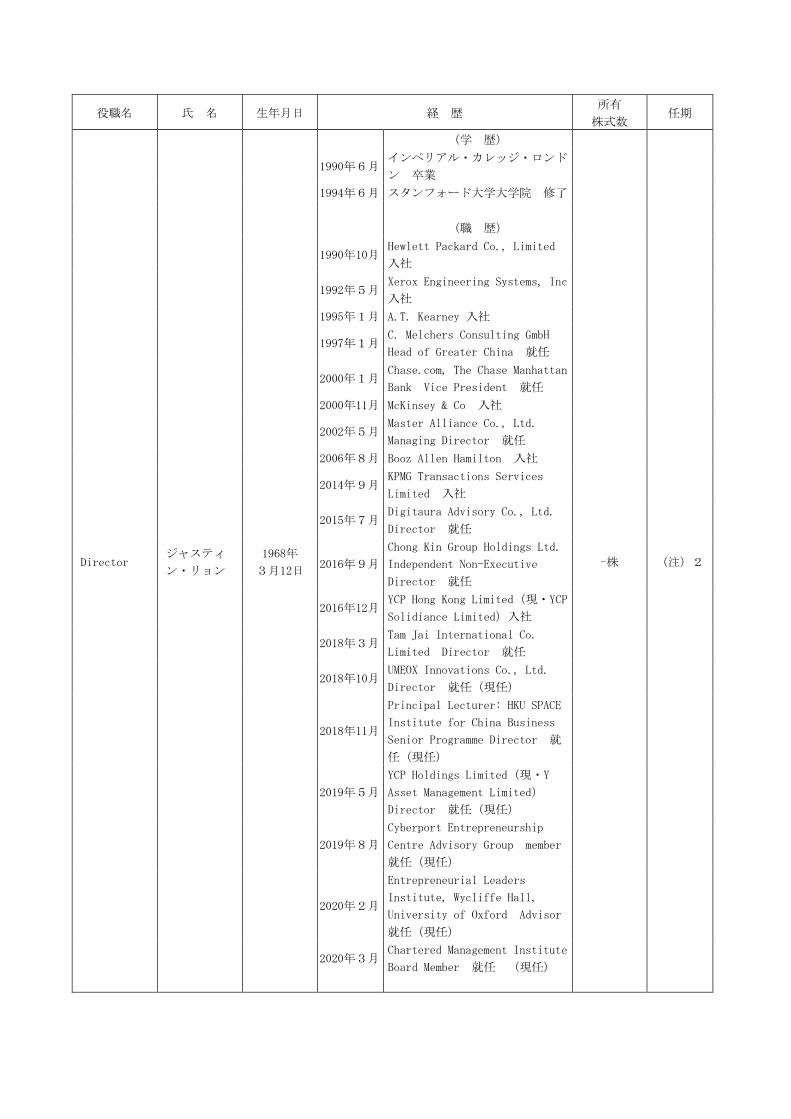
役職名 氏 名 生年月日 経 歴 所有
株式数 任期
Director ジャスティ
ン・リョン
1968年
3月12日
(学 歴)
-株 (注)2
1990年6月 インペリアル・カレッジ・ロンド
ン 卒業
1994年6月 スタンフォード大学大学院 修了
(職 歴)
1990年10月 Hewlett Packard Co., Limited
入社
1992年5月 Xerox Engineering Systems, Inc
入社
1995年1月 A.T. Kearney 入社
1997年1月 C. Melchers Consulting GmbH
Head of Greater China 就任
2000年1月 Chase.com, The Chase Manhattan
Bank Vice President 就任
2000年11月 McKinsey & Co 入社
2002年5月 Master Alliance Co., Ltd.
Managing Director 就任
2006年8月 Booz Allen Hamilton 入社
2014年9月 KPMG Transactions Services
Limited 入社
2015年7月 Digitaura Advisory Co., Ltd.
Director 就任
2016年9月
Chong Kin Group Holdings Ltd.
Independent Non-Executive
Director 就任
2016年12月 YCP Hong Kong Limited(現・YCP
Solidiance Limited)入社
2018年3月 Tam Jai International Co.
Limited Director 就任
2018年10月 UMEOX Innovations Co., Ltd.
Director 就任(現任)
2018年11月
Principal Lecturer: HKU SPACE
Institute for China Business
Senior Programme Director 就
任(現任)
2019年5月
YCP Holdings Limited(現・Y
Asset Management Limited)
Director 就任(現任)
2019年8月
Cyberport Entrepreneurship
Centre Advisory Group member
就任(現任)
2020年2月
Entrepreneurial Leaders
Institute, Wycliffe Hall,
University of Oxford Advisor
就任(現任)
2020年3月
Chartered Management Institute
Board Member 就任 (現任)
役職名 氏 名 生年月日 経 歴 所有
株式数 任期
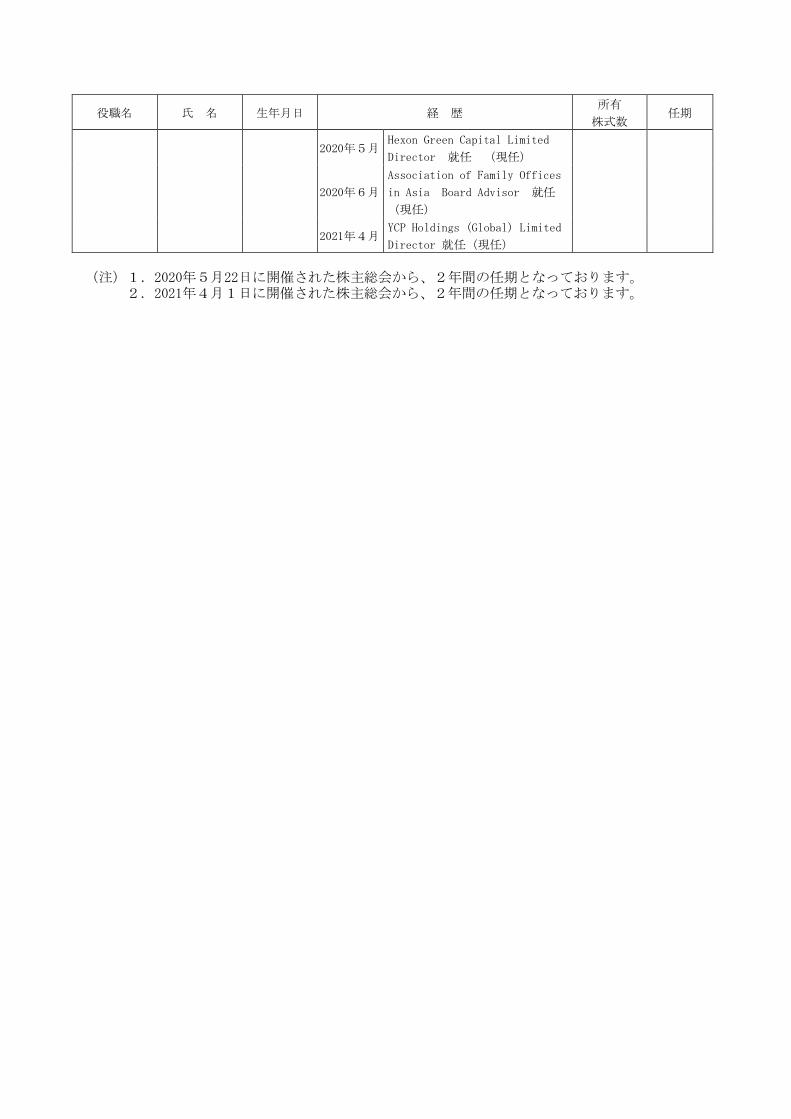
2020年5月 Hexon Green Capital Limited
Director 就任 (現任)
2020年6月
Association of Family Offices
in Asia Board Advisor 就任
(現任)
2021年4月 YCP Holdings (Global) Limited
Director 就任(現任)
(注)1.2020年5月22日に開催された株主総会から、2年間の任期となっております。
2.2021年4月1日に開催された株主総会から、2年間の任期となっております。
3.当該親会社等の財務諸表
連結財務諸表と合わせて、参考情報として和訳を記載しております。便宜上記載されている日本円への
換算は、別段の記載がある場合を除き、1ドル=113.68円(2021年 10月 29日現在の株式会社みずほ
銀行の対顧客電信直物売買相場の仲値)により計算されております。
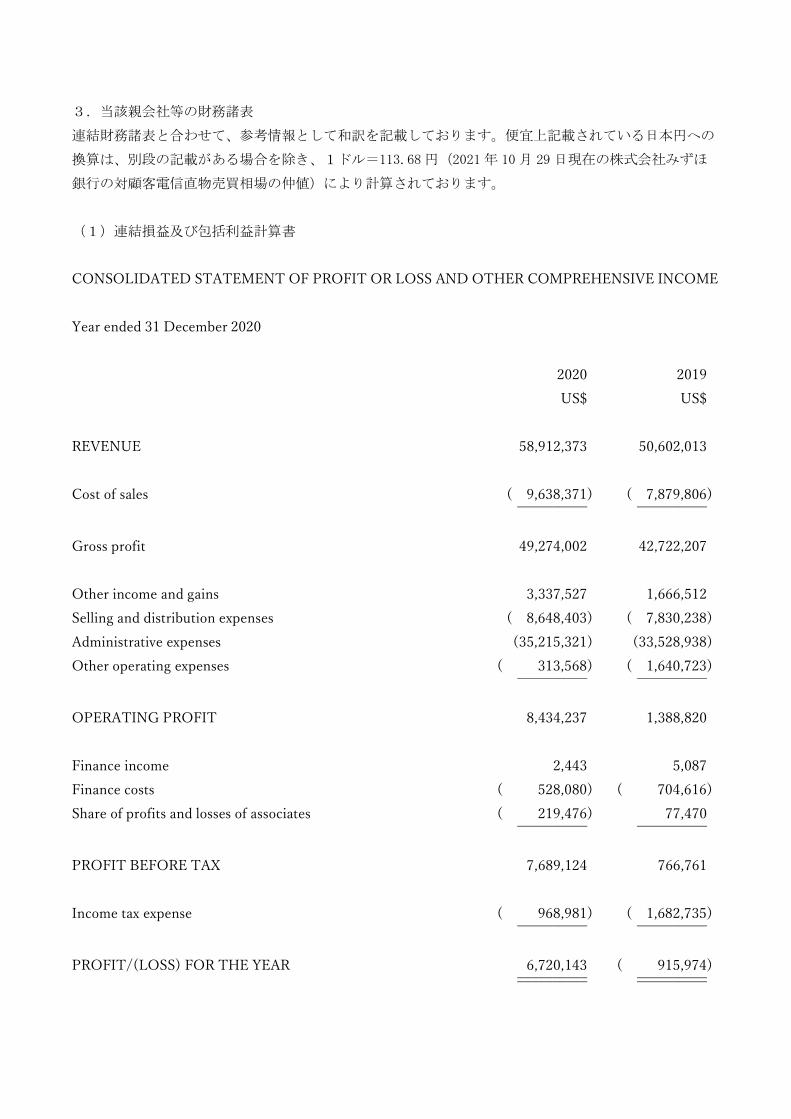
(1)連結損益及び包括利益計算書
CONSOLIDATED STATEMENT OF PROFIT OR LOSS AND OTHER COMPREHENSIVE INCOME
Year ended 31 December 2020
2020 2019
US$ US$
REVENUE 58,912,373 50,602,013
Cost of sales ( 9,638,371) ( 7,879,806) __________ __________
Gross profit 49,274,002 42,722,207
Other income and gains 3,337,527 1,666,512
Selling and distribution expenses ( 8,648,403) ( 7,830,238)
Administrative expenses (35,215,321) (33,528,938)
Other operating expenses ( 313,568) ( 1,640,723) __________ __________
OPERATING PROFIT 8,434,237 1,388,820
Finance income 2,443 5,087
Finance costs ( 528,080) ( 704,616)
Share of profits and losses of associates ( 219,476) 77,470 __________ __________
PROFIT BEFORE TAX 7,689,124 766,761
Income tax expense ( 968,981) ( 1,682,735) __________ __________
PROFIT/(LOSS) FOR THE YEAR 6,720,143 ( 915,974) __________ __________ __________ __________
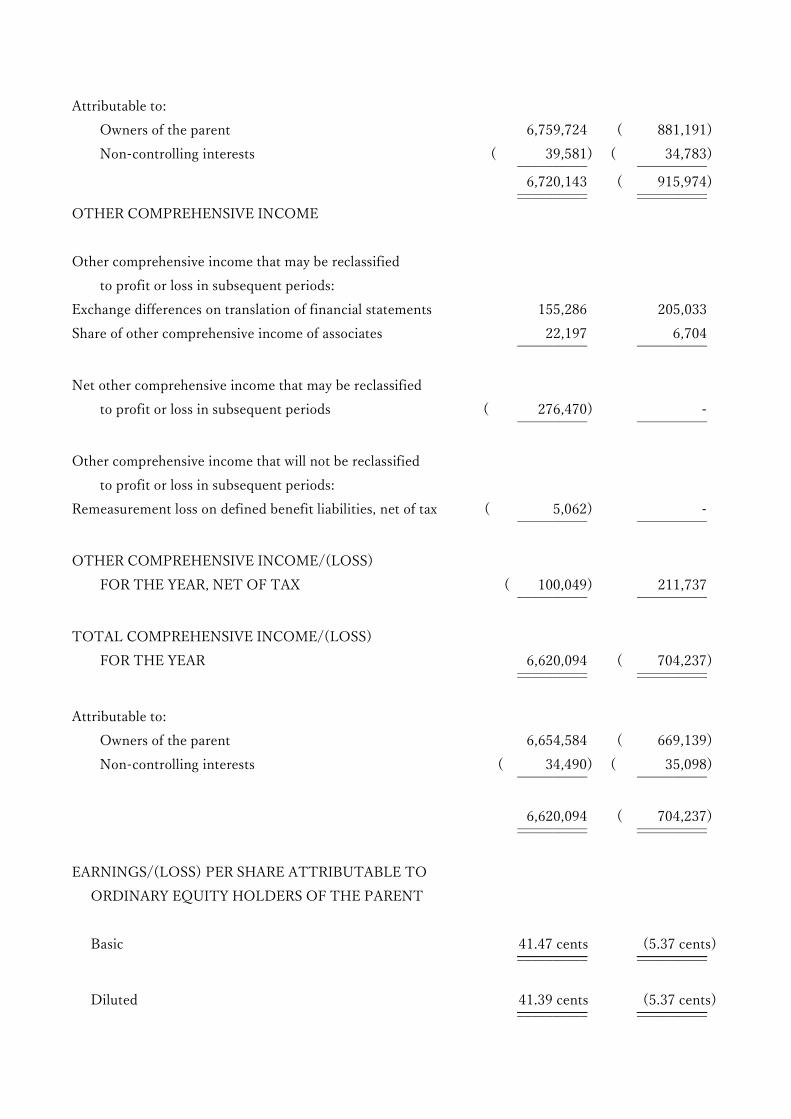
Attributable to:
Owners of the parent 6,759,724 ( 881,191)
Non-controlling interests ( 39,581) ( 34,783) __________ __________
6,720,143 ( 915,974) __________ __________ __________ __________
OTHER COMPREHENSIVE INCOME
Other comprehensive income that may be reclassified
to profit or loss in subsequent periods:
Exchange differences on translation of financial statements 155,286 205,033
Share of other comprehensive income of associates 22,197 6,704 __________ __________
Net other comprehensive income that may be reclassified
to profit or loss in subsequent periods ( 276,470) - __________ __________
Other comprehensive income that will not be reclassified
to profit or loss in subsequent periods:
Remeasurement loss on defined benefit liabilities, net of tax ( 5,062) - __________ __________
OTHER COMPREHENSIVE INCOME/(LOSS)
FOR THE YEAR, NET OF TAX ( 100,049) 211,737 __________ __________
TOTAL COMPREHENSIVE INCOME/(LOSS)
FOR THE YEAR 6,620,094 ( 704,237) __________ __________ __________ __________
Attributable to:
Owners of the parent 6,654,584 ( 669,139)
Non-controlling interests ( 34,490) ( 35,098) __________ __________
6,620,094 ( 704,237) __________ __________ __________ __________
EARNINGS/(LOSS) PER SHARE ATTRIBUTABLE TO
ORDINARY EQUITY HOLDERS OF THE PARENT
Basic 41.47 cents (5.37 cents) __________ __________ __________ __________
Diluted 41.39 cents (5.37 cents) __________ __________ __________ __________
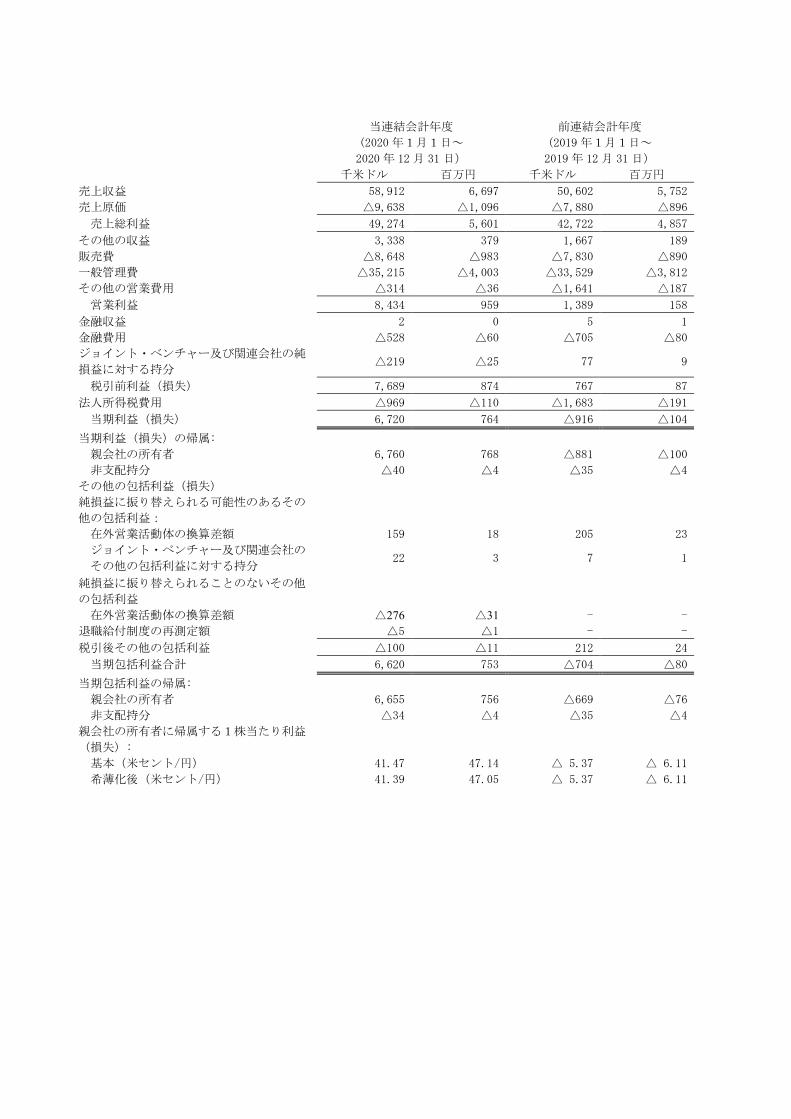
当連結会計年度
(2020 年1月1日~
2020 年 12 月 31 日)
前連結会計年度
(2019 年1月1日~
2019 年 12 月 31 日) 千米ドル 百万円 千米ドル 百万円
売上収益 58,912 6,697 50,602 5,752
売上原価 △9,638 △1,096 △7,880 △896
売上総利益 49,274 5,601 42,722 4,857
その他の収益 3,338 379 1,667 189
販売費 △8,648 △983 △7,830 △890
一般管理費 △35,215 △4,003 △33,529 △3,812
その他の営業費用 △314 △36 △1,641 △187
営業利益 8,434 959 1,389 158
金融収益 2 0 5 1
金融費用 △528 △60 △705 △80
ジョイント・ベンチャー及び関連会社の純
損益に対する持分 △219 △25 77 9
税引前利益(損失) 7,689 874 767 87
法人所得税費用 △969 △110 △1,683 △191
当期利益(損失) 6,720 764 △916 △104
当期利益(損失)の帰属:
親会社の所有者 6,760 768 △881 △100
非支配持分 △40 △4 △35 △4
その他の包括利益(損失)
純損益に振り替えられる可能性のあるその
他の包括利益:
在外営業活動体の換算差額 159 18 205 23
ジョイント・ベンチャー及び関連会社の
その他の包括利益に対する持分 22 3 7 1
純損益に振り替えられることのないその他
の包括利益
在外営業活動体の換算差額 △276 △31 - -
退職給付制度の再測定額 △5 △1 - -
税引後その他の包括利益 △100 △11 212 24
当期包括利益合計 6,620 753 △704 △80
当期包括利益の帰属:
親会社の所有者 6,655 756 △669 △76
非支配持分 △34 △4 △35 △4
親会社の所有者に帰属する1株当たり利益
(損失):
基本(米セント/円) 41.47 47.14 △ 5.37 △ 6.11
希薄化後(米セント/円) 41.39 47.05 △ 5.37 △ 6.11
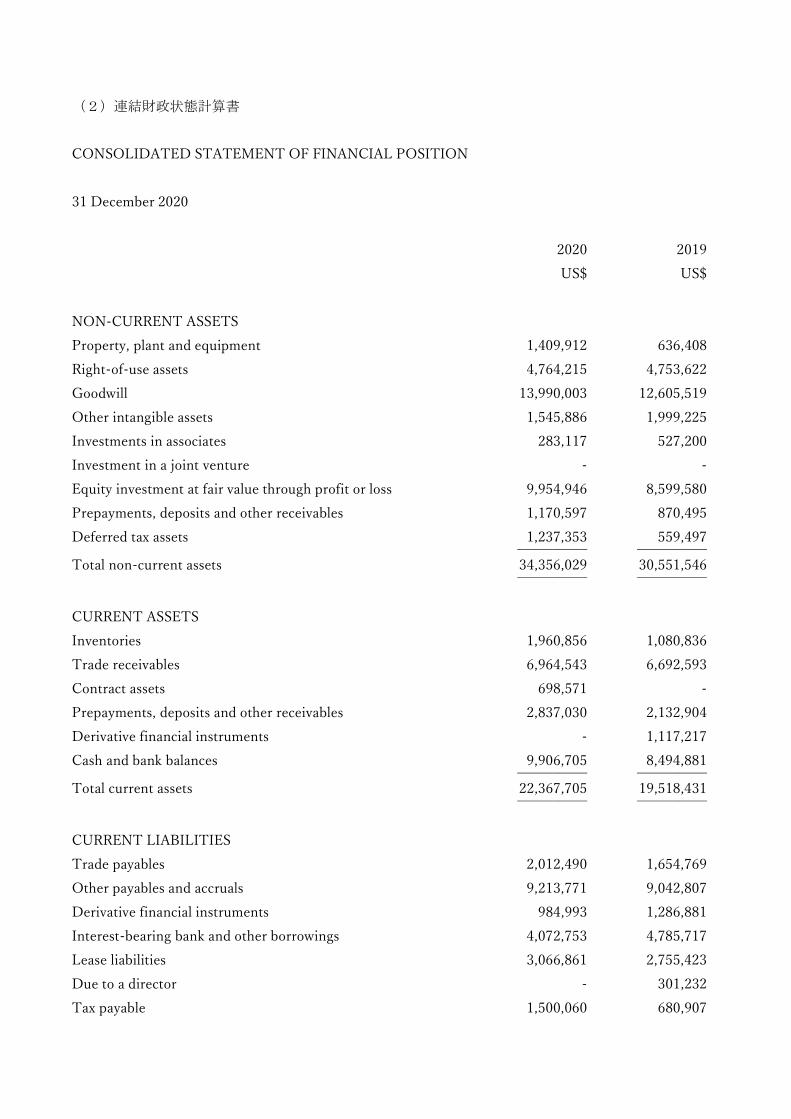
(2)連結財政状態計算書
CONSOLIDATED STATEMENT OF FINANCIAL POSITION
31 December 2020
2020 2019
US$ US$
NON-CURRENT ASSETS
Property, plant and equipment 1,409,912 636,408
Right-of-use assets 4,764,215 4,753,622
Goodwill 13,990,003 12,605,519
Other intangible assets 1,545,886 1,999,225
Investments in associates 283,117 527,200
Investment in a joint venture - -
Equity investment at fair value through profit or loss 9,954,946 8,599,580
Prepayments, deposits and other receivables 1,170,597 870,495
Deferred tax assets 1,237,353 559,497 __________ __________
Total non-current assets 34,356,029 30,551,546 __________ __________
CURRENT ASSETS
Inventories 1,960,856 1,080,836
Trade receivables 6,964,543 6,692,593
Contract assets 698,571 -
Prepayments, deposits and other receivables 2,837,030 2,132,904
Derivative financial instruments - 1,117,217
Cash and bank balances 9,906,705 8,494,881 __________ __________
Total current assets 22,367,705 19,518,431 __________ __________
CURRENT LIABILITIES
Trade payables 2,012,490 1,654,769
Other payables and accruals 9,213,771 9,042,807
Derivative financial instruments 984,993 1,286,881
Interest-bearing bank and other borrowings 4,072,753 4,785,717
Lease liabilities 3,066,861 2,755,423
Due to a director - 301,232
Tax payable 1,500,060 680,907
__________ _________
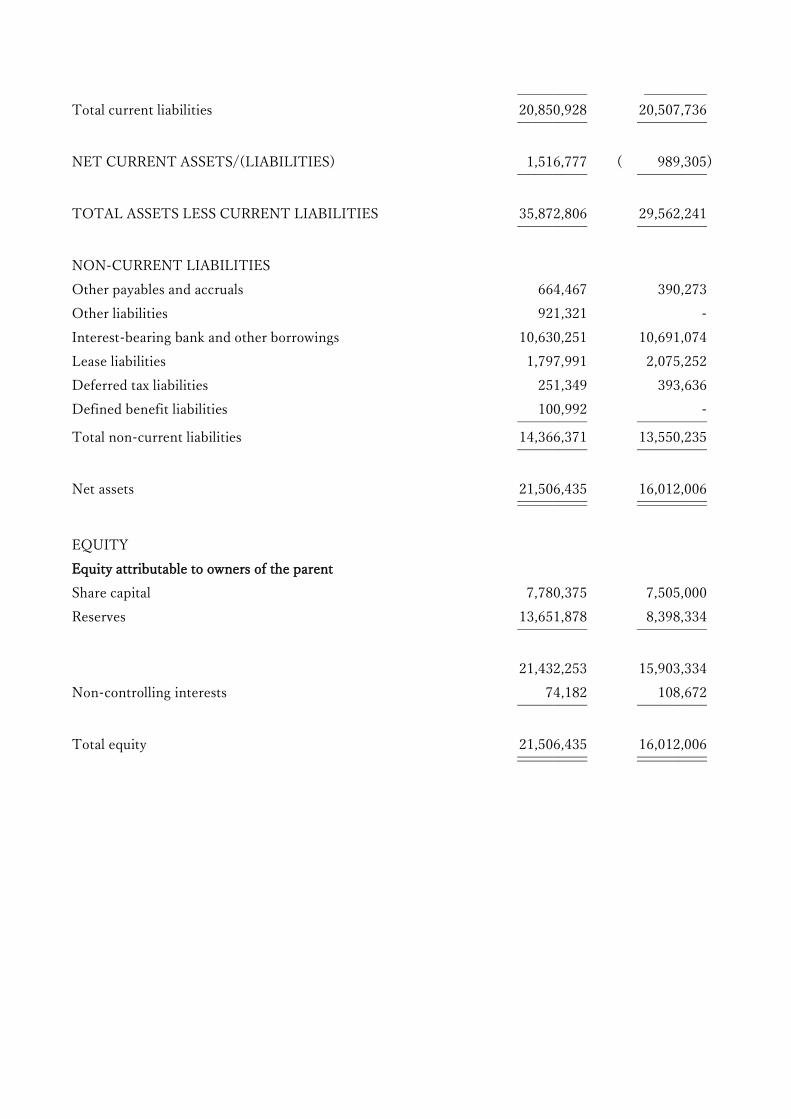
Total current liabilities 20,850,928 20,507,736 __________ __________
NET CURRENT ASSETS/(LIABILITIES) 1,516,777 ( 989,305) __________ __________
TOTAL ASSETS LESS CURRENT LIABILITIES 35,872,806 29,562,241 __________ __________
NON-CURRENT LIABILITIES
Other payables and accruals 664,467 390,273
Other liabilities 921,321 -
Interest-bearing bank and other borrowings 10,630,251 10,691,074
Lease liabilities 1,797,991 2,075,252
Deferred tax liabilities 251,349 393,636
Defined benefit liabilities 100,992 - __________ __________
Total non-current liabilities 14,366,371 13,550,235 __________ __________
Net assets 21,506,435 16,012,006 __________ __________ __________ __________
EQUITY
Equity attributable to owners of the parent
Share capital 7,780,375 7,505,000
Reserves 13,651,878 8,398,334 __________ __________
21,432,253 15,903,334
Non-controlling interests 74,182 108,672 __________ __________
Total equity 21,506,435 16,012,006 __________ __________ __________ __________
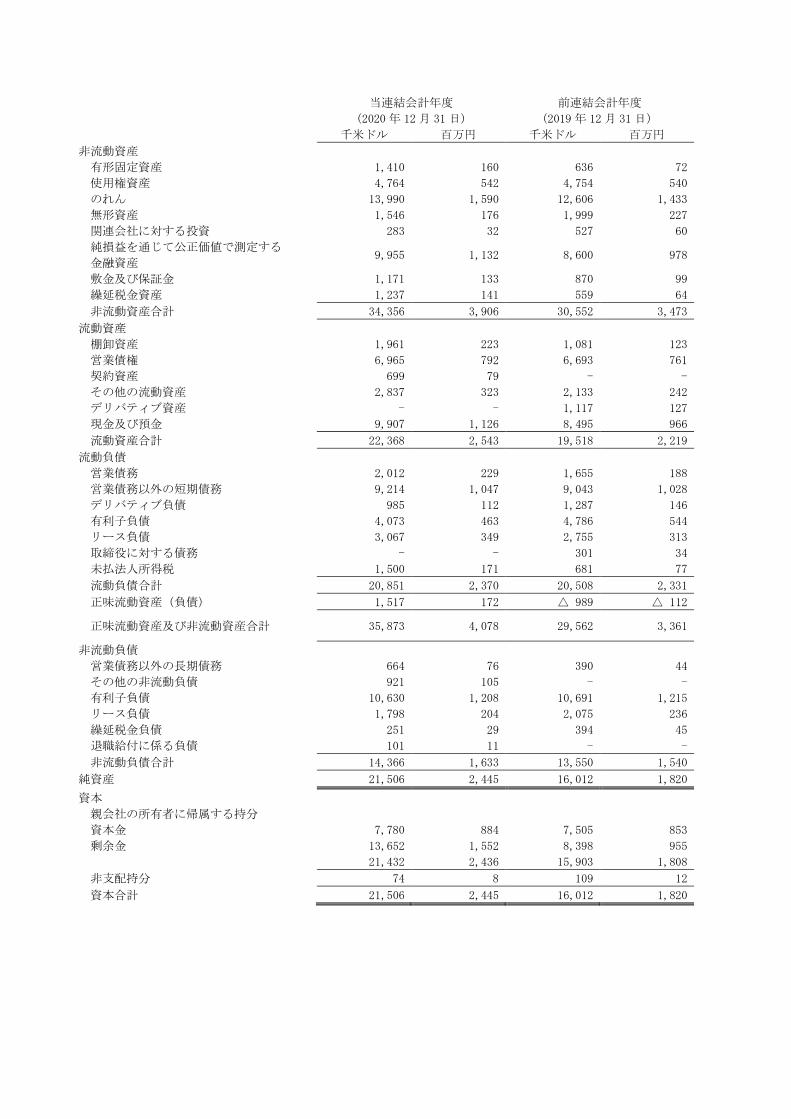
当連結会計年度
(2020 年 12 月 31 日)
前連結会計年度
(2019 年 12 月 31 日) 千米ドル 百万円 千米ドル 百万円
非流動資産
有形固定資産 1,410 160 636 72
使用権資産 4,764 542 4,754 540
のれん 13,990 1,590 12,606 1,433
無形資産 1,546 176 1,999 227
関連会社に対する投資 283 32 527 60
純損益を通じて公正価値で測定する
金融資産 9,955 1,132 8,600 978
敷金及び保証金 1,171 133 870 99
繰延税金資産 1,237 141 559 64
非流動資産合計 34,356 3,906 30,552 3,473
流動資産
棚卸資産 1,961 223 1,081 123
営業債権 6,965 792 6,693 761
契約資産 699 79 - -
その他の流動資産 2,837 323 2,133 242
デリバティブ資産 - - 1,117 127
現金及び預金 9,907 1,126 8,495 966
流動資産合計 22,368 2,543 19,518 2,219
流動負債
営業債務 2,012 229 1,655 188
営業債務以外の短期債務 9,214 1,047 9,043 1,028
デリバティブ負債 985 112 1,287 146
有利子負債 4,073 463 4,786 544
リース負債 3,067 349 2,755 313
取締役に対する債務 - - 301 34
未払法人所得税 1,500 171 681 77
流動負債合計 20,851 2,370 20,508 2,331
正味流動資産(負債) 1,517 172 △ 989 △ 112
正味流動資産及び非流動資産合計 35,873 4,078 29,562 3,361
非流動負債
営業債務以外の長期債務 664 76 390 44
その他の非流動負債 921 105 - -
有利子負債 10,630 1,208 10,691 1,215
リース負債 1,798 204 2,075 236
繰延税金負債 251 29 394 45
退職給付に係る負債 101 11 - -
非流動負債合計 14,366 1,633 13,550 1,540
純資産 21,506 2,445 16,012 1,820
資本
親会社の所有者に帰属する持分
資本金 7,780 884 7,505 853
剰余金 13,652 1,552 8,398 955 21,432 2,436 15,903 1,808
非支配持分 74 8 109 12
資本合計 21,506 2,445 16,012 1,820
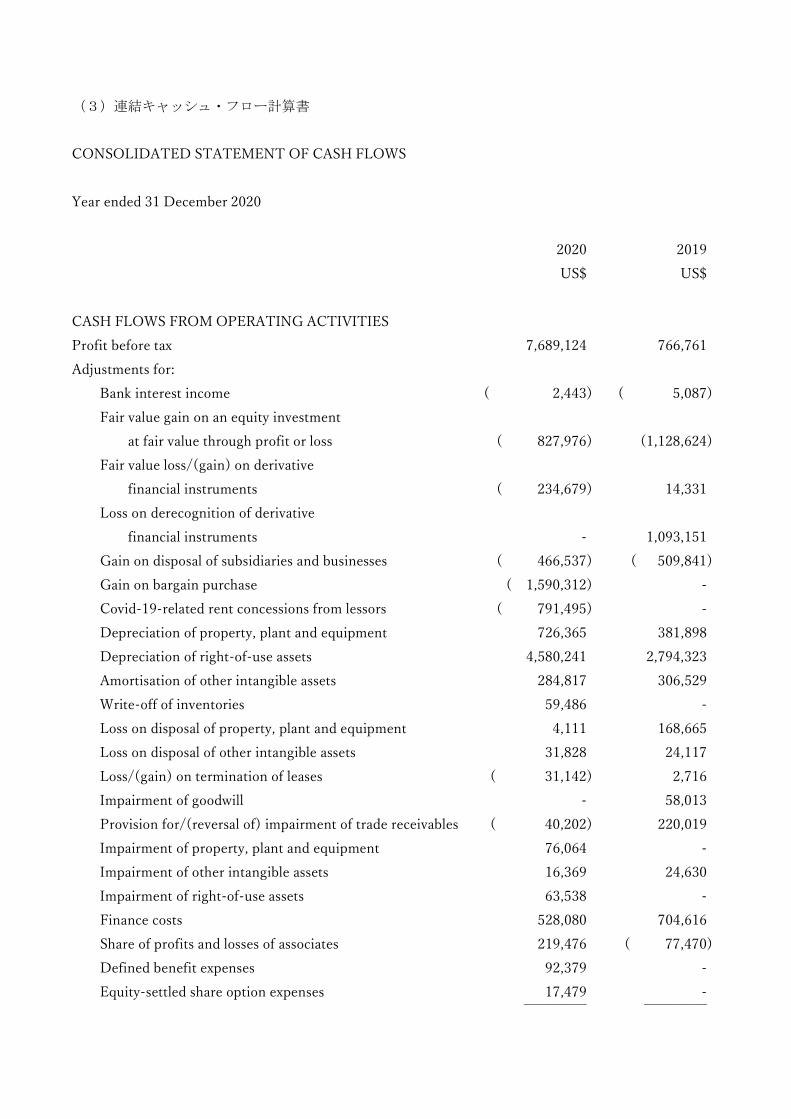
(3)連結キャッシュ・フロー計算書
CONSOLIDATED STATEMENT OF CASH FLOWS
Year ended 31 December 2020
2020 2019
US$ US$
CASH FLOWS FROM OPERATING ACTIVITIES
Profit before tax 7,689,124 766,761
Adjustments for:
Bank interest income ( 2,443) ( 5,087)
Fair value gain on an equity investment
at fair value through profit or loss ( 827,976) (1,128,624)
Fair value loss/(gain) on derivative
financial instruments ( 234,679) 14,331
Loss on derecognition of derivative
financial instruments - 1,093,151
Gain on disposal of subsidiaries and businesses ( 466,537) ( 509,841)
Gain on bargain purchase ( 1,590,312) -
Covid-19-related rent concessions from lessors ( 791,495) -
Depreciation of property, plant and equipment 726,365 381,898
Depreciation of right-of-use assets 4,580,241 2,794,323
Amortisation of other intangible assets 284,817 306,529
Write-off of inventories 59,486 -
Loss on disposal of property, plant and equipment 4,111 168,665
Loss on disposal of other intangible assets 31,828 24,117
Loss/(gain) on termination of leases ( 31,142) 2,716
Impairment of goodwill - 58,013
Provision for/(reversal of) impairment of trade receivables ( 40,202) 220,019
Impairment of property, plant and equipment 76,064 -
Impairment of other intangible assets 16,369 24,630
Impairment of right-of-use assets 63,538 -
Finance costs 528,080 704,616
Share of profits and losses of associates 219,476 ( 77,470)
Defined benefit expenses 92,379 -
Equity-settled share option expenses 17,479 - _________ _________

10,404,571 4,838,747
Decrease/(increase) in prepayments, deposits
and other receivables 19,800 ( 433,715)
Decrease/(increase) in inventories ( 790,024) 242,087
Decrease/(increase) in trade receivables 131,816 (1,870,050)
Increase/(decrease) in trade payables ( 46,949) 433,263
Increase/(decrease) in other payables and accruals ( 455,338) 2,225,152
Increase/(decrease) in an amount due to a director ( 301,232) 301,232 _________ _________
Cash generated from operations 8,962,644 5,736,716
Hong Kong profits tax paid ( 36,515) -
Overseas taxes paid ( 913,517) (2,158,321) _________ _________
Net cash flows from operating activities 8,012,612 3,578,395 _________ _________
CASH FLOWS FROM INVESTING ACTIVITIES
Interest received 2,443 5,087
Dividend received from an associate 46,804 91,695
Purchases of property, plant and equipment ( 566,505) ( 274,222)
Purchases of other intangible assets ( 60,493) ( 184,647)
Acquisitions of subsidiaries and a business (2,056,897) ( 110,990)
Proceed from disposal of other intangible assets - 29,487
Proceed from disposal of subsidiaries and businesses 601,411 247,596 _________ _________
Net cash flows used in investing activities (2,033,237) ( 195,994) _________ _________
CASH FLOWS FROM FINANCING ACTIVITIES
Contribution from non-controlling shareholders - 143,770
Proceeds from issue of shares 1,170,000 -
Acquisition of a non-controlling interest - ( 33,500)
New interest-bearing bank and other borrowings 2,936,156 8,147,317
Repayment of interest-bearing bank and other borrowings (4,388,736) (7,398,010)
Principal portion of lease payments (3,796,142) (2,795,276)
Interest on lease liabilities ( 147,840) ( 113,785)
Repurchase of shares ( 344,305) -
Interest paid ( 369,026) ( 590,831) _________ _________

Net cash flows used in financing activities (4,939,893) (2,640,315) _________ _________
NET INCREASE IN CASH AND CASH EQUIVALENTS 1,039,482 742,086
Cash and cash equivalents at beginning of year 8,293,162 7,453,208
Effect of foreign exchange rate changes, net 489,146 97,868 _________ _________
CASH AND CASH EQUIVALENTS AT END OF YEAR 9,821,790 8,293,162 _________ _________ _________ _________
ANALYSIS OF BALANCES OF CASH AND CASH
EQUIVALENTS
Cash and bank balances 9,906,705 8,494,881
Bank overdrafts ( 84,915) ( 201,719) _________ _________
Cash and cash equivalents as stated in the
consolidated statement of cash flows 9,821,790 8,293,162 __________ _________ __________ _________
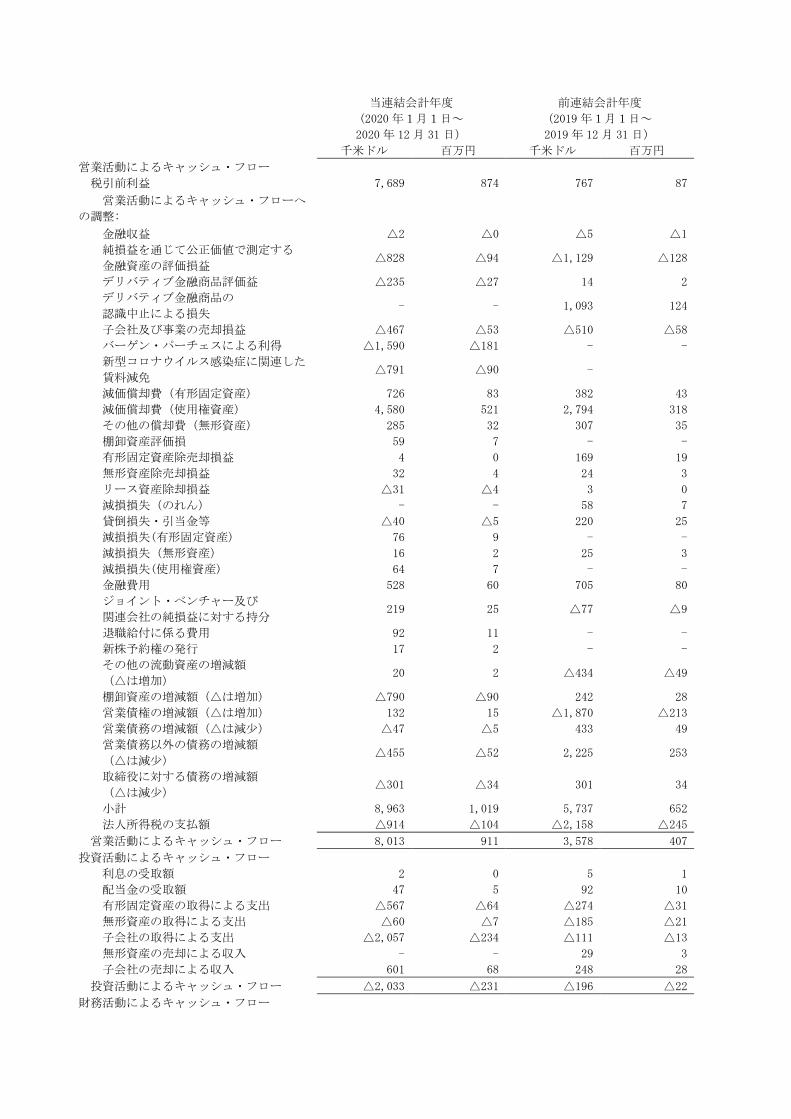
当連結会計年度
(2020 年1月1日~
2020 年 12 月 31 日)
前連結会計年度
(2019 年1月1日~
2019 年 12 月 31 日) 千米ドル 百万円 千米ドル 百万円
営業活動によるキャッシュ・フロー
税引前利益 7,689 874 767 87
営業活動によるキャッシュ・フローへ
の調整:
金融収益 △2 △0 △5 △1
純損益を通じて公正価値で測定する
金融資産の評価損益 △828 △94 △1,129 △128
デリバティブ金融商品評価益 △235 △27 14 2
デリバティブ金融商品の
認識中止による損失 - - 1,093 124
子会社及び事業の売却損益 △467 △53 △510 △58
バーゲン・パーチェスによる利得 △1,590 △181 - -
新型コロナウイルス感染症に関連した
賃料減免 △791 △90 -
減価償却費(有形固定資産) 726 83 382 43
減価償却費(使用権資産) 4,580 521 2,794 318
その他の償却費(無形資産) 285 32 307 35
棚卸資産評価損 59 7 - -
有形固定資産除売却損益 4 0 169 19
無形資産除売却損益 32 4 24 3
リース資産除却損益 △31 △4 3 0
減損損失(のれん) - - 58 7
貸倒損失・引当金等 △40 △5 220 25
減損損失(有形固定資産) 76 9 - -
減損損失(無形資産) 16 2 25 3
減損損失(使用権資産) 64 7 - -
金融費用 528 60 705 80
ジョイント・ベンチャー及び
関連会社の純損益に対する持分 219 25 △77 △9
退職給付に係る費用 92 11 - -
新株予約権の発行 17 2 - -
その他の流動資産の増減額
(△は増加) 20 2 △434 △49
棚卸資産の増減額(△は増加) △790 △90 242 28
営業債権の増減額(△は増加) 132 15 △1,870 △213
営業債務の増減額(△は減少) △47 △5 433 49
営業債務以外の債務の増減額
(△は減少) △455 △52 2,225 253
取締役に対する債務の増減額
(△は減少) △301 △34 301 34
小計 8,963 1,019 5,737 652
法人所得税の支払額 △914 △104 △2,158 △245
営業活動によるキャッシュ・フロー 8,013 911 3,578 407
投資活動によるキャッシュ・フロー
利息の受取額 2 0 5 1
配当金の受取額 47 5 92 10
有形固定資産の取得による支出 △567 △64 △274 △31
無形資産の取得による支出 △60 △7 △185 △21
子会社の取得による支出 △2,057 △234 △111 △13
無形資産の売却による収入 - - 29 3
子会社の売却による収入 601 68 248 28
投資活動によるキャッシュ・フロー △2,033 △231 △196 △22
財務活動によるキャッシュ・フロー

非支配持分からの払込による収入 - - 144 16
株式の発行による収入 1,170 133 - -
非支配持分にからの
子株式持分取得による支出 - - △34 △4
借入による収入 2,936 334 8,147 926
借入金の返済による支出 △4,389 △499 △7,398 △841
リース負債の返済による支出 △3,796 △432 △2,795 △318
支払利息(リース負債) △148 △17 △114 △13
自己株式の取得による支出 △344 △39 - -
利息の支払額 △369 △42 △591 △67
財務活動によるキャッシュ・フロー △4,940 △562 △2,640 △300
現金及び現金同等物の増減額(△は減少) 1,039 118 742 84
現金及び現金同等物の期首残高 8,293 943 7,453 847
現金及び現金同等物の為替変動による影響 489 56 98 11
現金及び現金同等物の期末残高 9,822 1,117 8,293 943
現金及び現金同等物の内訳:
現金及び預金 9,907 1,126 8,495 966
当座貸越 △85 △10 △202 △23
現金及び現金同等物の期末残高 9,822 1,117 8,293 943
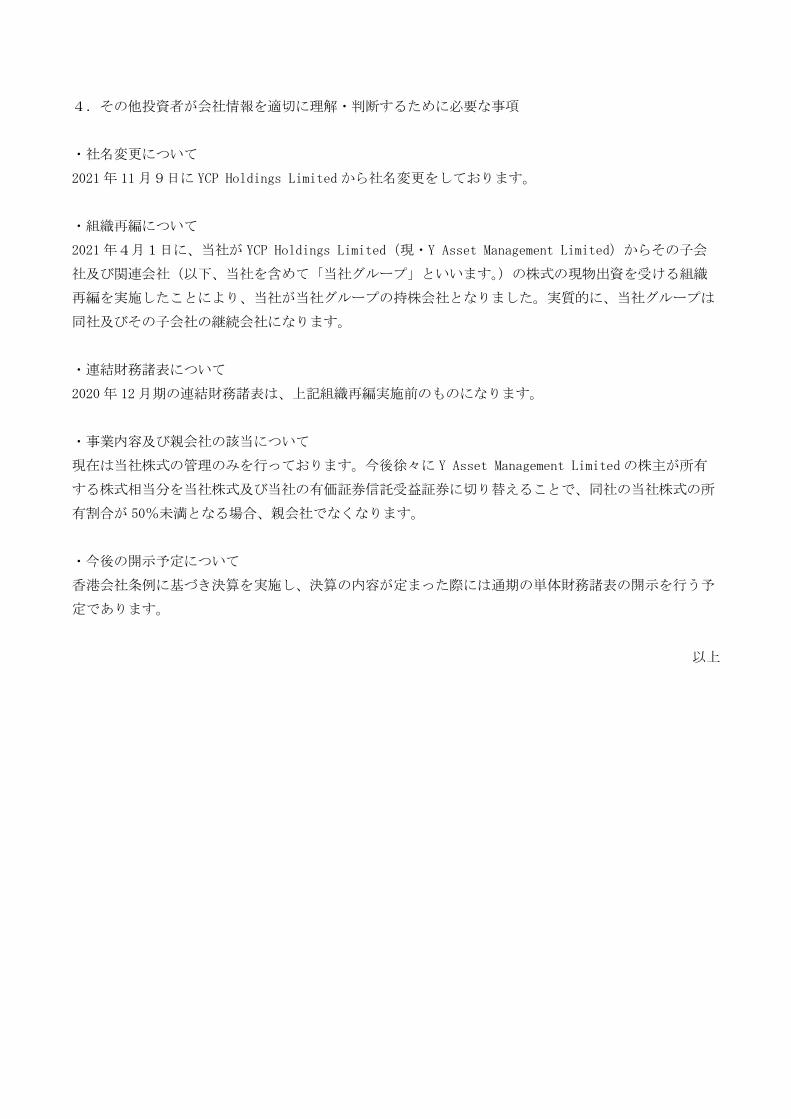
4.その他投資者が会社情報を適切に理解・判断するために必要な事項
・社名変更について
2021年 11月9日に YCP Holdings Limitedから社名変更をしております。
・組織再編について
2021年4月1日に、当社が YCP Holdings Limited(現・Y Asset Management Limited)からその子会
社及び関連会社(以下、当社を含めて「当社グループ」といいます。)の株式の現物出資を受ける組織
再編を実施したことにより、当社が当社グループの持株会社となりました。実質的に、当社グループは
同社及びその子会社の継続会社になります。
・連結財務諸表について
2020年 12月期の連結財務諸表は、上記組織再編実施前のものになります。
・事業内容及び親会社の該当について
現在は当社株式の管理のみを行っております。今後徐々に Y Asset Management Limitedの株主が所有
する株式相当分を当社株式及び当社の有価証券信託受益証券に切り替えることで、同社の当社株式の所
有割合が 50%未満となる場合、親会社でなくなります。
・今後の開示予定について
香港会社条例に基づき決算を実施し、決算の内容が定まった際には通期の単体財務諸表の開示を行う予
定であります。
以上