Embed Size (px)
Citation preview
8/8/2019 06 Ashish Arya PGDM Marketing 8
http://slidepdf.com/reader/full/06-ashish-arya-pgdm-marketing-8 1/7
Reducing Gaps in ForecastingReducing Gaps in Forecasting
OBJECTIVE: To increase the efficacy of business
decisions based on Market Forecast Data by reducing
the gaps in forecasting
By:Ashish Arya
Roll No-6
PGDM Marketing
8/8/2019 06 Ashish Arya PGDM Marketing 8
http://slidepdf.com/reader/full/06-ashish-arya-pgdm-marketing-8 2/7
OverviewOverviewy Cisco has highly variable demand and a complex mix of short (for
example, Internet Protocol [IP] telephony) and long (for example,data center infrastructure) product life cycles. Therefore, Cisco'smanagement could not rely only on the forecasting models intraditional demand-planning applications.
y Cisco employs a variety of forecasting models to improve forecastaccuracy, including some that are Cisco-specific.
y At the end of the cycle, the demand-planning team comparesforecasts and the output of the entire process with actual results,feeds that information back into the process, and uses it to assesseveryone's performance.
y The consensus forecasting process, coupled with advancedanalytics, improved Cisco's forecast accuracy, reduced forecast bias,improved supply/demand balancing, increased inventory turns,
reduced excess and obsolete stock, and enabled Cisco to plandemand flexibly ³ in response to market run-ups as well asdownturns.
y From 2001 to 2008, Cisco's forecast accuracy increased by 20% to30%, and forecast bias fell by 60% to 80%.
8/8/2019 06 Ashish Arya PGDM Marketing 8
http://slidepdf.com/reader/full/06-ashish-arya-pgdm-marketing-8 3/7
The ChallengeThe Challengey Cisco outsources 95% of its manufacturing and has over 1,000 suppliers.
y Historically, Cisco based its forecasting on sales and marketing projections
y Cisco's business expanded and the complexity and mix of products increased, this
approach to demand forecasting did not suffice for supply chain execution
y In addition, improved efforts in implementing lean processes across the supply chain
reduced inventory buffers, typically used to hedge against forecast errors. Lean
processes also meant that Cisco's contract manufacturers increasingly relied on
Cisco's ability to communicate demand effectively and accurately.
Solution ApproachSolution Approach Environment had highly variable demand and with short product life cycles. Cisco
concluded that those types of forecasting systems better suited more predictable demand
patterns and longer product life cycles
In early 2006, Cisco's management created a statistical forecasting team. Over the
subsequent 12 months, the team grew to six forecast practitioners, most with advanced
degrees whose academic backgrounds included operations research, engineering and
decision science.Team members also needed strong communication skills.
Through a series of prototypes, the team developed a statistical forecasting capability
that would support the requirements
8/8/2019 06 Ashish Arya PGDM Marketing 8
http://slidepdf.com/reader/full/06-ashish-arya-pgdm-marketing-8 4/7
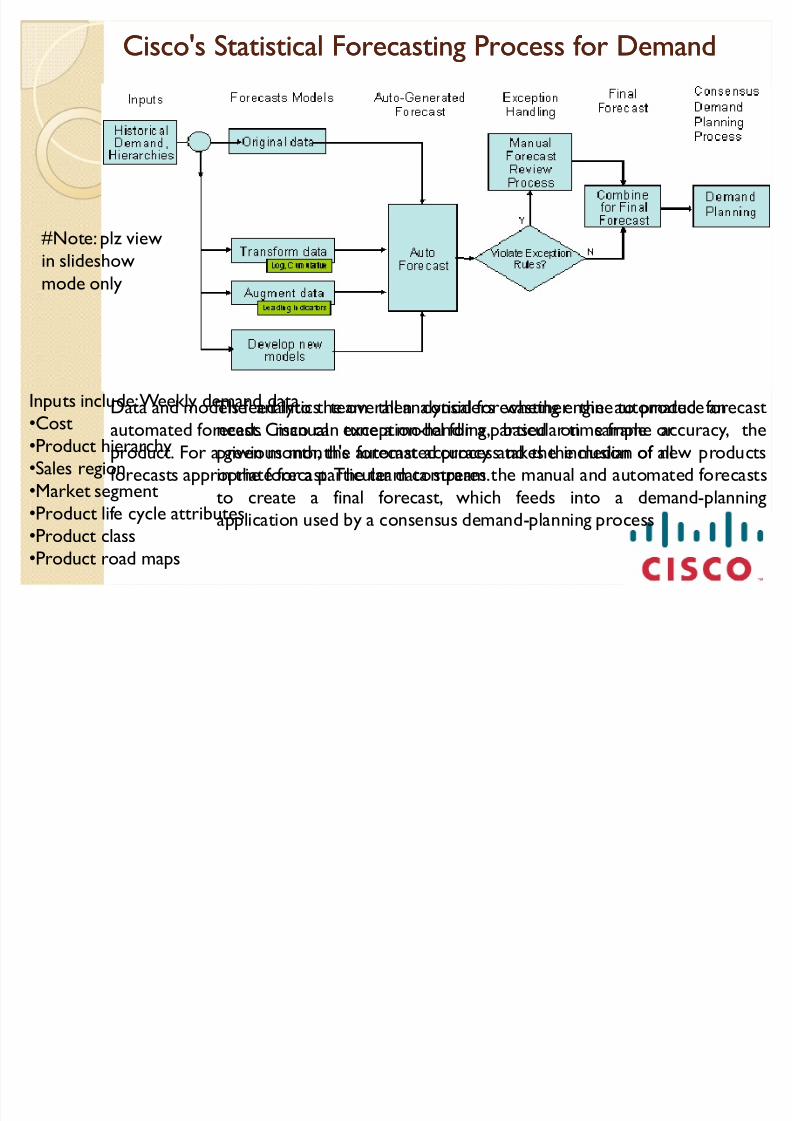
Inputs include: Weekly demand data
Cost
Product hierarchySales region
Market segment
Product life cycle attributes
Product class
Product road maps
Cisco's Statistical Forecasting Process for DemandCisco's Statistical Forecasting Process for Demand
Data and models feed into the overall analytical forecasting engine to produce anautomated forecast. Cisco can tune a model for a particular time frame or
product. For a given month, the automated process takes the median of allforecasts appropriate for a particular data stream.
The analytics team then considers whether the automated forecastneeds manual exception-handling, based on sample accuracy, the
previous month's forecast accuracy and the inclusion of new productsin the forecast.The team compares the manual and automated forecasts
to create a final forecast, which feeds into a demand-planningapplication used by a consensus demand-planning process
#Note: plz view
in slideshow
mode only
8/8/2019 06 Ashish Arya PGDM Marketing 8
http://slidepdf.com/reader/full/06-ashish-arya-pgdm-marketing-8 5/7
Cisco's DemandCisco's Demand--ForecastingForecasting
System ArchitectureSystem Architecture
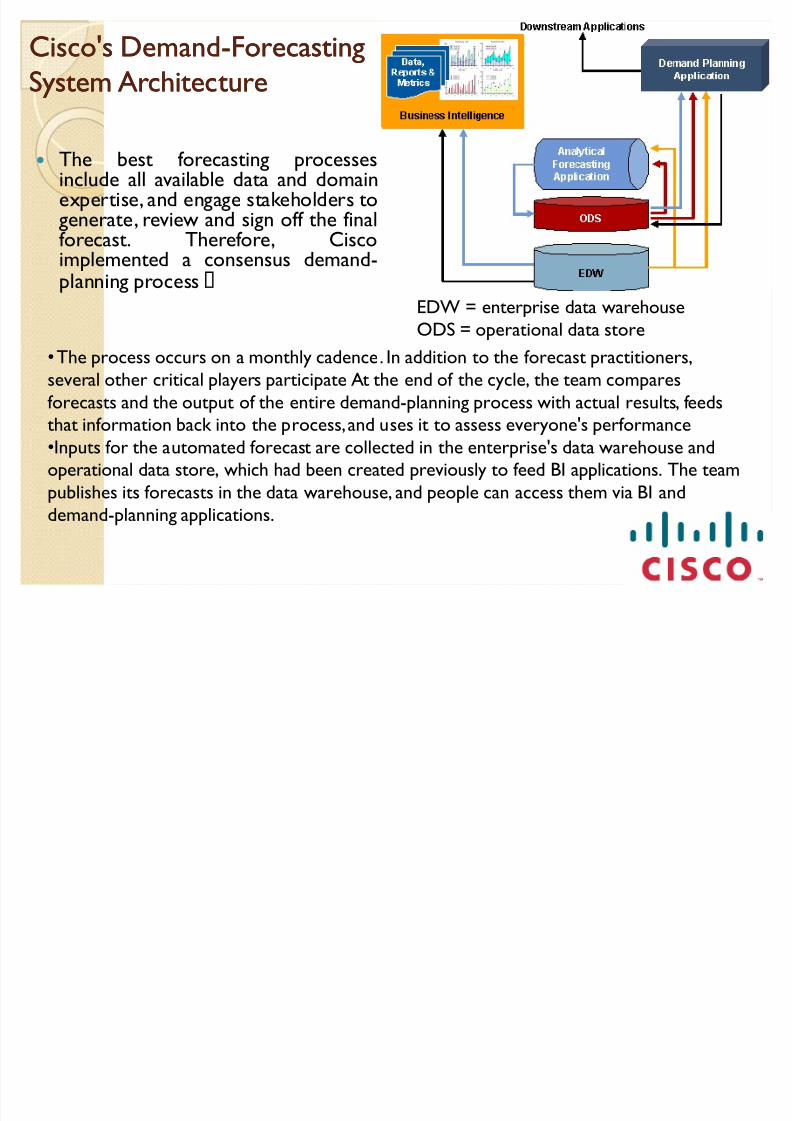
y The best forecasting processesinclude all available data and domainexpertise, and engage stakeholders togenerate, review and sign off the finalforecast. Therefore, Ciscoimplemented a consensus demand-
planning process EDW = enterprise data warehouse
ODS = operational data store
The process occurs on a monthly cadence. In addition to the forecast practitioners,
several other critical players participate At the end of the cycle, the team compares
forecasts and the output of the entire demand-planning process with actual results, feedsthat information back into the process, and uses it to assess everyone's performance
Inputs for the automated forecast are collected in the enterprise's data warehouse andoperational data store, which had been created previously to feed BI applications. The team
publishes its forecasts in the data warehouse, and people can access them via BI and
demand-planning applications.
8/8/2019 06 Ashish Arya PGDM Marketing 8
http://slidepdf.com/reader/full/06-ashish-arya-pgdm-marketing-8 6/7
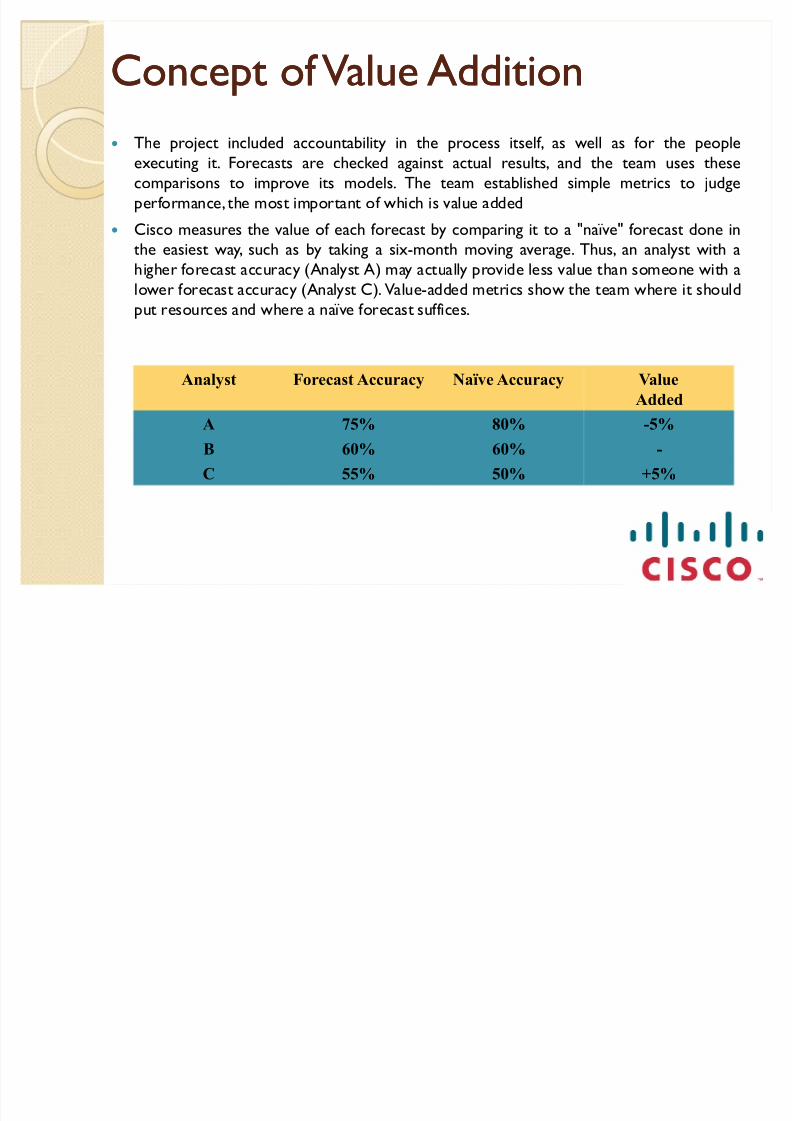
Analyst Forecast Accuracy Naïve Accuracy Value
Added
A 75% 80% -5%
B 60% 60% -
C 55% 50% +5%
Concept of Value AdditionConcept of Value Addition
y The project included accountability in the process itself, as well as for the peopleexecuting it. Forecasts are checked against actual results, and the team uses these
comparisons to improve its models. The team established simple metrics to judge
performance, the most important of which is value added
y Cisco measures the value of each forecast by comparing it to a "naïve" forecast done in
the easiest way, such as by taking a six-month moving average. Thus, an analyst with a
higher forecast accuracy (Analyst A) may actually provide less value than someone with alower forecast accuracy (Analyst C). Value-added metrics show the team where it should
put resources and where a naïve forecast suffices.
8/8/2019 06 Ashish Arya PGDM Marketing 8
http://slidepdf.com/reader/full/06-ashish-arya-pgdm-marketing-8 7/7
Conclusion, RecommendationsConclusion, Recommendations
y From 2001 to 2008, Cisco's forecast accuracy increased by 20% to 30%, and forecast biasfell by 60% to 80%.
y Consensus (involvement of a cross-functional team-sales, production, inventory, financemanagers) is required to increase accuracy of the forecast and decrease the occurrence of whip-lash/bull-whip effect.
y Investing in a simple but effective forecasting package can also free up the time of valuable
personnel. All basic sales forecasting software packages evaluate the history of yourbusiness, extrapolate pertinent information, and offer a forecast of your company's future.
y Cisco got its priorities and processes right, and technology was the least importantcomponent. In other words, the project might have failed had Cisco focused primarily onimplementing analytic applications. Instead, the organization focused more on getting theright mix of people involved, creating a flexible, comprehensive process and defining theright metrics.
y The concept of Value Added Analysis plays a huge role in determination of success of anyforecasting technique and must be implemented before adopting any new process.
END.


![Final Pgdm Syllabus]](https://img.pdfslide.net/doc/110x75/545d98ecb0af9fe2168b45de/final-pgdm-syllabus.jpg)