Embed Size (px)
Citation preview

Monsoon Disturbances Over Southeast and East Asia and the Adjacent Seas
C.-P. Chang Department of Meteorology
Naval Postgraduate School, Code MR/Cp Monterey, CA 93943
Telephone 831-656-2840, e-mail [email protected]
Award # N0001406WR20103 LONG TERM GOALS To study weather disturbances over the East Asian – Western Pacific monsoon region and vicinity using Navy and NCEP data and forecast models. The primary goal is to advance the understanding of the weather-producing systems in the region, in order to improve forecast capabilities. OBJECTIVES The objectives are: (1) to study the structure and the dynamic and thermodynamic properties of the weather systems in the vicinity of the Southeast and East Asian monsoon region that stretches from Indian Ocean to the tropical Pacific, including the South China Sea and Yellow Sea, which are of particular interest to naval operations; and (2) to study the ability and sensitivity of Navy operational numerical models in analyzing and predicting these disturbances. APPROACH Observational studies/Data analysis: Use archived data from global NWP outputs (including NOGAPS and NCEP model analyses) and satellite data to determine the structure of mesoscale and synoptic disturbances in various local regions for the different seasons. Use composite and principal component approaches to perform statistical analysis of the data. Modeling: Use dynamic and numerical models to study the interaction of western tropical Pacific monsoon circulation and synoptic tropical disturbances.
WORK COMPLETED In this year we continued the study of Asian winter monsoon surges over Southeast Asia by starting to analyze the unusually active late season (February-March 2005) events. We have compiled the cases and analyzed their possibly relationship with midlatitude blockings over the Atlantic and Pacific. This work is ongoing. Meanwhile, we started a new study to compile the statistics of concentric eyewall formation in western North Pacific tropical cyclones by examining microwave imagery data available from NRL Marine Meteorology Division and best-track data from JTWC for 1997-2005.
1

RESULTS Here we summarize the results obtained in examining the characteristics of typhoons with concentric eyewalls in the western North Pacific between 1997 and 2004, using satellite passive microwave imageries. A total of 38 concentric structure cases were observed, which represents approximately 25% of the typhoon cases examined during this period. A majority (61%) of the typhoons with the concentric structure have strong intensity (categories 4 and 5 in the Saffir-Simpson Scale). Among all strong typhoons examined, 58% of category 4 and 74% of category 5 possessed the concentric structure. The evolution of intensity leading to and after the concentric eyewall formation is studied by comparing the composites of the formation cases and those of the non-formation cases. Previous case studies suggested that concentric eyewalls tend to form at the peak intensity of the tropical cyclone. While this turns out to be the case for many of the formations, there are also substantial numbers of exceptions. Using the letter P to indicate positive intensity change (intensification) and N to indicate negative intensity change (weakening), we identified four types of intensity changes: PN (19 cases), PP (9 cases), NN (8 cases) and NP (2 cases). Here the first letter indicates the intensity change before the concentric formation and the second letter the intensity change after the formation. Overall, 74% of the concentric formation cases are preceded by intensification (PN and PP) and 71% are followed by weakening (PN and NN), but only 50% of the cases had formation occurring at peak time (PN). (We have done a similar study for the North Atlantic and found that 75% cases are preceded by intensification and 59% cases are followed by weakening). Figure 1a (left panel) shows the composite intensity evolution of each of the four categories and also of the total sample, and Fig. 1b (right panel) shows the intensity evolution normalized with respect to the maximum wind at the time of the concentric formation. Analysis of the structure evolution for individual cases for each type is being planned.
WNPAC
3819
82
9
Composite w/r intensity change
Fig. 1: WN Pacific intensity change types. Right panel shows intensity
normalized at formation time.
2
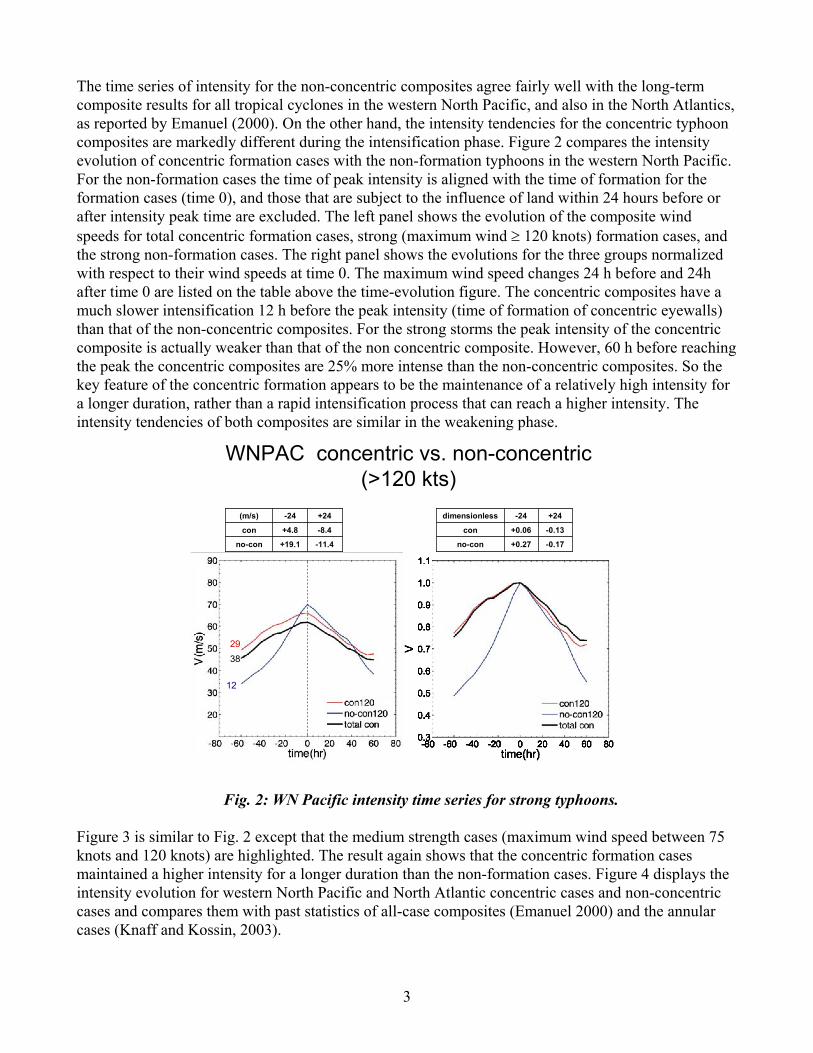
The time series of intensity for the non-concentric composites agree fairly well with the long-term composite results for all tropical cyclones in the western North Pacific, and also in the North Atlantics, as reported by Emanuel (2000). On the other hand, the intensity tendencies for the concentric typhoon composites are markedly different during the intensification phase. Figure 2 compares the intensity evolution of concentric formation cases with the non-formation typhoons in the western North Pacific. For the non-formation cases the time of peak intensity is aligned with the time of formation for the formation cases (time 0), and those that are subject to the influence of land within 24 hours before or after intensity peak time are excluded. The left panel shows the evolution of the composite wind speeds for total concentric formation cases, strong (maximum wind ≥ 120 knots) formation cases, and the strong non-formation cases. The right panel shows the evolutions for the three groups normalized with respect to their wind speeds at time 0. The maximum wind speed changes 24 h before and 24h after time 0 are listed on the table above the time-evolution figure. The concentric composites have a much slower intensification 12 h before the peak intensity (time of formation of concentric eyewalls) than that of the non-concentric composites. For the strong storms the peak intensity of the concentric composite is actually weaker than that of the non concentric composite. However, 60 h before reaching the peak the concentric composites are 25% more intense than the non-concentric composites. So the key feature of the concentric formation appears to be the maintenance of a relatively high intensity for a longer duration, rather than a rapid intensification process that can reach a higher intensity. The intensity tendencies of both composites are similar in the weakening phase.
WNPAC concentric vs. non-concentric (>120 kts)
+24-24dimensionless
-0.17+0.27no-con
-0.13+0.06con
+24-24(m/s)
-11.4+19.1no-con
-8.4+4.8con
12
3829
Fig. 2: WN Pacific intensity time series for strong typhoons.
Figure 3 is similar to Fig. 2 except that the medium strength cases (maximum wind speed between 75 knots and 120 knots) are highlighted. The result again shows that the concentric formation cases maintained a higher intensity for a longer duration than the non-formation cases. Figure 4 displays the intensity evolution for western North Pacific and North Atlantic concentric cases and non-concentric cases and compares them with past statistics of all-case composites (Emanuel 2000) and the annular cases (Knaff and Kossin, 2003).
3

WNPAC concentric vs. non-concentric(75~120 kts)
+24-24(m/s)
-6.5+13.3no-con
-2.0+5.1con
+24-24dimensionless
-0.14+0.27no-con
-0.03+0.09con
28
38
9
Fig. 3: WN Pacific intensity time series for medium strength typhoons.
56
72
6
12
38
24
40
Fig. 4: Intensity changes of WN Pacific and Atlantic concentric TCs compared to non-concentric, and previous statistics of annular and total samples.
4

The formation of the moat is generally believed to be heavily influenced by the subsidence forced by the two eyewalls. However, recent theoretical studies have shown that strain flow outside of the core vortex can also contribute to the concentric eyewall formation. This advective vorticity dynamic process may explain the development of the symmetric concentric structure from an initially asymmetric field, as is often observed. Examination of the microwave imageries indicates that two-thirds of the formation cases (25) possess the asymmetric large-area weak vorticity field (indicated by convection) on one side of the typhoon core that was modeled by Kuo et al (2004), and the other one-third (13) possess the irregular weak turbulent vorticity filed modeled by Kuo et al (2006). About 84% of the former cases and 54% of the latter cases developed the concentric structure following storm intensification. To assess the importance of the advective vorticity dynamics, we compared the theoretical moat characteristics with those of observations by devising a theoretical parameter that is the moat width implied in the rapid filamentation dynamics process discussed by Rozoff et al (2006). For each concentric eyewall typhoon, we compute its value from the observed maximum wind speed and inner eyewall radius by assuming that the tropical cyclone is a Rankin vortex. The resultant “filamentation moat width” explains about 38% of the variance of the satellite observed moat width for categories 4 and 5 typhoons (Fig. 5). Thus, the mechanism of moat formation through rapid filamentation and advective dynamics may be important in strong typhoons.
Nondimensional moat size vs. nondimensional filamentation moat size
Fig. 5: Normalized moat sizes (vertical) versus theoretical values (horizontal) estimated by the rapid filamentation zone (time < 30 minutes) based on Rozoff et al. (2006) and a Ranking vortex profile. Left panel shows the total cases, middle panel the strong typhoons (categories 4 and 5), and right
panel the non-strong cases. Other results of this study indicate there is significant variation in the life cycle of recurring concentric eyewalls. Not all of them underwent the replacement cycle in which the outer eyewall cutoffs the moisture supply to the inner eyewall and then shrinks to replace the inner eyewall. Some cases with longer intervals between recurrences appear to follow a reconstruction cycle, in which the outside
5
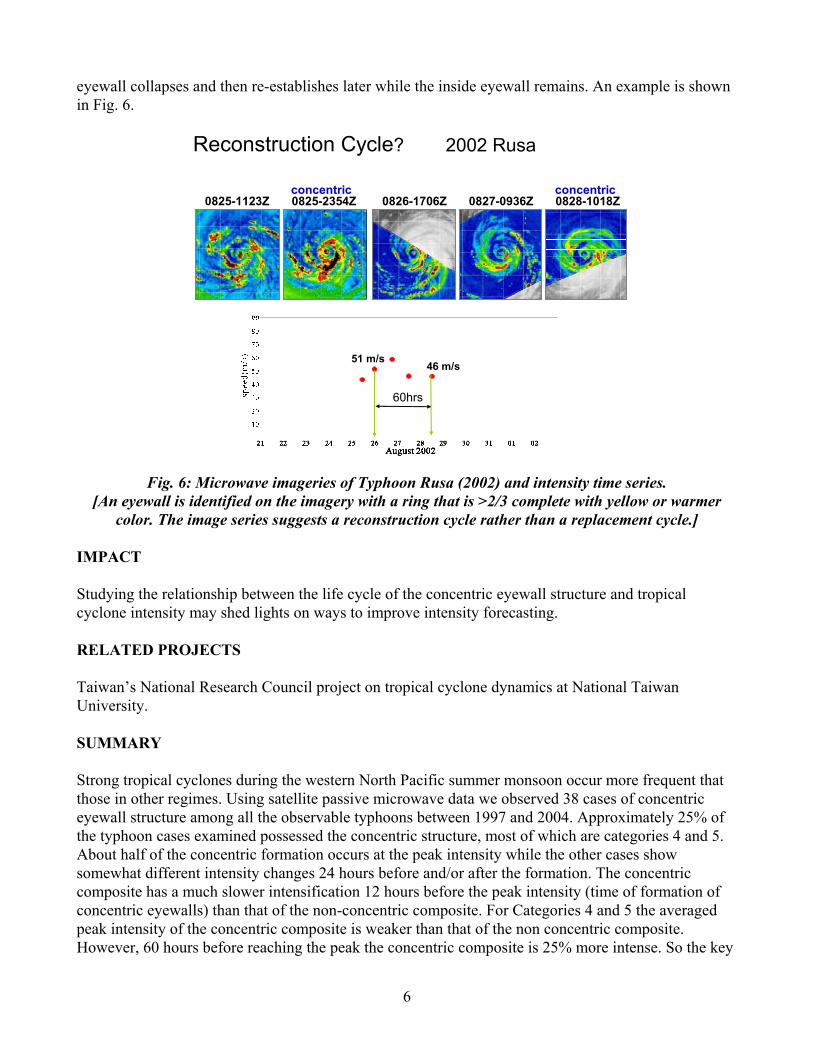
eyewall collapses and then re-establishes later while the inside eyewall remains. An example is shown in Fig. 6.
Reconstruction Cycle? 2002 Rusa
0825-1123Z 0825-2354Z 0826-1706Z 0827-0936Z 0828-1018Z
60hrs
51 m/s46 m/s
concentric concentric
Fig. 6: Microwave imageries of Typhoon Rusa (2002) and intensity time series.
[An eyewall is identified on the imagery with a ring that is >2/3 complete with yellow or warmer color. The image series suggests a reconstruction cycle rather than a replacement cycle.]
IMPACT Studying the relationship between the life cycle of the concentric eyewall structure and tropical cyclone intensity may shed lights on ways to improve intensity forecasting. RELATED PROJECTS Taiwan’s National Research Council project on tropical cyclone dynamics at National Taiwan University. SUMMARY Strong tropical cyclones during the western North Pacific summer monsoon occur more frequent that those in other regimes. Using satellite passive microwave data we observed 38 cases of concentric eyewall structure among all the observable typhoons between 1997 and 2004. Approximately 25% of the typhoon cases examined possessed the concentric structure, most of which are categories 4 and 5. About half of the concentric formation occurs at the peak intensity while the other cases show somewhat different intensity changes 24 hours before and/or after the formation. The concentric composite has a much slower intensification 12 hours before the peak intensity (time of formation of concentric eyewalls) than that of the non-concentric composite. For Categories 4 and 5 the averaged peak intensity of the concentric composite is weaker than that of the non concentric composite. However, 60 hours before reaching the peak the concentric composite is 25% more intense. So the key
6

feature of the concentric formation appears to be the maintenance of a relatively high intensity for a longer duration, rather than a rapid intensification process that can reach a higher intensity. A comparison of moat characteristics between rapid filamentation - strain flow theory and observations suggests that advective vorticity dynamics may explain approximately 38% of the variance of the observed moat width for categories 4 and 5 typhoons. Examination of image series also suggests that in addition to the well-known replacement cycles, some concentric structures recur through a reconstruction cycle in which the inner eyewall remains intact while the outer eyewall collapses and then rebuilds. REFERENCES Emaneul, K., 2000: A statistical analysis of tropical cyclone intensity. Mon. Wea. Rev., 128, 1139-
1152.
Knaff, J. A. and J. P. Kossin 2003: Annular Hurricanes. Wea. Forecasting, 18, 204-223.
Kuo, H.-C., L.-Y. Lin, C.-P. Chang, and R. T. Williams, 2004: The formation of concentric vorticity structure in typhoons. J. Atmos. Sci., 61, 2722-2734.
Kuo, H.-C., W. H. Shubert, C.-L. Tsai, and Y.-F. Kuo, 2006: Vortex interactions and the barotropic aspects of concentric eyewall formation, J. Atmos. Sci.,
Rozoff, M. C., W. H. Shubert, B. D. McNoldy, and J. P. Kossin, 2006: Rapid filamentation zones in intense tropical cyclones. J. Atmos. Sci., 63, 325-340.
PUBLICATION Chang, C.-P., Z. Wang, and H. H. Hendon, 2006. The Winter Monsoon. The Asian Monsoon. B. Wang,
ed., Prxis, Berlin, 89-127.
7


![SCISCITATOR 2015 · [1]. Riverine communities experience two main types of disturbances: natural disturbances and anthropogenic disturbances. Natural disturbances in riverine ecosystems](https://img.pdfslide.net/doc/110x75/5f27dd3959f0c41da22eeec5/sciscitator-1-riverine-communities-experience-two-main-types-of-disturbances.jpg)