Embed Size (px)
Citation preview

Practice Makes Profit: Business Practices and Firm
Success Richard Fabling & Arthur Grimes
Ministry of Economic Development
Occasional Paper 06/01
March 2006

Ministry of Economic Development Occasional Paper 06/01
Practice Makes Profit: Business Practices and Firm Success
Date: March 2006
Author: Richard Fabling & Arthur Grimes
Acknowledgements
This is a revised version of a paper presented to the New Zealand Association of
Economists conference, Auckland, June 2003. We thank Ed Lazear, Bob Buckle,
Dean Hyslop and Hayden Johnston for their helpful comments.
Richard Fabling works for the Ministry of Economic Development, New Zealand.
Arthur Grimes is from Motu Economic & Public Policy Research; & University of
Waikato.
Contact: [email protected]
Disclaimer
The views, opinions, findings, and conclusions or recommendations expressed in this
Occasional Paper are strictly those of the author(s). They do not necessarily reflect
the views of the Ministry of Economic Development. The Ministry takes no
responsibility for any errors or omissions in, or for the correctness of, the information
contained in these occasional papers. The paper is presented not as policy, but with
a view to inform and stimulate wider debate.
i

Abstract
Which business practices set successful firms apart from others? We address this
question using data from an official survey of almost 3,000 New Zealand firms.
Questions cover: leadership, planning practices, customer and supplier focus,
employee practices, quality and process monitoring, benchmarking, community and
social responsibility, innovation, IT use, business structure and the competitive
environment. Some of these are internal practices reflecting a firm’s resources and
capabilities; some are characteristics of the external environment. We find that
capital investment choices, R&D practices, market research and a range of employee
practices are positively associated with firm success; industry structure is also a key
determinant of success. The association between specific business practices and
firm success is mostly independent of firm size, age and industrial sector, other than
for export marketing.
JEL Nos: D21, L20
ii

Executive Summary
Which business practices set successful firms apart from others? We address this
question using data from an official survey of almost 3,000 New Zealand firms.
Questions in the Business Practices Survey 2000 cover: leadership, planning
practices, customer and supplier focus, employee practices, quality and process
monitoring, benchmarking, community and social responsibility, innovation, IT use,
business structure and the competitive environment. In order to analyse which
practices affect firm performance, we set out a conceptual model of firm performance.
We then use the survey data to test the importance for firm performance of
alternative practices.
Our conceptual model builds on recent work in the strategic management field and in
industrial organisation. A key strategic management question is how firms achieve
and maintain competitive advantage relative to their rivals. Commonly, analysts
differentiate between internal firm characteristics and the external environment. The
former includes the firm’s goals, values, resources, capabilities, systems and
organisational structure. The latter includes the nature of the industrial sector in
which a firm operates and broader economic trends. A competitive strategy requires
the firm to decide how it will position itself and its products in light of the external
environment so maintaining competitive advantage in specific product areas. This
positioning requires decisions regarding the broad businesses in which to operate,
employment and deployment of resources, and external marketing strategies.
Empirical studies internationally suggest that both industry-level and firm-level
influences are important in determining individual firm performance. Evidence also
indicates that firm outcomes can persist over time through various path
dependencies. For instance, high quality staff attract other high quality staff, while the
consistent introduction of modern technologies embodied in new physical capital can
contribute positively to maintenance of high productivity. These human resource and
technology choices are themselves underpinned by a firm’s management practices.
We test the importance of a range of firm practices and industry factors in
determining firm success measured by three metrics: relative profitability, relative
productivity and changes in market share. Four categories of business practices are
iii
found to be particularly important. The first is investment in up-to-date capital
equipment. Use of “high performance” employee-related practices constitute the
second group. This group includes incentive practices (adoption of performance pay
for most employees) and more general HR practices (e.g. measuring employee
satisfaction). The third and fourth groups relate to R&D and market research. R&D
practices (including both internally conducted and externally commissioned R&D) are
associated positively with all three business result measures. Market research is
associated primarily with higher market share.
The association between specific business practices and firm success is mostly
independent of firm size, age and industrial sector, other than for export marketing.
We find that this practice is only significant for small and medium sized firms that
have been in operation for up to ten years; it is not significant for old or large firms.
This finding is intuitively sensible since new export marketing is particularly important
for the growth prospects of younger, growing firms. Older, larger firms tend already to
be exporters or to have taken a prior decision to operate solely within the domestic
market.
Industry structure is also found to be important for firm success. Firms that operate in
an oligopolistic setting, and/or do not perceive competition as a barrier to innovation,
tend to perform well on all three measures of performance. While we cannot
ascertain causality, the results suggest that industry factors are not the sole
determinants of competitive advantage; capabilities and resource use within the firm
are also important. Successful firms are “up with the play” in terms of capital
equipment and product and process development. They complement these
innovation practices through their attention to human resources within the firm.
Successful firms emphasise mechanisms to incentivise and reward performance and
pay attention to a range of human resource management practices.
iv

Table of Contents
Abstract ..................................................................................................................... ii
Executive Summary ................................................................................................ iii
Table of Contents ..................................................................................................... v
Introduction............................................................................................................... 1
Analytical Framework .............................................................................................. 6
Data............................................................................................................................ 9
Methodology & Results.......................................................................................... 14
Conclusions ............................................................................................................ 21
Figures..................................................................................................................... 23
Figure 1: Kernel Densities by Business Result ..................................................... 23
Tables ...................................................................................................................... 25
Table 1: Summary of responses to business result questions .............................. 25
Table 2: Percentage of firms with same binary response across business results 25
Table 3: Percentage of firms with “high” response across multiple business result
questions............................................................................................................... 26
Table 4: Business Results Explained by Practices and Characteristics................ 27
References .............................................................................................................. 29
v

Practice Makes Profit: Business
Practices and Firm Success
Introduction
Which business practices set successful firms apart from others? We analyse the
relationship of firm performance with firm business practices (reflecting its resources
and capabilities) and characteristics of the external environment. We do so using a
new official dataset, compiled by New Zealand’s official statistical agency. The data
cover almost 3,000 firms representative of the entire economy (which, in turn,
comprises mainly small and medium sized enterprises). We find that investment in
capital equipment, R&D and market research are strongly associated with firm
success; so too are incentive-related and a range of other employee practices.
Industrial structure is also associated strongly with firm performance. This is the first
study to analyse the unit record data within this survey. As well as addressing the
substantive question posed at the outset, the paper discusses the properties of this
survey and of the data.
A key strategic management question is how firms achieve and maintain competitive
advantage relative to their rivals (Teece et al, 1997; Barney and Arikan, 2001).
Commonly, analysts differentiate between internal firm characteristics and the
external environment (Grant 1998; Barney, 2002). The former includes the firm’s
goals, values, resources, capabilities, systems and organisational structure. The
latter includes the nature of the industrial sector in which a firm operates and broader
economic trends. A competitive strategy requires the firm to decide how it will
position itself and its products in light of the external environment so maintaining
competitive advantage in specific product areas (Ansoff, 1987; Day, 1990; Mintzberg
et al, 1998; Varadarajan and Jayachandran, 1999). This positioning requires
appropriate corporate strategies (deciding which broad businesses in which to
1

operate), business strategies (including how resources will be deployed internally)
and external marketing strategies.
Contemporary strategy research has two principal strands: industry-based
approaches and resource-based approaches. The industry-based approach (e.g.
Porter, 1980 and 1985) highlights the importance of external factors, such as the
industry’s market structure, in influencing firm success. While these factors are
external to the firm, individual firms can nevertheless make choices to alter their
interaction with the market, for instance by creating entry barriers (and hence quasi-
monopolies) through product differentiation (Baumol, 2002; Syverson, 2004). The
resource-based view (Penrose, 1959; Wernefelt, 1984) emphasises internal
processes and choices regarding the firm’s resources and capabilities that ultimately
contribute to the firm’s profitability. Competitive advantage, in this view, stems from
superior acquisition, use, development and protection of the firm’s resources (Teece
et al, 1997; Grant, 1998; Eisenhardt and Martin, 2000; Makadok, 2001).
Empirical work suggests that both pillars are important (Amit and Shoemaker, 1993;
Barney, 2002). Spanos and Lioukas (2001), for instance, find both industry-level and
firm-level influences are significant sources of rent generation within their analysis of
medium-large Greek firms. Within a specific industry, Hewitt-Dundas and Roper
(2001) find that in a mature industry (furniture), industry characteristics have an
important bearing on overall firm performance. However, the strength of an individual
firm’s own resource base is also important and is key to determining the success of a
firm’s business strategy.
In the economic analysis of firm dynamics, Haltiwanger et al (1999 and 2000) provide
a conceptual underpinning for analysing firm outcomes that is related to the strategic
management approaches. They assume that heterogeneity of firm outcomes reflects
heterogeneity in firms’ initial characteristics and subsequent choices. Components of
this heterogeneity include: idiosyncratic ability of managers; the firm’s organisational
practices and policies; choice of productive inputs such as technology and capital;
and nature of the internal labour market. Each of these components may influence
the firm’s choices and the productivity and profitability of the firm. Roper (1998) finds
that characteristics of the entrepreneur (akin to Haltiwanger’s “idiosyncratic ability of
managers”) determines small firms’ propensity to undertake management initiatives.
2

These characteristics also influence initiatives relating to new product development
and marketing strategies although (reflecting the findings of Spanos and Lioukas) the
external environment and the firm’s market position remain relevant.
Heterogeneity of outcomes can persist over time through various path dependencies.
For instance, Haltiwanger et al (2000) find that high quality staff attract other high
quality staff, even to individual business units within a firm. Further, the consistent
introduction of modern technologies embodied in new physical capital can contribute
positively to maintenance of high productivity (Aghion & Howitt, 1998; Nickell &
Nicolitsas, 2000; Griliches, 1994). These human resource and technology choices
are themselves underpinned by a firm’s management practices. For instance,
innovative human resource management practices are shown to boost productivity in
the US steel industry (Ichniowski et al, 1997) and performance pay is found to boost
productivity in the glass industry (Lazear, 2000).1 The nature of IT practices is
important in choosing appropriate technology paths (Bresnahan et al, 1999).
Ultimately, as these examples indicate, choices regarding a range of firm practices,
adopted in the light of external environmental factors, are important in determining
firm success (Haltiwanger et al, 2000; UK Treasury, 2000).
A study by Bloom et al (2005) bridges the strategic management and micro-
economic approaches to studying the determinants of firm performance. They survey
management practices of 731 medium sized manufacturing firms across four
countries, with the survey being based on models of productive management
researched by McKinsey Global Institute. They then relate aggregate measures of a
firm’s management practices to several measures of its performance, finding a
statistically significant role for management practices on firm performance in addition
to the roles of other control variables. Management practices themselves depend on
several factors including the competitive structure of the industry, firm age and
country regulation.
Our study has several features in common with the Bloom et al study. We use a
survey based approach grounded in the strategic management literature to
determine management practices and then link these practices to measures of firm 1 Lazear notes that while adoption of performance pay may boost firm productivity, it may not boost firm profitability; that depends on how the productivity benefits are shared between shareholders, employees, customers and suppliers.
3

performance. Both studies establish associations (rather than causal links) between
reported management practices and performance.2 In contrast to Bloom et al, our
concentration is on finding the individual management practices that impact most on
firm performance rather than the influence of an aggregate bundle of management
practices (see Fabling and Grimes, 2003, for the impact of aggregate measures of
management practices on firm performance using the same dataset). Our dataset
has some advantages and some disadvantages relative to that used in the Bloom et
al study. The key advantages are the much larger sample compared with other
studies (2,742 compared with Bloom et al’s 731, and with Spanos and Lioukas’s 147)
and much higher response rate to the survey (82% compared with Bloom et al’s 54%,
and with Spanos and Lioukas’s 13%); while the subjective (rather than Bloom et al’s
objective) measurement of firm performance is a disadvantage (Spanos and Lioukas
also use subjective measures).
Our data cover 2,742 firms surveyed within the New Zealand (NZ) Business
Practices Survey (BPS). This survey was conducted in 2001 jointly by NZ’s official
statistical agency, Statistics New Zealand, and the Ministry of Economic
Development. A detailed description of the survey is provided in Knuckey and
Johnston (2002), which also reports comprehensively on the differing nature of
business practices across different firm types. The BPS surveyed a wide set of
business practices of NZ firms and environmental factors facing them. The survey
covers both industry and firm level characteristics and choices, and so can be used
to indicate the relative importance for firm performance of firm level and industry level
factors. Properties of our data are discussed in more depth in section 3.
Our analysis highlights practices and external environmental characteristics that have
significant association with business success across firms. We examine whether the
importance of these practices and environmental factors differ across firms of
different sector, age and size. In 2002, of the 39,260 (non-agricultural) NZ firms with
6 or more full-time equivalent employees (FTEs), 46.5% had fewer than 20
employees and 96.6% had fewer than 100 employees (Ministry of Economic
Development, 2003). In our sample, 93.1% of firms have fewer than 50 FTEs. Our
2 As discussed by Bloom et al (2005), significant associations – while not revealing direction of causality - nevertheless indicate that the surveyed management practices are important to the operation of firms.
4

study is designed to accommodate the possibility that factors which accompany large
firm success may be different from those which accompany success of small firms.
Additionally, firm-level performance determinants may differ according to the age of
the firm or the sector in which it operates.
Finding which business practices and environmental factors are associated with firm
success is a complex task because of the large number of questions contained in the
survey and the range of success measures that are surveyed. Over 180 questions
regarding strategies and outcomes were asked in the survey; and given multiple
response categories, over 700 potential responses were available. In section 2, we
present a framework for interpreting this extensive information. The framework is
based on the analytical approaches outlined above, with emphasis both on internal
choices of the firm and on internal and external characteristics facing the firm. We
use this framework in our subsequent interpretation of results.
Section 3 describes the data. Section 4 presents our econometric approach to
determining which firm practices and environmental characteristics are associated
with firm success, and presents our results. Section 5 sets out our conclusions. We
emphasise that the survey, while comprehensive, is a single snap-shot; the
techniques used here do not determine causality of linkages. Our purpose instead is
to find which business practices and characteristics are associated with firm success.
These findings provide a basis for further analysis of factors that lie behind the
associations, using both this dataset and comparable data that may in future become
available.
5

Analytical Framework
We start with a generalised production function incorporating quality differences
across firms in each of output, labour and capital, and in the efficiency with which
quality-adjusted labour and capital are combined into quality-adjusted output.3 In a
monopolistically competitive market, output prices will depend on the perceived
quality of outputs relative to those of competitors (Syverson, 2004). We denote
quantities of firm i’s output, labour input and capital input as Yi, Li and Ki
respectively;4 the quality (productivity) of the labour and capital inputs respectively as
λi and μi; and the quality of output as νi. The efficiency with which firm i combines
quality-adjusted labour and capital into quality-adjusted output is denoted Ai. We
normalise variables so that: E(λi) = E(μi) = E(νi) = E(Ai) = 1. Values of λi, μi, νi and Ai
greater (less) than 1 indicate superior (inferior) quality relative to the norm across all
relevant firms. The generalised production function for each firm is of the form:
Yi.νi = f{ Ai, Li.λi, Ki.μi } (1)
where the first partial derivative of f{.} with respect to each argument is positive. A
specific example of (1) is given by the CES production function of Kelejian and Black
(1970) incorporating augmented labour and augmented capital inputs.
The output price (qi) received by firm i is a non-decreasing function of output quality
(νi). The average wage which firm i pays (wi) and its average capital cost (ri) are non-
decreasing functions of λi and μi respectively. The functional forms of q(νi), w(λi) and
r(μi) are each determined by the product and factor markets in which the individual
firm participates.
Each of νi, λi and μi is assumed to be a function of the vector of business practices
adopted by the firm, Pi. As discussed in the resource-based approach to competitive
advantage and by Haltiwanger et al (2000), the scope of relevant business practices
affecting each of these variables may be very wide. For instance, they cover choices
concerning technologies as well as broader management processes. The efficiency
parameter, Ai, is assumed to be a function of both Pi and a vector of characteristics
3 Quality may be tangible (e.g. a product with more features) or intangible (e.g. a brand name). 4 Outputs may be single or multiple; in the latter case Y becomes a vector representing the range of the firm’s outputs; corresponding remarks apply to L and K .
i
i i
6

(Ci) over which management of the firm has no direct control. These characteristics
may relate to the general economy (e.g. the economic cycle, which may affect some
firms more than others), the industry (e.g. market structure) or exogenous
characteristics of the firm (e.g. historical performance).
The firm maximises profit, Πi, given by (2), through its choices of Li, Ki and Pi, taking
Ci as given:
Πi = q(ν(Pi)).f{A(Pi, Ci), Li.λ(Pi), Ki.μ(Pi)} - w(λ(Pi)).Li - r(μ(Pi)).Ki (2)
Writing the problem facing the firm as in (2) makes explicit that the firm’s Pi choice
affects its productivity in a different manner from its profitability. High productivity
relative to the norm may not translate into high relative profitability if the revenue from
increased quality-adjusted output accrues to the factors of production. Conversely, a
firm may reap high relative profitability through its Pi choice by increasing output
quality, holding its input and output quantities constant. In this case, despite having
high profitability, the firm’s productivity (defined as the number of units of output per
units of input) may be only at the norm. Depending on the nature of the demand
curve facing the firm, the firm may choose to reap higher quality through higher
market share and/or higher price.
We cannot estimate (1) or (2) directly since we do not have quantitative data for Yi, Li
or Ki. Our data include qualitative responses regarding relative profitability, relative
productivity and market share for each firm, plus extensive qualitative data covering
firms’ practices and characteristics. From (2), it is possible to predict the reduced
form impacts of some specific Pi choices on particular business results of the firm,
and we concentrate on these reduced form impacts.5 The purchase of new capital
equipment (in a vintage capital framework with increasing quality over time)
increases μi, resulting in high relative productivity when the equipment is up-to-date
relative to that of its competitors. Whether this investment flows through to high
profitability and/or market share depends on the nature of the other functions
embedded in (2). Market research activities are less likely to impact on relative
productivity since they are not aimed at changing the production process. Rather,
5 It is possible that this dataset may in future be linked to other data for the same firms collected by the official statistical agency. In that case, a structural modelling approach may become viable.
7

they are most likely to impact on market share and/or profitability. Other forms of
R&D may impact on productivity and/or on product quality and so affect productivity,
profitability or market share. Similarly, employee-related practices may impact on
productivity via Ai and λi, but could impact purely on product quality (and hence
profitability or market share) without raising productivity.
In general, a firm’s Pi choice will affect some combination of its relative profitability,
relative productivity and market share. In our analysis in section 4, we seek to
determine which elements of Pi impact on these three outcomes. In keeping with the
analysis above, we hypothesise specifically that new capital investment will result in
high relative productivity (and possibly in high relative profitability and market share),
while market research elements of Pi will have their major effects on market share.
These specific hypotheses are tested in section 4.
We examine also the effect on firm performance of key external characteristics within
Ci. The industry-based strategic management approach emphasises the importance
of industry structure as a determinant of firm performance. In section 4, we test
explicitly whether industry structure matters as posited in this approach.
8

Data
In 2000/01, Statistics New Zealand (the country’s official statistical agency)
conducted a comprehensive survey “to collect information on the business practices
of New Zealand businesses. … to quantify business behaviour, capability and
performance across a wide selection of industries.” The survey was wide-ranging
both in its coverage of firms and in the range of surveyed business practices and firm
characteristics. The range of business practices and characteristics that were
surveyed was similar to that covered by Spanos and Lioukas (2001). The survey was
conducted at a time when the aggregate economy had a neutral “output gap”
(Reserve Bank of New Zealand, 2005, p.27) and the economy was growing
moderately (2.3% p.a. in the year to March 2001, following average growth of 2.6%
p.a. in the previous two years).
A major strength of the survey is its comprehensive and methodologically sound
sampling approach (Knuckey and Johnston, 2002; Statistics New Zealand, 2002).
Key aspects of this approach include: the official status of the questionnaire; its
extensive piloting to ensure the questionnaire could be answered by one person per
firm, ensuring a very high response rate;6 the target population being all private
sector firms with at least six FTEs; the sampling frame being based on all New
Zealand enterprises (total eligible firms to be sampled was 36,953); the stratified
sampling design with two-way stratification by sector and employment size;7 and the
weighting of each enterprise to make the sample representative of the underlying
population of firms in the economy.8
Most questions in the survey were qualitative,9 partly because of the type of
information that was being sought and partly to assist response rates.10 There were
6 The questionnaire was sent to 3,378 enterprises with response from 2,756 enterprises (81.6% response rate); 96% of respondents answered 90% or more of the questions (with the mean proportion of questions answered being 97%). Responses to unanswered questions were inferred by Statistics New Zealand using a “nearest neighbour” methodology. We drop 14 observations from this set due to the absence of either the industry or age variable. 7 Size stratification was: 6-19.5 FTEs (Small); 20-49.5 FTEs (Medium); > 50 FTEs (Large). 8 We use weighted responses throughout our analysis. 9 E.g. “How important are competitors as a source of ideas and information for new and improved products, services or processes?” 10 On-site interviews were conducted with a sample of respondents to verify the accuracy of the data collected (Knuckey and Johnston, 2002).
9

also a small number of quantitative questions asked in the survey.11 We use both
types of question in our empirical analysis. For each question, there are normally
either two potential responses regarding the practice (Yes/No) or 4 to 6 potential
responses (a graded scale plus “don’t know”). We test each category of response
separately in our empirical work rather than use a restrictive representation of the
responses such as a Likert scale.
Knuckey and Johnston (2002) describe the data in detail.12 The content of the
questionnaire was based on a model of firm best practice informed by the strategic
management literature and by previous surveys (Knuckey et al, 1999; Australian
Manufacturing Council, 1994). For each firm, Knuckey and Johnston formed six
Business Practice Indices covering: leadership and planning; customer focus; quality
and supplier focus; employee practices; information and benchmarking; and
innovation and technology. Each index was an unweighted summary measure of the
firm’s responses to questions surveying its practices in the relevant area. Together,
these indices summarised the information content of 55 separate questions. However
the appropriateness of the (equal) weighting of questions within each index was not
verified by any external metric and the survey contained additional questions that
were not incorporated into the indices. In contrast, we make use of all the survey
information in our empirical work, and subject the significance of each question to
statistical test.13
The BPS also surveys Business Results. Using very similar performance questions
and scales to those used by Spanos and Lioukas (2001), each firm is asked to record
against a qualitative 3-point scale (plus “don’t know”) their firm’s situation for seven
items:14
• profitability relative to major competitors;
• return on investment (ROI) relative to major competitors;
11 E.g. “In the last 12 months what was the value of sales generated through the internet?” 12 See www.med.govt.nz/templates/ContentTopicSummary____2259.aspx for the questionnaire. 13 Despite the simple nature of the Knuckey & Johnston indices, Fabling and Grimes (2003) find that two indices (Employee Practices, and Innovation and Technology) have significant explanatory power over measures of firm performance. 14 For the first three categories, choices are “lower”, “on a par”, “higher”. For net cash flow, choices are “negative”, “neutral”, “positive”. For the remaining three questions, choices are “decreased”, “stayed the same”, “increased”.
10

• productivity relative to major competitors;
• market share relative to three years’ prior;
• profitability relative to three years’ prior;
• net cash flow over the past twelve months;
• sales of goods and services over the past twelve months.
Based on the analytical framework outlined in section 2, we seek to explain firm
performance given by three of these business result measures – relative profitability,
relative productivity and market share. We explain firm performance on each of these
measures by firm practices (Pi) and characteristics (Ci).15
We divide the responses to each of the business result questions (our dependent
variables in the analysis that follows) into binary outcomes, grouping together the
neutral and unfavourable responses as one outcome and the favourable responses
as the other outcome for the variable. We then undertake probit analysis on these
data.
Our reason for converting the data into binary variables is that comparatively few
respondents in each category responded that their firm was doing worse than their
competitors or worse than their own history. For instance, as Table 1 shows, only
3.8% of respondents considered their productivity to be lower than that of their
competitors. In contrast, there were material numbers of firms responding in each of
the neutral and favourable categories (33.6% of respondents considered their
productivity to be higher than that of their competitors). We adopt a maintained
hypothesis that there was a respondent bias away from the neutral and unfavourable
responses; i.e. we conjecture that many respondents who “should” have answered
that their performance was unfavourable instead answered in the neutral rather than
the unfavourable category. At the conclusion of the paper, we test whether our
results are robust if we separate the unfavourable and neutral categories, using
ordered probit estimates across all three categories of responses. We find that the
results are robust, but the probit estimates have some preferred properties.
15 In examining the wider properties of the data, we make use of the information covered by all seven business result measures. Fabling and Grimes (2003) presents results for all seven business results, showing similar determinants across all seven measures to those for the three measures presented here.
11
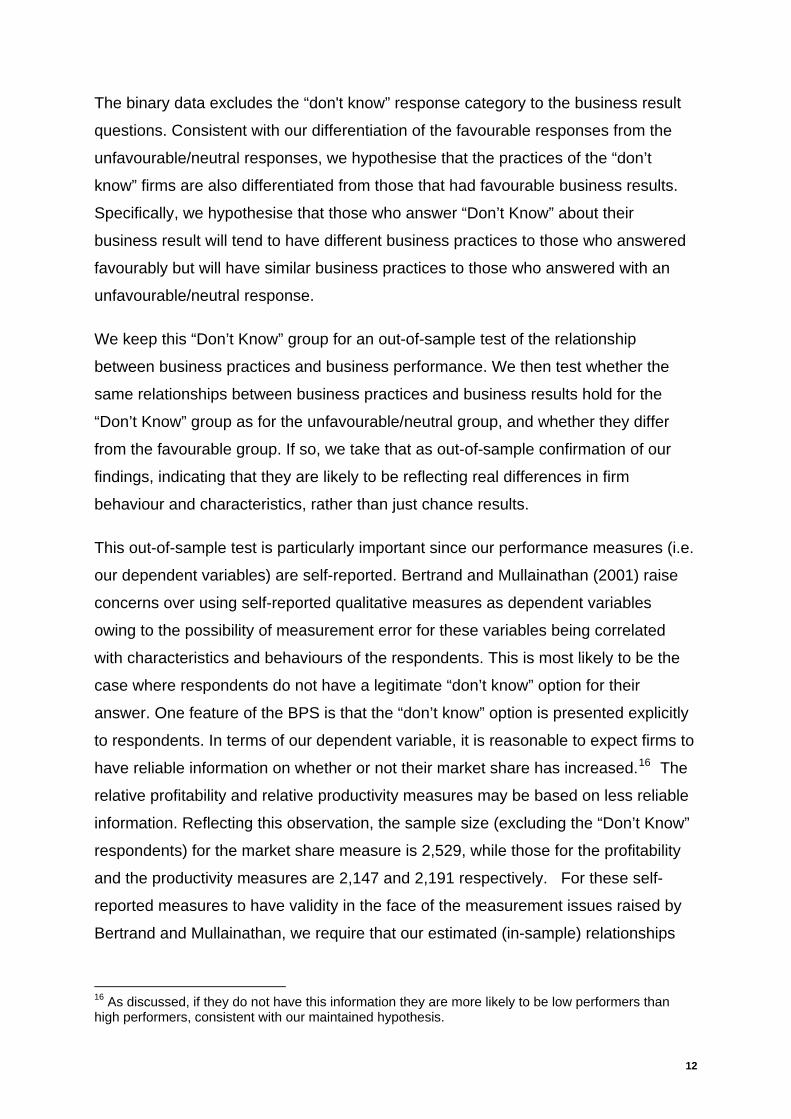
The binary data excludes the “don't know” response category to the business result
questions. Consistent with our differentiation of the favourable responses from the
unfavourable/neutral responses, we hypothesise that the practices of the “don’t
know” firms are also differentiated from those that had favourable business results.
Specifically, we hypothesise that those who answer “Don’t Know” about their
business result will tend to have different business practices to those who answered
favourably but will have similar business practices to those who answered with an
unfavourable/neutral response.
We keep this “Don’t Know” group for an out-of-sample test of the relationship
between business practices and business performance. We then test whether the
same relationships between business practices and business results hold for the
“Don’t Know” group as for the unfavourable/neutral group, and whether they differ
from the favourable group. If so, we take that as out-of-sample confirmation of our
findings, indicating that they are likely to be reflecting real differences in firm
behaviour and characteristics, rather than just chance results.
This out-of-sample test is particularly important since our performance measures (i.e.
our dependent variables) are self-reported. Bertrand and Mullainathan (2001) raise
concerns over using self-reported qualitative measures as dependent variables
owing to the possibility of measurement error for these variables being correlated
with characteristics and behaviours of the respondents. This is most likely to be the
case where respondents do not have a legitimate “don’t know” option for their
answer. One feature of the BPS is that the “don’t know” option is presented explicitly
to respondents. In terms of our dependent variable, it is reasonable to expect firms to
have reliable information on whether or not their market share has increased.16 The
relative profitability and relative productivity measures may be based on less reliable
information. Reflecting this observation, the sample size (excluding the “Don’t Know”
respondents) for the market share measure is 2,529, while those for the profitability
and the productivity measures are 2,147 and 2,191 respectively. For these self-
reported measures to have validity in the face of the measurement issues raised by
Bertrand and Mullainathan, we require that our estimated (in-sample) relationships
16 As discussed, if they do not have this information they are more likely to be low performers than high performers, consistent with our maintained hypothesis.
12

determining high from low relative performance can distinguish also between high
performers and those in the out-of-sample (“don’t know”) group.
The bulk properties of the data (pre- and post-combination into binary responses) are
summarised for all seven business result questions in Table 1. Looking at the inter-
relationship between business result responses, we see a considerable degree of
consistency across performance indicators. Table 2 shows that, on a pairwise basis,
a majority of firms gave consistent responses to business result questions. We
should therefore expect a number of business practices to impact across several of
the outcome variables. Table 3 indicates, however, that there are relatively few stellar
performers (answering "high" to all questions). Instead, the data show an even
distribution of poor, average & stellar performers across all the results, consistent
with what might be expected across the economy.
13

Methodology & Results
Our estimation strategy follows from the conceptual framework outlined in equations
(1) and (2). Our data precludes a structural modelling approach, and instead we
adopt a reduced form methodology. For each of the three business results (relative
profitability, relative productivity and market share), we test the significance of each
element of Pi and Ci after controlling for other business practices and characteristics.
Because of the large number of variables in the survey, we divide the survey
questions into six groups.17 We test the significance of each question response
within a group while at the same time including five composite variables representing
the overall responses to each of the five other groups.18 Initially, we identify each
individual response that is significant at the 20% level and then follow a general to
specific modelling approach, testing down until only Pi and Ci variables that are
significant at the 5% significance level remain.
We test the robustness of our findings across different types of firms, specifically
according to industrial sector, size and age. Initial analysis, reported in Fabling and
Grimes (2003), showed that results did not differ materially across industrial sector,
except in some cases for agriculture, fishing and forestry (AFF) relative to other
sectors, but did sometimes differ according to size and age of firm. Without adjusting
for size and age effects, the results would be characterised by heteroskedastic
residuals and it would be difficult to draw inferences relating to firms of different types.
We therefore test for firm age and firm size interaction effects on both intercept and
slope coefficients in order to account for differences in firm type. We also test for
interactions with the intercept arising from sectoral effects.
In constructing the firm age and firm size interaction terms, we took advantage of the
initial survey design and partitioned the sample into eight categories corresponding to
logical groupings with reasonable sub-sample sizes. The age-size groupings, with
17 The groups are: leadership and planning; customer focus; quality and supplier focus; employee practices; information and benchmarking; innovation and technology. 18 The composite variables that we use are the six Business Practice Indices (BPIs) compiled by Knuckey and Johnston (2002). We also constructed principal components (PCs) using the same groupings; the correlation coefficients between the respective BPIs and PCs ranged from 0.73 to 0.99 (averaging 0.87) indicating that each approach acts as a similar control for the remaining practice groupings.
14

number of sub-sample observations and each group’s weighted proportion within the
sample, are as follows.
Age-Size Category19 No. Observations Weighted Sample %
Large - over 10 years 524 5.2
Large - under 10 years 154 1.7
Medium - over 10 years 590 10.7
Medium - 5 to 10 years 148 2.7
Medium - under 5 years 176 3.3
Small - over 10 years 625 40.5
Small - 5 to 10 years 231 15.5
Small - under 5 years 300 20.4
In each case, variables20 were entered directly (i.e. without interactions) and with
age-size interaction terms, where the sum of the coefficients on the latter are
constrained to equal zero.21 Interaction terms are retained if and only if they are
jointly significant at the 5% level, indicating that the effect differs across one or more
firm type. The coefficients on the uninteracted variables reflect the average effect of
each variable on the relevant business result. We concentrate in our reporting on this
average effect, and report also where age-size interaction terms are significant.
Results using probit estimation applied to the binary response categories are
presented in Table 4. Robustness tests are described subsequently. The figures in
the body of the table indicate the ceteris paribus probability that a shift in firm
19 Size categories are: 6-19.5 FTEs (Small); 20-49.5 FTEs (Medium); > 50 FTEs (Large). Age refers to the time since establishment of the firm. We did not disaggregate the large firm under 10 year category into 5-10 years and under 5 years given the few observations in the category. 20 Where questions have more than two responses (e.g. not at all, a little, a moderate amount, a great deal) we enter each option as separate variables and retain those that are significant. In cases where initially estimated coefficients are similar for two categories and significantly different from those in the other categories we combine the significant categories to form one category (e.g. we may combine the responses to “a moderate amount” and “a great deal”). Ultimately, all practice variables that appear in the equations are binary variables. 21 To do so, we construct a dummy variable Di for each type of firm (i=1,…, 8) then construct seven interaction terms (Di-Di-1) for i=2,…, 8 which we multiplied by each explanatory variable.
15

characteristics or firm behaviour (from not adopting to adopting the practice) will be
associated with a lift in the firm’s business results from “low” to “high”.
Across the three equations, 17 practice variables are significant in one or more
equations; a further 8 variables representing characteristics of the economy, market
or firm, are significant. Significant age-size interaction terms, marked with (I), arise in
each equation.
We divide the significant practice questions into four categories, corresponding to our
conceptual discussion in section 2. The categories are capital-augmenting practices,
labour and/or efficiency-augmenting practices, R&D practices, and market research
practices.
Capital-augmenting practices are considered to impact primarily on capital quality (μi),
and hence to be productivity enhancing in the first instance. Having up-to-date core
equipment is the key capital-augmenting practice. Its effect is pervasive; having up-
to-date capital equipment has a positive and significant impact on each of
productivity, profitability and market share. Ceteris paribus, the mean firm has
between a 9% and 13% greater probability of being in the “high” performance
category for each of profitability, productivity and market share if it has up-to-date
core equipment.
Six employee-related practices are significant. Conceptually, these are most likely to
impact on labour quality (λi), although they could also impact on Ai (general efficiency)
if they lead to more efficient combination of factors of production through better intra-
firm processes. Having performance pay systems (for many or all staff) has a
significant relationship with profitability at the 1% level. The mean firm has a 12%
greater probability of being in the high profitability category if it has performance pay.
The significance of this variable is consistent with the findings of Lazear (2000) with
respect to performance pay in the US glass industry.
The finding that a range of employee (human resource) practices is significant (i.e.
measuring employee satisfaction, job rotation, delegating authority to employees,
adopting performance pay and investing in training), is consistent with Ichniowski et
al’s (1997) findings that a package of human resource practices is important for firm
performance. It is also consistent with a resource-based theory of firm performance,
16

with emphasis on the importance of employee resources for firm success. One HR
practice is found to have a negative impact on firm performance: having health and
safety processes in place. It is possible that this represents a regulatory cost in which
firms incur costs when they meet (or have to meet) certain health and safety
regulatory requirements.
Five R&D practices have a significant positive association with business results.
Firms that commission external R&D and/or conduct internal R&D perform well on
profitability and productivity. In each case, the mean firm has between a 15% and
21% greater probability of being a high performer if it undertakes one of these forms
of R&D. Ceteris paribus, firms that derive at least 30% of sales from new products
and/or spend a high portion of their budget on innovation development have a higher
probability of favourable market share than do other firms. These practices are most
likely to impact on the production function through Ai or μi, with effects also on
product quality (νi).
Related to the R&D findings are those for market research. Not surprisingly, most
market research practices relate positively to market share. One result – the negative
association between market share and use of Industry NZ as a very important source
of innovation ideas – is curious. Industry NZ is a government-sponsored organisation
designed to assist development of domestic firms. It is possible that a selection effect
is at work here; firms that are struggling in the market may be those that are most
likely to use Industry NZ (rather than other organisations) as a major source of
innovation ideas. Our results therefore do not imply that Industry New Zealand
assistance itself is counter-productive.
Of the 17 significant practice variables, there is only one (focusing on new export
markets) in which the relationship between the practice and the business result
varies significantly by firm type. We find that this practice is only significant for small
and medium sized firms that have been in operation for up to ten years; it is not
significant for old or large firms. This finding is intuitively sensible since new export
marketing is particularly important for the growth prospects of younger, growing firms.
Older, larger firms tend already to be exporters or to have taken a prior decision to
operate solely within the domestic market.
17

Of the 8 characteristics variables, 6 are of the form in which the characteristic
represents a perceived barrier to performance. Firms seeing these characteristics as
barriers to performance also (consistently) reported that one or more of their
business results was unfavourable. Three of these questions relate to some form of
finance constraint. We cannot ascertain the direction of causality from the data with
certainty. We note, however, that each of the three relationships is negative and
significant for profitability, but only one is significant for productivity and none is
significant for market share. This may suggest that the dominant direction of causality
is unprofitable firms finding it difficult to access finance, rather than a lack of access
to finance causing wider problems for the firm.
Market structure appears to be important for business results consistent with
industry-based theories of firm performance. Operating in an oligopolistic (rather than
a competitive or single seller) market has benefits for each of profitability and
productivity, while those that see competition as a barrier to innovation have
significantly negative business outcomes across all three measures. The sector in
which a firm operates is important for profitability, with agriculture/forestry/fishing
firms performing relatively poorly on this measure. We find that small, young firms in
this sector are particularly likely to have low profitability.
We have subjected the results presented in Table 4 to a number of robustness
checks. First, we re-entered firm demographic variables into the equations to test if
they were significant when added at the end of the estimation process. We entered
each of the age and size categories separately; none was significant in any of the
three equations. Simultaneously, we entered the thirteen (1-digit) sector dummies
(noting that agriculture is already included in the profitability equation). No sector
dummies were significant when added to the profitability or productivity equations.
Eight sector dummies were significant at 5% when added to the market share
equation. However, in this case the remaining estimates were hardly changed; all
variables retained the same sign and were significant at 5% other than the job
rotation and market size variables, significant at the 10% level.
Second, we re-entered each variable that was significant at the 20% level in the
general-to-specific search to test (a) whether it is significant at the 5% level when
added to the final specification, and (b) whether any variable in the final specification
18

becomes insignificant at 5%. No changes were recorded in the profitability or
productivity equations. In the market share equation, no variable is significant at 5%
when added, but the job rotation variable is no longer significant in the presence of
each of three other included variables.22 Correspondingly, we do not emphasise the
importance of job rotation in our discussion. Apart from this case, the significance of
each variable across the three equations is robust to the addition of the other
demographic, practice and characteristics variables.
As a final robustness check, we re-estimate the equations presented in Table 4 using
ordered probit, incorporating the three response categories (high, neutral, low) for
each of the dependent variables. We emphasise that the potential for respondent
bias (answering in the neutral rather than the unfavourable category when the latter
is objectively more appropriate) means that we place less reliance on the ordered
probit than the standard probit results. The issue appears to be most acute for
productivity, where fewer than 4% of respondents considered their firm to have lower
than average productivity as opposed to almost exactly a third who considered they
had higher than average productivity. Thus we do not expect the data to be able to
discriminate as strongly between the three groups as between the binary categories.
In keeping with our priors, the R2 of each ordered probit equation falls relative to the
corresponding equation in Table 4. The ordered probit equations correctly predict a
slightly greater proportion of “high” performers than does the standard probit
approach, but are poor in discriminating accurately between neutral and low
performers. A number of variables are no longer significant in the ordered probit
regression. However all variables remain of the same sign, and at least half of the
variables remain significant at the 5% level in each equation. The profitability
equation has the greatest explanatory power (R2 = 0.086) with strong positive
associations between profitability and each of: up-to-date core equipment,
performance pay, external and internal R&D, oligopoly market structure and two
finance-related variables.23 Thus, as with the standard probit results, the ordered
22 The three variables relate to the importance of a firm’s flexibility strategy, overseas ownership, and linkages with universities and polytechnics. 23 Significant variables in the relative productivity equation are: measuring employee satisfaction; staff visits to major customers; oligopolist; competition reported as a barrier; and external borrowing not available. Significant variables in the market share equation are: core equipment fully up-to-date; focus on new export markets; Industry NZ a source of innovation ideas; economic climate reported as a barrier; competition reported as a barrier; and market too small or unknown.
19

probit estimates indicate that both industry structure and internal firm practices are
important for firm success.
The importance of both internal firm-resource-based factors and industry factors
mirrors the results of Spanos and Lioukas (2001) that each set of factors is relevant
to rent generation. We find that firms operating in an oligopolistic market tend to have
favourable results relative to firms operating in other market structures. Nevertheless,
internal firm management practices are important in determining firm performance
notwithstanding the market structure in which the firm operates.
These results relate to the effects of individual firm practices and (internal and
external) characteristics on business results. In Figure 1, we use the probit estimates
to plot kernel densities for sub-samples of firms to demonstrate the impact business
practices and characteristics have on the likelihood of being a “high” (favourable)
versus a “low” (unfavourable/neutral) performer for each business result. We divide
the sample into firms that had “high” performance on each metric; those that had
“low” performance, and the “don’t knows”. Figure 1 demonstrates that the “high”
performers’ probability distribution sits to the right of the “low” performers’ distribution
for each of the business results. This is to be expected since the two groups together
constitute the sample over which each equation was estimated.
More important as a test of the robustness of our methodology is the profile of the
“don’t know” sub-sample. The predictions for this group are completely out of sample;
i.e. we excluded this group from our probit estimations. For each business result, the
kernel density of the “don’t know” group is either very similar to that of the “low”
performers (productivity and market share) or sits to the left of the low performers
indicating still worse performance (profitability). The “don’t know” curve sits to the left
of the high performers in each case. These results provide out-of-sample
confirmation of our findings. The practices and firm characteristics presented in Table
4 are able to differentiate (out-of-sample) between firms that consider they perform
well for each business result from those that do not know how to regard their
performance.
20

Conclusions
Our work focuses on the association of firms’ business results with their business
practices and the firm’s characteristics. Spanos and Lioukas (2001) find that both
internal firm practices and external (industry) characteristics are important in
determining firm performance. Consistent with their findings and with those of
Haltiwanger et al (2000) and Bloom et al (2005), we find that firm heterogeneity
pertaining to features both internal and external to the firm are associated with
business success.
Four categories of business practices are found to be particularly important. The first
is investment in up-to-date capital equipment, which we interpret as a capital-
augmenting practice. Labour-augmenting (and/or efficiency-enhancing) employee-
related practices constitute the second group. This group includes incentive practices
(adoption of performance pay for most employees) and more general HR practices
(e.g. measuring employee satisfaction). The third and fourth groups relate to R&D
and market research. R&D practices are associated positively with each of the
business results, whereas market research is associated primarily with higher market
share.
Industry structure is also found to be important. Firms that operate in an oligopolistic
setting, and/or do not perceive competition as a barrier to innovation, tend to perform
well on all three measures of performance. This finding is consistent with industry-
based approaches to competitive advantage. While we cannot ascertain causality,
the results suggest that industry factors are not the sole determinants of competitive
advantage; capabilities and resource use within the firm are also important.
Successful firms are “up with the play” in terms of capital equipment and product and
process development. They complement these innovation practices through their
attention to human resources within the firm. Successful firms emphasise
mechanisms to incentivise and reward performance and pay attention to a range of
human resource management practices.
Our results are derived from analysis of almost 3,000 firms that are carefully sampled
to be representative of an entire economy. The results from this large sample
complement insights gained from case studies of successful firms and from smaller
21

(and less representative) surveys. Case study results and commercial instinct
suggest that innovative firms that look after their staff and which operate in an
oligopolistic setting, will tend to be in the upper tier of business performers. Our
analysis, using a new and much wider dataset than previous studies, is consistent
with this intuition.
22

Figures
Figure 1: Kernel Densities by Business Result
Relative profitability
0
1
2
3
4
5
0.0 0.1 0.2 0.3 0.4 0.5 0.6 0.7 0.8 0.9 1.0
Relative productivity
0
1
2
3
4
5
0.0 0.1 0.2 0.3 0.4 0.5 0.6 0.7 0.8 0.9 1.0
Market share
0
1
2
3
4
5
0.0 0.1 0.2 0.3 0.4 0.5 0.6 0.7 0.8 0.9 1.0
23

High performers
Low performers
Don't knows (out of sample)
24

Tables
Table 1: Summary of responses to business result questions
Response*relative
profitability1relative
ROI1relative
productivity1market share2 profitability2
net cashflow3 sales2
Low 10.2% 9.8% 3.8% 10.3% 23.3% 16.1% 16.5%Neutral 40.8% 35.6% 41.5% 25.4% 24.4% 22.1% 21.3%High 26.6% 25.0% 33.6% 55.5% 49.1% 57.6% 59.4%Don't Know 22.5% 29.6% 21.2% 8.8% 3.3% 4.2% 2.8%
Inferred 1.1% 1.9% 1.4% 1.4% 0.6% 0.4% 0.7%
Response converted to binary variable"Low" 65.8% 64.4% 57.4% 39.2% 49.2% 39.9% 38.9%"High" 34.3% 35.6% 42.6% 60.8% 50.8% 60.1% 61.1%
Sample size 2147 2002 2191 2529 2655 2646 2676
Surveyed business result
Survey responses fall into three groups (corresponding to superscripts after business result variables): 1 Low = lower than competitors, Neutral = on a par with competitors, High = higher than competitors 2 Low = decreased, Neutral = stayed the same, High = increased 3 Low = negative, Neutral = neutral, High = positive
Table 2: Percentage of firms with same binary response across business results
Binary business result
relative profitability
relative ROI
relative productivity
market share profitability net
cashflow
relative ROI 91%relative productivity 77% 75%market share 57% 57% 59%profitability 65% 63% 61% 74%net cashflow 62% 60% 59% 66% 71%sales 56% 55% 55% 79% 76% 70%
Binary business result
25
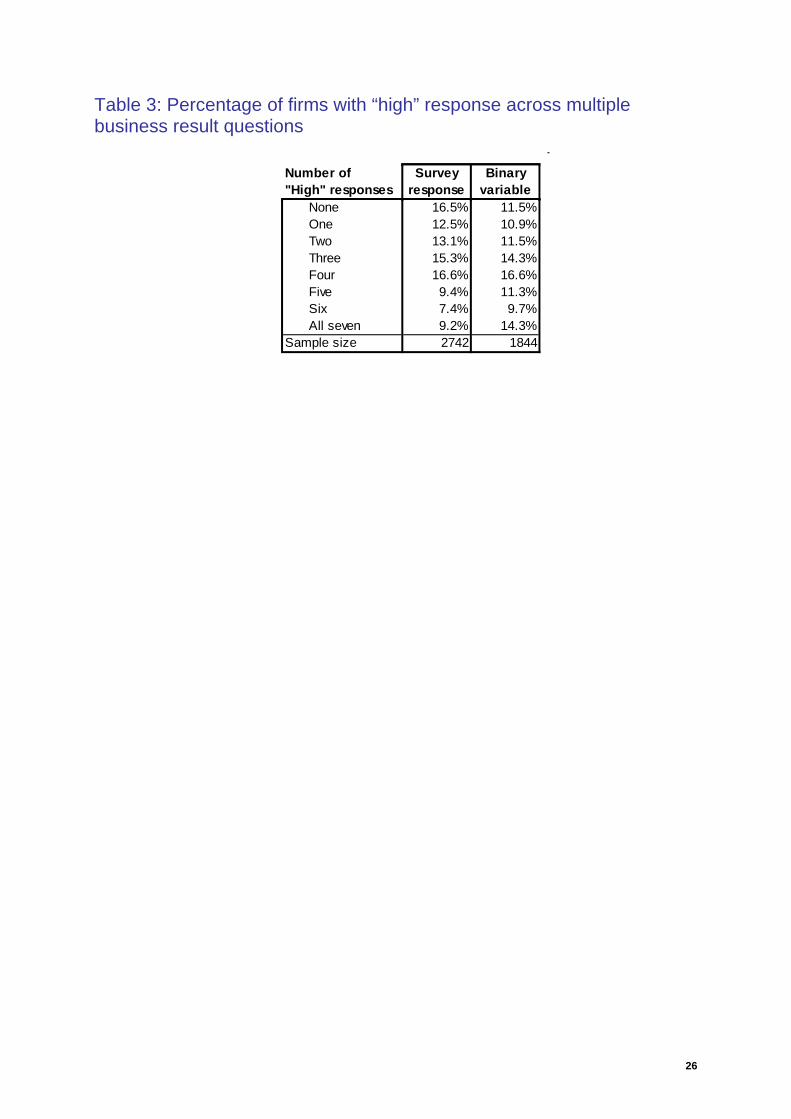
Table 3: Percentage of firms with “high” response across multiple business result questions
Number of"High" responses
Survey response
Binary variable
None 16.5% 11.5%One 12.5% 10.9%Two 13.1% 11.5%Three 15.3% 14.3%Four 16.6% 16.6%Five 9.4% 11.3%Six 7.4% 9.7%All seven 9.2% 14.3%
Sample size 2742 1844
26

Table 4: Business Results Explained by Practices and Characteristics
Survey questionPracticesCapital-augmentingCore equipment fully up-to-date (Productivity: equipment at most 4 years behind) 0.091* 0.122** 0.131**
(0.015) (0.009) (0.000)Labour and/or efficiency-augmentingInvestment in innovation-related employee training 0.125**
(0.001)Performance pay for many or all staff 0.121**
(0.007)Measure employee satisfaction at least bi-annually 0.131**
(0.001)Non-managerial staff always have authority to contact suppliers over problems 0.084*
(0.044)Health & safety processes in place -0.124*
(0.024)More than 50% of employees rotated job over last year 0.115*
(0.048)R&DCommissioned external R&D over past year 0.169** 0.152**
(0.000) (0.002)Over 20% of total expenditure on development of innovations 0.161*
(0.020)Conducted continuous in-house R&D over past two years 0.205**
(0.001)Company used some method to protect their inventions 0.103**
(0.010)Over 30% of sales from completely new goods/services 0.140*
(0.020)Market researchA great deal of focus on new domestic markets 0.120**
(0.001)At least a little focus on new export markets 0.184** (I)
(0.000)A great deal of staff visits to major customers 0.119*
(0.013)Very close monitoring of competitors' goods/services 0.123**
(0.004)Industry New Zealand a very important source of ideas for innovations -0.311**
(0.001)CharacteristicsGeneral economyEconomic climate reported as a barrier to innovation -0.120** (I)
(0.001)IndustryFirm in agriculture, forestry & fishing industries (ANZSIC group A) -0.098* (I)
(0.021)Oligopolist 0.186** 0.169**
(0.000) (0.001)Competition reported as a barrier to innovation -0.110** -0.158** (I) -0.086*
(0.008) (0.000) (0.040)Market too small or unknown reported as a barrier to innovation -0.098*
(0.049)FinanceExternal borrowing was not available when sought in past year -0.224* -0.202*
(0.017) (0.043)Availability of finance reported as a barrier to improved performance -0.138*
(0.011)Access to capital reported as a barrier to innovation -0.121*
(0.013)R2 0.121 0.075 0.125
Business Result Equationrelative
profitabilityrelative
productivitymarketshare
Table Note:
Reported coefficients are the predicted impact on the probability of being in the “high”
response category if the relevant dummy variable were to change from zero to one,
holding all other independent variables at their means. P-values are shown in
27

brackets below the coefficients: ** denotes significance at the 1% level; * denotes
significant at the 5% level. (I) indicates coefficient has age/size interaction terms
jointly significant at 5%. R2 is the log likelihood expressed on a scale of 0 (constant-
only) to 1 (perfect prediction). An F-test for joint significance of all variables has p-
value =0.0000 in each equation.
28

References
Aghion, Philippe & Peter Howitt (1998) Endogenous Growth Theory, Cambridge, MA: MIT Press
Amit R. & P.J.H. Shoemaker (1993) “Strategic Assets and Organisational Rent”, Strategic Management Journal, 14(1), 33-46
Ansoff, H.I. (1987) Corporate Strategy, revised edition, Harmondsworth: Penguin Books
Australian Manufacturing Council (1994) Leading the Way – A Study of Best Manufacturing Practices in Australia and New Zealand, Melbourne
Barney, J.B. (2002) Gaining and Sustaining Competitive Advantage, 2nd edition, New Jersey: Prentice Hall
Barney, J.B. & A.M. Arikan (2001) “The Resource-Based View: Origins and Implications” in M.A. Hitt et al (eds.) The Blackwell Handbook of Strategic Management, Oxford: Blackwell
Baumol, William (2002) The Free-Market Innovation Machine, Princeton: Princeton University Press
Bertrand, M. & S. Mullainathan (2001) “Do People Mean What They Say? Implications for Subjective Survey Data”, American Economic Review (Papers and Proceedings), 91(2), 67-72
Bloom, N., S. Dorgan, J. Dowdy, J, Van Reenan, & T. Rippin (2005) Management Practices Across Firms and Nations, Centre for Economic Performance, London School of Economics
Bresnahan, T.F., E. Brynjolfsson & L.M. Hitt (1999) Information Technology, Workplace Organisation, and the Demand for Skilled Labour, NBER Working Paper No. 7136, Cambridge Mass: NBER
Day, G.S. (1990) Market Driven Strategy: Processes for Creating Value, New York: The Free Press
Eisenhardt, K.M. & J.A. Martin (2000) “Dynamic Capabilities: What are They?”, Strategic Management Journal, 21(10), 1105-1121
Fabling, Richard & Arthur Grimes (2003) Practice Makes Profit: Business Practices for Firm Success, Paper presented to New Zealand Association of Economists Conference, Auckland
Grant, R.M. (1998) Contemporary Strategy Analysis, 3rd edition, Oxford: Blackwell
Griliches, Zvi (1994) R&D and Productivity: The Econometric Evidence, Chicago: University of Chicago Press
29

Haltiwanger, John, Julia Lane and James Speltzer (1999) “Productivity Differences Across Employers: The Roles of Employer Size, Age, and Human Capital”, American Economic Review, 89(2), 94-98
Haltiwanger, John, Julia Lane and James Speltzer (2000) Wages, Productivity, and the Dynamic Interaction of Businesses and Workers, NBER Working Paper No. 7994, Cambridge Mass: NBER
Hewitt-Dundas, Nola & Stephen Roper (2001) “Strategic Re-Engineering: Small Firms’ Tactics in a Mature Industry”, Small Business and Enterprise Development, 8(3), 317-336
Ichniowski, Casey, Kathryn Shaw & Giovanna Prennushi (1997) “The Effects of Human Resource Management Practices on Productivity: A Study of Steel Finishing Lines”, American Economic Review 87(3), June, 291-313
Kelejian H.H. and S.W. Black (1970) “A Macro Model of the US Labor Market”, Econometrica 38(5), September
Knuckey, Stephen, J. Leung-Wai & M. Meskill (1999) Gearing Up: A Study of Best Manufacturing Practice in New Zealand, Wellington: Ministry of Commerce
Knuckey, Stephen & Hayden Johnston with Colin Campbell-Hunt, Ken Carlaw, Lawrence Corbett & Claire Massey (2002) Firm Foundations: A Study of New Zealand Business Practices & Performance, Wellington: Ministry of Economic Development, www.med.govt.nz/templates/ContentTopicSummary____2259.aspx
Lazear, Edward (2000) “Performance Pay and Productivity”, American Economic Review 90(5), December, 1346-1361
Makadok, R. (2001) “Toward a Synthesis of the Resource-Based and Dynamic Capability Views of Rent Creation”, Strategic Management Journal, 22, 387-401
Ministry of Economic Development (2003) SMEs in New Zealand: Structure and Dynamics, September, Wellington
Mintzberg, H., B. Ahlstrand & J. Lampel (1998) Strategy Safari: A Guided Tour Through the Wilds of Strategy Management, London: Prentice Hall
Nickell, S. & D. Nicolitsas (2000) “Human Capital, Investment and Innovation: What are the Connections?” In R. Barrell, G. Mason & M. O’Mahony (eds) Productivity, Innovation and Economic Performance, Cambridge: Cambridge University Press
Penrose, E.T. (1959) The Theory of the Growth of the Firm, Oxford: Basil Blackwell
Porter, M.E. (1980) Competitive Strategy: Techniques for Analyzing Industries and Competitors, New York: The Free Press
Porter, M.E. (1985) Competitive Advantage: Creating and Sustaining Superior Performance, New York: The Free Press
Reserve Bank of New Zealand (2005) Monetary Policy Statement, June, Wellington
30

Roper, Stephen (1998) “Entrepreneurial Characteristics, Strategic Choice and Small Business Performance”, Small Business Economics, 11(1), 11-24
Spanos, Y.E. & S. Lioukas (2001) “An Examination into the Causal Logic of Rent Generation: Contrasting Porter’s Competitive Strategy Framework and the Resource-Based Perspective”, Strategic Management Journal, 22, 907-934
Statistics New Zealand (2002) Business Practices Survey: Technical Report, Wellington
Syverson, C. (2004) “Product Substitutability and Productivity Dispersion”, Review of Economics and Statistics, 86, 534-550
Teece, D.J., G. Pisano & A. Shuen (1997) “Dynamic Capabilities and Strategic Management”, Strategic Management Journal, 18(7), 509-533
UK Treasury (2000) Productivity in the UK: The Evidence and the Government’s Approach, November, London
Varadarajan, P.R. & S. Jayachandran (1999) “Marketing Strategy: An Assessment of the State of the Field and Outlook”, Journal of Marketing Science, 27(2), 120-143
Wernefelt, B. (1984) “A Resource-Based View of the Firm”, Strategic Management Journal, 5, 171-180
31