Embed Size (px)
Citation preview

This document has 12 pages. Any blank pages are indicated.
Cambridge IGCSE™
BIOLOGY 0610/63
Paper 6 Alternative to Practical May/June 2021
1 hour
You must answer on the question paper.
No additional materials are needed.
INSTRUCTIONS ● Answer all questions. ● Use a black or dark blue pen. You may use an HB pencil for any diagrams or graphs. ● Write your name, centre number and candidate number in the boxes at the top of the page. ● Write your answer to each question in the space provided. ● Do not use an erasable pen or correction fluid. ● Do not write on any bar codes. ● You may use a calculator. ● You should show all your working and use appropriate units.
INFORMATION ● The total mark for this paper is 40. ● The number of marks for each question or part question is shown in brackets [ ].
*3962910580*
DC (LK/SG) 202984/4© UCLES 2021 [Turn over

2
0610/63/M/J/21© UCLES 2021
1 Vitamin C is an important component of a balanced diet. Many health drinks contain vitamin C.
A student estimated the concentration of vitamin C in a health drink by comparing it to solutions with known concentrations of vitamin C.
DCPIP is an indicator for vitamin C. When added to a vitamin C solution, the blue DCPIP reacts with vitamin C and becomes colourless. Drops of DCPIP are added to the vitamin C solution until the solution remains blue.
Step 1 The student labelled four beakers A, B, C and D and used the information in Table 1.1 to make the vitamin C solutions in the four labelled beakers.
Table 1.1
beaker volume of 1.00% vitamin C solution / cm3
volume of water / cm3
final percentage concentration of vitamin C
A 10 30 0.25
B 20 20 0.50
C 30 10
D 40 0 1.00
(a) (i) Complete Table 1.1 by calculating the final percentage concentration of vitamin C in beaker C.
...................................................... % [1]
Step 2 A syringe was used to transfer 0.5 cm3 of the vitamin C solution from beaker A into a test‑tube labelled A.
Step 3 The student filled a dropping pipette with a 1% DCPIP solution and added one drop at a time to test‑tube A. The blue colour disappeared as vitamin C reacted with the DCPIP.
The number of drops was counted as they were added to the test‑tube.
Step 4 The student stopped adding drops of DCPIP to test‑tube A when the solution remained blue in colour when a drop was added. The total number of drops of DCPIP added was recorded.
Step 5 The student then repeated steps 2 to 4 using the solutions from beakers B, C and D and test‑tubes labelled B, C and D.
Step 6 The student then repeated steps 2 to 5 to obtain a second set of results.

3
0610/63/M/J/21© UCLES 2021 [Turn over
The student’s results are shown in Fig. 1.1.
Trial 1
test-tube A = 6 drops
test-tube B = 13 drops
test-tube C = 18 drops
test-tube D = 23 drops
Trial 2
test-tube A = 4 dropstest-tube B = 11 drops test-tube C = 18 drops test-tube D = 21 drops
Fig. 1.1
(ii) Prepare a table to record the results shown in Fig. 1.1.
Your table should include the average of the two trials.
[5]
4
0610/63/M/J/21© UCLES 2021
(iii) State a conclusion for the student’s results.
...........................................................................................................................................
...........................................................................................................................................
..................................................................................................................................... [1]
(iv) Suggest why the student repeated the investigation.
...........................................................................................................................................
...........................................................................................................................................
..................................................................................................................................... [1]
Step 7 The student put 0.5 cm3 of health drink H into a clean test‑tube. They then added drops of 1% DCPIP to the test‑tube until the solution in the test‑tube remained blue.
A total of 10 drops of DCPIP were added to the sample of health drink H.
(v) Estimate the percentage concentration of vitamin C in health drink H, using the information in Table 1.1, your table in 1(a)(ii) and step 7.
...................................................... % [1]
(vi) Suggest two improvements to the method that would allow a more precise estimation of the vitamin C concentration in health drink H.
1 ........................................................................................................................................
...........................................................................................................................................
2 ........................................................................................................................................
........................................................................................................................................... [2]
(vii) Identify two variables that were kept constant in this investigation.
1 ........................................................................................................................................
2 ........................................................................................................................................ [2]

5
0610/63/M/J/21© UCLES 2021 [Turn over
(b) Explain why counting the number of drops of DCPIP is not accurate.
...................................................................................................................................................
...................................................................................................................................................
............................................................................................................................................. [1]
(c) The manufacturers of health drink H claim that it also contains protein and glucose.
Describe how you would test health drink H for protein and glucose.
Include the results for a positive test.
protein .......................................................................................................................................
...................................................................................................................................................
...................................................................................................................................................
...................................................................................................................................................
...................................................................................................................................................
glucose .....................................................................................................................................
...................................................................................................................................................
...................................................................................................................................................
...................................................................................................................................................
...................................................................................................................................................
...................................................................................................................................................
...................................................................................................................................................
................................................................................................................................................... [5]
[Total: 19]

6
0610/63/ M / J /21 © UCLES 2021
2 (a) Fig. 2.1 is a leaf from a plant.
A
B actual size
Fig. 2.1
(i) Make a large drawing of the leaf in Fig. 2.1.
[4]

7
0610/63/M/J/21© UCLES 2021 [Turn over
(ii) Measure the length of line AB in Fig. 2.1. Include the unit.
length of line AB ...................................................
Draw a line on your drawing in 2(a)(i) to show the position of line AB.
Measure this line on your drawing. Include the unit.
length of the line on your drawing ....................................................
Calculate the magnification of your drawing using your measurements and the equation:
magnification = length of the line on your drawinglength of line AB in Fig. 2.1
................................................................ [3]

8
0610/63/M/J/21© UCLES 2021
(b) A student used an aquatic plant to investigate the effect of carbon dioxide concentration on the rate of photosynthesis. The production of oxygen gas can be used as an estimate of the rate of photosynthesis.
The student set up the apparatus shown in Fig. 2.2. He counted the number of bubbles produced in 5 minutes. The carbon dioxide concentration in the water around the aquatic plant was 2 mg per dm3.
He repeated the experiment with five different concentrations of carbon dioxide.
lamp
bubbles containing oxygen gas
aquatic plant
water
Fig. 2.2
The student’s results are shown in Table 2.1.
Table 2.1
carbon dioxide concentration / mg per dm3
number of bubbles produced in 5 minutes
2 4
4 14
6 20
8 25
10 35
12 35
9
0610/63/M/J/21© UCLES 2021
(i) Plot a line graph on the grid of the data in Table 2.1.
[4]
(ii) Describe the trend shown on your graph in 2(b)(i).
...........................................................................................................................................
...........................................................................................................................................
..................................................................................................................................... [1]
[Turn over
10
0610/63/M/J/21© UCLES 2021
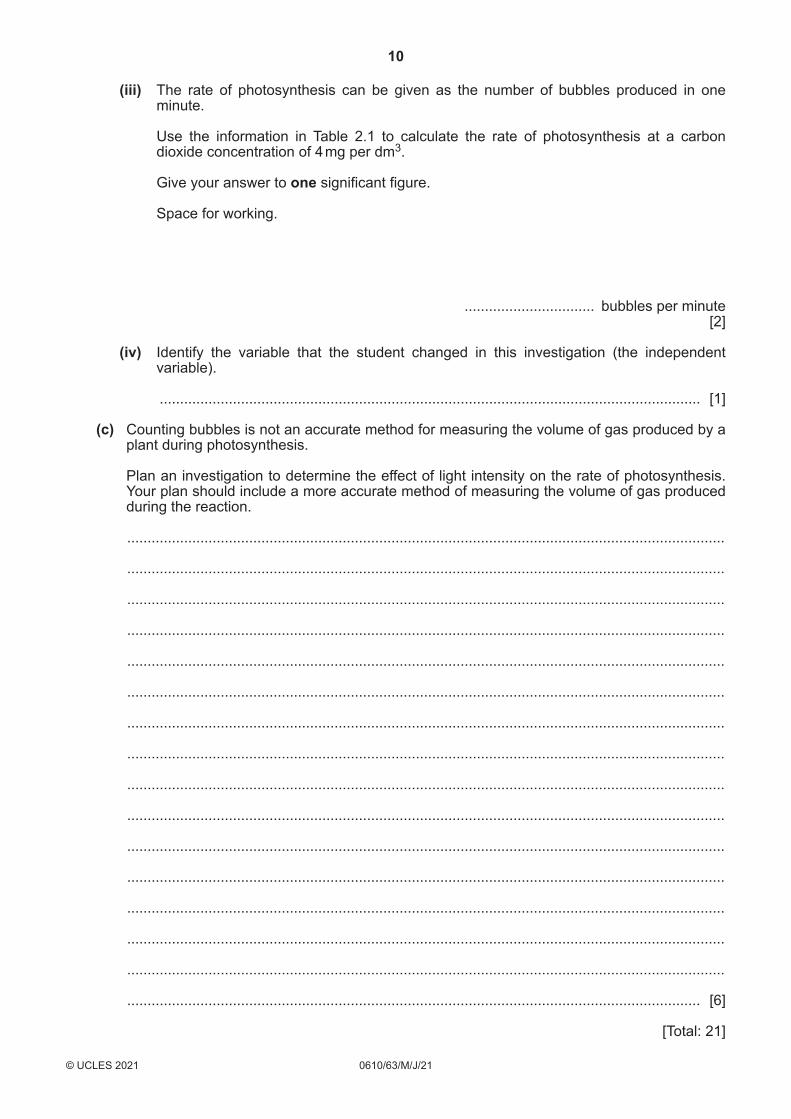
(iii) The rate of photosynthesis can be given as the number of bubbles produced in one minute.
Use the information in Table 2.1 to calculate the rate of photosynthesis at a carbon dioxide concentration of 4 mg per dm3.
Give your answer to one significant figure.
Space for working.
................................ bubbles per minute [2]
(iv) Identify the variable that the student changed in this investigation (the independent variable).
..................................................................................................................................... [1]
(c) Counting bubbles is not an accurate method for measuring the volume of gas produced by a plant during photosynthesis.
Plan an investigation to determine the effect of light intensity on the rate of photosynthesis. Your plan should include a more accurate method of measuring the volume of gas produced during the reaction.
...................................................................................................................................................
...................................................................................................................................................
...................................................................................................................................................
...................................................................................................................................................
...................................................................................................................................................
...................................................................................................................................................
...................................................................................................................................................
...................................................................................................................................................
...................................................................................................................................................
...................................................................................................................................................
...................................................................................................................................................
...................................................................................................................................................
...................................................................................................................................................
...................................................................................................................................................
...................................................................................................................................................
............................................................................................................................................. [6]
[Total: 21]

11
0610/63/M/J/21© UCLES 2021
BLANK PAGE

12
0610/63/M/J/21© UCLES 2021
Permission to reproduce items where third‑party owned material protected by copyright is included has been sought and cleared where possible. Every reasonable effort has been made by the publisher (UCLES) to trace copyright holders, but if any items requiring clearance have unwittingly been included, the publisher will be pleased to make amends at the earliest possible opportunity.
To avoid the issue of disclosure of answer‑related information to candidates, all copyright acknowledgements are reproduced online in the Cambridge Assessment International Education Copyright Acknowledgements Booklet. This is produced for each series of examinations and is freely available to download at www.cambridgeinternational.org after the live examination series.
Cambridge Assessment International Education is part of the Cambridge Assessment Group. Cambridge Assessment is the brand name of the University of Cambridge Local Examinations Syndicate (UCLES), which itself is a department of the University of Cambridge.
BLANK PAGE


![0610/63 Biology June 2020 184705€¦ · The total mark for this paper is 40. The number of marks for each question or part question is shown in brackets [ ]. 2 UCLES 2020 0610/63/M/J/20](https://img.pdfslide.net/doc/110x75/6018809a9c4b6a150e0c8040/061063-biology-june-2020-184705-the-total-mark-for-this-paper-is-40-the-number.jpg)