Embed Size (px)
Citation preview

7/23/2019 06b 2014 WP 4 Hydrology Report
http://slidepdf.com/reader/full/06b-2014-wp-4-hydrology-report 1/103
[Hydrology Report] 1
Gräfenberg, Germany, 21 April 2015
Hydrology Report

7/23/2019 06b 2014 WP 4 Hydrology Report
http://slidepdf.com/reader/full/06b-2014-wp-4-hydrology-report 2/103
Nigerian Energy Support Programme
Hydrology Report
Published by:Deutsche Gesellschaft fürInternationale Zusammenarbeit (GIZ) GmbH
Nigerian Energy Support Programme (NESP)4 Julius Nyerere Crescent, Asokoro
Abuja/NigeriaContact: Daniel Werner ([email protected])T 00234 (0)8057601986
Federal Ministry of PowerFederal Secretariat ComplexShehu Shagari Way, Maitama
Abuja / NigeriaContact: Engr. Faruk Yusuf Yabo ([email protected])
This project is funded by the European Union& the German Federal Ministry for Economic Cooperation and Development (BMZ)
Author/Responsible/Editor etc.:Oliver J. Haas, Karl Tiller, Jakob Schmidt Reindahl
Photo credits-
Maps-The geographical maps are for informational purposes only and do not constitute recognition ofinternational boundaries or regions; GIZ makes no claims concerning the validity, accuracy orcompleteness of the maps nor assumes any liability resulting from the use of the information therein.
Printed and distributed by:
Place and date of publication
This document was produced with the financial assistance of the European Union. The views expressedherein can in no way be taken to reflect the official opinion of the European Union.

7/23/2019 06b 2014 WP 4 Hydrology Report
http://slidepdf.com/reader/full/06b-2014-wp-4-hydrology-report 3/103
Nigerian Energy Support Programme
Hydrology Report
Contents
1. Acronyms ........................................................................................................... 1
2. Executive Summary ........................................................................................... 2
3. Report Background.......................................................................................... 10
4. Available Data .................................................................................................. 11
Hydrological Data ................................................................................................................... 11
Meteorological Data ............................................................................................................... 13
5. Surface Water Resources ................................................................................ 16
Overview ................................................................................................................................ 16
Sokoto .................................................................................................................................... 22
Plateau ................................................................................................................................... 23
Niger ....................................................................................................................................... 23
Ogun....................................................................................................................................... 27
Cross River ............................................................................................................................. 29
6. Site Specific Hydrological Assessment ......................................................... 33
Overview ................................................................................................................................ 33
Source Gauging Stations ....................................................................................................... 34
Cross River sites: Egaga Fall and Busi II ........................................................................... 34
Niger site: Tapa .................................................................................................................. 36
Egaga Fall .............................................................................................................................. 40
Location and general features ............................................................................................ 40
Flow Assessment ................................................................................................................ 41
Flow Duration Curve ........................................................................................................... 44
Ecological Flow ................................................................................................................... 45
Busi II ..................................................................................................................................... 45
Location and general features ............................................................................................ 45
Flow Assessment ................................................................................................................ 46
Flow Duration Curve ........................................................................................................... 49
Ecological Flow ................................................................................................................... 49
Tapa ....................................................................................................................................... 50
Location and general features ............................................................................................ 50
Flow Assessment ................................................................................................................ 51

7/23/2019 06b 2014 WP 4 Hydrology Report
http://slidepdf.com/reader/full/06b-2014-wp-4-hydrology-report 4/103
Nigerian Energy Support Programme
Hydrology Report
Flow Duration Curve ........................................................................................................... 54
Ecological Flow ................................................................................................................... 54
7. Conclusions ..................................................................................................... 55
Annexes...................................................................................................................... I Annexe 1 ................................................................................................................................... I
Annexe 2 ................................................................................................................................... I
Annexe 3 ................................................................................................................................... I
Annexe 4 .................................................................................................................................. II
Annexe 5 ................................................................................................................................ IV
Annexe 6 ............................................................................................................................... XII
Annexe 7 .............................................................................................................................. XIII Annexe 8 ............................................................................................................................ XVIII
Annexe 9 ............................................................................................................................... XX
Annexe 10 ......................................................................................................................... XXIV
Annexe 11 ......................................................................................................................... XXVI
Annexe 12 ........................................................................................................................ XXVII
Annexe 13 ......................................................................................................................... XXIX
Annexe 14 .......................................................................................................................... XXX Annexe 15 ....................................................................................................................... XXXIV
7/23/2019 06b 2014 WP 4 Hydrology Report
http://slidepdf.com/reader/full/06b-2014-wp-4-hydrology-report 5/103
Nigerian Energy Support Programme
Hydrology Report
1
1. Acronyms
AFD Agence Française de Développement
BP Business processDISCOs Power Distribution Companies
DLR Deutschen Zentrums für Luft- und Raumfahrt []),
EoI Expression of interest
FMP Federal Ministry of Power
GIS Geospatial information systems
GIS-DMS GIS-based data management system
GIZ Deutsche Gesellschaft für Internationale Zusammenarbeit, GmbH
GSDI Geospatial data infrastructure
ISO International Standard Organisation
KPI Key performance indicatorkW kilo Watt
LCCA Life-cycle cost analysis
MW Mega Watt
NEPA National Electric Power Authority
NERC Nigerian Electricity Regulatory Commission
NESP Nigerian Energy Support Programme (implemented by GIZ)
OGC Open Geospatial Consortium
OLURN Operation Light Up Rural Nigeria
OP Operational plan
PV Photovoltaics
R/ESCOS (Renewable) Energy service company
RE Renewable energy
REA Rural Electrification Agency
RLI Rainer Lemonie Institute
RrE Rural electrification
RrE-Plan Rural electrification plan
SE4All Sustainable Energy For All
SEL The Sustainable Engineering Lap (Earth Institute - Columbia University)
SHP Small hydro power
SLD Standard layer descriptor
ToR Terms of Reference
WG Working group
WP Work package

7/23/2019 06b 2014 WP 4 Hydrology Report
http://slidepdf.com/reader/full/06b-2014-wp-4-hydrology-report 6/103
Nigerian Energy Support Programme
Hydrology Report
2
2. Executive Summary
Nigeria Hydrological Service Agency (NIHSA) is the responsible agency for hydrological monitoring
in Nigeria. The Japan International Cooperation Agency (JICA), in collaboration with NIHSA,
delineated at the National Water Resources Master Plan 2013, Hydrological Areas (HA) and Sub
Hydrological Areas (SHA). As a result eight HA and 168 SHAs were defined (Figure 2.1).
Figure 2.1 – Map with Hydrological Areas (HA) and Sub Hydrological Areas (SHA) of Nigeria (source: JICA1).
The National Water Resources Master Plan 2013 compiled flow records for 101 gauging stations.Figure 4.3 shows a map with the spatial distribution of the hydrological stations with available data.
Figure 2.2 – Location of Hydrological Stations with Available data (source: JICA1).

7/23/2019 06b 2014 WP 4 Hydrology Report
http://slidepdf.com/reader/full/06b-2014-wp-4-hydrology-report 7/103
Nigerian Energy Support Programme
Hydrology Report
3
The spatial distribution of hydrological variables in Nigeria can be observed in Figure 2.3 and Figure
2.4. Figure 2.3 presents maps of annual average precipitation and potential evapotranspiration, while
Figure 2.4 is a map of the mean annual runoff.
Figure 2.3 – Spatial Patterns of Mean Annual Precipitation and Mean Annual Potential Evapotranspiration (PET)(source: JICA1).
Figure 2.4 – Spatial Distribution of Average Annual Runoff Yield (source: JICA1).

7/23/2019 06b 2014 WP 4 Hydrology Report
http://slidepdf.com/reader/full/06b-2014-wp-4-hydrology-report 8/103
Nigerian Energy Support Programme
Hydrology Report
4
The availability of surface water resources in Nigeria is highly dependent on the climate conditions,
with rainfall averages over 2000 mm/year in the south, 1000 mm in the centre of the country and 500
mm in the northeast (Figure 2.3).
Like the precipitation, the runoff yield decreases from south to north. In southern hydrological areas
like HA-6 and HA-7, the average annual runoff yield is 359 mm/year and 978 mm/year respectively,while in HA-2, in the centre of the country, it decreases to 205 mm/year. In HA-1 and HA-8, in the
north, it achieves only 62 mm/year and 40 mm/year respectively (Figure 2.4 and Table 5.1).
A review of the flow data available for each of the partner states shows that there are two gauging
stations available for Sokoto, eight for Niger, one for Ogun, and five for Cross River. There are no
gaugin stations with available records for Plateau state. Figure 2.5 shows maps with the location of
the gauging stations for each state.
Sokoto Niger
Ogun Cross River
Figure 2.5 – Maps with available gauging stations at Sokoto, Niger, Ogun and Cross River state.

7/23/2019 06b 2014 WP 4 Hydrology Report
http://slidepdf.com/reader/full/06b-2014-wp-4-hydrology-report 9/103
Nigerian Energy Support Programme
Hydrology Report
5
An analysis of the flow records for the available gauging stations, at each of the mentioned states,
confirms the already identified pattern (Figure 2.4) of a progressive runoff yield decrease from south
to north (Figure 2.6).
Sokoto Niger
Ogun Cross River
Figure 2.6 – Average monthly flow and runoff at gauging stations at Sokoto, Niger, Ogun and Cross River state.
It is also possible to clearly identify the influence of a rainfall pattern are marked by distinct wet and
dry seasons, on the flows and runoff yield (Figure 2.6). This is effect is further confirmed in the flow
duration curves (FDC) presented in Figure 2.7.
Sokoto Niger
0
1
2
3
4
5
6
7
8
9
100
20
40
60
80
100
120
140
160
180
200
Jan Feb Mar Apr May Jun Jul Aug Sep Oct Nov Dec
R u n o f f ( m m )
Q ( m 3 / s )
Wamako
Average R un of f A ve rag e Flow
0
20
40
60
80
100
120
140
160
180
200
2200
20
40
60
80
100
120
140
160
180
200
Jan Feb Mar Apr May Jun Jul Aug Sep Oct Nov Dec
R u n o f f ( m m )
Q
( m 3 / s )
Badeggi
Average Ru no ff Av er ag e Flow
0
5
10
15
20
25
30
35
40
45
50
55
60
650
20
40
60
80
100
120
140
160
180
200
Jan Feb Mar Apr May Jun Jul Aug Sep Oct Nov Dec
R u n o f f ( m m )
Q ( m 3 / s )
Apoje
Average Ru no ff A ve ra ge Flow
0
40
80
120
160
200
240
280
320
3600
200
400
600
800
1000
1200
1400
1600
1800
2000
2200
2400
Jan Feb Mar Apr May Jun Jul Aug Sep Oct Nov Dec
R u n o f f ( m m )
Q ( m 3 / s )
Ikom
Average Ru noff Av er ag e Flow
0
2
4
6
8
10
12
14
16
18
20
22
24
26
28
0% 10% 20% 30% 40% 50% 60% 70% 80% 90% 100%
F l o w
( m 3 / s )
% of exceedance
Wamako
0
50
100
150
200
250
300
350
400
450
500
550
600
650
700
0% 10% 20% 30% 40% 50% 60% 70% 80% 90% 100%
Q
( m 3 / s )
% of exceedance
Badeggi

7/23/2019 06b 2014 WP 4 Hydrology Report
http://slidepdf.com/reader/full/06b-2014-wp-4-hydrology-report 10/103
Nigerian Energy Support Programme
Hydrology Report
6
Ogun Cross River
Figure 2.7 – Flow duration curves (FDC) at gauging stations at Sokoto, Niger, Ogun and Cross River state.
After the field mission in March 2015, three sites were identified has having potential for Micro/Mini
Hydropower, Tapa in Niger, and Egaga Fall and Busi II in Cross River (Table 2.1 and ).
Table 2.1 – Location of identified sites with micro/mini hydropower potential.
Site State Latitude LongitudeCatchmentArea (km2)
Egaga Fall Cross River 6.38259889 9.36074139 10.9
Busi II Cross River 6.54288889 9.26477778 7.9
Tapa Niger 9.31473361 7.02030861 694
Figure 2.8 – Map with location of selected sites for the hydrological assessment.
0
20
40
60
80
100
120
140
160
180
200
220
240
0% 10% 20% 30% 40% 50% 60% 70% 80% 90% 100%
Q
( m 3
/ s )
% of exceedance
Apoje
0
250
500
750
1000
1250
1500
1750
2000
2250
2500
2750
3000
3250
0% 10% 20% 30% 40% 50% 60% 70% 80% 90% 100%
Q
( m 3
/ s )
% of exceedance
lkom

7/23/2019 06b 2014 WP 4 Hydrology Report
http://slidepdf.com/reader/full/06b-2014-wp-4-hydrology-report 11/103
Nigerian Energy Support Programme
Hydrology Report
7
Using the available data, a flow transposition method by catchment area ratio was computed to each
of the mentioned sites. The average monthly flows and runoff for each of the sites are presented
from Table 2.2 and Figure 2.9 to Table 2.4 and Figure 2.11.
Table 2.2 – Average monthly flow and runoff at Egaga Fall.
Jan Feb Mar Apr May Jun Jul Aug Sep Oct Nov Dec Annual
Flow(m3 /s)
0.08 0.04 0.05 0.12 0.26 0.49 0.79 0.79 1.17 1.26 0.50 0.20 0.48
Runoff(mm)
18.6 8.6 12.9 29.5 64.7 116.2 194.4 194.7 277.0 309.1 119.7 49.8 1395.3
Figure 2.9 - Average monthly flows and runoff, and FDC at Egaga Fall.
Table 2.3 – Average monthly flow and runoff at Busi II.
Jan Feb Mar Apr May Jun Jul Aug Sep Oct Nov Dec Annual
Flow(m3 /s)
0.05 0.03 0.04 0.09 0.19 0.35 0.57 0.57 0.84 0.91 0.36 0.15 0.35
Runoff(mm)
13.5 6.2 9.3 21.4 46.9 84.2 140.9 141.1 200.8 224.0 86.8 36.1 1011.3
Figure 2.10 – Average monthly flows and runoff, and FDC at Busi II.
0
20
40
60
80
100
120
140
160
180
200
220
2400.0
0.1
0.2
0.3
0.4
0.5
0.6
0.7
0.8
0.9
1.0
1.1
1.2
1.3
1.4
Jan Feb Mar Apr May Jun Jul Aug Sep Oct Nov Dec
R u n o f f ( m m )
Q ( m 3 / s )
Egaga Fall
S er ie s2 A ve ra ge Flow
0.0
0.2
0.4
0.6
0.8
1.0
1.2
1.4
1.6
1.8
0% 10% 20% 30% 40% 50% 60% 70% 80% 90% 100%
Q
( m 3 / s )
% of exceedance
Egaga Fall
0
20
40
60
80100
120
140
160
180
200
220
240
260
280
300
320
3400.0
0.1
0.2
0.3
0.4
0.5
0.6
0.7
0.8
0.9
1.0
Jan Feb Mar Apr May Jun Jul Aug Sep Oct Nov Dec
R u n o f f ( m m )
Q
( m 3 / s )
Busi II
Average Ru noff Se ri es 1
0.0
0.1
0.2
0.3
0.4
0.5
0.6
0.7
0.8
0.91.0
1.1
1.2
1.3
0% 10% 20% 30% 40% 50% 60% 70% 80% 90% 100%
Q ( m 3 / s )
% of exceedance
Busi II

7/23/2019 06b 2014 WP 4 Hydrology Report
http://slidepdf.com/reader/full/06b-2014-wp-4-hydrology-report 12/103
Nigerian Energy Support Programme
Hydrology Report
8
Table 2.4 – Average monthly flow and runoff at Tapa.
Jan Feb Mar Apr May Jun Jul Aug Sep Oct Nov Dec Annual
Flow(m3 /s)
0.29 0.19 0.15 0.18 0.31 0.67 2.68 10.93 24.07 12.95 2.75 0.70 4.67
Runoff(mm)
1.1 0.7 0.6 0.7 1.2 2.5 10.4 42.2 89.9 50.0 10.3 2.7 212.1
Figure 2.11 – Average monthly flows and runoff, and FDC at Tapa.
A common hydrology-based methodology was applied for determining environmental flows in the
three sites. Resumes the environmental flows for each of the project locations.
Table 2.5 – Location of identified sites with micro/mini hydropower potential.
Site Qα Environmental
Flow (m3 /s)
Egaga Fall Q90 0.04
Busi II Q90 0.03
Tapa Q85 0.14
Regarding the hydropower potential, it can be stated that the northern areas of Nigeria are not
suitable for any kind of run-off hydropower scheme due to flow scarcity during low flow season. This
is even more relevant for micro/mini hydropower as these schemes are usually located in small
catchment areas, which, in general, have lower specific yields than bigger watersheds.
In the case of Tapa site in Niger state, the highest average monthly flow is 161 times bigger than thelowest average monthly flow (24.07 m3/s vs 0.15 m3/s), and the flow is low, when compared to the
month with higher flows, for around half of the year (Figure 2.11).
For both sites in Cross River (southeast of Nigeria), it is clear that a low flow season with extremely
low flow values (under 100 l/s) lasts for four months (January to April) (Table 2.2 and Table 2.3, and
Figure 2.9 and Figure 2.10). The flow measurements at the sites in March 2015, 0.08 m3/s at Egaga
Fall and 0.035 m3/s at Busi II, also confirm the issues with flow scarcity. Moreover, regarding the
flow regime, the ratio between the higher and lower average monthly flows being stands at 33.
It is clear that, for the three sites considered to have potential for Micro/Mini Hydropower (Tapa,
Egaga Fall and Busi II), low flow season will be an issue regarding all year round production, and itis reasonable to consider that a shutdown period will be mandatory.
0
10
20
30
40
50
60
70
80
90
1000
2
4
6
8
10
12
14
16
18
20
22
24
26
Jan Feb Mar Apr May Jun Jul Aug Sep Oct Nov Dec
R u n o f f ( m m )
Q ( m 3 / s )
Tapa
Average Ru no ff A ve ra ge Flow
0
5
10
15
20
25
30
35
40
0% 10% 20% 30% 40% 50% 60% 70% 80% 90% 100%
Q
( m 3 / s )
% of exceedance
Tapa

7/23/2019 06b 2014 WP 4 Hydrology Report
http://slidepdf.com/reader/full/06b-2014-wp-4-hydrology-report 13/103
Nigerian Energy Support Programme
Hydrology Report
9
Environmental flows have to be considered, as they will impose a limitation on operation at low flow
conditions.
Operation ranges of electromechanical equipment can be adapted to flow conditions, and operation
with extremely low levels of flow is not impossible (however, with a significant reduction of the
equipment’s efficiency and lifetime).It will be the economical sustainability of the projects to limit their feasibility.

7/23/2019 06b 2014 WP 4 Hydrology Report
http://slidepdf.com/reader/full/06b-2014-wp-4-hydrology-report 14/103
Nigerian Energy Support Programme
Hydrology Report
10
3. Report Background
The framework for this report is the ToR for Work-Package 4: Hydrological Assessment and Small
Hydropower Site Identification (ToR No. 06-2014-WP-4 (update 1)).
The current report makes a general assessment of the hydrology and hydrological data available in
Nigeria, with a focus on the five partner states of the NESP: Sokoto, Plateau, Niger, Ogun and Cross
River. Furthermore, it develops to a hydrological assessment on the sites visited during the field
mission in March 2015 and considered to have a minimum potential. This assessment focus on
computing flow data at the sites using a transposition method (catchment area ratio), flow duration
curves (FDC) and assessment of environmental flows.
This report supports the remaining tasks/objectives in ToR No. 06-2014-WP-4 (update 1), and will
be used as a reference document providing the necessary inputs for activities, such as the site-
specific reports for the sites identified during the field mission as having potential for Micro/Mini
Hydropower.

7/23/2019 06b 2014 WP 4 Hydrology Report
http://slidepdf.com/reader/full/06b-2014-wp-4-hydrology-report 15/103
Nigerian Energy Support Programme
Hydrology Report
11
4. Available Data
Hydrological Data
Nigeria Hydrological Service Agency (NIHSA) is the responsible agency for hydrological monitoring
in Nigeria. The Japan International Cooperation Agency (JICA), in collaboration with NIHSA,established for the National Water Resources Master Plan 2013, criteria for delineation of
Hydrological Areas (HA) and Sub Hydrological Areas (SHA). As a result eight HA and 168 SHAs
were defined (Table 4.1). The mentioned HA and SHA are presented in Figure 4.1, and in Annexe
1, maps with the detailed delineation of the SHAs for each HA can be found.
Table 4.1 – Summary of HA and SHA (source: JICA1)
HA 1 2 3 4 5 6 7 8 Total
Area (km2) 135,128 154,616 156,546 74,519 53,914 99,333 57,440 178,483 909,979
Num. of related SHAs 27 36 30 11 6 22 10 26 168
Number ofSHAs
divided byNational
Boundary
Total 36 38 34 12 6 24 11 33 194
InsideNigeria
28 36 29 11 6 22 10 26 168
Figure 4.1 – Map with Hydrological Areas (HA) and Sub Hydrological Areas (SHA) of Nigeria (source JICA1).
Besides the NIHSA, there are also other agencies and authorities collecting hydrological data.
According to the National Water Resources Master Plan from JICA1 above, the available hydrological
data and the agency/authority responsible for its collection is as follows:
1 National Water Resources Master Plan 2013 – Volume 5 – SR2: Evaluation of Water Resources Potential.

7/23/2019 06b 2014 WP 4 Hydrology Report
http://slidepdf.com/reader/full/06b-2014-wp-4-hydrology-report 16/103
Nigerian Energy Support Programme
Hydrology Report
12
Data available in NIHSA
Daily, monthly discharge
Daily water level for last a few years for selected stations
Data from Niger Basin Authority (NBA) (via. NIHSA)
Daily, monthly discharge for some of Niger-HYCOS stations
Data from NBA (via. World Bank Report for Hydrology in Niger Basin)
Monthly Discharge for Niger-HYCOS stations in other countries
Data in M/P1995
Monthly discharge
Database prepared by WSSSRP (EU supported project) for HA-8
Daily, monthly discharge in HY-8
Hydrological Yearbook in BORBDA
Daily, monthly water level and discharge in BORBDA
Reservoir operation data for selected large storage dams
Daily, monthly release, reservoir water level, etc. (only limited dams)
After analysing the mentioned data sources JICA1 compiled flow records for 101 gauging stations.
The list of gauging stations with indication of available years of records (complete and incomplete)
can be found in Annexe 2.
In Figure 4.2, it is also possible to observe the availability of monthly and daily hydrological data for
each year of records, while in Figure 4.3 a map with the spatial distribution of the mentioned 101hydrological stations with available data is presented.
Figure 4.2 – Change in Number of Hydrological Stations with Available Monthly and Daily Data (JICA1).

7/23/2019 06b 2014 WP 4 Hydrology Report
http://slidepdf.com/reader/full/06b-2014-wp-4-hydrology-report 17/103
Nigerian Energy Support Programme
Hydrology Report
13
Figure 4.3 – Location of Hydrological Stations with Available data (source: JICA1).
Meteorological Data
The Nigerian Meteorological Agency (NIMET) is the agency responsible for meteorological
observations and data collection in Nigeria. According to JICA1, NIMET operates 48 synoptic stations
covering the entire Nigeria. These stations are listed in Annexe 3.
In order to assess the spatial pattern of precipitation and potential evapotranspiration in Nigeria, for
the National Water Resources Master Plan 2013, the data from the mentioned meteorological
stations operated by NIMET was merged with data from the following international meteorological
databases:
CRU-TS3.12
Worldclim3
GSMaP4
As a result, maps of mean annual rainfall and evapotranspiration were obtained. These maps are
shown in Figure 4.4.
Figure 4.4 shows the clear existence of a precipitation pattern where average annual rainfall
decreases from south to north. Regarding the average annual evapotranspiration, the mentioned
pattern can also be identified, but it is not so clear.
2 University of East Anglia Climatic Research Unit (CRU)
3 Very high resolution interpolated climate surfaces for global land areas, http://www.worldclim.org/ 4 http://sharaku.eorc.jaxa.jp/GSMaP_crest/index.html

7/23/2019 06b 2014 WP 4 Hydrology Report
http://slidepdf.com/reader/full/06b-2014-wp-4-hydrology-report 18/103
Nigerian Energy Support Programme
Hydrology Report
14
Table 4.2 presents the mean annual precipitation and PET, as well as the annual mean temperature
for each of the eight Hydrological Areas.
Table 4.2 – Average annual precipitation, temperature and potential evapotranspiration for each HA, and for the
entire country (source: JICA
1
).
Entirecountry
HA-1 HA-2 HA-3 HA-4 HA-5 HA-6 HA-7 HA-8
AnnualPrecipitation(mm/year)
1148 767 1170 1055 1341 2132 1541 2106 610
Annual MeanTemperature (° C)
26.6 27.4 26.5 26 26.8 26.7 26.5 26.9 26.5
Annual PET(mm/year)
1337 1419 1318 1290 1338 1325 1314 1338 1347

7/23/2019 06b 2014 WP 4 Hydrology Report
http://slidepdf.com/reader/full/06b-2014-wp-4-hydrology-report 19/103
Nigerian Energy Support Programme
Hydrology Report
15
Figure 4.4 – Spatial Patterns of Mean Annual Precipitation and Mean Annual Potential Evapotranspiration (PET)(source: JICA1).

7/23/2019 06b 2014 WP 4 Hydrology Report
http://slidepdf.com/reader/full/06b-2014-wp-4-hydrology-report 20/103
Nigerian Energy Support Programme
Hydrology Report
16
5. Surface Water Resources
Overview
Climate characterizes the generally prevailing weather conditions of a region and represents an
average pattern of variation of meteorological variables such as temperature, air pressure, humidity,precipitation, sunshine, cloudiness, and winds. It has a significant influence over the hydrology of an
area or region, in conjunction with other factors such as the geology, soil type and soil cover.
The climate in Nigeria is semi-arid in the north and humid in the south. Except for an ultra-humid
strip along the coast with rainfall averages of over 2000 mm/year, where it rains almost all year
round, rainfall patterns are marked by distinct wet and dry seasons. Rainfall is concentrated in the
period June-September. Deficiency in total annual precipitation is a problem in parts of the country,
particularly in the northern parts. In most other areas, however, the major problems are the
distribution in time and space and the low dependability of rainfall. Mean annual rainfall over the
whole country is estimated at 1150 mm. It is about 1000 mm in the centre of the country and 500mm in the northeast. Mean annual pan evaporation is 2450 mm in the southeast, 2620 mm in the
center and 5220 mm in the north of the country5.
The hydrology of Nigeria6 is dominated by two great river systems, the Niger-Benue and the Chad
systems. With the exception of a few rivers that empty directly into the Atlantic Ocean (Cross River,
Ogun, Oshun, Imo, Qua Iboe and a few others), all other flowing waters ultimately find their way into
the Chad Basin or down the lower Niger to the sea. Figure 5.1 shows the eight hydrological areas of
Nigeria and the main rivers.
Figure 5.1 – Hydrological Areas of Nigeria and Main Rivers.
5 Aquasat – FAO, Nigeria – Geography, Climate and Population. http://www.fao.org/nr/water/aquastat/countries_regions/nga/index.stm6 Hydrology and Inland Water Resources of Nigeria – FAO. www.fao.org/docrep/005/t1230e/t1230e02.htm

7/23/2019 06b 2014 WP 4 Hydrology Report
http://slidepdf.com/reader/full/06b-2014-wp-4-hydrology-report 21/103
Nigerian Energy Support Programme
Hydrology Report
17
The Nigeria National Water Resources Master Plan 2013 developed a water balance methodology,
based on the Thornthwaite monthly water balance model, in order to assess the surface water
resources at a country level.
Some of the available hydrological stations (previously mentioned in chapter 4) were selected and
used to calibrate the model. These stations are identified in the map of Figure 5.2.
Figure 5.2 – Selected hydrological stations for calibration of water balance model (source: JICA1).
The results of the application the water balance model are presented in Table 5.1, Figure 5.3 and
Figure 5.4.
It must be noted that the results of the model can be assumed as representing quasi-natural
conditions, this meaning that the effect of large storage dams is excluded.
Table 5.1 – Annual Runoff Yields by Hydrological Area (source: JICA1).
HA-1 HA-2 HA-3 HA-4 HA-5 HA-6 HA-7 HA-8Entire
Country
Area (km2) 135128 154616 156546 74519 53914 99333 57440 178483 909979
Average AnnualPrecipitation(mm/year)
767 1170 1055 1341 2132 1541 2106 610 1148
Average AnnualRunoff Yield(mm/year)
62 205 218 415 744 359 978 40 268
Average Specific
Discharge(l/s/km2)
2.0 6.5 6.9 13.2 23.6 11.4 31.0 1.3 8.5

7/23/2019 06b 2014 WP 4 Hydrology Report
http://slidepdf.com/reader/full/06b-2014-wp-4-hydrology-report 22/103
Nigerian Energy Support Programme
Hydrology Report
18
HA-1 HA-2 HA-3 HA-4 HA-5 HA-6 HA-7 HA-8Entire
Country
Average Runoffrate (%)
8.1 17.5 20.7 30.9 34.9 23.3 46.4 6.6 23.4
Average Annual
Runoff Volume(BMC/year) 8.4 31.7 34.2 30.8 40.1 35.6 56.3 7.2 244.3
Figure 5.3 – Spatial Distribution of Average Annual Runoff Yield (source: JICA1).

7/23/2019 06b 2014 WP 4 Hydrology Report
http://slidepdf.com/reader/full/06b-2014-wp-4-hydrology-report 23/103
Nigerian Energy Support Programme
Hydrology Report
19
Figure 5.4 – Spatial Distribution of Average Runoff Rate (source: JICA1).
Figure 5.5 presents several hydrographs at representative points in quasi-natural conditions. From
their observation, the seasonal flow patterns, in an average year, are clearly identified, evidencing
the existence of dry and wet seasons. It can also be understood that the usable water in dry season
with stable manner is much smaller than the annual average discharge in quasi-natural condition.

7/23/2019 06b 2014 WP 4 Hydrology Report
http://slidepdf.com/reader/full/06b-2014-wp-4-hydrology-report 24/103
Nigerian Energy Support Programme
Hydrology Report
20
Figure 5.5 – Seasonal Flow Pattern at Representative Points in Quasi-Natural Condition (source: JICA1).
The average annual flow by itself does not give any information about the flow distribution during the
year, and it is not an indicator of the real availability of water resources. The use of potential surface
water resource depends, in fact, on their availability thorough the year.
At the National Water Resources Master Plan 2013, the flows were also analysed in terms of their
availability at low flow season. Therefore, two indicators were considered:
Q80M – 80 percentile monthly discharge for 40years [suffix M represents monthly], which may
represent low flow condition.
Q97DS90%Y – 90% yearly dependable Q97DS (Q97DS: 97 percentile daily discharge for asingle year, which is usually called as drought discharge, [suffix D represents daily, suffix S
represents single year]).
In Figure 5.6 is presented a map indicating, at representative, points the average annual discharge,
as well as Q80M and Q97DS90%Y.

7/23/2019 06b 2014 WP 4 Hydrology Report
http://slidepdf.com/reader/full/06b-2014-wp-4-hydrology-report 25/103
Nigerian Energy Support Programme
Hydrology Report
21
Figure 5.6 - Average annual discharge, Q80M and Q97DS90%Y, at representative points (source: JICA1).
The Q80M is larger in southern and central areas (mainly in the Benue Basin), than in the northern
areas where it reaches values of zero or close to it. This is a clear indicator of water availability during
low flow season, meaning that northern areas of Nigeria face water scarcity during low flow season.
This is also supported by analysing the pattern of Q97DS90%Y, which is zero or practically zero in all
of the northern areas.
It can be concluded that the northern areas are not suitable for any kind of run-off hydropower
scheme due to lack or absence of flow during low flow season. This is even more significant for
micro/mini hydropower as these schemes are usually located in small catchment areas, which, in
general, have lower specific yields than bigger watersheds.
As it would be expected, the availability of surface water resources in Nigeria is highly dependent on
the climate conditions previously described at the beginning of this chapter (with rainfall averages
over 2000 mm/year in the south, 1000 mm in the centre of the country and 500 mm in the northeast).
Like the precipitation, the runoff yield decreases from south to north. In southern hydrological areas
(HA) like HA-6 and HA-7 the average annual runoff yield is 359 mm/year and 978 mm/year
respectively, while in HA-2, in the centre of the country, it decreases to205 mm/year, and in HA-1
and HA-8, in the north, it achieves only 62 mm/year and 40 mm/year respectively (Table 5.1).

7/23/2019 06b 2014 WP 4 Hydrology Report
http://slidepdf.com/reader/full/06b-2014-wp-4-hydrology-report 26/103
Nigerian Energy Support Programme
Hydrology Report
22
Sokoto
Sokoto state is located in the Northwest of Nigeria, on the border to Niger, and has an area of 27825
km2. Of the 101 hydrological stations mentioned in chapter 4, two are located in the state (Figure
5.7).
Figure 5.7 – Hydrological stations in Sokoto state.
In Table 5.2, the mean monthly flows and runoff are presented, while in Figure 5.8 the same data is
presented in a chart. The complete data, for the gauging stations, with monthly flows resumed in
Annexe 4.
Table 5.2 – Average flow and runoff for available gauging stations in Sokoto state.
Average Flow (m3 /s)
Gauging
Station
Area
(km2
)
Jan Feb Mar Apr May Jun Jul Aug Sep Oct Nov Dec Annual
Wamako 137219 0.6 0.3 0.3 0.3 0.9 18.2 63.8 184.1 161.9 32.3 1.7 0.6 39.0
GoronyoDam
30547 0.1 0.1 0.1 0.1 0.0 10.1 34.8 103.2 96.5 18.5 1.0 0.3 22.2
Average Runoff (mm)
GaugingStation
Area(km2)
Jan Feb Mar Apr May Jun Jul Aug Sep Oct Nov Dec Annual
Wamako 137219 0.01 0.01 0.01 0.01 0.02 0.34 1.25 3.59 3.06 0.63 0.03 0.01 9
GoronyoDam
30547 0.01 0.01 0.01 0.01 0.00 0.86 3.05 9.05 8.19 1.62 0.09 0.03 23
7/23/2019 06b 2014 WP 4 Hydrology Report
http://slidepdf.com/reader/full/06b-2014-wp-4-hydrology-report 27/103
Nigerian Energy Support Programme
Hydrology Report
23
Figure 5.8 – Average flow and runoff for available gauging stations in Sokoto state.
Figure 5.9 presents Flow Duration Curves (FDC) for each of the gauging stations.
Figure 5.9 – Flow duration curves for gauging stations in Sokoto state.
Plateau
Plateau state is located in the East Central area of Nigeria, bordering the states of Bauchi, Taraba,
Nassarawa and Kaduna, and has an area of 27147 km2. Of the 101 hydrological stations mentioned
in chapter 4, none of them is located in the state.
A possible hydrological characterization of Plateau state can be made assuming the characteristics
of Lower Benue hydrological area (HA-4) (Figure 4.1 and Figure 5.1).
The average annual runoff for the area is 415 mm and the average runoff rate 30.9% (Table 5.1).
Niger
Niger state is located in the West Central area of Nigeria, having a border with Benin and borders
with the federal states of Kebbi, Zamafra, Kaduna, Federal Capital Territory, Kogi and Kwara. It has
an area of 68925 km2.
Of the 101 hydrological stations mentioned in chapter 4, eight are located in the state (Figure 5.10).
0
1
2
3
4
5
6
7
8
9
100
20
40
60
80
100
120
140
160
180
200
Jan Feb Mar Apr May Jun Jul Aug Sep Oct Nov Dec
R u n o f f ( m
m )
Q
( m 3 /
s )
Wamako
Average R un of f A ve rag e Flow
0
1
2
3
4
5
6
7
8
9
100
10
20
30
40
50
60
70
80
90
100
110
Jan Feb Mar Apr May Jun Jul Aug Sep Oct Nov Dec
R u n o f f ( m
m )
Q
( m 3 /
s )
Goronyo Dam
Average R un of f Av er ag e Flow
0
2
4
6
8
10
12
14
16
18
20
22
24
26
28
0% 10% 20% 30% 40% 50% 60% 70% 80% 90% 100%
F l o w
( m 3 / s )
% of exceedance
Wamako
0
2
4
6
8
10
12
14
16
18
0% 10% 20% 30% 40% 50% 60% 70% 80% 90% 100%
F l o w
( m 3 / s )
% of exceedance
Goronyo Dam

7/23/2019 06b 2014 WP 4 Hydrology Report
http://slidepdf.com/reader/full/06b-2014-wp-4-hydrology-report 28/103
Nigerian Energy Support Programme
Hydrology Report
24
Figure 5.10 – Gauging Stations located in Niger state.
In Table 5.3, mean monthly flows and runoff are presented for each of the available gauging stations,
while in Figure 5.8 the same data is presented in a chart. The complete data, for each gauging
station, with monthly flows in each year of available records is in Annexe 5.
Table 5.3 – Average flow and runoff for available gauging stations in Niger state.
Average Flow (m3 /s)
GaugingStation
Area(km2)
Jan Feb Mar Apr May Jun Jul Aug Sep Oct Nov Dec Annual
Jebba 1629481 1392.0 1402.6 1210.5 953.9 738.2 687.6 780.5 1168.7 1986.5 1886.5 1308.6 1268.9 1230.6
Baro 1726856 1342.5 1389.6 1223.8 1099.2 949.7 1039.1 1517.1 2701.4 4534.9 3828.7 1789.7 1337.6 1897.9
Wuya 64726 37.3 24.0 22.0 21.9 66.0 147.5 671.9 1723.5 3312.9 1320.7 209.1 37.8 634.7
Shiroro 34702 36.1 29.6 28.2 29.9 92.1 181.6 405.5 872.0 1046.9 446.4 83.0 41.6 275.8
Komi 2326 2.9 2.6 2.5 3.7 3.9 8.1 9.7 20.4 31.5 13.3 5.0 3.7 9.0
Izom 6203 11.3 7.1 7.7 14.7 52.8 89.5 213.7 375.3 488.2 267.1 53.2 16.1 133.8
Ebba 1896 0.8 0.5 0.4 0.5 0.8 1.8 7.3 29.9 65.8 35.4 7.5 1.9 12.7
Badeggi 5850 3.3 2.7 2.5 2.8 4.2 9.6 28.8 93.6 177.7 109.2 27.6 6.5 39.2

7/23/2019 06b 2014 WP 4 Hydrology Report
http://slidepdf.com/reader/full/06b-2014-wp-4-hydrology-report 29/103
Nigerian Energy Support Programme
Hydrology Report
25
Average Runoff (mm)
GaugingStation
Area(km2)
Jan Feb Mar Apr May Jun Jul Aug Sep Oct Nov Dec Annual
Jebba 1629481 2.29 2.08 1.99 1.52 1.21 1.09 1.28 1.92 3.16 3.10 2.08 2.09 24
Baro 1726856 2.08 1.95 1.90 1.65 1.47 1.56 2.35 4.19 6.81 5.94 2.69 2.07 35
Wuya 64726 1.54 0.90 0.91 0.88 2.73 5.91 27.80 71.32 132.67 54.65 8.37 1.56 309
Shiroro 34702 2.79 2.06 2.18 2.23 7.11 13.57 31.30 67.31 78.19 34.45 6.20 3.21 251
Komi 2326 3.36 2.73 2.87 4.09 4.53 9.03 11.13 23.47 35.12 15.30 5.61 4.25 121
Izom 6203 4.89 2.76 3.34 6.13 22.80 37.39 92.25 162.03 203.99 115.33 22.25 6.96 680
Ebba 1896 1.10 0.66 0.58 0.67 1.20 2.49 10.36 42.19 89.90 49.96 10.26 2.69 212
Badeggi 5850 1.52 1.13 1.16 1.25 1.91 4.26 13.20 42.87 78.72 49.98 12.22 2.99 211
0
20
40
60
80
100
120
140
160
180
200
2200
200
400
600
800
1000
1200
1400
1600
1800
2000
2200
Jan Feb Mar Apr May Jun Jul Aug Sep Oct Nov Dec
R u n o f f ( m m )
Q ( m 3 / s )
Jebba
Average Run of f Av er age Flow
0
20
40
60
80
100
120
140
160
180
200
2200
500
1000
1500
2000
2500
3000
3500
4000
4500
5000
Jan Feb Mar Apr May Jun Jul Aug Sep Oct Nov Dec
R u n o f f ( m m )
Q ( m 3 / s )
Baro
Average R un off Av er ag e Flow
0
20
40
60
80
100
120
140
160
180
200
2200
500
1000
1500
2000
2500
3000
3500
Jan Feb Mar Apr May Jun Jul Aug Sep Oct Nov Dec
R u n o f f ( m m )
Q ( m 3 / s )
Wuya
Average Run of f Av er age Flow
0
20
40
60
80
100
120
140
160
180
200
2200
100
200
300
400
500
600
700
800
900
1000
1100
Jan Feb Mar Apr May Jun Jul Aug Sep Oct Nov Dec
R u n o f f ( m m )
Q ( m 3 / s )
Shiroro
Average Ru no ff Av er ag e Flow

7/23/2019 06b 2014 WP 4 Hydrology Report
http://slidepdf.com/reader/full/06b-2014-wp-4-hydrology-report 30/103
Nigerian Energy Support Programme
Hydrology Report
26
Figure 5.11 – Average flow and runoff for available gauging stations in Niger state.
Figure 5.9 presents Flow Duration Curves (FDC) for each of the gauging stations.
0
20
40
60
80
100
120
140
160
180
200
2200
5
10
15
20
25
30
35
40
45
Jan Feb Mar Apr May Jun Jul Aug Sep Oct Nov Dec
R u n o f f (
m m )
Q ( m 3
/ s )
Komi
Average Run of f Av er age Flow
0
20
40
60
80
100
120
140
160
180
200
2200
50
100
150
200
250
300
350
400
450
500
550
Jan Feb Mar Apr May Jun Jul Aug Sep Oct Nov Dec
R u n o f f (
m m )
Q ( m 3
/ s )
Izom
Average Ru no ff Av er ag e Flow
0
20
40
60
80
100
120
140
160
180
200
2200
5
10
15
20
25
30
35
40
45
50
55
60
65
70
Jan Feb Mar Apr May Jun Jul Aug Sep Oct Nov Dec
R u n o f f ( m m )
Q
( m 3 / s )
Ebba
Average Run of f Av er age Flow
0
20
40
60
80
100
120
140
160
180
200
2200
20
40
60
80
100
120
140
160
180
200
Jan Feb Mar Apr May Jun Jul Aug Sep Oct Nov Dec
R u n o f f ( m m )
Q
( m 3 / s )
Badeggi
Average Ru no ff Av er ag e Flow
0
500
1000
1500
2000
2500
3000
3500
4000
4500
5000
0% 10% 20% 30% 40% 50% 60% 70% 80% 90% 100%
Q
( m 3 / s )
% of exceedance
Jebba
0
500
1000
1500
2000
2500
3000
3500
4000
4500
5000
5500
6000
6500
7000
7500
8000
0% 10% 20% 30% 40% 50% 60% 70% 80% 90% 100%
Q
( m 3 / s )
% of exceedance
Baro

7/23/2019 06b 2014 WP 4 Hydrology Report
http://slidepdf.com/reader/full/06b-2014-wp-4-hydrology-report 31/103
Nigerian Energy Support Programme
Hydrology Report
27
Figure 5.12 – Flow duration curves for gauging stations in Niger state.
Ogun
Ogun state is the Southwest of Nigeria, having a border with Benin and borders with the federal
states of Oyo, Osun, Ondo and Lagos. It has an area of 16400 km2.
Of the 101 hydrological stations mentioned in chapter 4, only one is located in the state (Figure 5.13).
0
500
1000
1500
2000
2500
3000
3500
40004500
5000
5500
6000
6500
7000
7500
8000
8500
0% 10% 20% 30% 40% 50% 60% 70% 80% 90% 100%
Q
( m 3
/ s )
% of exceedance
Wuya
0
500
1000
1500
2000
2500
3000
3500
4000
4500
5000
0% 10% 20% 30% 40% 50% 60% 70% 80% 90% 100%
Q
( m 3
/ s )
% of exceedance
Shiroro
0
10
20
30
40
50
60
70
80
90
100
110
120
0% 10% 20% 30% 40% 50% 60% 70% 80% 90% 100%
Q
( m 3 / s )
% of exceedance
Komi
0
200
400
600
800
1000
1200
1400
1600
1800
2000
2200
0% 10% 20% 30% 40% 50% 60% 70% 80% 90% 100%
Q
( m 3 / s )
% of exceedance
Izom
0
20
40
60
80
100
120
140
160
180
200
220
240
260
280
0% 10% 20% 30% 40% 50% 60% 70% 80% 90% 100%
Q
( m 3 / s )
% of exceedance
Ebba
0
50
100
150
200
250
300
350
400
450
500
550
600
650
700
0% 10% 20% 30% 40% 50% 60% 70% 80% 90% 100%
Q
( m 3 / s )
% of exceedance
Badeggi

7/23/2019 06b 2014 WP 4 Hydrology Report
http://slidepdf.com/reader/full/06b-2014-wp-4-hydrology-report 32/103
Nigerian Energy Support Programme
Hydrology Report
28
Figure 5.13 – Gauging Stations located in Ogun state.
In Table 5.3 mean monthly flows and runoff are presented for each of the available gauging stations,
while in Figure 5.8 the same data is presented in a chart. The complete data, of each gauging station,
with monthly flows in each year of available records is in Annexe 6.
Table 5.4 – Average flow and runoff for available gauging stations in Ogun state.
Average Flow (m3 /s)
GaugingStation
Area(km2)
Jan Feb Mar Apr May Jun Jul Aug Sep Oct Nov Dec Annual
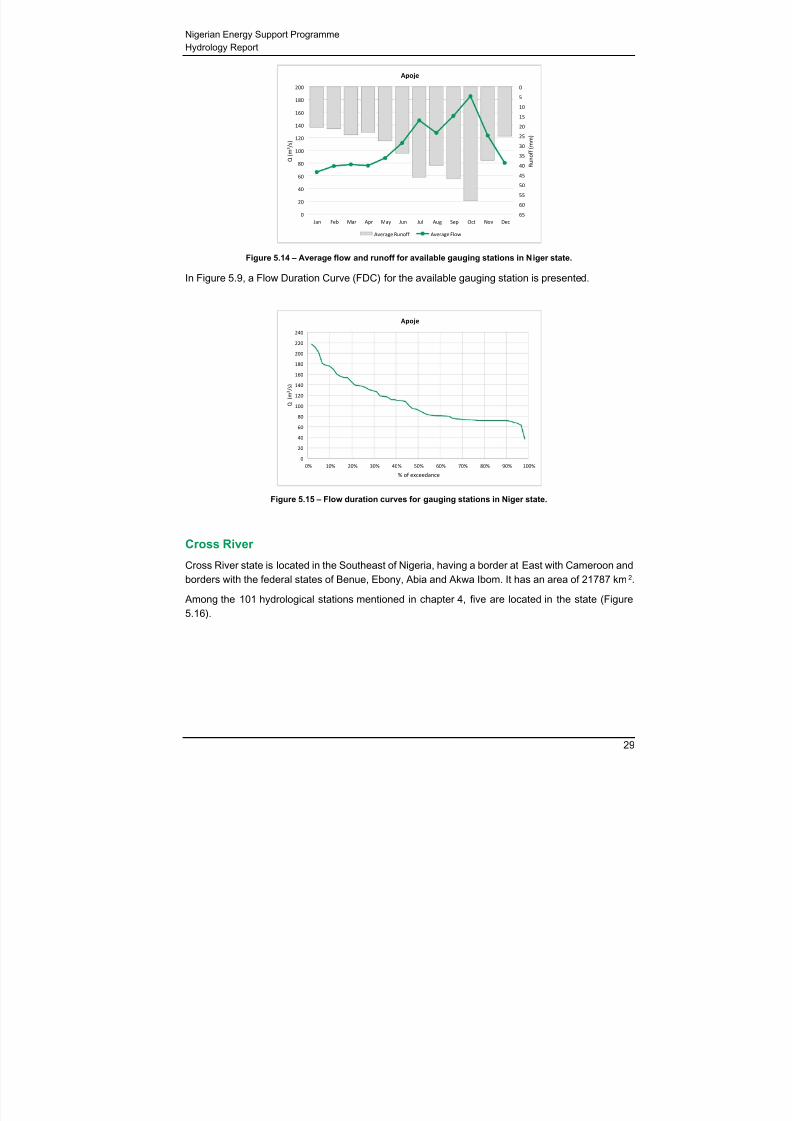
Apoje 8517 65.9 75.5 78.0 76.1 88.1 111.8 147.2 127.5 154.2 185.1 123.5 80.3 109.6
Average Runoff (mm)
GaugingStation
Area(km2)
Jan Feb Mar Apr May Jun Jul Aug Sep Oct Nov Dec Annual
Apoje 8517 20.72 21.43 24.52 23.16 27.69 34.03 46.28 40.11 46.94 58.21 37.60 25.24 406
7/23/2019 06b 2014 WP 4 Hydrology Report
http://slidepdf.com/reader/full/06b-2014-wp-4-hydrology-report 33/103
Nigerian Energy Support Programme
Hydrology Report
29
Figure 5.14 – Average flow and runoff for available gauging stations in Niger state.
In Figure 5.9, a Flow Duration Curve (FDC) for the available gauging station is presented.
Figure 5.15 – Flow duration curves for gauging stations in Niger state.
Cross River
Cross River state is located in the Southeast of Nigeria, having a border at East with Cameroon and
borders with the federal states of Benue, Ebony, Abia and Akwa Ibom. It has an area of 21787 km2.
Among the 101 hydrological stations mentioned in chapter 4, five are located in the state (Figure
5.16).
0
5
10
15
20
2530
35
40
45
50
55
60
650
20
40
60
80
100
120
140
160
180
200
Jan Feb Mar Apr May Jun Jul Aug Sep Oct Nov Dec
R u n o f f ( m m )
Q ( m 3 / s )
Apoje
Average Runoff Average Flow
0
20
40
60
80
100
120
140
160
180
200
220
240
0% 10% 20% 30% 40% 50% 60% 70% 80% 90% 100%
Q
( m 3 / s )
% of exceedance
Apoje

7/23/2019 06b 2014 WP 4 Hydrology Report
http://slidepdf.com/reader/full/06b-2014-wp-4-hydrology-report 34/103
Nigerian Energy Support Programme
Hydrology Report
30
Figure 5.16 – Gauging Stations located in Cross River state.
In Table 5.5, mean monthly flows and runoff are presented for each of the available gauging stations,
while in Figure 5.17 the same data is presented in a chart. The complete data, for each gauging
station, with monthly flows in every year of available records is in Annexe 4.
Table 5.5 – Average flow and runoff for available gauging stations in Niger state.
Average Flow (m3 /s)
GaugingStation Area(km2) Jan Feb Mar Apr May Jun Jul Aug Sep Oct Nov Dec Annual
lkom 16900 148.1 103.2 139.5 177.4 348.6 819.2 1407.2 2059.6 2272.8 1904.9 675.8 247.8 863.5
Adonatarn 18900 348.3 306.4 330.3 430.6 750.2 1068.1 1664.7 2344.6 2557.0 1996.3 1096.7 500.8 1120.9
Obubra 35800 162.6 99.2 117.7 219.9 456.5 1168.7 2039.4 2998.6 3878.5 3313.8 1235.3 423.9 1350.0
Afikpo 46200 251.6 178.0 188.6 298.8 690.1 1449.0 2558.3 3444.9 4373.8 3598.9 1319.3 440.1 1574.1
IkotOkpara
48300 235.1 166.3 159.2 274.2 638.0 1439.8 2548.5 3559.6 4708.6 4125.9 1462.8 431.1 1654.4

7/23/2019 06b 2014 WP 4 Hydrology Report
http://slidepdf.com/reader/full/06b-2014-wp-4-hydrology-report 35/103
Nigerian Energy Support Programme
Hydrology Report
31
Average Runoff (mm)
GaugingStation
Area(km2)
Jan Feb Mar Apr May Jun Jul Aug Sep Oct Nov Dec Annual
lkom 16900 23.48 14.77 22.11 27.20 55.26 125.65 223.02 326.41 348.59 301.90 103.65 39.28 1611
Adonatarn 18900 49.36 39.22 46.81 59.05 106.32 146.49 235.90 332.26 350.67 282.90 150.41 70.97 1870
Obubra 35800 12.17 6.71 8.81 15.92 34.15 84.61 152.58 224.35 280.81 247.93 89.44 31.71 1189
Afikpo 46200 14.59 9.32 10.94 16.76 40.01 81.29 148.32 199.71 245.39 208.64 74.02 25.51 1075
IkotOkpara
48300 13.04 8.33 8.83 14.71 35.38 77.27 141.33 197.39 252.69 228.80 78.50 23.91 1080
Figure 5.17 – Average flow and runoff for available gauging stations in Cross River state.
0
40
80
120
160
200
240
280
320
3600
200
400
600
800
1000
1200
1400
1600
1800
2000
2200
2400
Jan Feb Mar Apr May Jun Jul Aug Sep Oct Nov Dec
R u n o f f ( m m )
Q ( m 3 / s )
Ikom
Average Run off Av er age Flow
0
40
80
120
160
200
240
280
320
3600
250
500
750
1000
1250
1500
1750
2000
2250
2500
2750
Jan Feb Mar Apr May Jun Jul Aug Sep Oct Nov Dec
R u n o f f ( m m )
Q ( m 3 / s )
Adonatarn
Average R un of f Av er age Flow
0
40
80
120
160
200
240
280
320
3600
500
1000
1500
2000
2500
3000
3500
4000
Jan Feb Mar Apr May Jun Jul Aug Sep Oct Nov Dec
R u n o f f ( m m )
Q ( m 3 / s )
Obubra
Average Ru nof f Av er ag e Flow
0
40
80
120
160
200
240
280
320
3600
500
1000
1500
2000
2500
3000
3500
4000
4500
Jan Feb Mar Apr May Jun Jul Aug Sep Oct Nov Dec
R u n o f f ( m m )
Q
( m 3 / s )
Afikpo
Average Ru noff Av er ag e Flow
0
40
80
120
160
200
240
280
320
3600
500
1000
1500
2000
2500
3000
3500
4000
4500
5000
Jan Feb Mar Apr May Jun Jul Aug Sep Oct Nov Dec
R u n o f f ( m m )
Q ( m 3 / s )
Ikot Okpara
Average R un of f Av er age Flow

7/23/2019 06b 2014 WP 4 Hydrology Report
http://slidepdf.com/reader/full/06b-2014-wp-4-hydrology-report 36/103
Nigerian Energy Support Programme
Hydrology Report
32
Figure 5.18 presents Flow Duration Curves (FDC) for each of the gauging stations.
Figure 5.18 – Flow duration curves for gauging stations in Cross River state.
0
250
500
750
1000
1250
1500
1750
2000
2250
2500
2750
3000
3250
0% 10% 20% 30% 40% 50% 60% 70% 80% 90% 100%
Q
( m 3 / s )
% of exceedance
lkom
0
250
500
750
1000
1250
1500
1750
2000
2250
2500
2750
3000
3250
0% 10% 20% 30% 40% 50% 60% 70% 80% 90% 100%
Q
( m 3 / s )
% of exceedance
Adonatarn
0
500
1000
1500
2000
2500
3000
3500
4000
4500
5000
0% 10% 20% 30% 40% 50% 60% 70% 80% 90% 100%
Q
( m 3 / s )
% of exceedance
Obubra
0
500
1000
1500
2000
2500
3000
3500
4000
4500
5000
5500
0% 10% 20% 30% 40% 50% 60% 70% 80% 90% 100%
Q
( m 3 / s )
% of exceedance
Afikpo
0
500
1000
1500
2000
2500
3000
3500
4000
4500
5000
5500
6000
0% 10% 20% 30% 40% 50% 60% 70% 80% 90% 100%
Q
( m 3 / s )
% of exceedance
Ikot Okpara

7/23/2019 06b 2014 WP 4 Hydrology Report
http://slidepdf.com/reader/full/06b-2014-wp-4-hydrology-report 37/103
Nigerian Energy Support Programme
Hydrology Report
33
6. Site Specific Hydrological Assessment
Overview
The site-specific hydrological assessment hereafter presented is for the three selected sites – Tapa,
Egaga Fall and Busi II – among the nine sites visited during the field mission in March 2015. Fromthese three sites, one is located in Niger state and Hydrological Area (HA) HA-2 and two in Cross
River, HA-7 (Egaga Fall) and HA-4 (Busi II) (Figure 6.1).
Figure 6.1 – Map with location of selected sites for the hydrological assessment.
Table 6.1 resumes the location and catchment areas of the sites.
Table 6.1 – Location and catchment area of assessed sites with potential for Micro/Mini Hydropower.
Site State
Location CatchmentArea
Lat. Long.Hydrological Area
(HA)(km2)
Egaga FallCrossRiver
6.38748333 9.36092361 HA-7 10.9
Busi IICrossRiver
6.54288889 9.26477778 HA-7 7.9
Tapa Niger 9.30311889 7.13363194 HA-2 694
The assessment includes an analysis of nearby gauging stations, simple test for the quality of the
series, transformation of flows by catchment area ratio method, computing of flow duration curve
and estimation of ecological flows.

7/23/2019 06b 2014 WP 4 Hydrology Report
http://slidepdf.com/reader/full/06b-2014-wp-4-hydrology-report 38/103
Nigerian Energy Support Programme
Hydrology Report
34
It has to be noted that the catchment areas of the sites located in Cross River are quite small when
compared to the catchment areas of the available nearby gauging stations. This result in a reduced
accuracy of the obtained results, given the usual differences in the hydrological behaviour between
small and large catchment areas. Larger catchment areas tend to have higher specific yields, thus
higher low flow season flows per unit of area of the watershed.
Source Gauging Stations
Cross River sites: Egaga Fall and Busi II
Among the nearby gauging stations to Egaga Fall and Busi II sites, two of them where selected to
be analysed regarding its suitability to be used as source for a flow transposition method by
catchment area ratio. It has to be noted that, the nearby stations to consider where not restricted to
Ogun state, and one gauging station in Benue state was considered (Figure 6.2).
Figure 6.2 – On the left: Gauging Stations nearby Egaga Fall and Busi II sites; on the right: gauging stationsselected to be used for catchment area ratio method.
The selected gauging stations are presented in Table 6.2, resuming their main features are resumed.
The criteria for selecting the gauging stations were:
Dimension of record period
Distance to site location
Catchment area size.
Hydrological behaviour/Flow pattern
7/23/2019 06b 2014 WP 4 Hydrology Report
http://slidepdf.com/reader/full/06b-2014-wp-4-hydrology-report 39/103
Nigerian Energy Support Programme
Hydrology Report
35
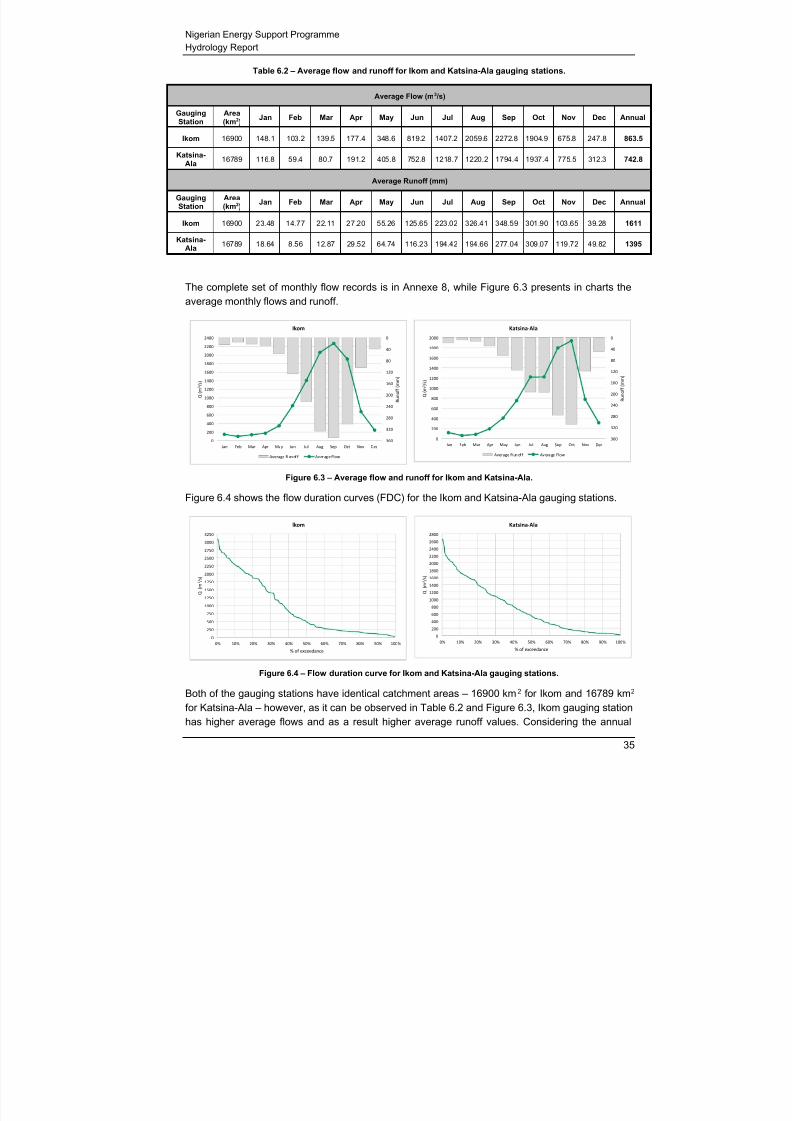
Table 6.2 – Average flow and runoff for Ikom and Katsina-Ala gauging stations.
Average Flow (m3 /s)
GaugingStation
Area(km2)
Jan Feb Mar Apr May Jun Jul Aug Sep Oct Nov Dec Annual
Ikom 16900 148.1 103.2 139.5 177.4 348.6 819.2 1407.2 2059.6 2272.8 1904.9 675.8 247.8 863.5
Katsina-Ala
16789 116.8 59.4 80.7 191.2 405.8 752.8 1218.7 1220.2 1794.4 1937.4 775.5 312.3 742.8
Average Runoff (mm)
GaugingStation
Area(km2)
Jan Feb Mar Apr May Jun Jul Aug Sep Oct Nov Dec Annual
Ikom 16900 23.48 14.77 22.11 27.20 55.26 125.65 223.02 326.41 348.59 301.90 103.65 39.28 1611
Katsina-Ala
16789 18.64 8.56 12.87 29.52 64.74 116.23 194.42 194.66 277.04 309.07 119.72 49.82 1395
The complete set of monthly flow records is in Annexe 8, while Figure 6.3 presents in charts the
average monthly flows and runoff.
Figure 6.3 – Average flow and runoff for Ikom and Katsina-Ala.
Figure 6.4 shows the flow duration curves (FDC) for the Ikom and Katsina-Ala gauging stations.
Figure 6.4 – Flow duration curve for Ikom and Katsina-Ala gauging stations.
Both of the gauging stations have identical catchment areas – 16900 km2 for Ikom and 16789 km2 for Katsina-Ala – however, as it can be observed in Table 6.2 and Figure 6.3, Ikom gauging station
has higher average flows and as a result higher average runoff values. Considering the annual
0
40
80
120
160
200
240
280
320
3600
200
400
600
800
1000
1200
1400
1600
1800
2000
2200
2400
Jan Feb Mar Apr May Jun Jul Aug Sep Oct Nov Dec
R u n o f f ( m m )
Q ( m 3 / s )
Ikom
Average R un of f Av er ag e Flow
0
40
80
120
160
200
240
280
320
3600
200
400
600
800
1000
1200
1400
1600
1800
2000
Jan Feb Mar Apr May Jun Jul Aug Sep Oct Nov Dec
R u n o f f ( m m )
Q ( m 3 / s )
Katsina‐Ala
Average R un of f Av era ge Flow
0
250
500
750
1000
1250
1500
1750
2000
2250
2500
2750
3000
3250
0% 10% 20% 30% 40% 50% 60% 70% 80% 90% 100%
Q
( m 3 / s )
% of exceedance
lkom
0
200
400
600
800
1000
1200
1400
1600
1800
2000
2200
2400
2600
2800
0% 10% 20% 30% 40% 50% 60% 70% 80% 90% 100%
Q
( m 3 / s )
% of exceedance
Katsina‐Ala

7/23/2019 06b 2014 WP 4 Hydrology Report
http://slidepdf.com/reader/full/06b-2014-wp-4-hydrology-report 40/103
Nigerian Energy Support Programme
Hydrology Report
36
average flow, Ikom has 863.5 m3/s, resulting in an average annual runoff of 1611 mm, while Katsina-
Ala has an annual average flow of 742.8 m3/s, equivalent to an average annual runoff of 1395 mm.
In order to check the quality of the series, a chart with simple accumulated flows was plotted for both
the gauging stations (Figure 6.5).
Figure 6.5 – Simply accumulated flows for Ikom and Katsina-Ala gauging stations.
For each of the charts (Figure 6.5), a line with a constant slope can be fitted to each of the series of
plotted points, showing that the records are consistent and have the required quality for a hydrologic
assessment.
Niger site: Tapa
Several gauging stations are available nearby Tapa site in Niger state (Figure 6.6).
In order to select the gauging stations to compute flows for Tapa site by a catchment area ratio
method, the following criteria was applied:
Dimension of record period
Distance to site location
Catchment area size.
Hydrological behaviour/Flow pattern
Four gauging stations were selected. They can be observed on the map in Figure 6.6, while its flow
data is resumed in Table 6.4.
0
50
100
150
200
250
300
350
400
450
500
550
600
650
0 10 20 30 40 50 60 70 80 90 100
A c c u m l a t e d f l o w
( m 3 / s )
Acummulated months
Ikom
0
20000
40000
60000
80000
100000
120000
140000
160000
180000
200000
0 25 50 75 100 125 150 175 200 225 250 275 300 325
A c c u m l a t e d f l o w
( m 3 / s )
Acummulated months
Katsina‐Ala

7/23/2019 06b 2014 WP 4 Hydrology Report
http://slidepdf.com/reader/full/06b-2014-wp-4-hydrology-report 41/103
Nigerian Energy Support Programme
Hydrology Report
37
Figure 6.6 – On the top: gauging stations nearby Tapa site, on the bottom: selected gauging stations nearbyTapa site for catchment area ratio analysis.

7/23/2019 06b 2014 WP 4 Hydrology Report
http://slidepdf.com/reader/full/06b-2014-wp-4-hydrology-report 42/103
Nigerian Energy Support Programme
Hydrology Report
38
Table 6.3 – Average flow and runoff for Izom, Ebba, Kachia and Kaeia gauging stations.
Average Flow (m3 /s)
GaugingStation
Area(km2)
Jan Feb Mar Apr May Jun Jul Aug Sep Oct Nov Dec Annual
Izom 6203 11.3 7.1 7.7 14.7 52.8 89.5 213.7 375.3 488.2 267.1 53.2 16.1 133.8
Ebba 1896 0.8 0.5 0.4 0.5 0.8 1.8 7.3 29.9 65.8 35.4 7.5 1.9 12.7
Kachia 124 0.4 0.3 0.3 0.4 1.2 1.7 3.6 4.2 3.5 1.8 0.7 0.5 1.6
Kaeia 559 0.8 0.6 0.7 1.8 3.9 5.0 14.9 19.8 24.9 11.0 2.7 1.2 7.3
Average Runoff (mm)
GaugingStation
Area(km2)
Jan Feb Mar Apr May Jun Jul Aug Sep Oct Nov Dec Annual
Izom 6203 4.89 2.76 3.34 6.13 22.80 37.39 92.25 162.03 203.99 115.33 22.25 6.96 680
Ebba 1896 1.10 0.66 0.58 0.67 1.20 2.49 10.36 42.19 89.90 49.96 10.26 2.69 212
Kachia 124 8.37 6.09 5.54 8.77 26.71 35.38 78.83 90.02 73.99 39.82 15.52 10.08 399
Kaeia 559 4.03 2.64 3.15 8.28 18.58 22.99 71.24 95.01 115.68 52.84 12.43 5.86 413
The complete set of monthly flow records is in Annexe 9, while in Figure 6.7 the average monthly
flows and runoff are presented as charts.
Figure 6.7 – Average flow and runoff for Izom, Ebba, Kachia and Kaeia gauging stations.
0
20
40
60
80
100
120
140
160
180
200
2200
50
100
150
200
250
300
350
400
450
500
550
Jan Feb Mar Apr May Jun Jul Aug Sep Oct Nov Dec
R u n o f f ( m m )
Q ( m 3 / s )
Izom
Average Run of f Av er age Flow
0
20
40
60
80
100
120
140
160
180
200
2200
5
10
15
20
25
30
35
40
45
50
55
60
65
70
Jan Feb Mar Apr May Jun Jul Aug Sep Oct Nov Dec
R u n o f f ( m m )
Q ( m 3 / s )
Ebba
Average Ru no ff Av er ag e Flow
0
20
40
60
80
100
120
140
160
180
200
2200.0
0.5
1.0
1.5
2.0
2.5
3.0
3.5
4.0
4.5
Jan Feb Mar Apr May Jun Jul Aug Sep Oct Nov Dec
R u n o f f ( m m )
Q ( m 3 / s )
Kachia
Average Run of f Av er age Flow
0
20
40
60
80
100
120
140
160
180
200
2200
5
10
15
20
25
30
Jan Feb Mar Apr May Jun Jul Aug Sep Oct Nov Dec
R u n o f f ( m m )
Q ( m 3 / s )
Kaeia
Average Ru no ff Av er ag e Flow

7/23/2019 06b 2014 WP 4 Hydrology Report
http://slidepdf.com/reader/full/06b-2014-wp-4-hydrology-report 43/103
Nigerian Energy Support Programme
Hydrology Report
39
Figure 6.8 shows the flow duration curves (FDC) for Izom, Ebba, Kachia and Kaeia gauging stations.
Figure 6.8 – Flow duration curve for Izom, Ebba, Kachia and Kaeia gauging stations.
Regarding the quality of the data series, a simple accumulated flow technique was applied for each
of the gauging stations. In Figure 6.9,charts with the plotted accumulated series are presented.
0
200
400
600
800
1000
1200
1400
1600
1800
2000
2200
0% 10% 20% 30% 40% 50% 60% 70% 80% 90% 100%
Q
( m 3 / s )
% of exceedance
Izom
0
20
40
60
80
100
120
140
160
180
200
220
240
260
280
0% 10% 20% 30% 40% 50% 60% 70% 80% 90% 100%
Q
( m 3 / s )
% of exceedance
Ebba
0.0
1.0
2.0
3.0
4.0
5.0
6.0
7.0
8.0
9.0
0% 10% 20% 30% 40% 50% 60% 70% 80% 90% 100%
Q
( m 3 / s )
% of exceedance
Kachia
0
5
10
15
20
25
30
35
40
0% 10% 20% 30% 40% 50% 60% 70% 80% 90% 100%
Q
( m 3 / s )
% of exceedance
Kaeia
0
2000
4000
6000
8000
10000
12000
14000
16000
18000
0 10 20 30 40 50 60 70 80 90 100 110 120 130
A c c u m u l a t e d f l o w
( m 3 / s )
Accumulated months
Izom
0
200
400
600
800
1000
1200
1400
1600
1800
0 10 20 30 40 50 60 70 80 90 100 110 120 1 30 1 40
A c c u m u l a t
e d f l o w
( m 3 / s )
Accumulated months
Ebba

7/23/2019 06b 2014 WP 4 Hydrology Report
http://slidepdf.com/reader/full/06b-2014-wp-4-hydrology-report 44/103
Nigerian Energy Support Programme
Hydrology Report
40
Figure 6.9 – Simply accumulated flows for Izom, Ebba, Kachia and Kaeia gauging stations.
By observing the charts of the accumulated flows, for each of the gauging stations (Figure 6.9), it is
possible to conclude that, for each of them, a line with a constant slope can be fitted to the series of
plotted points. This shows that the records are consistent and have the required quality for ahydrologic assessment.
Egaga Fall
Location and general features
Egaga Fall is located close to the Obudu Cattle Ranch in the Obanliku local government area (LGA).
Table 6.4 resumes the location, administrative and basic hydrological data of the site.
Table 6.4 – Location and basic hydrological features of Egaga Fall site.
Site Name Egaga Fall
State Cross River
Local Government Area Obanliku
Latitude 6.38259889
Longitude 9.36074139
Hydrological Area (HA) Eastern Litoral (HA-7)
Catchment Area (km2) 10.9
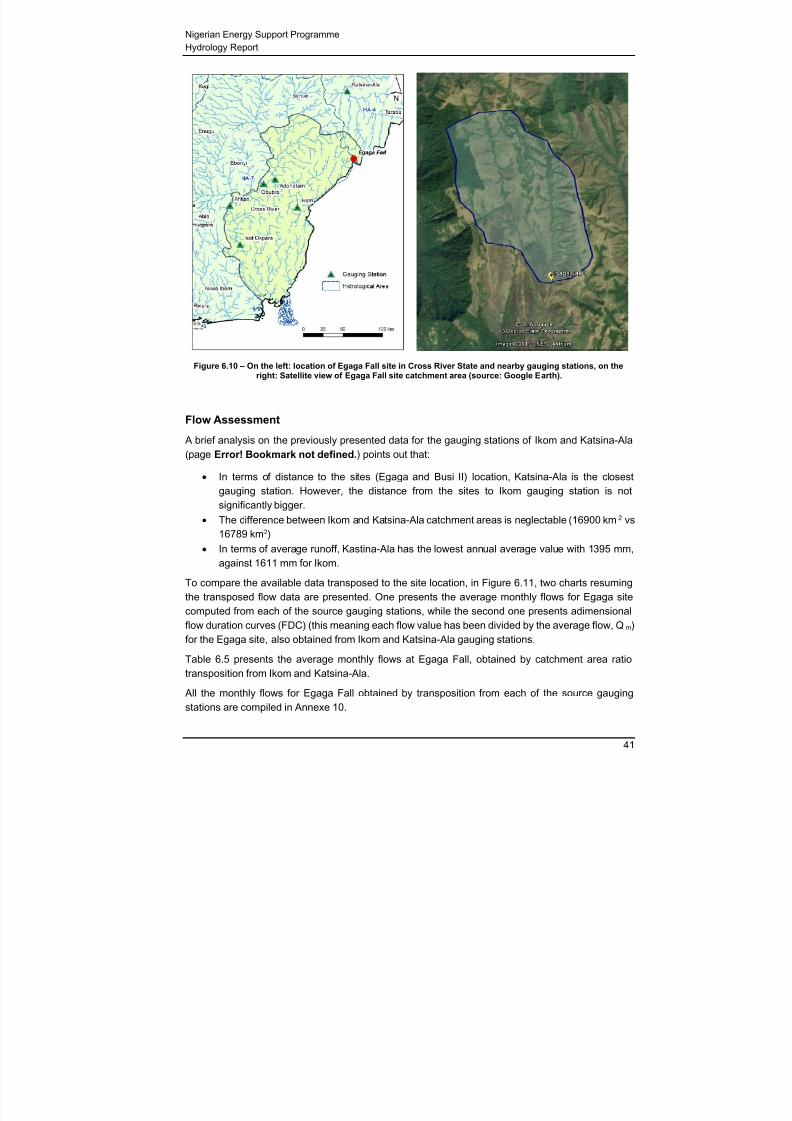
In Figure 6.10, it can be observed the location of Egaga Fall site, as well as the available nearby
gauging stations, and a satellite view of the watershed.
0
20
40
60
80
100
120
140
0 10 20 30 40 50 60 70 80 90 100
A c c u m u l a t e d f
l o w
( m 3 / s )
Accumulated months
Kachia
0
100
200
300
400
500
600
700
0 10 20 30 40 50 60 70 80 90 100
A c c u m u l a t e d f
l o w
( m 3 / s )
Accumulated months
Kaeia
7/23/2019 06b 2014 WP 4 Hydrology Report
http://slidepdf.com/reader/full/06b-2014-wp-4-hydrology-report 45/103
Nigerian Energy Support Programme
Hydrology Report
41
Figure 6.10 – On the left: location of Egaga Fall site in Cross River State and nearby gauging stations, on theright: Satellite view of Egaga Fall site catchment area (source: Google Earth).
Flow Assessment
A brief analysis on the previously presented data for the gauging stations of Ikom and Katsina-Ala
(page Error! Bookmark not defined.) points out that:
In terms of distance to the sites (Egaga and Busi II) location, Katsina-Ala is the closest
gauging station. However, the distance from the sites to Ikom gauging station is not
significantly bigger.
The difference between Ikom and Katsina-Ala catchment areas is neglectable (16900 km2 vs
16789 km2)
In terms of average runoff, Kastina-Ala has the lowest annual average value with 1395 mm,against 1611 mm for Ikom.
To compare the available data transposed to the site location, in Figure 6.11, two charts resuming
the transposed flow data are presented. One presents the average monthly flows for Egaga site
computed from each of the source gauging stations, while the second one presents adimensional
flow duration curves (FDC) (this meaning each flow value has been divided by the average flow, Qm)
for the Egaga site, also obtained from Ikom and Katsina-Ala gauging stations.
Table 6.5 presents the average monthly flows at Egaga Fall, obtained by catchment area ratio
transposition from Ikom and Katsina-Ala.
All the monthly flows for Egaga Fall obtained by transposition from each of the source gaugingstations are compiled in Annexe 10.

7/23/2019 06b 2014 WP 4 Hydrology Report
http://slidepdf.com/reader/full/06b-2014-wp-4-hydrology-report 46/103
Nigerian Energy Support Programme
Hydrology Report
42
Table 6.5 – Average monthly flows at Egaga Fall in m3 /s, obtained by catchment area ratio transposition fromIkom and Katsina-Ala gauging stations.
SourceGauging
Station
AreaRatio
Jan Feb Mar Apr May Jun Jul Aug Sep Oct Nov Dec Annual
(m3
/s)
Ikom 0.0007 0.10 0.07 0.10 0.13 0.24 0.56 1.00 1.46 1.55 1.26 0.48 0.17 0.60
Katsina-Ala 0.0006 0.08 0.04 0.05 0.12 0.26 0.49 0.79 0.79 1.17 1.26 0.50 0.20 0.48
Figure 6.11 – On the top: Average monthly flows for Egaga Fall obtained by transposition by catchment arearatio method from Ikom and Katsina-Ala gauging stations; on the bottom: Adimensional FDC for Egaga Fall
using flow transposition from both source gauging stations.
The observation of Figure 6.11and Table 6.5 tells that:
0.0
0.2
0.4
0.6
0.8
1.0
1.2
1.4
1.6
Jan Feb Mar Apr May Jun Jul Aug Sep Oct Nov Dec
A v e r a g e f l o w
( m 3 /
s )
Ikom Katsina‐Ala
0.0
0.5
1.0
1.5
2.0
2.5
3.0
3.5
0% 10% 20% 30% 40% 50% 60% 70% 80% 90% 100%
Q / Q m
% of exceedance
Ikom Katsina‐Ala

7/23/2019 06b 2014 WP 4 Hydrology Report
http://slidepdf.com/reader/full/06b-2014-wp-4-hydrology-report 47/103
Nigerian Energy Support Programme
Hydrology Report
43
Flow transposition from Katsina-Ala gauging station generates the lowest average monthly
flows in the period from January to April (low flow season).
Between June and September (which covers rain season), transposition from Ikom clearly
generates the highest average monthly flows.
Flows generated from Ikom gauging station show an extremer distribution of flows, having
the highest values of Q/Qm until an exceedance percentage of 40%. From and exceedance
percentage of 40% onwards both gauging stations have similar values of Q/Qm.
Additionally to the computed flow data at Egaga Fall by flow transposition, a flow measurement was
made at the site during the site visit in March 2015. At this occasion it was recorded a flow of 0.08
m3/s.
Comparing with the recorded flow at the site, 0.08 m3/s, the average flow obtained using Ikom
gauging station, 0.1 m3/s, is the closest one. However, the difference between the measured value
at the site and the average obtained using Katsina-Ala is not significantly bigger (0.05 m3/s vs 0.08
m3/s).
Considering the low flow conditions observed at Egaga Fall during the site visit, the average monthly
flows, the flows at low flow season, and the shape of the FDC (Table 6.5 and Figure 6.11), the flows
obtained by transposition from Katsina-Ala gauging station will be onwards used to proceed the
studies for Egaga Fall.
As already pointed out at the Mission Report, conditions at site were not ideal for flow measurements
due to the low flow and stepped nature of the river profile. It is assumed the measured flow is an
overestimation of the real flow at Egaga Fall during the site visit.
To use the flows obtained by transposition from Katsina-Ala is a cautious and conservative approach,
reasonable to consider due to the uncertainty on the accuracy of the flow data analysis and theimportance of low flow season for a Micro/Mini Hydropower Project.
In Figure 6.12 and Table 6.6, the average monthly flows adopted at Egaga Fall are presented, and
in Annexe 11, the complete set of flows is compiled.
Figure 6.12 – Average monthly flow and runoff at Egaga Fall.
0
20
40
60
80
100
120
140
160
180
200
220
2400.0
0.1
0.2
0.3
0.4
0.5
0.6
0.7
0.8
0.9
1.0
1.1
1.2
1.3
1.4
Jan Feb Mar Apr May Jun Jul Aug Sep Oct Nov Dec
R u n o f f ( m m )
Q ( m 3 / s )
Egaga Fall
Series2 Average Flow

7/23/2019 06b 2014 WP 4 Hydrology Report
http://slidepdf.com/reader/full/06b-2014-wp-4-hydrology-report 48/103
Nigerian Energy Support Programme
Hydrology Report
44
Table 6.6 – Average monthly flow and runoff at Egaga Fall.
Jan Feb Mar Apr May Jun Jul Aug Sep Oct Nov Dec Annual
Flow(m3 /s)
0.08 0.04 0.05 0.12 0.26 0.49 0.79 0.79 1.17 1.26 0.50 0.20 0.48
Runoff(mm)
18.6 8.6 12.9 29.5 64.7 116.2 194.4 194.7 277.0 309.1 119.7 49.8 1395.3
Flow Duration Curve
Figure 6.21 shows the flow duration curve at Tapa, while in Table 6.15 the flows corresponding to
several percentages of exceedance are presented.
Figure 6.13 – Flow Duration Curve at Egaga Fall.
Table 6.7 – Flow values for several percentages of exceedance for Egaga Fall.
% of exceedance 5% 10% 20% 30% 40% 50% 60% 70% 80% 85% 90% 95% 100%
Q (m3 /s) 1.32 1.14 0.93 0.70 0.52 0.36 0.22 0.12 0.07 0.05 0.04 0.03 0.01
It can be observed in Figure 6.13 and Table 6.7 that the flow regime at Egaga steadily decreases,
at an approximately constant rate, for flows corresponding to a percentage of exceedance between
10% and 70%. It can also be observed that, however, the flow values get extremely low during low
flow season, the stream will not dry.
0.0
0.2
0.4
0.6
0.8
1.0
1.2
1.4
1.6
1.8
0% 10% 20% 30% 40% 50% 60% 70% 80% 90% 100%
Q ( m 3 / s )
% of exceedance
Egaga Fall

7/23/2019 06b 2014 WP 4 Hydrology Report
http://slidepdf.com/reader/full/06b-2014-wp-4-hydrology-report 49/103
Nigerian Energy Support Programme
Hydrology Report
45
Ecological Flow
A common hydrology-based methodology applied for determining environmental flows in a river
reach is the Flow Duration Curve Analysis (FDCA) method. Smakhtin7 indicated that the design low-
flow range of an FDC ranges between 70% and 99% (meaning the flow corresponding to a
percentage of exceedance of 70% and 99%, Q70 and Q99 respectively). Pyrce8
mentions that Q90and Q95 are frequently used as indicator of low flow and have been widely used to set minimum
environmental flows.
For Egaga Fall, the environmental flow will be set at Q90, which equals a flow of 0.04 m3/s (Table
6.7).
Busi II
Location and general features
Busi II site is located at the north of Ogun state in the Obanliku LGA close to the the village Busi II
which gives this site its name. Table 6.8 resumes the location, administrative and basic hydrological
data about the site.
Table 6.8 – Location and basic hydrological features resume for Egaga Fall site.
Site Name Busi II
State Cross River
Local Government Area Obanliku
Latitude 6.54288889
Longitude 9.26477778
Hydrological Area (HA) Lower Benue (HA-4)
Catchment Area (km2) 7.9
In Figure 6.14 it can be observed the location of Busi II site, as well as the available nearby gauging
stations, and a satellite view of the watershed.
7 Smakhtin VU (2001) low flow hydrology: a review. J Hydrol 240(3-4):147-186.8 Pyrce R (2004) Hydrological low flow indices and their uses. Watershed Science Centre. WSC Report N0. 04, trent University,Peterborough, Ontario.

7/23/2019 06b 2014 WP 4 Hydrology Report
http://slidepdf.com/reader/full/06b-2014-wp-4-hydrology-report 50/103
Nigerian Energy Support Programme
Hydrology Report
46
Figure 6.14 – On the left: location of Busi II site in Cross River State and nearby gauging stations, on the right:Satellite view of Busi II site catchment area (source: Google Earth).
Flow Assessment
It was previously mentioned in page Error! Bookmark not defined. (Source Gauging Stations:
Error! Reference source not found.), that for Busi II and Egaga Fall sites, the nearby gauging
tations of Ikom and Katsina-Ala where selected to perform the flow analysis and assessment by
transposition method.
The brief analysis already presented in page 41 (Egaga Fall: Flow Assessment), will not be repeated
as it refers to the same data for the gauging stations of Ikom and Katsina-Ala.
In order to compare the flow data resulting from the flow transposition from Ikom and Katsina-Ala to
Busi II, two charts resuming the transposed flow data are presented in Figure 6.15. One shows theaverage monthly flows for Busi II site computed from each of the source gauging stations, while the
second one presents adimensional flow duration curves (FDC) (this meaning each flow value has
been divided by the average flow, Qm) for Busi II site, obtained, as well, from Ikom and Katsina-Ala
gauging stations.
Table 6.9 presents the average monthly flows at Busi II, obtained by catchment area ratio
transposition from Ikom and Katsina-Ala.
All the monthly flows for Busi II, obtained by transposition from both source gauging stations, are
compiled in Annexe 12.

7/23/2019 06b 2014 WP 4 Hydrology Report
http://slidepdf.com/reader/full/06b-2014-wp-4-hydrology-report 51/103
Nigerian Energy Support Programme
Hydrology Report
47
Table 6.9 – Average monthly flows at Busi II in m3 /s, obtained by catchment area ratio transposition from Ikomand Katsina-Ala gauging stations.
SourceGaugingStation
AreaRatio
Jan Feb Mar Apr May Jun Jul Aug Sep Oct Nov Dec Annual
(m3 /s)
Ikom 0.0005 0.07 0.05 0.07 0.09 0.17 0.40 0.73 1.06 1.12 0.91 0.34 0.12 0.43
Katsina-Ala 0.0005 0.05 0.03 0.04 0.09 0.19 0.35 0.57 0.57 0.84 0.91 0.36 0.15 0.35
Figure 6.15 – On the top: Average monthly flows for Busi II obtained by transposition by catchment area ratiomethod from Ikom and Katsina-Ala gauging stations; on the bottom: Adimensional FDC for Busi II site using
flow transposition from both source gauging stations.
0.0
0.1
0.2
0.3
0.4
0.5
0.6
0.7
0.8
0.9
1.0
1.1
1.2
Jan Feb Mar Apr May Jun Jul Aug Sep Oct Nov Dec
A v e r a g e f l o w
( m 3 / s )
Ikom Katsina‐Ala
0.0
0.2
0.4
0.6
0.8
1.0
1.2
1.4
1.6
1.8
2.0
2.2
2.4
2.6
0% 10% 20% 30% 40% 50% 60% 70% 80% 90% 100%
Q / Q m
% of exceedance
Ikom Katsina‐Ala

7/23/2019 06b 2014 WP 4 Hydrology Report
http://slidepdf.com/reader/full/06b-2014-wp-4-hydrology-report 52/103
Nigerian Energy Support Programme
Hydrology Report
48
The observation of Figure 6.15 and Table 6.9 tells that:
Flow transposition from Katsina-Ala gauging station generates the lowest average monthly
flows in the period from January to April (low flow season).
Between June and September (which covers rain season), transposition from Ikom clearly
generates the highest average monthly flows. Flows generated from Ikom gauging station show an extremer distribution of flows, having
the highest values of Q/Qm until an exceedance percentage of 40%. From and exceedance
percentage of 40% onwards both gauging stations have similar values of Q/Qm.
Additionally to the computed flow data at Busi II by flow transposition, during the site visit in March
2015 a flow was measured at the site. At this occasion it was recorded a flow of 0.035 m3/s.
Comparing with the recorded flow at the site, 0.035 m3/s, the average flow obtained using Katsina-
Ala gauging station, 0.04 m3/s, is the closest one.
Considering the low flow conditions observed at Busi II during the site visit, the average monthly
flows, the flows at low flow season, and the shape of the FDC (Table 6.9 and Figure 6.11), the flows
obtained by transposition from Katsina-Ala gauging station will be onwards used to proceed the
studies for Busi II.
To use the flows obtained by transposition from Katsina-Ala is a cautious and conservative approach,
which is reasonable to consider due to the uncertainty on the accuracy of the flow data analysis and
the importance of low flow season for a Micro/Mini Hydropower Project.
In Figure 6.16 and Table 6.10, the average monthly flows adopted at Busi II are presented, and in
Annexe 11, the complete set of flows is compiled.
Figure 6.16 – Average monthly flow and runoff at Busi II.
0
20
40
60
80
100
120
140
160
180
200
220
240
260
280
300
320
3400.0
0.1
0.2
0.3
0.4
0.5
0.6
0.7
0.8
0.9
1.0
Jan Feb Mar Apr May Jun Jul Aug Sep Oct Nov Dec
R u n o f f ( m m )
Q ( m 3 / s )
Busi II
Average Runoff Series1

7/23/2019 06b 2014 WP 4 Hydrology Report
http://slidepdf.com/reader/full/06b-2014-wp-4-hydrology-report 53/103
Nigerian Energy Support Programme
Hydrology Report
49
Table 6.10 – Average monthly flow and runoff at Busi II.
Jan Feb Mar Apr May Jun Jul Aug Sep Oct Nov Dec Annual
Flow(m3 /s)
0.05 0.03 0.04 0.09 0.19 0.35 0.57 0.57 0.84 0.91 0.36 0.15 0.35
Runoff(mm)
13.5 6.2 9.3 21.4 46.9 84.2 140.9 141.1 200.8 224.0 86.8 36.1 1011.3
Flow Duration Curve
Figure 6.17 shows the flow duration curve at Busi II, while in Table 6.11 the flows corresponding to
several percentages of exceedance are presented.
Figure 6.17 – Flow Duration Curve at Busi II.
Table 6.11 – Flow values for several percentages of exceedance for Busi II.
% of exceedance 5% 10% 20% 30% 40% 50% 60% 70% 80% 85% 90% 95% 100%
Q (m3 /s) 0.96 0.82 0.67 0.51 0.38 0.26 0.16 0.08 0.05 0.04 0.03 0.02 0.01
It can be observed in Figure 6.17 and Table 6.11 that the flow regime at Busi II steadily decreases,
at an approximately constant rate, for flows corresponding to a percentage of exceedance between
10% and 70%. It can also be observed that, however the flow values get extremely low during low
flow season, the stream will not dry.
Ecological Flow
For Egaga Fall, the environmental flow will be set at Q90, which equals a flow of 0.03 m3/s (Table
6.11).
0.0
0.1
0.2
0.3
0.4
0.5
0.6
0.7
0.8
0.9
1.0
1.1
1.2
1.3
0% 10% 20% 30% 40% 50% 60% 70% 80% 90% 100%
Q ( m 3 / s )
% of exceedance
Busi II

7/23/2019 06b 2014 WP 4 Hydrology Report
http://slidepdf.com/reader/full/06b-2014-wp-4-hydrology-report 54/103
Nigerian Energy Support Programme
Hydrology Report
50
Tapa
Location and general features
The Tapa site is located in Niger state in the Gurara LGA, close to the border with Federal Capital
Territory. Table 6.12 resumes the location, administrative and basic hydrological data about the site.Table 6.12 – Location and basic hydrological features resume for Tapa site.
Site Name Tapa
State Niger
Local Government Area Gurara
Latitude 9.31473361
Longitude 7.02030861
Hydrological Area (HA) Niger Central (HA-2)
Catchment Area (km2) 694
In Figure 6.18, it can be observed the location of Tapa site, as well as the available nearby gauging
stations, and a satellite view of the watershed.

7/23/2019 06b 2014 WP 4 Hydrology Report
http://slidepdf.com/reader/full/06b-2014-wp-4-hydrology-report 55/103
Nigerian Energy Support Programme
Hydrology Report
51
Figure 6.18 – On the top: location of Tapa site and catchment area and nearby gauging stations, on the right:Satellite view of Tapa catchment area (source: Google Earth).
Flow Assessment
A brief analysis on the previously presented data for the gauging stations of Izom, Ebba, Kachia,
Kaeia (page Error! Bookmark not defined.) points out that:
In terms of distance to the site location, Izom is the closest gauging station, but on the other
hand, it has the largest catchment area (6203 km2)
Kaeia is the gauging station with the closest catchment area to the one of Tapa (599 km2
versus 694 km2)
Kachia has the smallest catchment area (124 km2).
In terms of average runoff, Ebba has the lowest annual average value with 212 mm, which
is about 3 times lower than the one of Izom (680 mm), while Kachia and Kaeia have
respectively 399 mm and 413 mm.
The similarity of average annual runoff values from Kachia and Kaeia gauging stations is
consistent with their location, as they are located quite close to each other. Thus, similar
hydrological conditions can be expected, even if the catchment areas differ.
To compare the available data transposed to the site location, in Figure 6.19, two charts resuming
the transposed flow data are presented. One presents the average monthly flows for Tapa site
computed from each of the source gauging stations, while the second one presents adimensional
flow duration curves (FDC) (this meaning each flow value has been divided by the average flow, Qm)
for the Tapa site, also obtained from the four source gauging stations.
Table 6.13 presents the average monthly flows at Tapa, obtained by catchment area ratio
transposition from Izom, Ebba, Kaeia and Kachia gauging stations.
All the monthly flows for Tapa obtained by transposition from each of the source gauging station
area complied in Annexe 14.
.

7/23/2019 06b 2014 WP 4 Hydrology Report
http://slidepdf.com/reader/full/06b-2014-wp-4-hydrology-report 56/103
Nigerian Energy Support Programme
Hydrology Report
52
Table 6.13 – Average monthly flows at Tapa in m3 /s, obtained by catchment area ratio transposition from Izom,Ebba, Kaeia and Kachia gauging stations.
SourceGaugingStation
AreaRatio
Jan Feb Mar Apr May Jun Jul Aug Sep Oct Nov Dec Annual
Izom 0.11 1.24 0.78 0.58 1.83 6.02 10.49 24.52 41.56 53.39 31.12 6.19 1.87 15.05
Ebba 0.37 0.29 0.19 0.15 0.18 0.31 0.67 2.68 10.93 24.07 12.95 2.75 0.70 4.67
Kaeia 1.24 1.01 0.73 0.59 2.49 4.46 6.89 20.80 23.73 31.17 14.28 3.44 1.54 9.31
Kachia 5.60 2.21 1.77 1.43 2.65 6.90 9.13 19.08 20.12 20.45 10.69 4.29 2.75 8.50
Figure 6.19 – On the top: Average monthly flows for Tapa obtained by transposition by catchment area ratiomethod from each of the four source gauging stations; on the bottom: Adimensional FDC for Tapa site using
flow transposition from each of the four source gauging stations.
0
5
10
15
20
25
30
35
40
45
50
55
Jan Feb Mar Apr May Jun Jul Aug Sep Oct Nov Dec
A v e r a g e f l o w
( m 3 / s )
Izom Ebba Kaeia Kachia
0.0
0.5
1.0
1.5
2.0
2.5
3.0
3.5
4.0
4.5
5.0
5.5
6.0
6.5
7.0
7.5
8.0
8.5
0% 10% 20% 30% 40% 50% 60% 70% 80% 90% 100%
Q
/ Q
m
% of exceedance
Izom Ebba Kaeia Kachia

7/23/2019 06b 2014 WP 4 Hydrology Report
http://slidepdf.com/reader/full/06b-2014-wp-4-hydrology-report 57/103
Nigerian Energy Support Programme
Hydrology Report
53
The observation of Figure 6.19 and Table 6.13 tells that:
Flow transposition from Ebba gauging station generates the lowest average monthly flows in
all months except September and October.
Between May and November (which covers all rain season), transposition from Izom clearly
generates the highest average monthly flows. Transposition from Kachia generates the highest monthly average monthly flows between
January and May (which covers all low flow season).
Flows generated from Ebba gauging station show an extremer distribution of flows, having
the highest values of Q/Qm and having lower values of Q/Qm when compared to the values
obtained from the other three gauging stations (Izom, Kaeia and Kachia) from an exceedance
period of about 20%.
Additionally to the obtained flow data at tapa by flow transposition, during the site visit in March 2015
a flow measurement was made at the site. At this occasion it was recorded a flow of 0.095 m3/s.
Comparing with the recorded flow at the site, 0.095 m3/s, the average flow obtained using Ebbagauging station, 0.15 m3/s, is clearly the closest one. Besides this, the shape of the FDC obtained
from Ebba.
Considering the low flow conditions observed at Tapa during the site visit, the average monthly flows,
the flows at low flow season, and the shape of the FDC (Table 6.13 and Figure 6.19), the flows
obtained by transposition from Ebba gauging station will be onwards used to proceed the studies for
Tapa. To use the flows obtained by transposition from Ebba is a cautious and conservative approach,
which is reasonable considering the uncertainty on the accuracy of the flow data analysis and the
importance of low flow season for a Micro/Mini Hydropower Project.
In Figure 6.20 and Table 6.14, the average monthly flows adopted at Tapa are presented, and in Annexe 15 the complete set of flows is compiled.
Figure 6.20 – Average monthly flow and runoff at Tapa.
0
10
20
30
40
50
60
70
80
90
1000
2
4
6
8
10
12
14
16
18
20
22
24
26
Jan Feb Mar Apr May Jun Jul Aug Sep Oct Nov Dec
R u n o f f
( m m )
Q ( m
3 / s )
Tapa
Average Runoff Average Flow

7/23/2019 06b 2014 WP 4 Hydrology Report
http://slidepdf.com/reader/full/06b-2014-wp-4-hydrology-report 58/103
Nigerian Energy Support Programme
Hydrology Report
54
Table 6.14 – Average monthly flow and runoff at Tapa.
Jan Feb Mar Apr May Jun Jul Aug Sep Oct Nov Dec Annual
Flow(m3 /s)
0.29 0.19 0.15 0.18 0.31 0.67 2.68 10.93 24.07 12.95 2.75 0.70 4.67
Runoff(mm)
1.1 0.7 0.6 0.7 1.2 2.5 10.4 42.2 89.9 50.0 10.3 2.7 212.1
Flow Duration Curve
Figure 6.21 shows the flow duration curve at Tapa, while in Table 6.15 the flows corresponding to
several percentages of exceedance are presented.
Figure 6.21 – Flow Duration Curve at Tapa.
Table 6.15 – Flow values for several percentages of exceedance for Tapa.
% of exceedance 5% 10% 20% 30% 40% 50% 60% 70% 80% 85% 90% 95% 100%
Q (m3 /s) 24.57 18.36 7.93 3.55 1.09 0.56 0.41 0.28 0.27 0.14 0.00 0.00 0.00
It can be observed in Figure 6.21 and Table 6.14 that the flow regime at Tapa has huge variations
between rain season and low flow season. For about 60% of the period of available records, the
flows at the site are lower than 1 m3/s, and for 10% of that period there is no flow. This is an indicator
that in dry years, periods with absence of flow are likely.
Ecological Flow
For Tapa, the environmental flow will be set at Q85, which equals a flow of 0.14 m3/s (Table 6.15).
0
5
10
15
20
25
30
35
40
0% 10% 20% 30% 40% 50% 60% 70% 80% 90% 100%
Q ( m 3 / s )
% of exceedance
Tapa

7/23/2019 06b 2014 WP 4 Hydrology Report
http://slidepdf.com/reader/full/06b-2014-wp-4-hydrology-report 59/103
Nigerian Energy Support Programme
Hydrology Report
55
7. Conclusions
The climate in Nigeria is semi-arid in the north and humid in the south. Rainfall patterns are marked
by distinct wet and dry seasons, with rainfall concentrating in the period from June to September.
The mentioned climate features heavily influence the country’s hydrology.
Mean annual runoff decreases from south, where in hydrological areas (HA) HA-5 and HA-7 it can
achieve values around 1000 mm, to north, where in some areas of HA-1 and HA-8, the mean annual
runoff can be as low as less than 20 mm (Figure 7.1 and Figure 7.2).
Figure 7.1 – Map of mean annual runoff in Nogeria (source: JICA1).
The rainfall pattern has a direct influence in the flow distribution through the year, resulting in a clear
low flow season and significant differences between maximum and low flows (Figure 7.2).
0
1
2
3
4
5
6
7
8
9
100
20
40
60
80
100
120
140
160
180
200
Jan Feb Mar Apr May Jun Jul Aug Sep Oct Nov Dec
R u n o f f ( m m )
Q ( m 3 / s )
Wamako
Average R un of f A ve rag e Flow
0
20
40
60
80
100
120
140
160
180
200
2200
500
1000
1500
2000
2500
3000
3500
Jan Feb Mar Apr May Jun Jul Aug Sep Oct Nov Dec
R u n o f f ( m m )
Q ( m 3 / s )
Wuya
Average Ru no ff Av er ag e Flow

7/23/2019 06b 2014 WP 4 Hydrology Report
http://slidepdf.com/reader/full/06b-2014-wp-4-hydrology-report 60/103
Nigerian Energy Support Programme
Hydrology Report
56
Figure 7.2 – Average monthly flows and runoff for gauging stations in Sokoto, Niger, Ogun and Niger states.
The northern areas of Nigeria are not suitable for any kind of run-off hydropower scheme due to
severe flow scarcity during low flow season. This is even more relevant for micro/mini hydropower
as these schemes are usually located in small catchment areas, which, in general, have lowerspecific yields than bigger watersheds. However, even in central and southern areas of the country,
the flow pattern and low flow season can be threat to the viability of a run-off hydropower project.
In the case of Tapa site in Niger state (Figure 7.3), the highest average monthly flow is 161 times
bigger than the lowest average monthly flow (24.07 m3/s vs 0.15 m3/s), and the flow is at reduced
levels, when compared to the month with higher flows, for around half of the year.
Figure 7.3 – Average monthly flow and runoff, and FDC at Tapa.
The sites located in the south of the country (Egaga Fall and Busi II) are located in areas that, onaverage, have reasonable mean annual runoff yield. However, the fact that their catchment areas
are small (10.9 km2 for Egaga and 7.9 km2 for Busi II) is a concern regarding flow scarcity during low
flow season (Figure 7.4).
0
5
10
15
20
25
30
35
40
45
50
55
60
650
20
40
60
80
100
120
140
160
180
200
Jan Feb Mar Apr May Jun Jul Aug Sep Oct Nov Dec
R u n o f f ( m m )
Q ( m 3 / s )
Apoje
Average Ru no ff A ve ra ge Flow
0
40
80
120
160
200
240
280
320
3600
200
400
600
800
1000
1200
1400
1600
1800
2000
2200
2400
Jan Feb Mar Apr May Jun Jul Aug Sep Oct Nov Dec
R u n o f f ( m m )
Q
( m 3 / s )
Ikom
Average Ru noff Av er ag e Flow
0
10
20
30
40
50
60
70
80
90
1000
2
4
6
8
10
12
14
16
18
20
22
24
26
Jan Feb Mar Apr May Jun Jul Aug Sep Oct Nov Dec
R u n o f f ( m m )
Q ( m 3 / s )
Tapa
Average Ru no ff A ve ra ge Flow
0
2
4
6
8
10
12
14
16
18
20
22
24
26
2830
32
34
36
38
0% 10% 20% 30% 40% 50% 60% 70% 80% 90% 100%
Q ( m 3 / s )
% of exceedance
Tapa

7/23/2019 06b 2014 WP 4 Hydrology Report
http://slidepdf.com/reader/full/06b-2014-wp-4-hydrology-report 61/103
Nigerian Energy Support Programme
Hydrology Report
57
Figure 7.4 – Average monthly flow and runoff, and FDC at Egaga Fall and Busi II.
For both of the sites it is clear that a low flow season with extremely low flow values (under 100 l/s)
lasts for four months (January to April). The flow measurements at the sites 0.08 m3/s at Egaga Fall
and 0.035 m3/s at Busi II, in March 2015, also confirm the issues with flow scarcity. Moreover,
regarding the flow regime, the ratio between the higher and lower average monthly flows being
stands at 33.
It is clear that, for the three sites considered to have potential for Micro/Mini Hydropower (Tapa,
Egaga Fall and Busi II), low flow season will be an issue regarding all year round production, and it
is reasonable to consider that a shutdown period will be mandatory.
Environmental flows have to be considered, as they will also impose a limitation on operation at low
flow conditions.
Operation ranges of electromechanical equipment can be adapted to flow conditions, and operation
with extremely low levels of flow is not impossible (however, with a significant reduction of the
equipment’s efficiency and lifetime).
It will be the economical sustainability to limit the feasibility of the projects.
0
20
40
60
80
100
120
140
160180
200
220
240
260
280
300
320
3400.0
0.1
0.2
0.3
0.4
0.5
0.6
0.7
0.8
0.9
1.0
1.1
1.2
1.3
1.4
Jan Feb Mar Apr May Jun Jul Aug Sep Oct Nov Dec
R u n o f f (
m m )
Q ( m 3
/ s )
Egaga
Average R uno ff A ve ra ge Flow
0.0
0.2
0.4
0.6
0.8
1.0
1.2
1.4
1.6
1.8
0% 10% 20% 30% 40% 50% 60% 70% 80% 90% 100%
Q ( m 3 / s )
% of exceedance
Egaga Fall
0
20
40
60
80
100120
140
160
180
200
220
240
260
280
300
320
3400.0
0.1
0.2
0.3
0.4
0.5
0.6
0.7
0.8
0.9
1.0
Jan Feb Mar Apr May Jun Jul Aug Sep Oct Nov Dec
R u n o f f ( m m )
Q ( m 3 / s )
Busi II
Average R un of f S er ies 1
0.0
0.1
0.2
0.3
0.4
0.5
0.6
0.7
0.8
0.9
1.0
1.1
1.2
1.3
0% 10% 20% 30% 40% 50% 60% 70% 80% 90% 100%
Q ( m 3 / s )
% of exceedance
Busi II

7/23/2019 06b 2014 WP 4 Hydrology Report
http://slidepdf.com/reader/full/06b-2014-wp-4-hydrology-report 62/103
Nigerian Energy Support Programme
Hydrology Report
Annexes

7/23/2019 06b 2014 WP 4 Hydrology Report
http://slidepdf.com/reader/full/06b-2014-wp-4-hydrology-report 63/103
Nigerian Energy Support Programme
Hydrology Report
I
Annexe 1
SHA boundaries (source: JICA1)

7/23/2019 06b 2014 WP 4 Hydrology Report
http://slidepdf.com/reader/full/06b-2014-wp-4-hydrology-report 64/103
Nigerian Energy Support Programme
Hydrology Report
II

7/23/2019 06b 2014 WP 4 Hydrology Report
http://slidepdf.com/reader/full/06b-2014-wp-4-hydrology-report 65/103
Nigerian Energy Support Programme
Hydrology Report
III

7/23/2019 06b 2014 WP 4 Hydrology Report
http://slidepdf.com/reader/full/06b-2014-wp-4-hydrology-report 66/103
Nigerian Energy Support Programme
Hydrology Report
IV

7/23/2019 06b 2014 WP 4 Hydrology Report
http://slidepdf.com/reader/full/06b-2014-wp-4-hydrology-report 67/103
Nigerian Energy Support Programme
Hydrology Report
Annexe 2
List of Available Hydrological Stations

7/23/2019 06b 2014 WP 4 Hydrology Report
http://slidepdf.com/reader/full/06b-2014-wp-4-hydrology-report 68/103
Nigerian Energy Support Programme
Hydrology Report

7/23/2019 06b 2014 WP 4 Hydrology Report
http://slidepdf.com/reader/full/06b-2014-wp-4-hydrology-report 69/103
Nigerian Energy Support Programme
Hydrology Report

7/23/2019 06b 2014 WP 4 Hydrology Report
http://slidepdf.com/reader/full/06b-2014-wp-4-hydrology-report 70/103
Nigerian Energy Support Programme
Hydrology Report
I
Annexe 3
List of Meteorological Stations Operated by NIMET.

7/23/2019 06b 2014 WP 4 Hydrology Report
http://slidepdf.com/reader/full/06b-2014-wp-4-hydrology-report 71/103
Nigerian Energy Support Programme
Hydrology Report
II
Annexe 4
Monthly flows for gauging stations in Sokoto State.
Wamako 1 2 3 4 5 6 7 8 9 10 11 12
137219 Jan Feb Mar Apr May Jun Jul Aug Sep Oct Nov Dec Annual
1960
1961
1962
1963
1964
1965
1966
1967
1968
1969
1970 1.49 1.24 1.12 0.00 0.37 4.24 43.68 288.61 309.03 159.42 3.47 1.87 68.30
1971 1.49 1.24 1.12 0.77 0.75 6.17 63.84 215.05 253.86 38.46 3.47 1.87 49.21
1972 0.00 0.00 0.00 1.16 1.49 23.53 33.60 101.93 74.85 6.35 1.16 0.75 20.52
1973 4.11 0.41 0.37 0.39 0.37 7.72 56.00 117.61 52.85 1.87 0.39 0.37 20.42
1974 0.37 0.41 0.37 0.39 0.37 3.09 73.18 267.70 255.40 92.59 2.31 1.12 58.50
1975 0.37 0.41 0.37 0.39 1.87 19.68 64.59 189.67 219.14 57.12 4.24 1.12 46.801976 1.12 0.40 0.37 0.39 0.37 15.05 44.80 93.71 45.91 29.12 6.94 1.12 20.13
1977 0.37 0.41 0.37 0.00 0.00 1.54 36.59 132.17 220.29 23.15 0.77 0.37 34.72
1978 0.00 0.00 0.00 1.16 6.72 35.49 106.78 161.29 187.11 54.14 0.39 0.00 46.36
1979 0.37 0.00 0.00 0.00 1.12 2.31 26.88 195.27 235.73 1.87 1.16 0.00 38.81
1980 0.00 0.00 0.00 0.00 0.00 5.02 33.98 225.88 131.17 2.61 0.77 0.00 33.55
1981
1982 0.00 0.00 0.00 0.00 0.00 27.39 45.18 173.61 114.58 3.73 0.00 0.00 30.57
1983 0.00 0.00 0.00 0.00 0.00 49.38 72.80 164.65 103.01 0.75 0.00 0.00 32.76
1984 0.00 0.00 0.00 0.00 0.00 12.73 78.41 128.06 62.11 13.44 0.00 0.00 24.83
1985 0.00 0.00 0.00 0.00 0.00 59.03 177.34 305.78 162.81 0.00 0.00 0.00 59.27
1986
1987
1988
1989
1990
1991
1992
1993
1994
1995
1996
1997
1998
1999
2000
2001
2002
2003
20042005
2006
2007
2008
2009
Average Flow 0.65 0.30 0.27 0.31 0.90 18.16 63.84 184.07 161.86 32.31 1.67 0.57 39.0
Average Runoff 0.0 0.0 0.0 0.0 0.0 0.3 1.2 3.6 3.1 0.6 0.0 0.0 9.0

7/23/2019 06b 2014 WP 4 Hydrology Report
http://slidepdf.com/reader/full/06b-2014-wp-4-hydrology-report 72/103
Nigerian Energy Support Programme
Hydrology Report
III
Goronyo Dam 1 2 3 4 5 6 7 8 9 10 11 12
30547 Jan Feb Mar Apr May Jun Jul Aug Sep Oct Nov Dec Annual
1960
1961
1962
19631964
1965
1966
1967
1968
1969
1970 0.37 0.41 0.37 0.39 0.00 0.00 13.07 129.18 209.10 89.61 1.93 0.00 37.16
1971 0.75 0.83 0.75 0.39 0.37 0.77 23.89 93.34 139.66 22.03 1.93 1.12 23.88
1972 0.75 0.80 0.75 0.77 0.00 4.63 11.57 77.28 68.67 5.97 0.77 0.37 14.43
1973 0.00 0.00 0.00 0.00 0.00 5.79 37.71 78.78 35.49 1.12 0.77 0.37 13.48
1974 0.00 0.00 0.00 0.00 0.00 1.93 39.95 146.36 139.27 50.40 1.54 1.12 31.93
1975 0.00 0.00 0.00 0.00 0.00 12.35 36.22 106.41 123.07 32.11 2.70 1.49 26.32
1976 0.00 0.00 0.00 0.00 0.00 10.80 30.24 63.10 30.86 19.41 4.63 0.75 13.44
1977 0.00 0.00 0.00 0.00 0.00 1.16 21.65 78.03 130.40 13.81 0.00 0.00 20.45
1978 0.00 0.00 0.00 0.00 0.00 24.69 60.48 91.10 105.32 29.87 0.00 0.00 26.10
1979 0.00 0.00 0.00 0.00 0.00 2.31 15.31 113.13 136.57 1.12 0.77 0.00 22.48
1980 0.00 0.00 0.00 0.00 0.00 2.70 20.16 134.41 77.93 1.87 0.39 0.00 19.95
1981
1982 0.00 0.00 0.00 0.00 0.00 15.82 25.76 99.31 65.59 1.87 0.00 0.00 17.47
1983 0.00 0.00 0.00 0.00 0.00 28.16 41.44 93.71 58.64 0.37 0.00 0.00 18.65
1984 0.00 0.00 0.00 0.00 0.00 7.33 45.55 74.30 35.88 7.47 0.00 0.00 14.36
1985 0.00 0.00 0.00 0.00 0.00 32.79 98.57 170.25 90.66 0.00 0.00 0.00 32.98
1986
1987
1988
1989
1990
1991
19921993
1994
1995
1996
1997
1998
1999
2000
2001
2002
2003
2004
2005
2006
2007
2008
2009
Average Flow 0.12 0.14 0.12 0.10 0.02 10.08 34.77 103.25 96.48 18.47 1.03 0.35 22.2
Average Runoff 0.0 0.0 0.0 0.0 0.0 0.9 3.0 9.1 8.2 1.6 0.1 0.0 22.9

7/23/2019 06b 2014 WP 4 Hydrology Report
http://slidepdf.com/reader/full/06b-2014-wp-4-hydrology-report 73/103
Nigerian Energy Support Programme
Hydrology Report
IV
Annexe 5
Monthly flows for gauging stations in Niger State.
Jebba 1 2 3 4 5 6 7 8 9 10 11 12
1629481 Jan Feb Mar Apr May Jun Jul Aug Sep Oct Nov Dec Annual
1960 1982.26 2054.48 1991.29 1242.00 534.13 412.67 856.39 1681.61 4044.67 3892.90 2211.33 1918.06 1899.73
1961 1960.32 2033.93 1961.29 1389.73 597.35 359.33 660.03 1475.48 3403.00 2984.84 1785.67 1705.81 1689.81
1962 1791.94 1852.14 1583.55 769.93 367.52 307.37 677.42 1735.71 4659.67 4859.35 2579.00 2066.45 1936.65
1963 2055.48 2131.79 2168.06 1745.67 882.29 529.00 846.10 2395.48 3306.33 3490.32 2076.67 1733.55 1945.56
1964 1816.13 1931.03 1894.52 1199.43 479.32 395.23 490.74 1857.13 3271.33 3483.55 2075.33 1733.55 1717.02
1965 2018.06 2154.64 2133.23 1704.33 796.52 517.97 621.65 1780.13 3943.00 3250.65 1990.00 1850.65 1893.06
1966 1943.87 2033.93 1900.00 1031.00 476.77 442.80 558.77 815.19 2873.33 3005.16 1874.00 1736.45 1553.72
1967 1868.71 1988.93 1940.65 1005.37 386.81 305.97 366.68 1419.94 3972.67 3901.94 2129.67 1928.06 1765.19
1968 2104.19 2279.31 2316.13 1855.33 890.10 696.53 1465.48 1647.74 1941.33 1418.90 1624.63 1715.81 1659.36
1969 1719.35 1861.79 1501.16 1147.33 1145.61 778.40 1075.68 1162.26 2376.33 1348.06 2156.33 1775.81 1499.86
1970 1992.58 2224.64 2255.81 1891.33 1097.74 1016.27 1183.77 1849.81 2265.00 1760.65 1404.33 1416.45 1692.76
1971 1520.32 1659.29 1229.03 883.63 895.29 1001.63 1244.84 1643.55 1625.33 1343.55 995.27 1038.84 1254.83
1972 1607.10 1587.59 1065.13 1045.27 1013.16 1022.43 869.23 613.45 693.27 652.03 541.50 1236.58 992.56
1973 1226. 19 1090. 25 641. 16 532. 70 600. 32 638. 57 641. 52 777. 13 1298. 67 952. 26 719. 73 923. 48 835.18
1974 1144.16 793.18 594.39 422.20 542.26 583.30 597.30 1316.73 2836.33 1751.29 1278.67 1504.52 1114.50
1975 1760.00 1652.50 971.74 913.27 835.32 831.87 1185.42 1250.68 1045.27 1154.39 1328.33 1552.90 1205.08
1976 1768.71 1835.86 1208.06 939.23 989.65 1116.23 1173.65 1026.94 939.47 985.45 919.67 688.71 1128.54
1977 755.81 1430.29 1539.03 1176.43 947.58 919.40 1028.35 1262.48 1315.33 1369.03 813.73 656.90 1098.99
1978 657. 10 647. 11 642. 39 633. 27 646. 52 948. 03 965. 81 720. 06 826. 77 1158. 39 953. 73 926. 13 811.45
1979 1170.26 1246.79 823.19 702.37 767.32 891.00 1139.03 1949.68 2395.33 1850.97 1224.80 1324.52 1290.65
1980 1438.06 1640.00 941.93 970.33
1981 921.32 951.67 1002.19 1006.61 1632.63 1526.13 1004.30 948.48
1982 1219.68 1183.21 879.42 1091.87 1104.00 934.53 909.16 1133.55 1064.00 994.48 874.90 862.68 1019.95
1983
1984 392. 32 425. 25 438. 66 523. 45 623. 46 792. 64 868. 43 795. 52 800. 48 457. 56 514. 49
1985 585. 42 540. 26 483. 12 464. 51 451. 39 361. 88 328. 18 561. 16 1500. 77 1343. 71 717. 59 1061. 45 700.60
1986 1025. 61 647. 32 653. 38 638. 50 773. 60 766. 59 794. 50 950. 90 687. 47 333. 42 764. 60 828. 97 739.76
1987 1102. 16 803. 89 944. 00 746. 57 848. 48 973. 90 839. 42 828. 68 838. 00 682. 00 863. 53 809. 65
857.141988 1028. 68 706. 79 659. 45 930. 37 564. 52 457. 80 462. 22 813. 55 2489. 20 1819. 00 998. 07 1142. 85 1006.17
1989 991. 64 613. 01 574. 22 743. 44 836. 32 716. 44 363. 65 1160. 97 1613. 33 1849. 45 814. 87 1112. 84 951.69
1990 1048. 48 937. 11 894. 74 221. 40 504. 68 448. 97 149. 45 332. 13 856. 00 454. 81
1991 392.13 386.73
1992 604.58 411.16 209.20 364.40 1106.77
1993 1161.00 1143.00 1290.17 1115.89 770.23 612.40 522.58 537.58 1124.27 918.06 530.10 349.61 837.01
1994 434. 77 470. 57 494. 61 529. 11 319. 30 146. 90 153. 13 589. 27 2311. 67 3908. 71 1785. 67 1540. 97 1060.38
1995 1710.97 2068.93 1758.39 1432.00 1518.71 1623.67 1494.58 1660.00
1996 903. 45 823. 14 746. 16 500. 00 557. 22 358. 27 665. 45 702. 23 1243. 93 1125. 32 1072. 37 893. 03 799.08
1997 1211.45 1231.00 872.42 946.57 513.23
1998
1999
2000
2001
20022003
2004
2005
2006
2007
2008
2009
Average 1392.02 1402.65 1210.55 953.88 738.18 687.59 780.48 1168.69 1986.47 1886.54 1308.58 1268.91 1230.6
Average Runoff 2.3 2.1 2.0 1.5 1.2 1.1 1.3 1.9 3.2 3.1 2.1 2.1 23.8

7/23/2019 06b 2014 WP 4 Hydrology Report
http://slidepdf.com/reader/full/06b-2014-wp-4-hydrology-report 74/103
Nigerian Energy Support Programme
Hydrology Report
V
Baro 1 2 3 4 5 6 7 8 9 10 11 12
1726856 Jan Feb Mar Apr May Jun Jul Aug Sep Oct Nov Dec Annual
1960
1961 1329.09 417.04 246.91 1115.96 2597.82 4609.95 4746.12 2011.96 1594.98
1962 1656.96 1732.80 1531.14 641.98 181.08 354.94 1214.16 2579.90 7248.07 7548.16 3815.97 2075.87 2550.01
1963 1861.93 1943.20 1988.87 1837.96 813.17 513.89 1478.12 4118.13 5792.05 5996.12 3250.00 1829.82 2621.641964 1789.87 1843.07 1810.04 1194.83 474.16 679.01 779.94 3002.17 6809.03 6058.84 2560.96 1854.84 2404.89
1965 1804.06 1932.04 2001.94 1623.07 744.10 709.88 1133.14 3110.07 5508.10 5185.93 2415.90 1833.93 2334.28
1966 1844.01 1824.16 1762.99 998.84 510.01 964.12 1263.81 2940.93 6172.84 5813.17 2537.81 1805.93 2371.10
1967 1823.85 1943.20 1904.12 1104.17 442.05 190.97 1080.12 2544.06 5991.90 6600.96 2839.89 1995.97 2373.54
1968 2071.01 2234.20 2296.89 1944.06 990.89 1060.19 2535.84 5766.13 5520.83 2993.95 2006.94 1767.10 2601.63
1969 1676.00 1992.81 1512.84 1153.94 1163.01 787.81 2069.15 3493.13 5998.84 4121.12 3158.18 2006.05 2427.51
1970 2046.37 2246.61 2276.36 2023.53 1159.65 1197.15 1755.15 3632.02 5734.57 3881.42 1750.77 1468.79 2429.86
1971 1502.02 1719.58 1272.77 820.22 910.62 1117.28 1898.15 3994.55 5356.87 3332.96 1261.96 1072.66 2022.83
1972 1409.80 1578.07 1069.67 970.29 1058.47 1413.19 1487.83 2351.40 3564.43 1842.14 606.48 1121.57 1538.04
1973 1246.64 1124.34 598.49 425.54 509.26 640.43 894.56 2381.27 3414.35 2501.49 911.27 939.74 1299.85
1974 1112.60 814.32 526.43 423.61 636.20 660.49 1101.78 2486.56 5376.93 4742.76 1817.52 1620.00 1781.30
1975 1668.91 1763.39 1030.47 923.23 973.72 1024.31 2030.32 2459.30 4451.39 3725.36 1786.65 1646.88 1957.60
1976 1777.93 1802.36 1312.72 936.34 1100.66 1485.73 1883.96 1903.00 2251.16 3739.17 2359.18 858.35 1784.35
1977 751.57 1323.58 1559.89 1163.19 1108.50 1493.83 1286.59 1599.09 3540.12 3387.10 931.33 694.44 1569.63
1978 608.20 589.04 568.25 602.62 715.35 1261.96 1910.10 2523.52 4576.39 3462.14 1838.73 949.45 1637.62
1979 1122.69 1129.30 775.46 693.29 817.65 1141.20 2135.23 4160.32 5855.32 3864.25 1724.54 1421.00 2074.64
1980 1365.81 1636.55 948.84 916.57 901.71 1078.40 1508.32 2657.42 4024.00 2681.29 1522.33 957.71 1681.41
1981 818.24 835.46 786.35 796.27 997.90 1107.23 1837.74 2934.52 4704.67 3124.19 1232.50 871.84 1674.27
1982 1058.35 1041.86 745.29 934.67 990.68 967.83 1435.81 2157.10 2651.00 2237.10 1093.30 814.06 1345.66
1983 605.84 581.89 776.68 753.53 811.23 857.93 1069.97 1430.68 1786.67 881.77 467.70 373.32 867.68
1984 391.03 432.86 379.06 424.20 523.61 769.83 1109.81 1438.06 1573.00 1509.32 604.47 490.00 806.39
1985 540.19 528.61 450.39 428.93 472.84 528.67 850.52 2699.23 5348.67 4226.77 1308.83 1295.48 1561.24
1986 1504.52 901.50 673.65 699.47 781.42 971.27 1062.42 1377.10 2864.67 2395.81 1211.57 815.74 1272.82
1987 868.97 800.14 961.65 1236.87 1248.00 1061.00 936.97 1376.45 3397.00 2449.03 959.93 980.06 1357.54
1988 919.95 762.69 704.90 1641.98 1193.90 969.70 898.42 1382.23 4879.67 4342.90 1317.23 1358.39 1699.82
1989 1158.90 770.09 660.10 896.55 1533.77 998.90 1289.35 2697.74 3932.67 3400.00 1082.13 1165.48 1638.18
1990 1223.42 1137.86 1071.81 1041.23 1530.97 1423.00 1406.77 1915.81 3540.33 2435.81 1534.67 1296.87 1631.13
1991 1009.29 1265.00 1044.90 1158.03 1190.87 1966.67 3449.35 4518.06 4868.00 2976.45 1521.33 1250.00 2190.27
19921993
1994
1995 2095.00 1989.03 1626.33 1863.87 2201.33 2210.65 2880.32 3570.67 3223.55 2181.00 1521.94
1996 908.65 912.40 972.00 913.71
1997
1998
1999 1838.00 1661.29 1792.33 2395.16 3792.26 5405.00 6918.71 3436.67 2392.58
2000 2378.06 2142.41 2170.97 2169.67 1902.26 1819.67 1609.68 2735.16 3866.00
2001
2002
2003
2004
2005
2006
20072008
2009
Average 1342.48 1389.62 1223.84 1099.18 949.67 1039.13 1517.05 2701.41 4534.86 3828.66 1789.69 1337.60 1897.9
Average Runoff 2.1 1.9 1.9 1.6 1.5 1.6 2.4 4.2 6.8 5.9 2.7 2.1 34.7

7/23/2019 06b 2014 WP 4 Hydrology Report
http://slidepdf.com/reader/full/06b-2014-wp-4-hydrology-report 75/103
Nigerian Energy Support Programme
Hydrology Report
VI
Wuya 1 2 3 4 5 6 7 8 9 10 11 12
64726 Jan Feb Mar Apr May Jun Jul Aug Sep Oct Nov Dec Annual
1960
1961
1962
19631964
1965
1966
1967
1968
1969
1970 179.01 401.73 2246.49 3705.63 738.87 119.85
1971
1972 98.19 34.34 94.46 200.62 340.13 1848.49 1875.39 622.01 152.39 49.66
1973 39.27 30.62 39.58 68.67 222.89 1268.29 1358.80 541.74 102.62 36.96
1974 126.57 288.98 152.01
1975 39.95 37.20 31.36 32. 02 127.31 140. 43 659.35 1326.54 3639.27 1170. 85 206.40 92. 22 625.92
1976 56.00 39.35 122.09 246.53 461.10 1512.47 472.99
1977 43.68 35.55 26.88 23.92 45.55 259.26 1824.22 4594.91 2756.50 154.71
1978 44.80 41.34 41.07 2219.24 7852.62 3145.91 1011.96
1979 98. 57 66. 96 49. 66 45. 91 155. 32 343. 36 2662. 04 5220. 65 6187. 11 3107. 83 319. 44
1980 52.27 9.98 44.06 42. 44 112.38 232. 64 1536. 36 3452.43 3724.15 1261. 57 186.73 46. 67 897.36
1981 6. 56 101. 18 189. 43 585. 05 1340. 35 2410. 88 691. 46
1982 11.99 8.96 7.72 5.23 8.10 511.50 1311.60 1534.34 871.79 24.69
1983 9.33 9.92 7.84 6.94 11.95 51.31 29.87 697.43 1310.96 257.99 3.86 13.07 200.88
1984 9.33 9.58 8.59 8.10 7.47 10.45
1985 8.59 7.44 7.47 8.87 11.20 30.86 46.30 1816.76 2701.39 1754.41 376.54 17.92 567.89
1986 8.96 13.64 12.32 11.96 13.07 25.08 2868.83 687.35 74.46 23.52
1987 23.52 24.80 11.95 57.87 192.65 2315.97 1044.65 19.68 13.44
1988 12.32 11.57 11.20 274.69 60.86 600.36 4965.66 1054.36 28.55 20.16
1989 17.17 16.53 16.05 16.59 16.05 52.08 52.64 983.05 1961.03 1232.45 59.03 9.71 370.59
1990
1991
19921993
1994
1995
1996
1997
1998
1999
2000
2001
2002
2003
2004
2005
2006
20072008
2009
Average 37.34 23.98 22.00 21. 90 65.96 147. 50 671.87 1723.52 3 312.93 1 320. 72 209. 13 37. 80 634.7
Average Runoff 1.5 0.9 0.9 0.9 2.7 5.9 27.8 71.3 132.7 54.7 8.4 1.6 309.2

7/23/2019 06b 2014 WP 4 Hydrology Report
http://slidepdf.com/reader/full/06b-2014-wp-4-hydrology-report 76/103
Nigerian Energy Support Programme
Hydrology Report
VII
Shiroro 1 2 3 4 5 6 7 8 9 10 11 12
34702 Jan Feb Mar Apr May Jun Jul Aug Sep Oct Nov Dec Annual
1960
1961
1962
19631964
1965
1966
1967
1968
1969
1970
1971
1972
1973
1974
1975
1976
1977
1978
1979
1980
1981
1982
1983
1984 22.40 109. 18 149.34 315.11 428. 24 268.82 70.60 13.07
1985 12.69 6.20 15.31 36.27 116.49 263.50 323.70 1018.89 1169.37 287.49 49.38 4.85 276.41
1986 3.36 2.89 24.27 33.95 145.98 88.35 281.88 667.56 1308.26 413.31 59.80 6.35 253.74
1987 7.47 8.27 9.33 34.72 81.02 167.05 246.42 586.92 855.71 322.58 57.10 9.33 199.52
1988 5.60 5.19 3.36 38.97 232.60 130.79 121.71 749.33 1567.13 363.28 8.49 17.55 270.69
1989 7.84 9.09 14.56 22.38 274.79 109.18 297.57 848.27 987.65 385.30 26.23 24.27 252.19
1990 46.10 62.61 70.74 63.93 96.97 119.43 397.10 772.42 1074.63 335.48 84.50 38.87 264.43
1991 60.68 42.75 29.23 17.00 246.00 318.80 559.94 911.35 777.80 255.03 46.90 30.35 276.39
1992 21.48 36.54 78.42 76.60 49.10 146.80 410.58 857.84 1356.40 352.61 64.33 39.87 291.651993 50.45 40.43 43.16 18.57 26.90 187.93 655.19 875.74 1013.37 280.94 54.00 28.45 274.34
1994 53.26 60.29 36.13 20.00 59.68 224.70 258.94 845.19 934.00 860.90 129.60 26.35 293.95
1995 18.87 23.75 28.00 46.57 84.42 126.77 284.32 747.16 766.10 316.03 56.70 44.35 213.06
1996 38.16 18.24 23.77 11.93 103.35 276.37 526.00 873.00 874.30 509.39 70.47 59.32 283.91
1997 73.42 33.71 38.52 38. 53 103.06 235. 03 348.55 833.42 1091.90 522.32 178.23 66.68 298.14
1998 49.19 44.46 31.58 37.47 60.26 180.10 375.32 887.84 988.80 692.32 118.80 64.68 295.88
1999 54.13 44.39 33.61 31.97 46.23 217.57 662.52 772.90 1079.83 725.13 96.10 38.71 318.73
2000 52.94 34.21 45.06 20.83 55.19 244.10 275.16 1009.03 1081.83 565.65 74.20 62.90 294.88
2001 57.32 39.32 24.77 27.63 88.90 154.37 550.48 901.10 1246.53 364.74 130.43 79.68 306.70
2002 23.23 12.54 11.06 28.87 21.97 237.37 649.42 930.84 926.10 599.42 107.43 59.61 302.76
2003 48.77 38.61 19.84 15. 57 22.52 244. 00 576.58 1327.68 1752.50 492.55 102.03 39.55 391.39
2004 32.97 33.07 40.55 26.47 72.23 199.57 588.23 1011.10 922.10 334.23 73.20 38.87 282.82
2005 21.55 17.79 19.00 15.57 81.16 166.00 423.81 680.48 627.07 372.71 46.50 38.23 210.68
2006 40.77 37.96 28.23 20.33 81.26 97.73 469.35 747.19 1265.63 878.16 119.13 87.29 324.52
2007 51.39 27.93 13.19 34.93 69.19 201.03 528.74 1048.90 951.50 249.39 95.73 38.84 277.442008 30.42 26.03 10.84 9.87 88.61 168.13 303.61 1022.29 1042.20 357.71 89.00 61.42 268.84
2009 41.35 33.79 13.45 17. 97 65.10 108. 40 279.74 1431.29 1130.00 500.58 147.80 61.71 321.26
Average 36.14 29.60 28.24 29.88 92.13 181.63 405.55 872.03 1046.88 446.39 82.95 41.58 275.8
Average Runoff 2.8 2.1 2.2 2.2 7.1 13.6 31.3 67.3 78.2 34.5 6.2 3.2 250.6

7/23/2019 06b 2014 WP 4 Hydrology Report
http://slidepdf.com/reader/full/06b-2014-wp-4-hydrology-report 77/103
Nigerian Energy Support Programme
Hydrology Report
VIII
Komi 1 2 3 4 5 6 7 8 9 10 11 12
2326 Jan Feb Mar Apr May Jun Jul Aug Sep Oct Nov Dec Annual
1960
1961
1962
19631964
1965
1966
1967
1968
1969
1970
1971
1972
1973
1974
1975
1976
1977
1978
1979
1980
1981
1982
1983
1984 1.01 0.96 1.01 6.60 6.20 11.69 13.81 8.66 16.20 5.86 2.51 2.02 6.39
1985 2.50 2.40 3.51 2.58 4.22 3.70 8.33 41.26 22.92 11.46 4.13 3.25 9.25
1986 2.61 2.73 2.43 4.90 5.19 6.33 11.20 13.55 50.31 17.36 7.37 4.14 10.67
1987 3.88 3.14 2.80 2.39 2.80 15.28 13.07 20.68 26.31 11.69 5.02 3.99 9.27
1988 3.70 2.99 2.28 2.74 2.50 4.40 5.49 9.89 42.40 12.47 4.71 4.22 8.13
1989 3.81 3.51 2.91 2.82 2.69 7.21 6.09 28.23 30.98 20.87 6.48 4.52 10.04
1990
1991
19921993
1994
1995
1996
1997
1998
1999
2000
2001
2002
2003
2004
2005
2006
20072008
2009
Average 2.92 2.62 2.49 3.67 3.93 8.10 9.66 20.38 31.52 13.29 5.03 3.69 9.0
Average Runoff 3.4 2.7 2.9 4.1 4.5 9.0 11.1 23.5 35.1 15.3 5.6 4.2 121.5

7/23/2019 06b 2014 WP 4 Hydrology Report
http://slidepdf.com/reader/full/06b-2014-wp-4-hydrology-report 78/103
Nigerian Energy Support Programme
Hydrology Report
IX
Izom 1 2 3 4 5 6 7 8 9 10 11 12
6203 Jan Feb Mar Apr May Jun Jul Aug Sep Oct Nov Dec Annual
1960
1961
1962
19631964
1965
1966
1967
1968
1969
1970 5.79 33.98 60.19 156.06 439.07 597.99 156.44 34.34 10.83
1971 6.35 2.89 1.87 13.12 28.38 68.67 175.10 488.35 515.05 231.11 45.91 10.83 133.05
1972 5.60 2.39 3.36 9.26 60.48 166.67 257.24 614.17 314.04 166.89 32.79 13.44 138.37
1973 8.21 3.72 1.49 8.87 19.04 46.68 97.45 420.77 394.68 165.40 47.45 17.55 103.18
1974 7.84 3.31 1.12 9.65 61.23 63.27 232.97 323.33 674.38 232.60 48.61 18.29 140.19
1975 9.33 4.55 2.99 13.12 38.08 71.37 221.77 420.40 538.19 398.75 43.98 6.35 148.37
1976 3.36 3.99 2.99 4.24 47.04 99.15 192.65 276.28 260.80 379.70 112.27
1977 39.58 35.96 25.76 54.78 104.17 86.03 185.56 213.19 378.09 279.64 33.56 7.84 120.85
1978 3.36 1.24 6.35 28.16 54.51 126.54 259.86 288.98 799.00 370.00 26.88
1979 15.31 10.33 6.35 16.98 98.57 104.55 260.23 355.44 484.18 334.90 71.76 25.76 149.61
1980 11.57 1.60 0.00 5.40 26.14 104.55 308.39 313.62 413.58 222.52 61.73 23.52 125.15
1981 14.19 7.85 32.86 6.56 61.98 76.00 216.55 349.46
1982
1983
1984
1985
1986
1987
1988
1989
1990
1991
19921993
1994
1995
1996
1997
1998
1999
2000
2001
2002
2003
2004
2005
2006
20072008
2009
Average 11.34 7.08 7.74 14.66 52.80 89.47 213.65 375.26 488.18 267.09 53.24 16.13 133.8
Average Runoff 4.9 2.8 3.3 6.1 22.8 37.4 92.3 162.0 204.0 115.3 22.2 7.0 680.1

7/23/2019 06b 2014 WP 4 Hydrology Report
http://slidepdf.com/reader/full/06b-2014-wp-4-hydrology-report 79/103
Nigerian Energy Support Programme
Hydrology Report
X
Ebba 1 2 3 4 5 6 7 8 9 10 11 12
1896 Jan Feb Mar Apr May Jun Jul Aug Sep Oct Nov Dec Annual
1960
1961
1962
19631964
1965
1966
1967
1968
1969
1970 1.49 1.24 1.12 0.77 1.12 1.54 2.99 17.55 91.82 32.86 5.79 2.24 13.35
1971 1.12 0.83 0.75 0.77 1.87 1.54 13.44 48.54 86.81 25.76 5.02 2.24 15.76
1972 1.49 0.80 0.37 1.16 1.12 1.93 10.83 27.26 50.15 18.67 2.70 0.75 9.80
1973 0.37 0.00 0.00 0.00 0.00 0.39 1.12 17.55 27.01 17.17 3.09 0.75 5.64
1974 0.00 0.00 0.00 0.00 0.37 2.31 3.73 16.43 62.50 53.39 6.56 1.49 12.27
1975 0.75 0.41 0.37 0.77 0.75 0.77 17.55 21.65 69.83 56.75 8.49 1.12 15.00
1976 0.00 0.00 0.00 0.00 0.00 3.86 7.47 9.71 25.46 39.58 17.75 1.49 8.82
1977 0.75 0.41 0.00 0.00 1.12 1.54 1.49 36.59 93.36 59.74 7.33 2.61 17.12
1978 0.75 0.41 0.37 0.39 0.37 1.93 5.97 51.52 101.47 34.72 10.80 2.99 17.66
1979 0.75 0.83 0.75 0.77 1.49 2.70 13.07 57.50 47.84 18.67 6.94 2.99 12.94
1980 1.12 0.80 0.75 0.77 1.12 1.54 2.99 24.27 67.13 31.74 8.10 2.24 11.89
1981
1982
1983
1984
1985
1986
1987
1988
1989
1990
1991
19921993
1994
1995
1996
1997
1998
1999
2000
2001
2002
2003
2004
2005
2006
2007
2008
2009
Average 0.78 0.52 0.41 0.49 0.85 1.82 7.33 29.87 65.76 35.37 7.51 1.90 12.7
Average Runoff 1.1 0.7 0.6 0.7 1.2 2.5 10.4 42.2 89.9 50.0 10.3 2.7 212.1

7/23/2019 06b 2014 WP 4 Hydrology Report
http://slidepdf.com/reader/full/06b-2014-wp-4-hydrology-report 80/103
Nigerian Energy Support Programme
Hydrology Report
XI
Badeggi 1 2 3 4 5 6 7 8 9 10 11 12
5850 Jan Feb Mar Apr May Jun Jul Aug Sep Oct Nov Dec Annual
1960
1961
1962
19631964
1965
1966
1967
1968
1969
1970 5.23 3.31 2.61 2.31 3.73 5.02 8.59 98.94 260.80 115.37 18.90 11.57 44.74
1971 4.85 4.13 5.23 5.02 9.33 13.12 50.78 135.53 233.41 88.11 30.09 8.59 49.15
1972 6.35 5.19 4.48 4.24 7.84 11.96 47.42 124.33 176.31 64.22 15.43 5.97 39.62
1973 4.85 4.13 3.36 3.09 2.99 5.79 21.65 75.42 127.31 78.78 13.89 2.24 28.73
1974 1.49 1.24 1.12 1.16 2.61 8.87 16.43 60.48 173.61 119.10 19.29 4.48 34.25
1975 1.87 1.65 1.49 2.31 2.99 3.47 52.27 53.76 171.30 172.86 19.29 5.97 41.00
1976 2.61 2.39 1.87 1.54 2.24 14.66 20.91 38.46 56.71 101.55 75.23 9.71 27.42
1977 1.87 1.65 1.49 1.54 2.61 5.02 11.20 86.99 178.24 146.36 23.53 4.11 38.88
1978 1.87 1.65 1.49 5.40 5.23 10.80 32.48 125.45 219.52 117.23 40.51 7.84 47.60
1979 2.24 2.07 2.24 1.54 2.24 17.36 26.51 137.02 179.40 88.11 19.68 4.85 40.43
1980
1981
1982
1983
1984
1985
1986
1987
1988
1989
1990
1991
19921993
1994
1995
1996
1997
1998
1999
2000
2001
2002
2003
2004
2005
2006
20072008
2009
Average 3.32 2.74 2.54 2.82 4.18 9.61 28.82 93.64 177.66 109.17 27.58 6.53 39.2
Average Runoff 1.5 1.1 1.2 1.2 1.9 4.3 13.2 42.9 78.7 50.0 12.2 3.0 211.2

7/23/2019 06b 2014 WP 4 Hydrology Report
http://slidepdf.com/reader/full/06b-2014-wp-4-hydrology-report 81/103
Nigerian Energy Support Programme
Hydrology Report
XII
Annexe 6
Monthly flows for gauging stations in Ogun State.
Apoje 1 2 3 4 5 6 7 8 9 10 11 12
8517 Jan Feb Mar Apr May Jun Jul Aug Sep Oct Nov Dec Annual
1960
1961
1962
1963
1964
1965
1966
1967
1968
1969
1970
1971
1972
1973
1974
1975
1976
1977
1978
1979
1980
1981
1982 81.02 74.82 73.18 75.23 100.43 138.50 139.64 94.46 118.83 211.69 118.06 81.02 109.15
1983 72.06 71.92 72.06 73.69 116.86 73.30 109.77 93.71 175.54 130.68 82.18 68.32 95.13
1984 72.06 71.84 72.06 76.54 126.93 156.06 177.34 170.14 180.33 109.95 81.39
1985 63.10 66.83 80.27 111.88 201.61 137.40 146.22 217.67 153.55 90.35
1986 36.59 86.81 111.63 83.33 80.65 108.41 128.81 134.78 160.49 153.94
1987 70.56 71.92 72.06 72.15 73.55
1988
1989
1990
1991
1992
1993
1994
1995
1996
1997
1998
1999
2000
2001
2002
2003
2004
2005
2006
2007
2008
2009
Average 65.90 75.46 77.97 76.10 88.05 111.81 147.18 127.54 154.24 185.09 123.53 80.27 109.6
Average Runoff 20.7 21.4 24.5 23.2 27.7 34.0 46.3 40.1 46.9 58.2 37.6 25.2 405.9
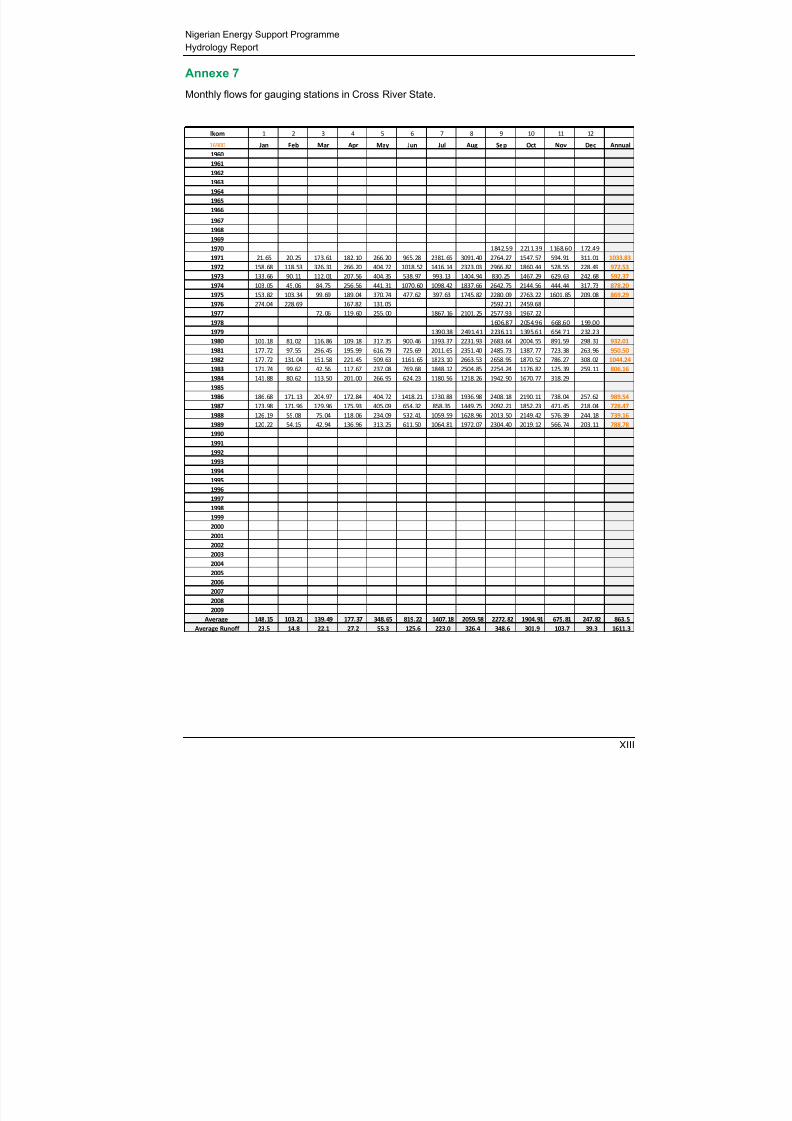
7/23/2019 06b 2014 WP 4 Hydrology Report
http://slidepdf.com/reader/full/06b-2014-wp-4-hydrology-report 82/103
Nigerian Energy Support Programme
Hydrology Report
XIII
Annexe 7
Monthly flows for gauging stations in Cross River State.
lkom 1 2 3 4 5 6 7 8 9 10 11 12
16900 Jan Feb Mar Apr May Jun Jul Aug Sep Oct Nov Dec Annual
1960
1961
1962
1963
1964
1965
1966
1967
1968
1969
1970 1842.59 2211.39 1168.60 172.49
1971 21.65 20.25 173.61 182.10 266.20 965.28 2381.65 3091.40 2764.27 1547.57 594.91 311.01 1033.83
1972 158.68 118.53 326.31 266.20 404.72 1018.52 1416.14 2323.03 2966.82 1860.44 528.55 228.49 972.53
1973 133. 66 90. 11 112. 01 207. 56 404. 35 538. 97 993. 13 1404. 94 830. 25 1467. 29 629. 63 242. 68 592.371974 103.05 45.06 84.75 256.56 441.31 1070.60 1098.42 1837.66 2642.75 2144.56 444.44 317.73 878.20
1975 153.82 103.34 99.69 189.04 370.74 477.62 397.63 1745.82 2280.09 2763.22 1601.85 209.08 869.29
1976 274.04 228.69 167.82 131.05 2592.21 2459.68
1977 72. 06 119. 60 255. 00 1867. 16 2101. 25 2577.93 1967. 22
1978 1606.87 2054.96 668.60 199.00
1979 1390.38 2491.41 2236.11 1395.61 654.71 232.23
1980 101.18 81.02 116.86 109.18 317.35 900.46 1393.37 2231.93 2683.64 2004.55 891.59 298.31 932.01
1981 177.72 97.55 296.45 195.99 616.79 725.69 2011.65 2351.40 2485.73 1387.77 723.38 263.96 950.50
1982 177.72 131.04 151.58 221.45 509.63 1161.65 1823.10 2663.53 2658.95 1870.52 786.27 308.02 1044.24
1983 171.74 99.62 42.56 117.67 237.08 769.68 1848.12 2504.85 2254.24 1176.82 125.39 259.11 806.16
1984 141.88 80.62 113.50 201.00 266.95 624.23 1180.56 1218.26 1942.90 1670.77 318.29
1985
1986 186.68 171.13 204.97 172.84 404.72 1418.21 1730.88 1936.98 2408.18 2190.11 738.04 257.62 989.54
1987 173.98 171.96 179.96 175.93 405.09 654.32 858.35 1449.75 2092.21 1852.23 471.45 218.04 728.47
1988 126.19 55.08 75.04 118.06 234.09 532.41 1059.59 1628.96 2013.50 2149.42 576.39 244.18 739.161989 120.22 54.15 42.94 136.96 313.25 611.50 1064.81 1972.07 2304.40 2019.12 566.74 203.11 788.78
1990
1991
1992
1993
1994
1995
1996
1997
1998
1999
2000
2001
2002
20032004
2005
2006
2007
2008
2009
Average 148.15 103.21 139.49 177.37 348.65 819.22 1407.18 2059.58 2272.82 1904.91 675.81 247.82 863.5
Average Runoff 23.5 14.8 22.1 27.2 55.3 125.6 223.0 326.4 348.6 301.9 103.7 39.3 1611.3

7/23/2019 06b 2014 WP 4 Hydrology Report
http://slidepdf.com/reader/full/06b-2014-wp-4-hydrology-report 83/103
Nigerian Energy Support Programme
Hydrology Report
XIV
Adonatarn 1 2 3 4 5 6 7 8 9 10 11 12
18900 Jan Feb Mar Apr May Jun Jul Aug Sep Oct Nov Dec Annual
1960
1961
1962
19631964
1965
1966
1967
1968
1969
1970
1971
1972
1973
1974
1975 252. 76 229. 41 238. 20 249. 61 353. 57 428. 24 477. 15 652. 63 787. 42 841. 17 557. 48 462. 22 462.23
1976 386. 42 345. 63 390. 16 603. 78 1277. 63 1148. 53 2881. 94 2083. 72
1977 721.33 1790.90 2562.72 2464.90 2987.27 2335.72 1089.51 586.54
1978 353.20 2524.27 1458.72 215.43
1979 545.91 539.13 937.89 2172.19 2656.81 2047.45 1469.91 1099.15 576.84
1980 284.50 98.98 128.43 143.52 375.22 994.21 1636.05 2733.35 3028.16 2663.90 1792.05 382.69 1194.08
1981 431.55 421.52 605.71 1184.29 1001.93 1411.29 2869.62 3028.16 2145.31 908.56 413.68
1982 337.51 272. 40 312.87 541.37 972.99 1501.27 2700.49 3028.16 1006.56 651.88
1983 475.28 419.15 393.89 486.11 757.92 983.41 1989.99 2918.53 3017.75 2396.21 1136.96 626.12 1306.19
1984 428.99 389.93 495.07 819.06 837.07 1174.00 1633.44 2431.68 2869.98 2142.70 587.58 312.50 1181.26
1985 226. 25 191. 91 307. 87 740. 74 1010. 42 1305. 26 1500. 90 2743. 06 1701. 02 939. 04 540. 99
1986 341. 62 337. 30 560. 78 924. 43 1307. 10 1957. 14 1979. 54 2505. 40 1742. 46 1488. 43 739. 62
1987 396.51 233.55 170.25 113.43
1988
1989
1990
1991
1992
19931994
1995
1996
1997
1998
1999
2000
2001
2002
2003
2004
2005
2006
2007
20082009
Average 348.30 306.43 330.31 430.56 750.24 1068.15 1664.65 2344.58 2556.96 1996.27 1096.73 500.77 1120.9
Average Runoff 49.4 39.2 46.8 59.0 106.3 146.5 235.9 332.3 350.7 282.9 150.4 71.0 1870.4

7/23/2019 06b 2014 WP 4 Hydrology Report
http://slidepdf.com/reader/full/06b-2014-wp-4-hydrology-report 84/103
Nigerian Energy Support Programme
Hydrology Report
XV
Obubra 1 2 3 4 5 6 7 8 9 10 11 12 365
35800 Jan Feb Mar Apr May Jun Jul Aug Sep Oct Nov Dec Annual
1960
1961
1962
19631964
1965
1966
1967
1968
1969
1970 849. 01 1893. 90 2340. 58 2937. 57 3966. 82 2747. 16 317. 73
1971 164.65 88.46 118.73 424.00 304.66 927.08 2435.78 3468.49 4004.63 3693.62 2392.75 1230.21 1613.24
1972 199.00 144.48 228.87 478.40 571.61 1592.59 1664.80 2228.57 3802.47 3080.20 814.43 297.94 1263.24
1973 179. 58 76. 47 81. 77 209. 10 457. 36 770. 06 977. 08 2057. 20 3193. 29 2561. 98 844. 91 330. 42 982.65
1974 146.73 66.14 85.87 275.85 603.35 1319.83 2074.00 3479.32 4440.20 4200.64 1372.30 362.53 1544.17
1975 157.18 105.41 101.55 184.80 499.55 704.48 1587.51 1725.66 2954.48 3810.11 1072.53 483.12 1122.59
1976 223.64 233.08 317.35 418.21 876.64 1727.24 2781.14 3227.67 3391.59 3882.17 2135.80 446.54 1646.91
1977 133. 93 65. 71 110. 34 258. 36 1101. 47 2049. 36 4237. 65 3164. 58
1978 3644.34
1979
1980 112.38 147.38 416.67 1409.72 2055.70 3613.72 4725.31 3865.37 1410.88
1981 2789. 35 3886. 65 4451. 39 2737. 83 315. 86
1982
1983 179.58 102. 10 56.75 86.03 254.26 2550.78 3425.18 3495.37
1984
1985 3505.79 2861.78 981.87 386.05
1986 170. 25 98. 79 153. 82 182. 10
1987 120.97 47.95 57.87 110.73 305.03 723.38 1453.85 2299.51 3974.92 3071.98 685.57 256.12 1097.82
1988 129.93 51.09 63.10 123.84 331.17 685.57 1752.91 3634.26 4154.71 3071.98 642.36 235.96 1247.74
1989 117. 23 42. 99 86. 25 108. 02 206. 84
1990
1991
1992
19931994
1995
1996
1997
1998
1999
2000
2001
2002
2003
2004
2005
2006
2007
20082009
Average 162.61 99.24 117.69 219.91 456.50 1168.67 2039.45 2998.65 3878.47 3313.84 1235.34 423.86 1350.0
Average Runoff 12.2 6.7 8.8 15.9 34.2 84.6 152.6 224.3 280.8 247.9 89.4 31.7 1189.2

7/23/2019 06b 2014 WP 4 Hydrology Report
http://slidepdf.com/reader/full/06b-2014-wp-4-hydrology-report 85/103
Nigerian Energy Support Programme
Hydrology Report
XVI
Afikpo 1 2 3 4 5 6 7 8 9 10 11 12 365
46200 Jan Feb Mar Apr May Jun Jul Aug Sep Oct Nov Dec Annual
1960
1961
1962
19631964
1965
1966
1967
1968
1969
1970
1971
1972 279.27 201.15 257.24 494.21 783.68 2039.35 1964.23 2841.62 4557.87 3952.36 997.30 389.78 1569.34
1973 279.64 183.12 190.79 311.73 585.05 1101.85 1213.04 2654.57 3999.61 3276.21 1016.98
1974 236.34 156.66 170.62 364.58 733.65 1615.35 2830.79 4173.39
1975 245.67 189.73 199.00 291.28 790.40 1047.84 2060.19 2436.90 3480.71 4325.72 1439.04 595.88 1433.82
1976 323.70 324. 07 433.47 514.66 1204.82 3179.51 3607.38 4058.26 2647.38 564.14
1977 332.29 218.67 148.97 184.03 367.01 1087.58 2772.18 3706.69 900.85 350.21
1978 216.17 158.32 198.25 450.62 781.81 2242.28 2162.49 3016.35 4570.22 4310.78 1571.76 433.84 1682.711979 233.72 211.23 230.73 331.40 841.55 1971.06 2763.22 3922.86 4392.36 2789.35 1216.44 421.15 1617.90
1980 242.68 154. 85 169.50 207.18 558.54 1696.76 2590.73 4095.73 1709.49 518.22
1981 276.28 181.46 163.16 287.81 1073.40 1130.79 3388.59 4540.02 5335.65 3607.75 1306.71 423.76 1820.74
1982 274.79 180.64 247.16 309.03 785.54 1912.42 3393.07 3983.72 5065.59 4640.83 1471.84 484.99 1906.68
1983 263. 96 172. 78 117. 98 157. 79 365. 52 1229. 94 3994. 92 4263. 12 1922. 04 663. 58 370. 00
1984 225.88 147.27 166.14 294.37 489.84 1335.65 1806.30 2570.19 3820.99 2986.11 1056.71 408.83 1281.12
1985 369.21 660.84 998.46
1986 183.69 118.22 169.88 214.12 523.45 876.16 3133.59 2683.69 4567.90 4177.87 1153.16 319.97 1519.47
1987 160. 54 104. 58 84. 01 122. 69
1988
1989 144. 68 71. 31 174. 77 496. 94
1990
1991
1992
19931994
1995
1996
1997
1998
1999
2000
2001
2002
2003
2004
2005
2006
2007
20082009
Average 251.64 177.96 188.64 298.79 690.13 1448.96 2558.30 3444.86 4373.84 3598.90 1319.33 440.06 1574.1
Average Runoff 14.6 9.3 10.9 16.8 40.0 81.3 148.3 199.7 245.4 208.6 74.0 25.5 1074.5
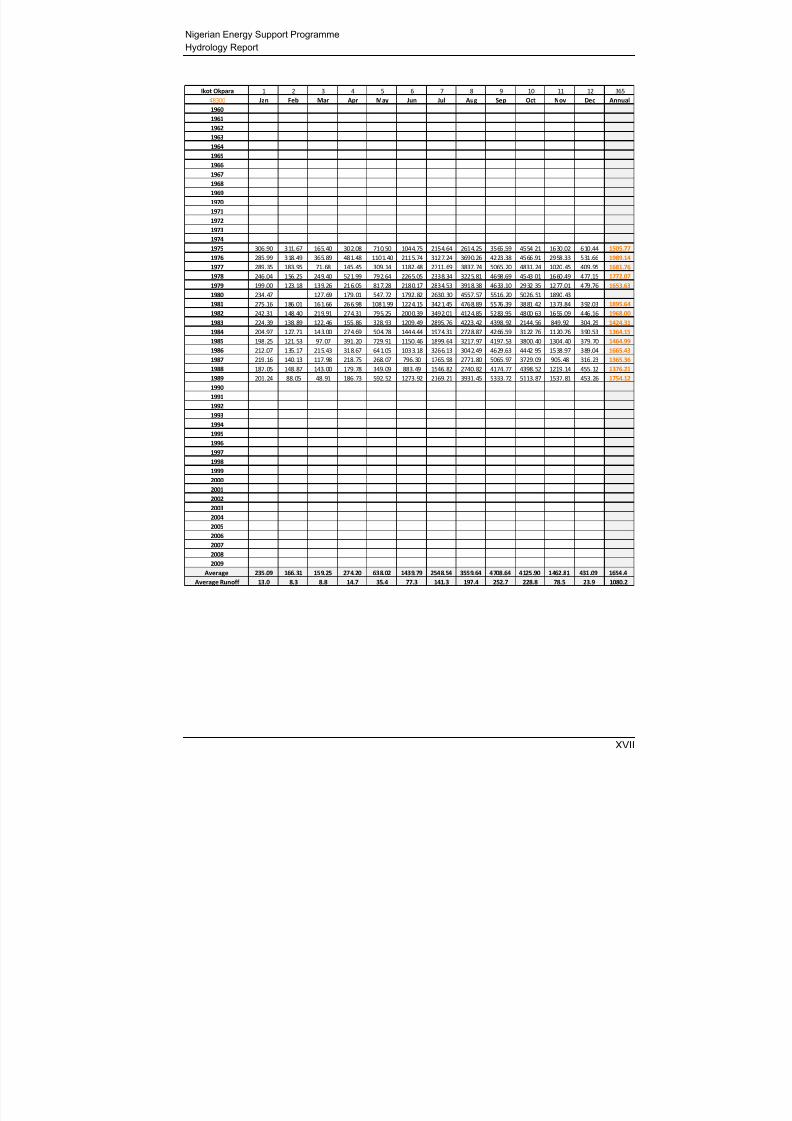
7/23/2019 06b 2014 WP 4 Hydrology Report
http://slidepdf.com/reader/full/06b-2014-wp-4-hydrology-report 86/103
Nigerian Energy Support Programme
Hydrology Report
XVII
Ikot Okpara 1 2 3 4 5 6 7 8 9 10 11 12 365
48300 Jan Feb Mar Apr May Jun Jul Aug Sep Oct Nov Dec Annual
1960
1961
1962
19631964
1965
1966
1967
1968
1969
1970
1971
1972
1973
1974
1975 306.90 311.67 165.40 302.08 710.50 1044.75 2154.64 2614.25 3565.59 4554.21 1630.02 610.44 1505.77
1976 285.99 318.49 365.89 481.48 1101.40 2115.74 3127.24 3690.26 4223.38 4566.91 2958.33 531.66 1989.14
1977 289.35 183.95 71.68 145.45 309.14 1182.48 2711.69 3837.74 5065.20 4831.24 1020.45 409.95 1681.76
1978 246.04 156.25 249.40 521.99 792.64 2265.05 2338.34 3225.81 4698.69 4543.01 1660.49 477.15 1772.071979 199.00 123.18 139.26 216.05 817.28 2180.17 2834.53 3918.38 4633.10 2932.35 1277.01 479.76 1653.63
1980 234. 47 127. 69 179. 01 547. 72 1792. 82 2630. 30 4557. 57 5516. 20 5026. 51 1890. 43
1981 275.16 186.01 161.66 266.98 1081.99 1224.15 3421.45 4768.89 5576.39 3881.42 1373.84 392.03 1895.64
1982 242.31 148.40 219.91 274.31 795.25 2000.39 3492.01 4124.85 5283.95 4800.63 1655.09 446.16 1968.00
1983 224.39 138.89 122.46 155.86 328.93 1209.49 2895.76 4223.42 4398.92 2144.56 849.92 304.29 1424.31
1984 204.97 127.71 143.00 274.69 504.78 1444.44 1974.31 2728.87 4266.59 3122.76 1120.76 390.53 1364.15
1985 198.25 121.53 97.07 391.20 729.91 1150.46 1899.64 3217.97 4197.53 3800.40 1304.40 379.70 1464.99
1986 212.07 135.17 215.43 318.67 641.05 1033.18 3266.13 3042.49 4629.63 4442.95 1538.97 389.04 1665.43
1987 219.16 140.13 117.98 218.75 268.07 796.30 1765.98 2771.80 5065.97 3729.09 905.48 316.23 1365.36
1988 187.05 148.87 143.00 179.78 349.09 883.49 1546.82 2740.82 4174.77 4398.52 1219.14 455.12 1376.21
1989 201.24 88.05 48.91 186.73 592.52 1273.92 2169.21 3931.45 5333.72 5113.87 1537.81 453.26 1754.12
1990
1991
1992
19931994
1995
1996
1997
1998
1999
2000
2001
2002
2003
2004
2005
2006
2007
20082009
Average 235.09 166.31 159.25 274.20 638.02 1439.79 2548.54 3559.64 4708.64 4125.90 1462.81 431.09 1654.4
Average Runoff 13.0 8.3 8.8 14.7 35.4 77.3 141.3 197.4 252.7 228.8 78.5 23.9 1080.2
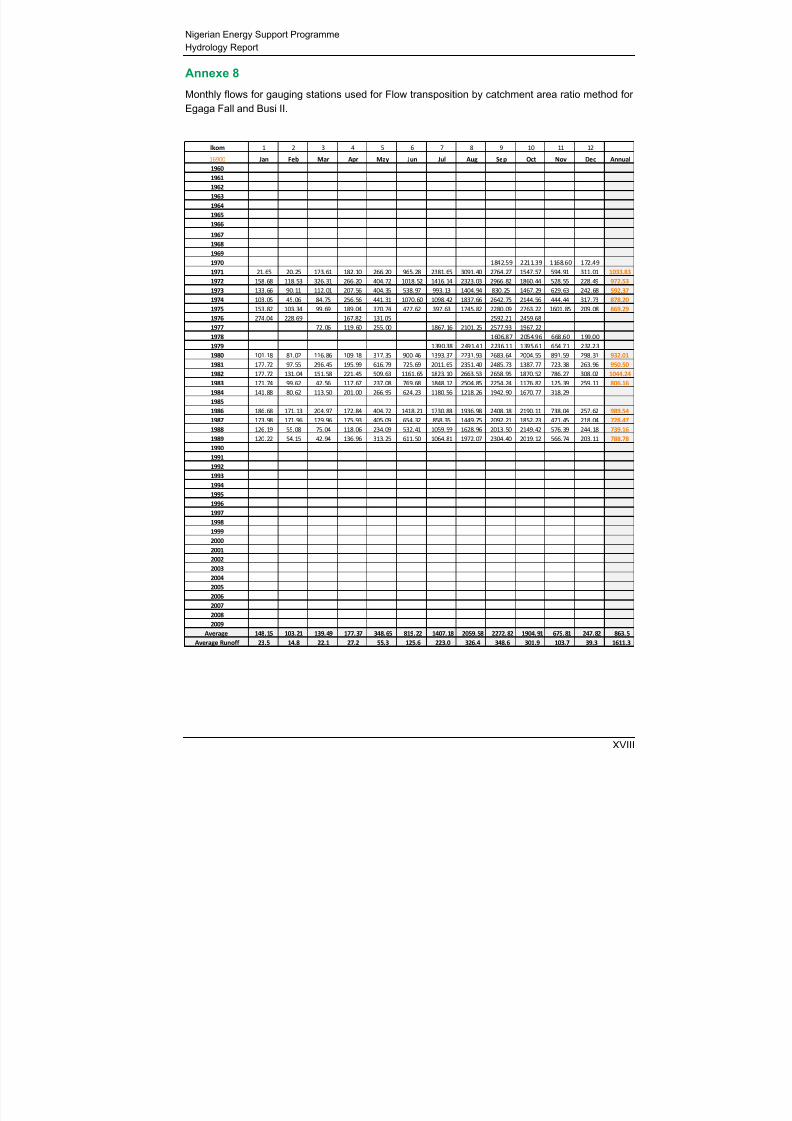
7/23/2019 06b 2014 WP 4 Hydrology Report
http://slidepdf.com/reader/full/06b-2014-wp-4-hydrology-report 87/103
Nigerian Energy Support Programme
Hydrology Report
XVIII
Annexe 8
Monthly flows for gauging stations used for Flow transposition by catchment area ratio method for
Egaga Fall and Busi II.
lkom 1 2 3 4 5 6 7 8 9 10 11 12
16900 Jan Feb Mar Apr May Jun Jul Aug Sep Oct Nov Dec Annual
1960
1961
1962
1963
1964
1965
1966
1967
1968
1969
1970 1842.59 2211.39 1168.60 172.49
1971 21.65 20.25 173.61 182.10 266.20 965.28 2381.65 3091.40 2764.27 1547.57 594.91 311.01 1033.83
1972 158.68 118.53 326.31 266.20 404.72 1018.52 1416.14 2323.03 2966.82 1860.44 528.55 228.49 972.53
1973 133. 66 90. 11 112. 01 207. 56 404. 35 538. 97 993. 13 1404. 94 830. 25 1467. 29 629. 63 242. 68 592.37
1974 103.05 45.06 84.75 256.56 441.31 1070.60 1098.42 1837.66 2642.75 2144.56 444.44 317.73 878.20
1975 153.82 103.34 99.69 189.04 370.74 477.62 397.63 1745.82 2280.09 2763.22 1601.85 209.08 869.29
1976 274.04 228.69 167.82 131.05 2592.21 2459.68
1977 72. 06 119. 60 255. 00 1867. 16 2101. 25 2577.93 1967. 22
1978 1606.87 2054.96 668.60 199.00
1979 1390.38 2491.41 2236.11 1395.61 654.71 232.23
1980 101.18 81.02 116.86 109.18 317.35 900.46 1393.37 2231.93 2683.64 2004.55 891.59 298.31 932.01
1981 177.72 97.55 296.45 195.99 616.79 725.69 2011.65 2351.40 2485.73 1387.77 723.38 263.96 950.50
1982 177.72 131.04 151.58 221.45 509.63 1161.65 1823.10 2663.53 2658.95 1870.52 786.27 308.02 1044.24
1983 171.74 99.62 42.56 117.67 237.08 769.68 1848.12 2504.85 2254.24 1176.82 125.39 259.11 806.16
1984 141.88 80.62 113.50 201.00 266.95 624.23 1180.56 1218.26 1942.90 1670.77 318.29
1985
1986 186.68 171.13 204.97 172.84 404.72 1418.21 1730.88 1936.98 2408.18 2190.11 738.04 257.62 989.54
1987 173.98 171.96 179.96 175.93 405.09 654.32 858.35 1449.75 2092.21 1852.23 471.45 218.04 728.47
1988 126.19 55.08 75.04 118.06 234.09 532.41 1059.59 1628.96 2013.50 2149.42 576.39 244.18 739.16
1989 120.22 54.15 42.94 136.96 313.25 611.50 1064.81 1972.07 2304.40 2019.12 566.74 203.11 788.78
1990
1991
1992
1993
1994
1995
1996
1997
1998
1999
2000
2001
2002
2003
2004
2005
2006
2007
2008
2009
Average 148.15 103.21 139.49 177.37 348.65 819.22 1407.18 2059.58 2272.82 1904.91 675.81 247.82 863.5
Average Runoff 23.5 14.8 22.1 27.2 55.3 125.6 223.0 326.4 348.6 301.9 103.7 39.3 1611.3

7/23/2019 06b 2014 WP 4 Hydrology Report
http://slidepdf.com/reader/full/06b-2014-wp-4-hydrology-report 88/103
Nigerian Energy Support Programme
Hydrology Report
XIX
Katsina‐Ala 1 2 3 4 5 6 7 8 9 10 11 12
16789 Jan Feb Mar Apr May Jun Jul Aug Sep Oct Nov Dec Annual
1960 134. 77 48. 66 41. 48 228. 60 416. 23 727. 60 989. 26 1080. 84 1532. 33 1904. 03 775. 49 312. 27 686.38
1961
1962 58. 81 22. 18 129. 52 320. 53 455. 81 865. 30 1177. 26 984. 39 1561. 00 2037. 74 984. 39 508. 29 762.91
1963 178. 39 55. 89 52. 55 202. 60 649. 55 772. 87 985. 45 1168. 06 1566. 33 1649. 68 720. 97 263. 94 692.671964 122. 16 44. 31 47. 13 219. 10 366. 94 800. 60 959. 61 623. 26 1664. 00 2060. 65 1090. 30 440. 00 705.95
1965
1966 116.85 27.57 29.58 164.47 564.42 1250.37 1325.90 1336.88 2014.39 1885.81 782.03 281.00 818.80
1967 105. 00 34. 00 16. 00 56. 97 254. 26 740. 87 1315. 48 1108. 81 1693. 67 2280. 00 860. 40 297. 65 734.80
1968
1969
1970 122.46 74.82 129.18 359.95 577.58 1013.50 1306.38 1090.20 1646.60 1770.83 836.42 303.17 772.83
1971 125.82 74.82 106.48 447.90 305.13 529.87 1811.87 1387.87 2194.27 2470.48 505.63 454.75 873.86
1972 164.28 148.07 203.11 400.08 645.16 853.43 1377.10 1570.97 2167.33 2651.61 1150.08 190.41 964.81
1973 80. 65 46. 30 80. 66 70. 10 183. 03 471. 53 595. 71 903. 06 1610. 33 1808. 71 423. 87 77. 00 531.96
1974 127.00 76.21 76.29 154.00 344.42 459.88 1532.26 1274.27 2129.63 2192.26 1046.30 557.80 835.78
1975 77.28 46.30 60.74 106.30 298.47 572.70 1706.06 1 022.25 1 750.00 1 920.55 833.33 271.06 726.62
1976 157.93 120.53 153.68 301.73 441.77 869.00 1224.00 1536.00 1949.85 2019.12 956.79 377.46 846.31
1977 70. 94 42. 99 54. 88 160. 11 477. 52 836. 42 1132. 39 958. 03 1446. 37 1499. 78 709. 88 283. 75 642.69
1978 122.46 100.03 174.36 346.45 848.27 913.40 1075.61 1089.71 2096.33 2530.65 829.20 444.00 885.481979 208.00 55.79 57.65 57.70 357.77 1010.97 1363.74 1543.42 1700.00 1660.00 711.20 302.71 756.85
1980 126. 84 26. 17 25. 55 60. 23 290. 47 713. 35 1054. 73 1280. 62 1500. 00 1628. 96 673. 23 354. 69 648.64
1981 132.17 53.39 39.45 128.77 510.13 605.93 1145.68 1426.00 1951.67 1303.68 621.73 177.97 678.15
1982 68.19 33.04 97.26 111.97 342.58 662.45 1351.84 1 530.10 2 093.00 2 031.45 632.77 194.13 767.16
1983 96. 70 60. 76 61. 23 60. 19 96. 70 463. 35 1099. 91 1 590. 13 1 733. 41 1 767. 47 556. 71 277. 40 659.69
1984 57. 12 55. 08 57. 12 57. 10 95. 21 676. 31 1061. 45 1 118. 58 1 682. 87 1 611. 04 584. 49 188. 17 606.62
1985
1986
1987
1988
1989
1990
1991
1992
19931994
1995
1996
1997
1998
1999
2000
2001
2002
2003
2004
2005
2006
2007
20082009
Average 116.85 59.38 80.66 191.18 405.78 752.84 1218.65 1220.16 1794.45 1937.36 775.49 312.27 742.8
Average Runoff 18.6 8.6 12.9 29.5 64.7 116.2 194.4 194.7 277.0 309.1 119.7 49.8 1395.3

7/23/2019 06b 2014 WP 4 Hydrology Report
http://slidepdf.com/reader/full/06b-2014-wp-4-hydrology-report 89/103
Nigerian Energy Support Programme
Hydrology Report
XX
Annexe 9
Monthly flows for gauging stations used for Flow transposition by catchment area ratio method for
Tapa.
31 28 31 30 31 30 31 31 30 31 30 31
Izom 1 2 3 4 5 6 7 8 9 10 11 12
6203 Jan Feb Mar Apr May Jun Jul Aug Sep Oct Nov Dec Annual
1960
1961
1962
1963
1964
1965
1966
1967
1968
1969
1970 5. 79 33.98 60. 19 156. 06 439.07 597. 99 156. 44 34. 34 10. 83
1971 6.35 2.89 1.87 13.12 28.38 68.67 175.10 488.35 515.05 231.11 45.91 10.83 133.051972 5.60 2.39 3.36 9.26 60.48 166.67 257.24 614.17 314.04 166.89 32.79 13.44 138.37
1973 8.21 3.72 1.49 8.87 19.04 46.68 97.45 420.77 394.68 165.40 47.45 17.55 103.18
1974 7.84 3.31 1.12 9.65 61.23 63.27 232.97 323.33 674.38 232.60 48.61 18.29 140.19
1975 9.33 4.55 2.99 13.12 38.08 71.37 221.77 420.40 538.19 398.75 43.98 6.35 148.37
1976 3.36 3.99 2.99 4.24 47.04 99.15 192.65 276.28 260.80 379.70 112.27
1977 39.58 35.96 25.76 54.78 104.17 86.03 185.56 213.19 378.09 279.64 33.56 7.84 120.85
1978 3.36 1.24 6.35 28.16 54.51 126.54 259.86 288.98 799.00 370.00 26.88
1979 15.31 10.33 6.35 16.98 98.57 104.55 260.23 355.44 484.18 334.90 71.76 25.76 149.61
1980 11.57 1.60 0.00 5.40 26.14 104.55 308.39 313.62 413.58 222.52 61.73 23.52 125.15
1981 14.19 7.85 32.86 6.56 61.98 76.00 216.55 349.46
1982
1983
1984
1985
19861987
1988
1989
1990
1991
1992
1993
1994
1995
1996
1997
1998
1999
2000
2001
2002
2003
2004
2005
2006
2007
2008
2009
Average 11.34 7.08 7.74 14.66 52.80 89.47 213.65 375.26 488.18 267.09 53.24 16.13 133.8
Average Runoff 4.9 2.8 3.3 6.1 22.8 37.4 92.3 162.0 204.0 115.3 22.2 7.0 680.1

7/23/2019 06b 2014 WP 4 Hydrology Report
http://slidepdf.com/reader/full/06b-2014-wp-4-hydrology-report 90/103
Nigerian Energy Support Programme
Hydrology Report
XXI
31 28 31 30 31 30 31 31 30 31 30 31
Ebba 1 2 3 4 5 6 7 8 9 10 11 12
1896 Jan Feb Mar Apr May Jun Jul Aug Sep Oct Nov Dec Annual
1960
1961
19621963
1964
1965
1966
1967
1968
1969
1970 1.49 1.24 1.12 0.77 1.12 1.54 2.99 17.55 91.82 32.86 5.79 2.24 13.35
1971 1.12 0.83 0.75 0.77 1.87 1.54 13.44 48.54 86.81 25.76 5.02 2.24 15.76
1972 1.49 0.80 0.37 1.16 1.12 1.93 10.83 27.26 50.15 18.67 2.70 0.75 9.80
1973 0.37 0.00 0.00 0.00 0.00 0.39 1.12 17.55 27.01 17.17 3.09 0.75 5.64
1974 0.00 0.00 0.00 0.00 0.37 2.31 3.73 16.43 62.50 53.39 6.56 1.49 12.27
1975 0.75 0.41 0.37 0.77 0.75 0.77 17.55 21.65 69.83 56.75 8.49 1.12 15.00
1976 0.00 0.00 0.00 0.00 0.00 3.86 7.47 9.71 25.46 39.58 17.75 1.49 8.82
1977 0.75 0.41 0.00 0.00 1.12 1.54 1.49 36.59 93.36 59.74 7.33 2.61 17.121978 0.75 0.41 0.37 0.39 0.37 1.93 5.97 51.52 101.47 34.72 10.80 2.99 17.66
1979 0.75 0.83 0.75 0.77 1.49 2.70 13.07 57.50 47.84 18.67 6.94 2.99 12.94
1980 1.12 0.80 0.75 0.77 1.12 1.54 2.99 24.27 67.13 31.74 8.10 2.24 11.89
1981
1982
1983
1984
1985
1986
1987
1988
1989
1990
1991
1992
1993
1994
1995
1996
1997
1998
1999
2000
2001
2002
2003
2004
2005
2006
2007
2008
2009
Average 0.78 0.52 0.41 0.49 0.85 1.82 7.33 29.87 65.76 35.37 7.51 1.90 12.7
Average Runoff 1.1 0.7 0.6 0.7 1.2 2.5 10.4 42.2 89.9 50.0 10.3 2.7 212.1

7/23/2019 06b 2014 WP 4 Hydrology Report
http://slidepdf.com/reader/full/06b-2014-wp-4-hydrology-report 91/103
Nigerian Energy Support Programme
Hydrology Report
XXII
31 28 31 30 31 30 31 31 30 31 30 31
Kachia 1 2 3 4 5 6 7 8 9 10 11 12
124 Jan Feb Mar Apr May Jun Jul Aug Sep Oct Nov Dec Annual
1960
1961
19621963
1964
1965
1966
1967
1968
1969
1970
1971
1972 0.04 1.27 2.12 5.34 8.18 2.74 1.38 0.58 0.30
1973 0.19 0.12 0.07 0.15 0.63 1.12 2.80 6.50 4.32 1.72 0.89 0.56 1.60
1974 0.41 0.25 0.15 0.96 2.05 1.39 5.86 3.77 5.71 1.64 0.81 0.56 1.98
1975 0.52 0.45 0.52 0.69 1.64 2.08 4.22 3.96 6.02 1.68 0.62 0.34 1.90
1976 0.26 0.20 0.11 0.27 0.78 0.73 2.95 2.65 2.85 3.55 0.96 0.56 1.33
1977 0.34 0.29 0.15 0.31 0.82 2.12 2.65 2.20 2.58 1.72 0.46 0.41 1.181978 0.34 0.29 0.26
1979 0.52 0.45 0.41 0.42 1.64 1.27 2.87 3.29 2.78 1.75 1.04 0.63 1.43
1980 0.52 0.44 0.37 0.50 1.05 2.70 2.50 2.80 1.31 1.31 0.58 0.37 1.21
1981
1982
1983
1984
1985
1986
1987
1988
1989
1990
1991
1992
1993
1994
1995
1996
1997
1998
1999
2000
2001
2002
2003
2004
2005
2006
2007
2008
2009
Average 0.39 0.31 0.26 0.42 1.24 1.69 3.65 4.17 3.54 1.84 0.74 0.47 1.6
Average Runoff 8.4 6.1 5.5 8.8 26.7 35.4 78.8 90.0 74.0 39.8 15.5 10.1 399.1

7/23/2019 06b 2014 WP 4 Hydrology Report
http://slidepdf.com/reader/full/06b-2014-wp-4-hydrology-report 92/103
Nigerian Energy Support Programme
Hydrology Report
XXIII
31 28 31 30 31 30 31 31 30 31 30 31
Kaeia 1 2 3 4 5 6 7 8 9 10 11 12
559 Jan Feb Mar Apr May Jun Jul Aug Sep Oct Nov Dec Annual
1960
1961
19621963
1964
1965
1966
1967
1968
1969
1970
1971
1972 0.46 5.90 0.81 1.68 24.83 23.84 7.73 2.04 1.12
1973 0.78 0.62 0.71 1.54 1.64 4.86 9.00 25.09 31.21 10.04 1.66 0.41 7.32
1974 0.30 0.21 0.19 1.12 6.20 4.32 17.85 24.53 36.42 7.32 2.20 1.16 8.52
1975 0.78 0.58 0.56 1.43 4.67 5.52 22.81 20.80 29.55 8.06 2.12 1.23 8.22
1976 0.93 0.80 0.34 6.40 3.81 7.14 12.66 16.24 16.05 13.03 3.94 2.54 7.02
1977 2.09 1.49 1.27 1.08 2.46 7.41 9.56 11.20 16.98 11.39 2.35 1.46 5.751978 1.05 0.74 1.94
1979 0.37 0.25 0.19 0.46 3.17 1.47 25.61 14.45 21.53 16.13 3.51 0.86 7.40
1980 0.41 0.20 0.07 3.17 8.14 19.79 21.51 24.00 14.52 3.63 1.01
1981
1982
1983
1984
1985
1986
1987
1988
1989
1990
1991
1992
1993
1994
1995
1996
1997
1998
1999
2000
2001
2002
2003
2004
2005
2006
2007
2008
2009
Average 0.84 0.61 0.66 1.79 3.88 4.96 14.87 19.83 24.95 11.03 2.68 1.22 7.3
Average Runoff 4.0 2.6 3.2 8.3 18.6 23.0 71.2 95.0 115.7 52.8 12.4 5.9 412.7

7/23/2019 06b 2014 WP 4 Hydrology Report
http://slidepdf.com/reader/full/06b-2014-wp-4-hydrology-report 93/103
Nigerian Energy Support Programme
Hydrology Report
XXIV
Annexe 10
Monthly flows at Egaga Fall obtained by flow transposition by catchment area ratio method, from the
source gauging stations Ikom and Katsina-Ala.
10.9 31 28 31 30 31 30 31 31 30 31 30 31 365
Source 1 2 3 4 5 6 7 8 9 10 11 12
Ikom Jan Feb Mar Apr May Jun Jul Aug Sep Oct Nov Dec Annual
1960
1961
1962
1963
1964
1965
1966
1967
1968
1969
1970 1.25 1.50 0.79 0.12
1971 0.01 0.01 0.12 0.12 0.18 0.65 1.61 2.09 1.87 1.05 0.40 0.21 0.701972 0.11 0.08 0.22 0.18 0.27 0.69 0.96 1.57 2.01 1.26 0.36 0.15 0.66
1973 0.09 0.06 0.08 0.14 0.27 0.36 0.67 0.95 0.56 0.99 0.43 0.16 0.40
1974 0.07 0.03 0.06 0.17 0.30 0.72 0.74 1.24 1.79 1.45 0.30 0.21 0.59
1975 0.10 0.07 0.07 0.13 0.25 0.32 0.27 1.18 1.54 1.87 1.08 0.14 0.59
1976 0.19 0.15 0.11 0.09 1.75 1.66
1977 0.05 0.08 0.17 1.26 1.42 1.74 1.33
1978 1.09 1.39 0.45 0.13
1979 0.94 1.69 1.51 0.94 0.44 0.16
1980 0.07 0.05 0.08 0.07 0.21 0.61 0.94 1.51 1.82 1.36 0.60 0.20 0.63
1981 0.12 0.07 0.20 0.13 0.42 0.49 1.36 1.59 1.68 0.94 0.49 0.18 0.64
1982 0.12 0.09 0.10 0.15 0.34 0.79 1.23 1.80 1.80 1.27 0.53 0.21 0.71
1983 0.12 0.07 0.03 0.08 0.16 0.52 1.25 1.69 1.53 0.80 0.08 0.18 0.55
1984 0.10 0.05 0.08 0.14 0.18 0.42 0.80 0.82 1.31 1.13 0.22
Average Flow (m3/s) 0.10 0.07 0.10 0.13 0.24 0.56 1.00 1.46 1.55 1.26 0.48 0.17 0.60
Average Runoff
(mm) 24.4 15.0 24.0 30.0 58.5 132.8 246.6 359.7 368.6 310.1 113.1 42.1 1724.8

7/23/2019 06b 2014 WP 4 Hydrology Report
http://slidepdf.com/reader/full/06b-2014-wp-4-hydrology-report 94/103
Nigerian Energy Support Programme
Hydrology Report
XXV
7.9 31 28 31 30 31 30 31 31 30 31 30 31 365
Source 1 2 3 4 5 6 7 8 9 10 11 12
Katsina‐Ala Jan Feb Mar Apr May Jun Jul Aug Sep Oct Nov Dec Annual
1960 0.06 0.02 0.02 0.11 0.20 0.34 0.47 0.51 0.72 0.90 0.36 0.15 0.32
1961
1962 0.03 0.01 0.06 0.15 0.21 0.41 0.55 0.46 0.73 0.96 0.46 0.24 0.361963 0.08 0.03 0.02 0.10 0.31 0.36 0.46 0.55 0.74 0.78 0.34 0.12 0.33
1964 0.06 0.02 0.02 0.10 0.17 0.38 0.45 0.29 0.78 0.97 0.51 0.21 0.33
1965
1966 0.05 0.01 0.01 0.08 0.27 0.59 0.62 0.63 0.95 0.89 0.37 0.13 0.39
1967 0.05 0.02 0.01 0.03 0.12 0.35 0.62 0.52 0.80 1.07 0.40 0.14 0.35
1968
1969
1970 0.06 0.04 0.06 0.17 0.27 0.48 0.61 0.51 0.77 0.83 0.39 0.14 0.36
1971 0.06 0.04 0.05 0.21 0.14 0.25 0.85 0.65 1.03 1.16 0.24 0.21 0.41
1972 0.08 0.07 0.10 0.19 0.30 0.40 0.65 0.74 1.02 1.25 0.54 0.09 0.45
1973 0.04 0.02 0.04 0.03 0.09 0.22 0.28 0.42 0.76 0.85 0.20 0.04 0.25
1974 0.06 0.04 0.04 0.07 0.16 0.22 0.72 0.60 1.00 1.03 0.49 0.26 0.39
1975 0.04 0.02 0.03 0.05 0.14 0.27 0.80 0.48 0.82 0.90 0.39 0.13 0.34
1976 0.07 0.06 0.07 0.14 0.21 0.41 0.58 0.72 0.92 0.95 0.45 0.18 0.40
1977 0.03 0.02 0.03 0.08 0.22 0.39 0.53 0.45 0.68 0.71 0.33 0.13 0.301978 0.06 0.05 0.08 0.16 0.40 0.43 0.51 0.51 0.99 1.19 0.39 0.21 0.42
1979 0.10 0.03 0.03 0.03 0.17 0.48 0.64 0.73 0.80 0.78 0.33 0.14 0.36
1980 0.06 0.01 0.01 0.03 0.14 0.34 0.50 0.60 0.71 0.77 0.32 0.17 0.31
1981 0.06 0.03 0.02 0.06 0.24 0.29 0.54 0.67 0.92 0.61 0.29 0.08 0.32
1982 0.03 0.02 0.05 0.05 0.16 0.31 0.64 0.72 0.98 0.96 0.30 0.09 0.36
1983 0.05 0.03 0.03 0.03 0.05 0.22 0.52 0.75 0.82 0.83 0.26 0.13 0.31
1984 0.03 0.03 0.03 0.03 0.04 0.32 0.50 0.53 0.79 0.76 0.28 0.09 0.29
Average Flow (m3/s) 0.05 0.03 0.04 0.09 0.19 0.35 0.57 0.57 0.84 0.91 0.36 0.15 0.35
Average Runoff (mm) 13.5 6.2 9.3 21.4 46.9 84.2 140.9 141.1 200.8 224.0 86.8 36.1 1011.3

7/23/2019 06b 2014 WP 4 Hydrology Report
http://slidepdf.com/reader/full/06b-2014-wp-4-hydrology-report 95/103
Nigerian Energy Support Programme
Hydrology Report
XXVI
Annexe 11
Monthly flows at Egaga Fall
Egaga 1 2 3 4 5 6 7 8 9 10 11 12
10.9 Jan Feb Mar Apr May Jun Jul Aug Sep Oct Nov Dec Annual
1960 0.09 0.03 0.03 0.15 0.27 0.47 0.64 0.70 0.99 1.24 0.50 0.20 0.44
1961
1962 0.04 0.01 0.08 0.21 0.30 0.56 0.76 0.64 1.01 1.32 0.64 0.33 0.49
1963 0.12 0.04 0.03 0.13 0.42 0.50 0.64 0.76 1.02 1.07 0.47 0.17 0.45
1964 0.08 0.03 0.03 0.14 0.24 0.52 0.62 0.40 1.08 1.34 0.71 0.29 0.46
1965
1966 0.08 0.02 0.02 0.11 0.37 0.81 0.86 0.87 1.31 1.22 0.51 0.18 0.53
1967 0.07 0.02 0.01 0.04 0.17 0.48 0.85 0.72 1.10 1.48 0.56 0.19 0.47
1968
1969
1970 0.08 0.05 0.08 0.23 0.37 0.66 0.85 0.71 1.07 1.15 0.54 0.20 0.50
1971 0.08 0.05 0.07 0.29 0.20 0.34 1.18 0.90 1.42 1.60 0.33 0.30 0.56
1972 0.11 0.10 0.13 0.26 0.42 0.55 0.89 1.02 1.41 1.72 0.75 0.12 0.62
1973 0.05 0.03 0.05 0.05 0.12 0.31 0.39 0.59 1.05 1.17 0.28 0.05 0.34
1974 0.08 0.05 0.05 0.10 0.22 0.30 0.99 0.83 1.38 1.42 0.68 0.36 0.54
1975 0.05 0.03 0.04 0.07 0.19 0.37 1.11 0.66 1.14 1.25 0.54 0.18 0.47
1976 0.10 0.08 0.10 0.20 0.29 0.56 0.79 1.00 1.27 1.31 0.62 0.25 0.55
1977 0.05 0.03 0.04 0.10 0.31 0.54 0.74 0.62 0.94 0.97 0.46 0.18 0.42
1978 0.08 0.06 0.11 0.22 0.55 0.59 0.70 0.71 1.36 1.64 0.54 0.29 0.57
1979 0.14 0.04 0.04 0.04 0.23 0.66 0.89 1.00 1.10 1.08 0.46 0.20 0.49
1980 0.08 0.02 0.02 0.04 0.19 0.46 0.68 0.83 0.97 1.06 0.44 0.23 0.42
1981 0.09 0.03 0.03 0.08 0.33 0.39 0.74 0.93 1.27 0.85 0.40 0.12 0.44
1982 0.04 0.02 0.06 0.07 0.22 0.43 0.88 0.99 1.36 1.32 0.41 0.13 0.49
1983 0.06 0.04 0.04 0.04 0.06 0.30 0.71 1.03 1.13 1.15 0.36 0.18 0.43
1984 0.04 0.04 0.04 0.04 0.06 0.44 0.69 0.73 1.09 1.05 0.38 0.12 0.39
Average Flow (m3/s) 0.08 0.04 0.05 0.12 0.26 0.49 0.79 0.79 1.17 1.26 0.50 0.20 0.48

7/23/2019 06b 2014 WP 4 Hydrology Report
http://slidepdf.com/reader/full/06b-2014-wp-4-hydrology-report 96/103
Nigerian Energy Support Programme
Hydrology Report
XXVII
Annexe 12
Monthly flows at Busi II obtained by flow transposition by catchment area ratio method, from the
source gauging stations Ikom and Katsina-Ala.
7.9 31 28 31 30 31 30 31 31 30 31 30 31 365
Source 1 2 3 4 5 6 7 8 9 10 11 12
Ikom Jan Feb Mar Apr May Jun Jul Aug Sep Oct Nov Dec Annual
1960
1961
1962
1963
1964
1965
1966
1967
1968
1969
1970 0.90 1.08 0.57 0.08
1971 0.01 0.01 0.09 0.09 0.13 0.47 1.17 1.52 1.36 0.76 0.29 0.15 0.511972 0.08 0.06 0.16 0.13 0.20 0.50 0.69 1.14 1.45 0.91 0.26 0.11 0.48
1973 0.07 0.04 0.05 0.10 0.20 0.26 0.49 0.69 0.41 0.72 0.31 0.12 0.29
1974 0.05 0.02 0.04 0.13 0.22 0.52 0.54 0.90 1.30 1.05 0.22 0.16 0.43
1975 0.08 0.05 0.05 0.09 0.18 0.23 0.19 0.86 1.12 1.35 0.79 0.10 0.43
1976 0.13 0.11 0.08 0.06 1.27 1.21
1977 0.04 0.06 0.13 0.92 1.03 1.26 0.96
1978 0.79 1.01 0.33 0.10
1979 0.68 1.22 1.10 0.68 0.32 0.11
1980 0.05 0.04 0.06 0.05 0.16 0.44 0.68 1.09 1.32 0.98 0.44 0.15 0.46
1981 0.09 0.05 0.15 0.10 0.30 0.36 0.99 1.15 1.22 0.68 0.35 0.13 0.47
1982 0.09 0.06 0.07 0.11 0.25 0.57 0.89 1.31 1.30 0.92 0.39 0.15 0.51
1983 0.08 0.05 0.02 0.06 0.12 0.38 0.91 1.23 1.11 0.58 0.06 0.13 0.40
1984 0.07 0.04 0.06 0.10 0.13 0.31 0.58 0.60 0.95 0.82 0.16
Average Flow (m3/s) 0.07 0.05 0.07 0.09 0.17 0.40 0.73 1.06 1.12 0.91 0.34 0.12 0.43
Average Runoff
(mm) 17.7 10.8 17.4 21.7 42.4 96.2 178.7 260.7 267.1 224.8 81.9 30.5 1250.1

7/23/2019 06b 2014 WP 4 Hydrology Report
http://slidepdf.com/reader/full/06b-2014-wp-4-hydrology-report 97/103
Nigerian Energy Support Programme
Hydrology Report
XXVIII
7.9 31 28 31 30 31 30 31 31 30 31 30 31 365
Source 1 2 3 4 5 6 7 8 9 10 11 12
Katsina‐Ala Jan Feb Mar Apr May Jun Jul Aug Sep Oct Nov Dec Annual
1960 0.06 0.02 0.02 0.11 0.20 0.34 0.47 0.51 0.72 0.90 0.36 0.15 0.32
1961
1962 0.03 0.01 0.06 0.15 0.21 0.41 0.55 0.46 0.73 0.96 0.46 0.24 0.361963 0.08 0.03 0.02 0.10 0.31 0.36 0.46 0.55 0.74 0.78 0.34 0.12 0.33
1964 0.06 0.02 0.02 0.10 0.17 0.38 0.45 0.29 0.78 0.97 0.51 0.21 0.33
1965
1966 0.05 0.01 0.01 0.08 0.27 0.59 0.62 0.63 0.95 0.89 0.37 0.13 0.39
1967 0.05 0.02 0.01 0.03 0.12 0.35 0.62 0.52 0.80 1.07 0.40 0.14 0.35
1968
1969
1970 0.06 0.04 0.06 0.17 0.27 0.48 0.61 0.51 0.77 0.83 0.39 0.14 0.36
1971 0.06 0.04 0.05 0.21 0.14 0.25 0.85 0.65 1.03 1.16 0.24 0.21 0.41
1972 0.08 0.07 0.10 0.19 0.30 0.40 0.65 0.74 1.02 1.25 0.54 0.09 0.45
1973 0.04 0.02 0.04 0.03 0.09 0.22 0.28 0.42 0.76 0.85 0.20 0.04 0.25
1974 0.06 0.04 0.04 0.07 0.16 0.22 0.72 0.60 1.00 1.03 0.49 0.26 0.39
1975 0.04 0.02 0.03 0.05 0.14 0.27 0.80 0.48 0.82 0.90 0.39 0.13 0.34
1976 0.07 0.06 0.07 0.14 0.21 0.41 0.58 0.72 0.92 0.95 0.45 0.18 0.40
1977 0.03 0.02 0.03 0.08 0.22 0.39 0.53 0.45 0.68 0.71 0.33 0.13 0.301978 0.06 0.05 0.08 0.16 0.40 0.43 0.51 0.51 0.99 1.19 0.39 0.21 0.42
1979 0.10 0.03 0.03 0.03 0.17 0.48 0.64 0.73 0.80 0.78 0.33 0.14 0.36
1980 0.06 0.01 0.01 0.03 0.14 0.34 0.50 0.60 0.71 0.77 0.32 0.17 0.31
1981 0.06 0.03 0.02 0.06 0.24 0.29 0.54 0.67 0.92 0.61 0.29 0.08 0.32
1982 0.03 0.02 0.05 0.05 0.16 0.31 0.64 0.72 0.98 0.96 0.30 0.09 0.36
1983 0.05 0.03 0.03 0.03 0.05 0.22 0.52 0.75 0.82 0.83 0.26 0.13 0.31
1984 0.03 0.03 0.03 0.03 0.04 0.32 0.50 0.53 0.79 0.76 0.28 0.09 0.29
Average Flow (m3/s) 0.05 0.03 0.04 0.09 0.19 0.35 0.57 0.57 0.84 0.91 0.36 0.15 0.35
Average Runoff (mm) 13.5 6.2 9.3 21.4 46.9 84.2 140.9 141.1 200.8 224.0 86.8 36.1 1011.3

7/23/2019 06b 2014 WP 4 Hydrology Report
http://slidepdf.com/reader/full/06b-2014-wp-4-hydrology-report 98/103
Nigerian Energy Support Programme
Hydrology Report
XXIX
Annexe 13
Monthly flows at Busi II.
Busi II 1 2 3 4 5 6 7 8 9 10 11 12
7.9 Jan Feb Mar Apr May Jun Jul Aug Sep Oct Nov Dec Annual
1960 0.06 0.02 0.02 0.11 0.20 0.34 0.47 0.51 0.72 0.90 0.36 0.15 0.32
1961
1962 0.03 0.01 0.06 0.15 0.21 0.41 0.55 0.46 0.73 0.96 0.46 0.24 0.36
1963 0.08 0.03 0.02 0.10 0.31 0.36 0.46 0.55 0.74 0.78 0.34 0.12 0.33
1964 0.06 0.02 0.02 0.10 0.17 0.38 0.45 0.29 0.78 0.97 0.51 0.21 0.33
1965
1966 0.05 0.01 0.01 0.08 0.27 0.59 0.62 0.63 0.95 0.89 0.37 0.13 0.39
1967 0.05 0.02 0.01 0.03 0.12 0.35 0.62 0.52 0.80 1.07 0.40 0.14 0.35
1968
1969
1970 0.06 0.04 0.06 0.17 0.27 0.48 0.61 0.51 0.77 0.83 0.39 0.14 0.36
1971 0.06 0.04 0.05 0.21 0.14 0.25 0.85 0.65 1.03 1.16 0.24 0.21 0.41
1972 0.08 0.07 0.10 0.19 0.30 0.40 0.65 0.74 1.02 1.25 0.54 0.09 0.45
1973 0.04 0.02 0.04 0.03 0.09 0.22 0.28 0.42 0.76 0.85 0.20 0.04 0.25
1974 0.06 0.04 0.04 0.07 0.16 0.22 0.72 0.60 1.00 1.03 0.49 0.26 0.39
1975 0.04 0.02 0.03 0.05 0.14 0.27 0.80 0.48 0.82 0.90 0.39 0.13 0.34
1976 0.07 0.06 0.07 0.14 0.21 0.41 0.58 0.72 0.92 0.95 0.45 0.18 0.40
1977 0.03 0.02 0.03 0.08 0.22 0.39 0.53 0.45 0.68 0.71 0.33 0.13 0.30
1978 0.06 0.05 0.08 0.16 0.40 0.43 0.51 0.51 0.99 1.19 0.39 0.21 0.42
1979 0.10 0.03 0.03 0.03 0.17 0.48 0.64 0.73 0.80 0.78 0.33 0.14 0.36
1980 0.06 0.01 0.01 0.03 0.14 0.34 0.50 0.60 0.71 0.77 0.32 0.17 0.31
1981 0.06 0.03 0.02 0.06 0.24 0.29 0.54 0.67 0.92 0.61 0.29 0.08 0.32
1982 0.03 0.02 0.05 0.05 0.16 0.31 0.64 0.72 0.98 0.96 0.30 0.09 0.36
1983 0.05 0.03 0.03 0.03 0.05 0.22 0.52 0.75 0.82 0.83 0.26 0.13 0.31
1984 0.03 0.03 0.03 0.03 0.04 0.32 0.50 0.53 0.79 0.76 0.28 0.09 0.29
Average Flow (m3/s) 0.05 0.03 0.04 0.09 0.19 0.35 0.57 0.57 0.84 0.91 0.36 0.15 0.35

7/23/2019 06b 2014 WP 4 Hydrology Report
http://slidepdf.com/reader/full/06b-2014-wp-4-hydrology-report 99/103
Nigerian Energy Support Programme
Hydrology Report
XXX
Annexe 14
Monthly flows at Tapa obtained by flow transposition by catchment area ratio method, from each of
the source gauging stations (Izom, Ebba, Kaeia, Kachia).
31 28 31 30 31 30 31 31 30 31 30 31 365
Source 1 2 3 4 5 6 7 8 9 10 11 12
Izom Jan Feb Mar Apr May Jun Jul Aug Sep Oct Nov Dec Annual
1960
1961
1962
1963
1964
1965
1966
1967
1968
1969
1970
1971 0.71 0.32 0.21 1.47 3.17 7.68 19.59 54.64 57.62 25.86 5.14 1.21 14.89
1972 0.63 0.27 0.38 1.04 6.77 18.65 28.78 68.71 35.14 18.67 3.67 1.50 15.48
1973 0.92 0.42 0.17 0.99 2.13 5.22 10.90 47.08 44.16 18.50 5.31 1.96 11.54
1974 0.88 0.37 0.13 1.08 6.85 7.08 26.07 36.17 75.45 26.02 5.44 2.05 15.68
1975 1.04 0.51 0.33 1.47 4.26 7.99 24.81 47.03 60.21 44.61 4.92 0.71 16.60
1976 0.38 0.45 0.33 0.47 5.26 11.09 21.55 30.91 29.18 42.48 12.56 1.87 13.15
1977 4.43 4.02 2.88 6.13 11.65 9.63 20.76 23.85 42.30 31.29 3.76 0.88 13.52
1978 0.38 0.14 0.71 3.15 6.10 14.16 29.07 32.33 89.39 41.40 6.19 3.01 18.89
1979 1.71 1.16 0.71 1.90 11.03 11.70 29.11 39.77 54.17 37.47 8.03 2.88 16.74
1980 1.29 0.18 0.00 0.60 2.92 11.70 34.50 35.09 46.27 24.90 6.91 2.63 14.00
1981
1982
1983
1984
Average
(m
3
/s) 1.24 0.78 0.58 1.83 6.02 10.49 24.52 41.56 53.39 31.12 6.19 1.87 15.05

7/23/2019 06b 2014 WP 4 Hydrology Report
http://slidepdf.com/reader/full/06b-2014-wp-4-hydrology-report 100/103
Nigerian Energy Support Programme
Hydrology Report
XXXI
31 28 31 30 31 30 31 31 30 31 30 31 365
Source 1 2 3 4 5 6 7 8 9 10 11 12
Ebba Jan Feb Mar Apr May Jun Jul Aug Sep Oct Nov Dec Annual
1960
1961
19621963
1964
1965
1966
1967
1968
1969
1970 0.55 0.45 0.41 0.28 0.41 0.56 1.09 6.42 33.61 12.03 2.12 0.82 4.89
1971 0.41 0.30 0.27 0.28 0.68 0.56 4.92 17.77 31.77 9.43 1.84 0.82 5.77
1972 0.55 0.29 0.14 0.42 0.41 0.71 3.96 9.98 18.36 6.83 0.99 0.27 3.59
1973 0.14 0.00 0.00 0.00 0.00 0.14 0.41 6.42 9.89 6.29 1.13 0.27 2.07
1974 0.00 0.00 0.00 0.00 0.14 0.85 1.37 6.01 22.88 19.54 2.40 0.55 4.49
1975 0.27 0.15 0.14 0.28 0.27 0.28 6.42 7.93 25.56 20.77 3.11 0.41 5.49
1976 0.00 0.00 0.00 0.00 0.00 1.41 2.73 3.55 9.32 14.49 6.50 0.55 3.23
1977 0.27 0.15 0.00 0.00 0.41 0.56 0.55 13.39 34.17 21.87 2.68 0.96 6.27
1978 0.27 0.15 0.14 0.14 0.14 0.71 2.19 18.86 37.14 12.71 3.95 1.09 6.47
1979 0.27 0.30 0.27 0.28 0.55 0.99 4.78 21.05 17.51 6.83 2.54 1.09 4.74
1980 0.41 0.29 0.27 0.28 0.41 0.56 1.09 8.88 24.57 11.62 2.97 0.82 4.35
1981
1982
1983
1984
Average (m3/s) 0.29 0.19 0.15 0.18 0.31 0.67 2.68 10.93 24.07 12.95 2.75 0.70 4.67

7/23/2019 06b 2014 WP 4 Hydrology Report
http://slidepdf.com/reader/full/06b-2014-wp-4-hydrology-report 101/103
Nigerian Energy Support Programme
Hydrology Report
XXXII
31 28 31 30 31 30 31 31 30 31 30 31 365
Source 1 2 3 4 5 6 7 8 9 10 11 12
Kaeia Jan Feb Mar Apr May Jun Jul Aug Sep Oct Nov Dec Annual
1960
1961
19621963
1964
1965
1966
1967
1968
1969
1970
1971
1972
1973 0.97 0.77 0.88 1.92 2.04 6.04 11.17 31.15 38.75 12.47 2.06 0.51 9.09
1974 0.37 0.26 0.23 1.39 7.69 5.36 22.16 30.45 45.22 9.09 2.73 1.44 10.58
1975 0.97 0.72 0.70 1.77 5.79 6.85 28.32 25.82 36.69 10.01 2.63 1.53 10.21
1976 1.16 0.99 0.42 7.95 4.73 8.86 15.71 20.16 19.93 16.18 4.89 3.15 8.72
1977 2.60 1.85 1.58 1.34 3.06 9.20 11.87 13.91 21.07 14.14 2.92 1.81 7.14
1978
1979 0.46 0.31 0.23 0.57 3.94 1.82 31.80 17.94 26.73 20.02 4.36 1.07 9.18
1980 0.51 0.25 0.09 2.49 3.94 10.11 24.57 26.70 29.79 18.03 4.50 1.25 10.25
1981
1982
1983
1984
Average (m3/s) 1.01 0.73 0.59 2.49 4.46 6.89 20.80 23.73 31.17 14.28 3.44 1.54 9.31

7/23/2019 06b 2014 WP 4 Hydrology Report
http://slidepdf.com/reader/full/06b-2014-wp-4-hydrology-report 102/103
Nigerian Energy Support Programme
Hydrology Report
XXXIII
31 28 31 30 31 30 31 31 30 31 30 31 365
Source 1 2 3 4 5 6 7 8 9 10 11 12
Kachia Jan Feb Mar Apr May Jun Jul Aug Sep Oct Nov Dec Annual
1960
1961
19621963
1964
1965
1966
1967
1968
1969
1970
1971
1972
1973 1.04 0.69 0.42 0.86 3.55 6.26 15.67 36.36 24.18 9.61 4.97 3.13 8.96
1974 2.30 1.39 0.84 5.40 11.49 7.77 32.81 21.10 31.96 9.19 4.53 3.13 11.06
1975 2.93 2.54 2.93 3.89 9.19 11.66 23.61 22.15 33.68 9.40 3.45 1.88 10.65
1976 1.46 1.12 0.63 1.51 4.39 4.10 16.51 14.84 15.98 19.85 5.40 3.13 7.47
1977 1.88 1.62 0.84 1.73 4.60 11.88 14.84 12.33 14.47 9.61 2.59 2.30 6.58
1978
1979 2.93 2.54 2.30 2.38 9.19 7.13 16.09 18.39 15.55 9.82 5.83 3.55 8.02
1980 2.93 2.46 2.09 2.81 5.85 15.11 14.00 15.67 7.34 7.31 3.24 2.09 6.77
1981
1982
1983
1984
Average (m3/s) 2.21 1.77 1.43 2.65 6.90 9.13 19.08 20.12 20.45 10.69 4.29 2.75 8.50

7/23/2019 06b 2014 WP 4 Hydrology Report
http://slidepdf.com/reader/full/06b-2014-wp-4-hydrology-report 103/103
Nigerian Energy Support Programme
Hydrology Report
Annexe 15
Monthly flows at Tapa
Tapa 1 2 3 4 5 6 7 8 9 10 11 12
694 Jan Feb Mar Apr May Jun Jul Aug Sep Oct Nov Dec Annual
1960
1961
1962
1963
1964
1965
1966
1967
1968
1969
1970 0.55 0.45 0.41 0.28 0.41 0.56 1.09 6.42 33.61 12.03 2.12 0.82 4.89
1971 0.41 0.30 0.27 0.28 0.68 0.56 4.92 17.77 31.77 9.43 1.84 0.82 5.77
1972 0.55 0.29 0.14 0.42 0.41 0.71 3.96 9.98 18.36 6.83 0.99 0.27 3.59
1973 0.14 0.00 0.00 0.00 0.00 0.14 0.41 6.42 9.89 6.29 1.13 0.27 2.07
1974 0.00 0.00 0.00 0.00 0.14 0.85 1.37 6.01 22.88 19.54 2.40 0.55 4.49
1975 0.27 0.15 0.14 0.28 0.27 0.28 6.42 7.93 25.56 20.77 3.11 0.41 5.49
1976 0.00 0.00 0.00 0.00 0.00 1.41 2.73 3.55 9.32 14.49 6.50 0.55 3.23
1977 0.27 0.15 0.00 0.00 0.41 0.56 0.55 13.39 34.17 21.87 2.68 0.96 6.27
1978 0.27 0.15 0.14 0.14 0.14 0.71 2.19 18.86 37.14 12.71 3.95 1.09 6.47
1979 0.27 0.30 0.27 0.28 0.55 0.99 4.78 21.05 17.51 6.83 2.54 1.09 4.74
1980 0.41 0.29 0.27 0.28 0.41 0.56 1.09 8.88 24.57 11.62 2.97 0.82 4.35
1981
1982
1983
1984
Average Flow (m3/s) 0.29 0.19 0.15 0.18 0.31 0.67 2.68 10.93 24.07 12.95 2.75 0.70 4.67