Embed Size (px)
Citation preview

Page 1 of 30
NSLS II TECHNICAL NOTE BROOKHAVEN NATIONAL LABORATORY
NUMBER 260
AUTHOR: M. Benmerrouche
DATE 08/18/2017
07BM QAS Beamline Radiation Shielding Analysis 1. Introduction
The NSLS-II Beamline Radiation Shielding Policy has been stated as follows in reference 1: Radiation exposure to staff and users resulting from National Synchrotron Light Source II (NSLS-II) operations must comply with Brookhaven National Laboratory (BNL) and Department of Energy (DOE) radiation requirements and must be maintained as low as reasonably achievable (ALARA). Per the Shielding Policy (PS-C-ASD-POL-005), in continuously occupied areas during normal operation the dose rate is ALARA, and shall be < 0.5 mrem/h (based on occupancy of 2000 hours/year) or less than 1 rem in a year.
For a fault event, the dose to an individual shall be < 20 mrem in a non-radiation controlled area and < 100 mrem in a radiation controlled area. Although the experimental floor is initially designated as a Controlled Area – TLD Required, it is hoped that in the future, it can be declared a Controlled Area – No TLD Required. As such, beamlines should be shielded so that in the event of a fault, the total dose to an individual, integrated over the duration of the fault, is < 20 mrem.
In this report the recommended shielding is based on calculations to achieve dose rates less than 0.05 mrem/h in continuously occupied areas and less than 0.5 mrem/h on contact with the downstream wall of the First Optical Enclosure (FOE) [2] during normal operations.
Beamlines are required to shield against two primary sources of radiation, the primary gas bremsstrahlung (GB) and the synchrotron beam, as well as the secondary radiation resulting from the scattering of these two primary sources by the beamline components and/or air. The shielding requirements for the FOE are dominated by the scattering of the primary bremsstrahlung and not the synchrotron beam. Guidelines for the NSLS-II Beamline Radiation Shielding Design are also provided in Reference 1. These guidelines were used to determine the thickness of the FOE walls, as well as dimensions of the supplementary shielding required to reduce the dose on the downstream FOE wall. The shielding recommended for the lateral and roof panels is generally sufficient for most white beam component configurations. However, the recommended as-built shielding for the downstream FOE wall may not be sufficient to protect against secondary gas bremsstrahlung (SGB) and additional shielding is usually necessary.
The radiation shielding analysis for the Beamline for Quick x-ray Absorption and Scattering (QAS) is documented in this Technical Note. The goal of the simulations documented here was to estimate the radiation dose levels generated inside and outside of the FOE during normal operations and some fault conditions, thus evaluating the effectiveness of the as-designed shielding.
The layout of the 07-BM (QAS) beamline is presented in Figure 1. These drawings were extracted from the Beamline Ray Trace Layout [PD-QAS-RAYT-0001]. The ray trace drawings include the major components in the beamline and provide their positions. Beam is shown traveling from right to left. For shielding analysis, this information in addition to the geometries and materials of the components and shielding are collected into an input document, included herein as Appendix 1.

Page 2 of 30
Figure 1: Layout of 07BM-QAS showing the location of the 3PW source, mirror PCM in the FE, major beamline components, the FOE (07BM-A) and End Station Enclosures (07BM-B and 07BM-C).
The remainder of this document is organized as follows:
Section 2: Describes the model generated for FLUKA analysis of primary GB and SGB in the 07-BM (QAS) FE and FOE, using NSLS-II source parameters, and all 07-BM (QAS) shielding and beamline components as described in the rays tracings and component design drawings.
Section 3: Presents the FLUKA simulation results. The analysis finds that bremsstrahlung radiation is mostly stopped by shielding at or before the 07-BM (QAS) FOE downstream wall.
Section 4: Describes analysis of the synchrotron radiation, considering pink beam from the M1 mirror up to the pink beam stop (PBS) located in the FOE, and monochromatic beam through the transport pipe to the end station enclosure 07-BM-B.
Section 5: Summary and Conclusions
Section 6: References
Section 7: Acknowledgments
Page 3 of 30
2. Description of the FLUKA Model
At NSLS-II, the FOE shielding requirements are dominated by the scattering of the primary GB, and not the synchrotron beam. The white beam components disperse the primary bremsstrahlung without significant energy loss; thereby greatly increasing the angular range of very high-energy bremsstrahlung photons. It is necessary to intercept this secondary bremsstrahlung before it hits the downstream FOE wall. The design of the 07-BM (QAS) beamline includes additional shielding in order to reduce the dose on the downstream wall and around the transport pipe.
As described in Appendix A of Reference 1 we use the “custom GB generator based on an analytic representation of the source’s energy spectrum which was scaled in intensity in accordance with the experimental estimates of total GB power. This custom source assumes a 1/E energy spectrum dependency, with a maximum energy of 3 GeV, and generates internally the corresponding probability density function from analytical descriptions.”
The NSLS-II primary GB source parameters are listed in Table 1.
Table 1: NSLS-II Primary Bremsstrahlung Source Parameters
Electron energy 3 GeV
Stored current 500 mA
Length of BM straight section 6.6 m
Pressure in straight section 1 ntorr
The beam is normalized at 7.2 μW incident power for the short straight (6.6 m). This value corresponds to the estimated bremsstrahlung power generated by a 500 mA, 3 GeV electron beam, assuming that the vacuum in the straight sections is better than 10-9 Torr. The bremsstrahlung source file is kept in the NSLS-II Radiation Physics folder.
Based on 07BM-QAS ray tracings primary GB will interact with some of the components as described in Appendix 1. The areas of the components intercepted by the primary GB are shown in each subsection of Section 3, which describes the results of the primary GB striking each component. Only areas intercepted by the primary GB including nominal and extreme rays downstream of LCO1 as per the FE ray tracing SR-FE-3PW-4001 were sampled for analysis. The simulations performed to confirm the adequacy of the FOE shielding and radiation safety components are presented in Table 2. For extreme rays, we considered top and bottom extreme rays downstream from LCO1 as shown in sheet 7 of ray tracing drawing SR-FE-3PW-4001. Components referenced in Table 2 are described in Appendix1.
Page 4 of 30
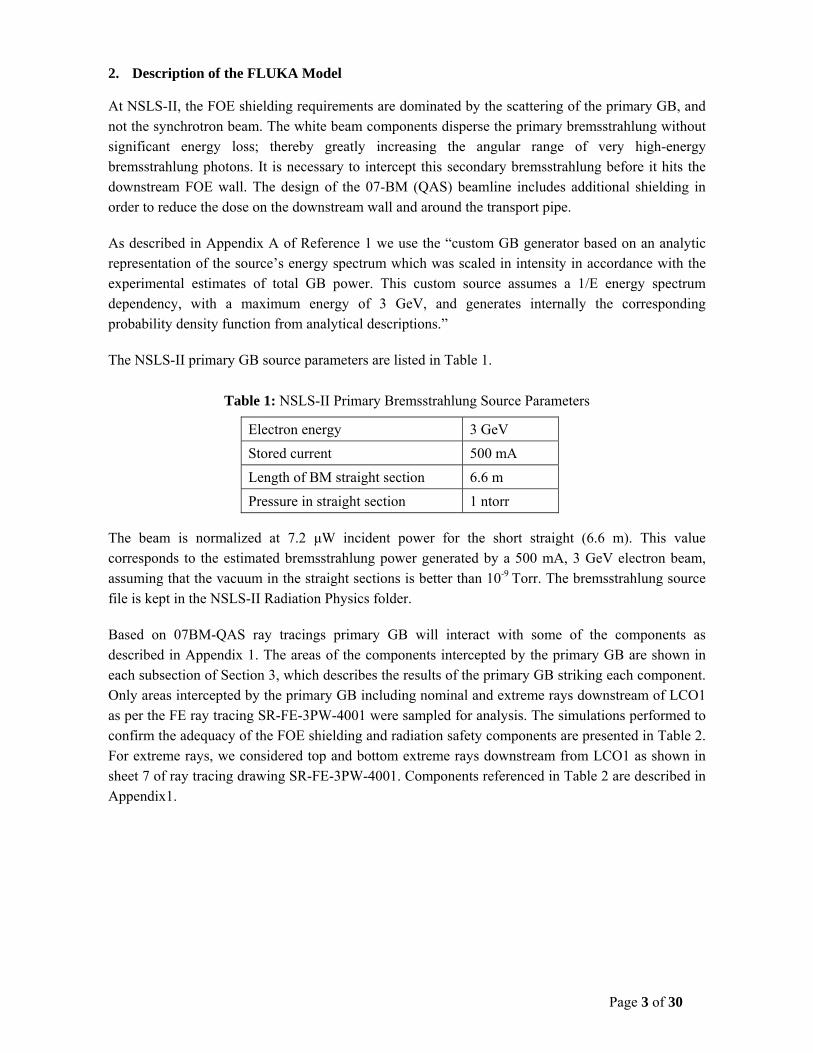
Table 2: List of FLUKA Simulations
Case # / Report Section
Simulation GB Beam Position (x, y, z) in cm
1 / 3.1 PCM: GB incident near center of Mirror PCM (0.0 , 0.0 , -1209.47)
2 / 3.2 FM2: GB incident on Fixed Mask 2 (0.0 , 0.0 , -1044.72) 3 / 3.3 FM3: GB (top extreme ray) incident on FM3 in the FE (0.0 , 3.00 , -771.02) 4 / 3.4 FM4: GB (top/bottom extreme rays) incident on FM4 in
the FE. (0.0 , 4.53 , -204.12) (0.0 , 3.62 , -204.12)
5 / 3.5 MSK1: GB (top/bottom extreme rays) incident on MSK1 in the FOE.
(0.0 , 5.60 , 192.73) (0.0 , 4.42 , 192.73)
The 07-BM (QAS) FLUKA model includes the FOE roof, lateral wall, the downstream wall as well as the ratchet wall and long wall of the storage ring (SR). The FOE outboard lateral panel is made of 18 mm Pb (80.56 cm from short straight centerline), roof 4 mm Pb (210 cm above short straight centerline) and downstream FOE wall 50 mm Pb (~969 cm from the ratchet wall). See Appendix 1 for more details.
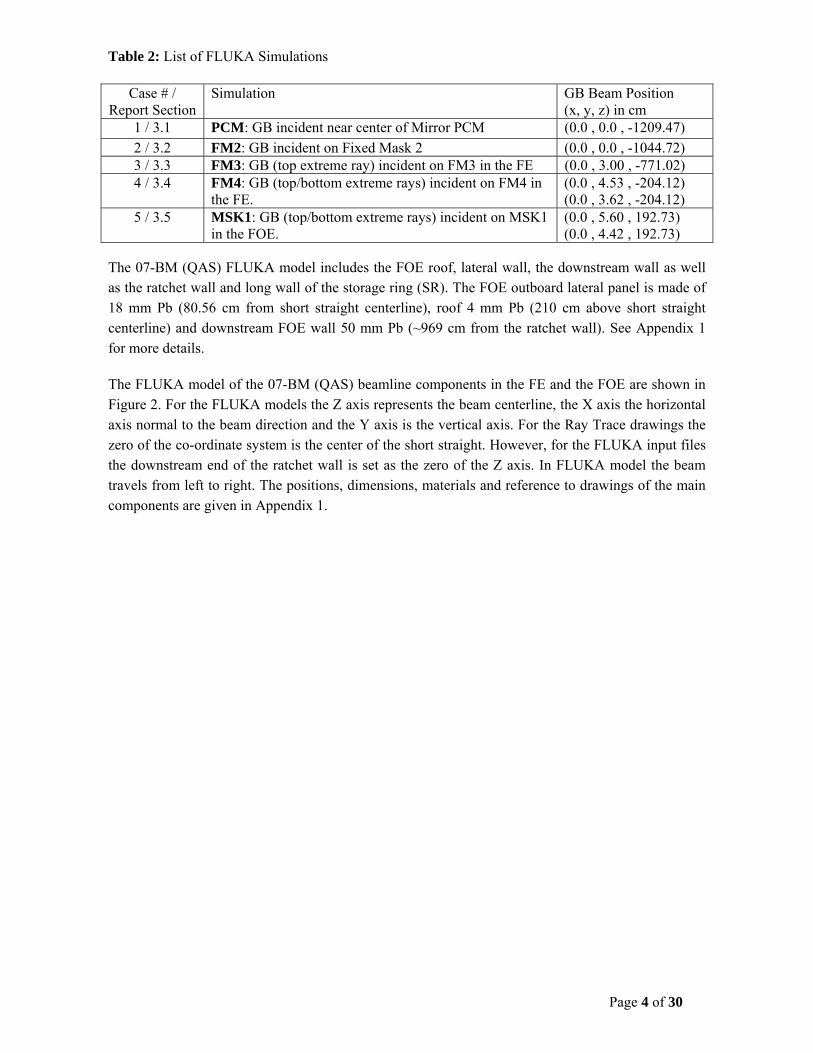
The FLUKA model of the 07-BM (QAS) beamline components in the FE and the FOE are shown in Figure 2. For the FLUKA models the Z axis represents the beam centerline, the X axis the horizontal axis normal to the beam direction and the Y axis is the vertical axis. For the Ray Trace drawings the zero of the co-ordinate system is the center of the short straight. However, for the FLUKA input files the downstream end of the ratchet wall is set as the zero of the Z axis. In FLUKA model the beam travels from left to right. The positions, dimensions, materials and reference to drawings of the main components are given in Appendix 1.
Page 5 of 30
(a)
(b)
Figure 2: FLUKA Model used in Top-Off simulation of the 07BM-QAS Beamline (a) Front End and (b) Beamline

Page 6 of 30
ACRONYMS:
3PW Three Pole Wiggler
ALARA As Low As Reasonably Achievable
BeW Beryllium Window
BM Bend Magnet
BRS Bremsstrahlung Stop
DCM Double Crystal Monochromator
DOE Department of Energy
ESE End Station Enclosure
DF Diagnostic Flag
FE Front End
FM Fixed Mask
FOE First Optical Enclosure
GB Gas Bremsstrahlung
GeV Giga Electron Volts
keV Kilo Electron Volts
LCO Lead Collimator
MSK Mask
NSLS-II National Synchrotron Light Source II
PBS Pink Beam Stop
PCM Photon Collimating Mirror
PFM Photon Focusing Mirror
PSH Photon Shutter
QAS Quick x-ray Absorption and Scattering
RCO Ratchet Wall Collimator
SDS Shadow Shield
SLT Slits
SSH Safety Shutter
SGB Secondary Gas Bremsstrahlung
SR Synchrotron Radiation
TLD Thermoluminescent Dosimeter
Page 7 of 30
3. Results for Primary GB Simulations
The shielding requirement for the FOE is dominated by the scattering of the primary Gas Bremsstrahlung radiation, originating from the storage ring’s electron beam interacting with residual gas in the storage ring. The paths of this radiation are determined by ray tracing of the GB through and around the FE and beamline components. The analysis approach was to place the GB beam at various locations within the area of the component intercepted by the primary. The simulations performed to confirm the adequacy of the radiation safety components are presented in Table 2. Section 5 includes a summary of the simulations results.
3.1 PCM
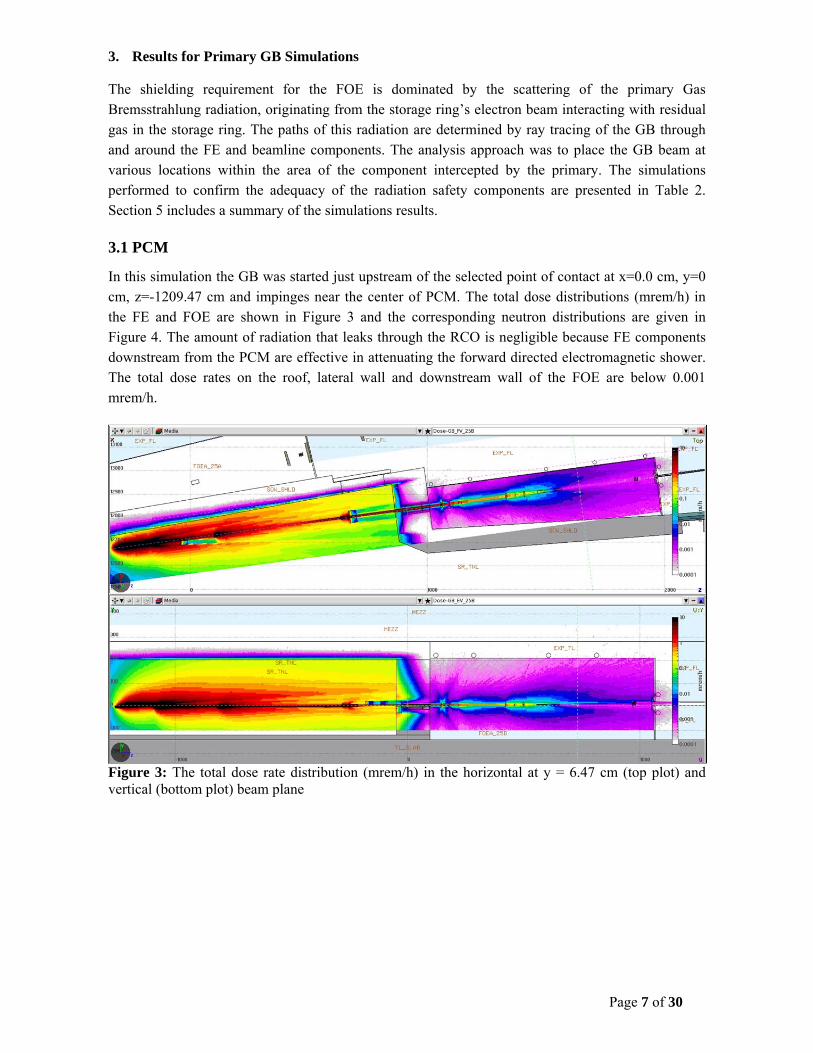
In this simulation the GB was started just upstream of the selected point of contact at x=0.0 cm, y=0 cm, z=-1209.47 cm and impinges near the center of PCM. The total dose distributions (mrem/h) in the FE and FOE are shown in Figure 3 and the corresponding neutron distributions are given in Figure 4. The amount of radiation that leaks through the RCO is negligible because FE components downstream from the PCM are effective in attenuating the forward directed electromagnetic shower. The total dose rates on the roof, lateral wall and downstream wall of the FOE are below 0.001 mrem/h.
Figure 3: The total dose rate distribution (mrem/h) in the horizontal at y = 6.47 cm (top plot) and vertical (bottom plot) beam plane
Page 8 of 30
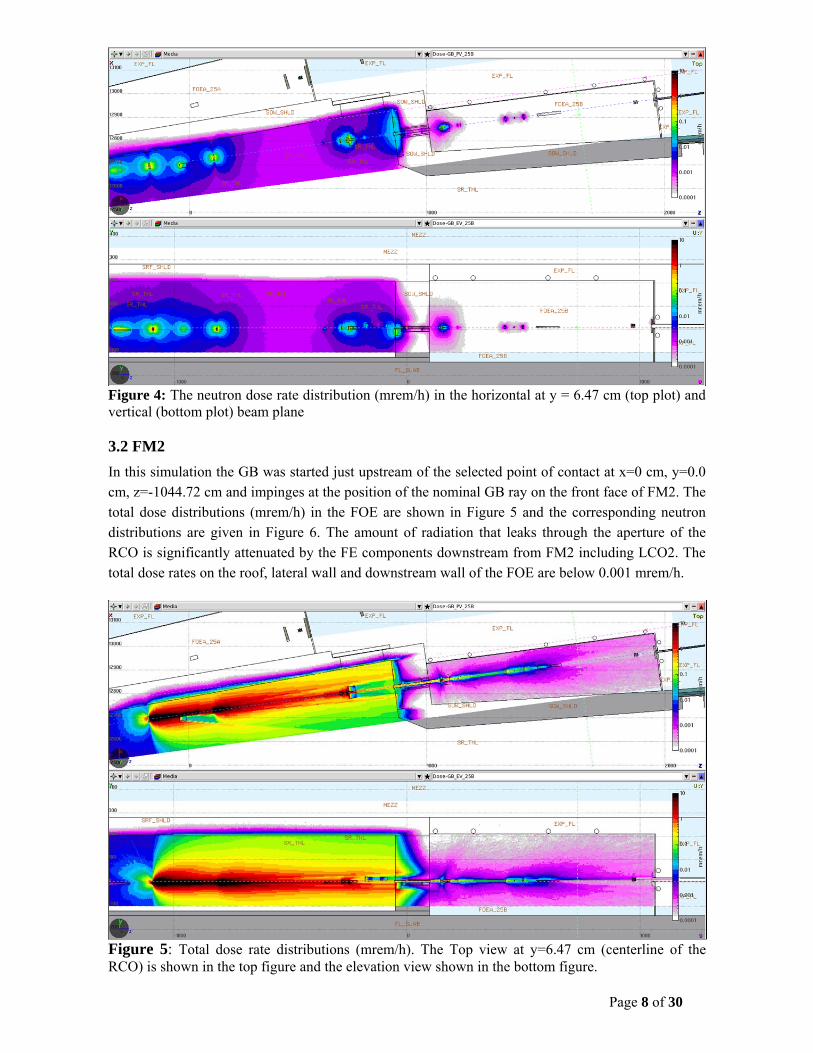
Figure 4: The neutron dose rate distribution (mrem/h) in the horizontal at y = 6.47 cm (top plot) and vertical (bottom plot) beam plane 3.2 FM2
In this simulation the GB was started just upstream of the selected point of contact at x=0 cm, y=0.0 cm, z=-1044.72 cm and impinges at the position of the nominal GB ray on the front face of FM2. The total dose distributions (mrem/h) in the FOE are shown in Figure 5 and the corresponding neutron distributions are given in Figure 6. The amount of radiation that leaks through the aperture of the RCO is significantly attenuated by the FE components downstream from FM2 including LCO2. The total dose rates on the roof, lateral wall and downstream wall of the FOE are below 0.001 mrem/h.
Figure 5: Total dose rate distributions (mrem/h). The Top view at y=6.47 cm (centerline of the RCO) is shown in the top figure and the elevation view shown in the bottom figure.

Page 9 of 30
Figure 6: The neutron dose rate distribution (mrem/h) in the horizontal at y = 6.47 cm (top plot) and vertical (bottom plot) beam plane 3.3 FM3
In this case GB was started just upstream of the selected point of contact at x=0 cm, y=3.00 cm, z=-771.02 cm and impinges at the position of the top extreme ray on the front face of FM3. The total dose distributions (mrem/h) in the FOE are shown in Figure 7 and the corresponding neutron distributions are given in Figure 8, which clearly shows that LCO2 is very effective in attenuating the forward electromagnetic shower and the amount of radiation that leaks through its aperture is further attenuated by beamline components in the FOE.
Figure 7: Total dose rate distributions (mrem/h). The Top view at y=6.47 cm (centerline of the RCO) is shown in the top figure and the elevation view shown in the bottom figure.
Page 10 of 30
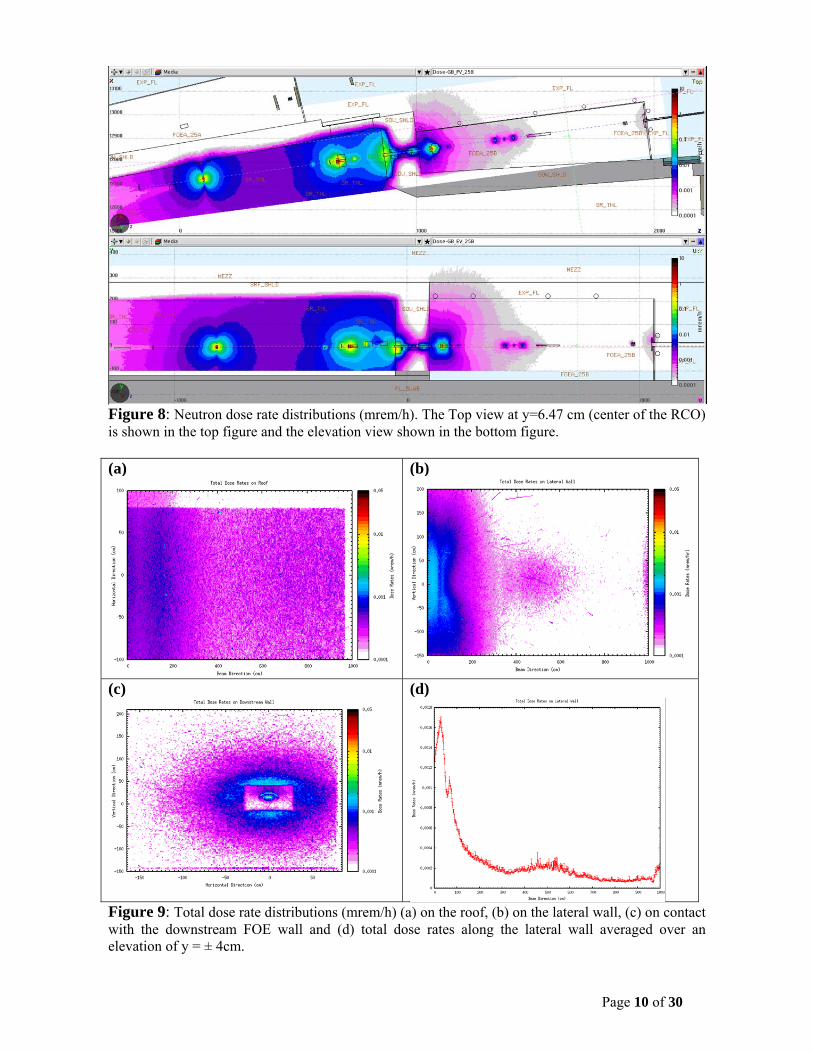
Figure 8: Neutron dose rate distributions (mrem/h). The Top view at y=6.47 cm (center of the RCO) is shown in the top figure and the elevation view shown in the bottom figure. (a) (b)
(c)
(d)
Figure 9: Total dose rate distributions (mrem/h) (a) on the roof, (b) on the lateral wall, (c) on contact with the downstream FOE wall and (d) total dose rates along the lateral wall averaged over an elevation of y = ± 4cm.
Page 11 of 30
Unlike the previous 2 cases, total dose rates are slightly above 0.001 mrem/h on the roof [Figure 9(a)], the downstream wall [Figure 9(c)] and the lateral wall [Figure 9(b) and (d)], but below 0.01 mrem/h. 3.5 FM4
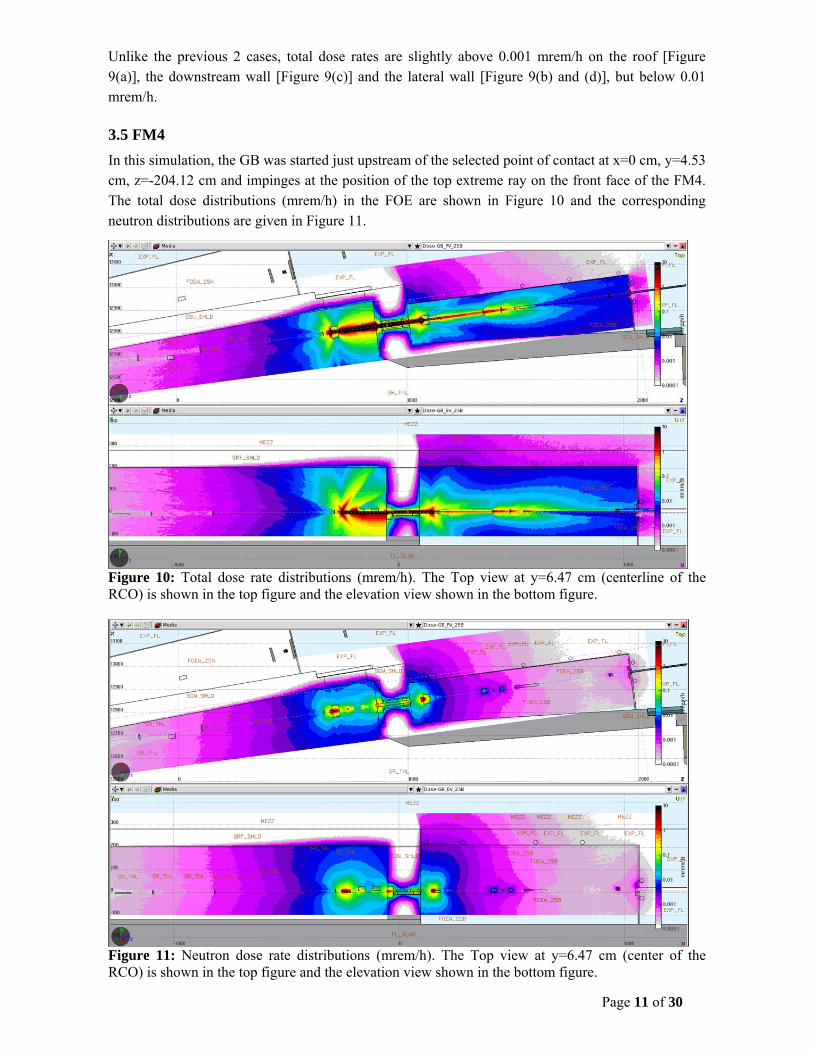
In this simulation, the GB was started just upstream of the selected point of contact at x=0 cm, y=4.53 cm, z=-204.12 cm and impinges at the position of the top extreme ray on the front face of the FM4. The total dose distributions (mrem/h) in the FOE are shown in Figure 10 and the corresponding neutron distributions are given in Figure 11.
Figure 10: Total dose rate distributions (mrem/h). The Top view at y=6.47 cm (centerline of the RCO) is shown in the top figure and the elevation view shown in the bottom figure.
Figure 11: Neutron dose rate distributions (mrem/h). The Top view at y=6.47 cm (center of the RCO) is shown in the top figure and the elevation view shown in the bottom figure.

Page 12 of 30
The total dose rates are highest on the lateral wall in proximity of the MSK1 and BRS, as illustrated in Figure 12(b) and Figure 12(d) shows that the total dose rates on the lateral do not exceed 0.01 mrem/h. The dose rates on contact with the roof [Figure 12(a)] and the downstream wall [Figure 12(c)] are also below 0.01 mrem/h. The BRS is very effective in attenuating the forward electromagnetic shower generated in the FE, which is further shadowed by the guillotine, as can be seen in Figure 12(c). The amount of radiation that leaks through the apertures of BRS is attenuated by the beamline components downstream from the BRS.
(a) (b)
(c) (d)
Figure 12: Total dose rate distributions (mrem/h) (a) on the roof, (b) on the lateral wall, (c) on contact with the downstream FOE wall and (d) total dose rates along the lateral wall averaged over an elevation of y = ± 4cm. In this simulation, the GB was started just upstream of the selected point of contact at x=0 cm, y=3.62 cm, z=-204.12 cm and impinges at the position of the bottom extreme ray on the front face of the FM4. The total dose distributions (mrem/h) in the FOE are shown in Figure 13 and the corresponding neutron distributions are given in Figure 14.
Page 13 of 30
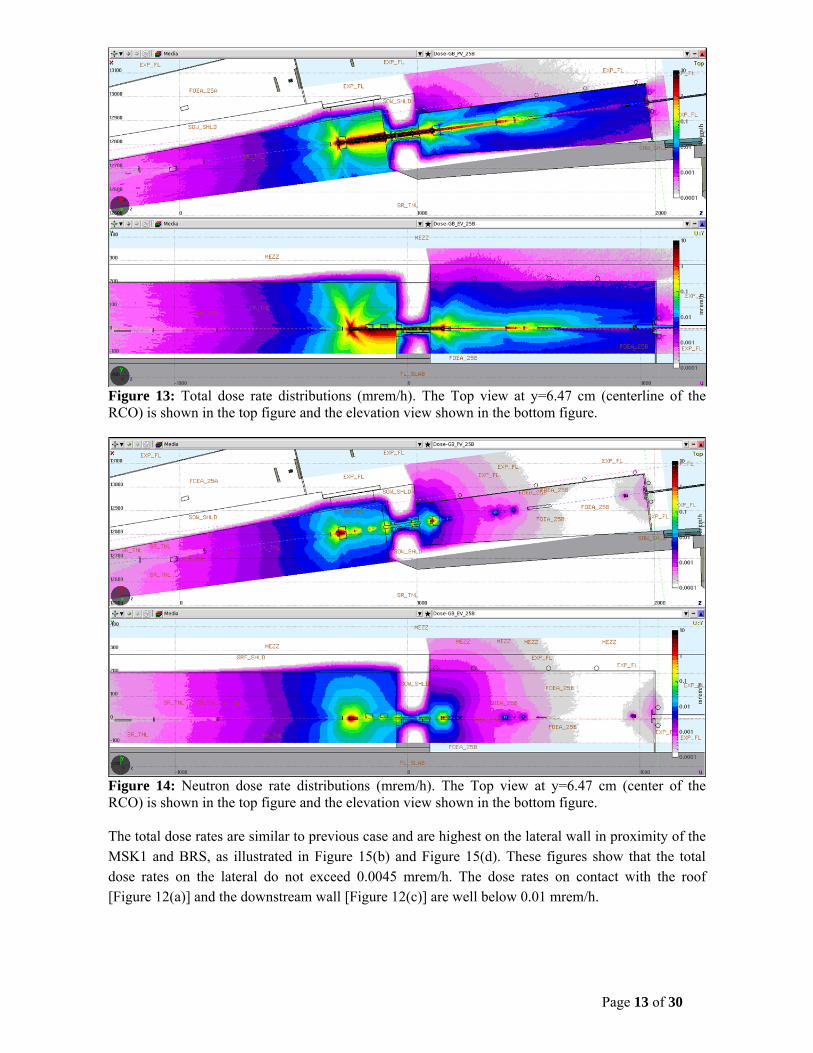
Figure 13: Total dose rate distributions (mrem/h). The Top view at y=6.47 cm (centerline of the RCO) is shown in the top figure and the elevation view shown in the bottom figure.
Figure 14: Neutron dose rate distributions (mrem/h). The Top view at y=6.47 cm (center of the RCO) is shown in the top figure and the elevation view shown in the bottom figure. The total dose rates are similar to previous case and are highest on the lateral wall in proximity of the MSK1 and BRS, as illustrated in Figure 15(b) and Figure 15(d). These figures show that the total dose rates on the lateral do not exceed 0.0045 mrem/h. The dose rates on contact with the roof [Figure 12(a)] and the downstream wall [Figure 12(c)] are well below 0.01 mrem/h.
Page 14 of 30
(a)
(b)
(c)
(d)
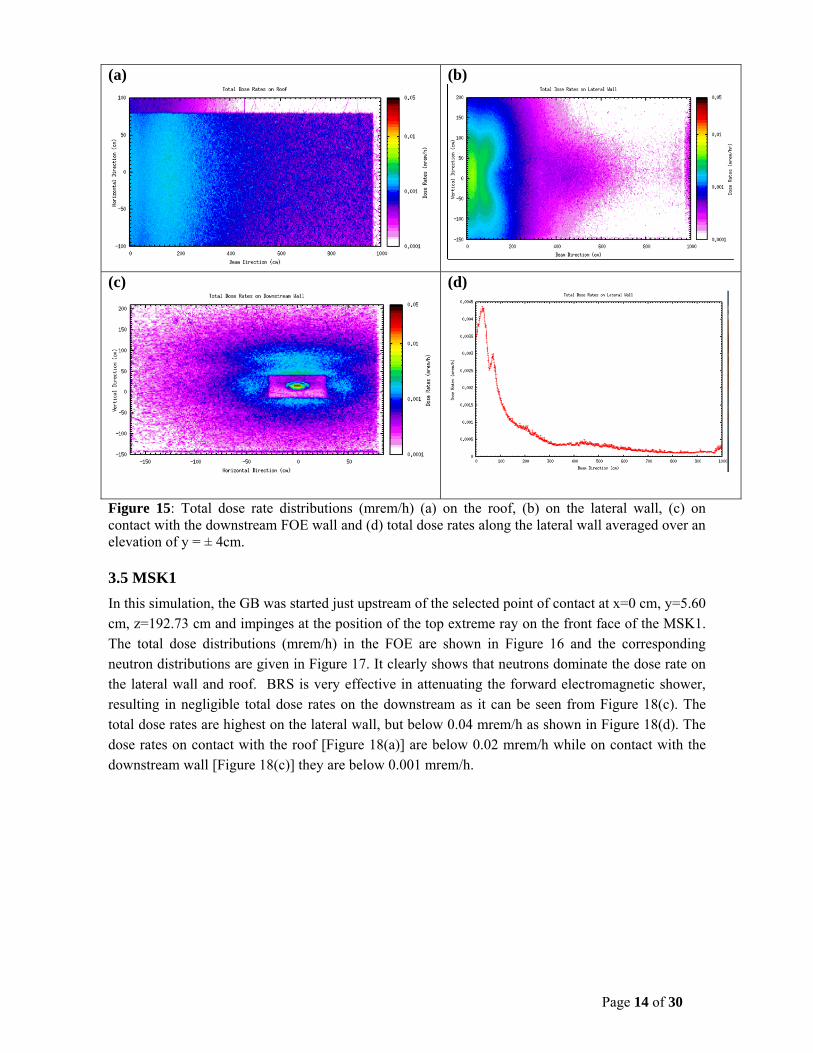
Figure 15: Total dose rate distributions (mrem/h) (a) on the roof, (b) on the lateral wall, (c) on contact with the downstream FOE wall and (d) total dose rates along the lateral wall averaged over an elevation of y = ± 4cm. 3.5 MSK1
In this simulation, the GB was started just upstream of the selected point of contact at x=0 cm, y=5.60 cm, z=192.73 cm and impinges at the position of the top extreme ray on the front face of the MSK1. The total dose distributions (mrem/h) in the FOE are shown in Figure 16 and the corresponding neutron distributions are given in Figure 17. It clearly shows that neutrons dominate the dose rate on the lateral wall and roof. BRS is very effective in attenuating the forward electromagnetic shower, resulting in negligible total dose rates on the downstream as it can be seen from Figure 18(c). The total dose rates are highest on the lateral wall, but below 0.04 mrem/h as shown in Figure 18(d). The dose rates on contact with the roof [Figure 18(a)] are below 0.02 mrem/h while on contact with the downstream wall [Figure 18(c)] they are below 0.001 mrem/h.
Page 15 of 30
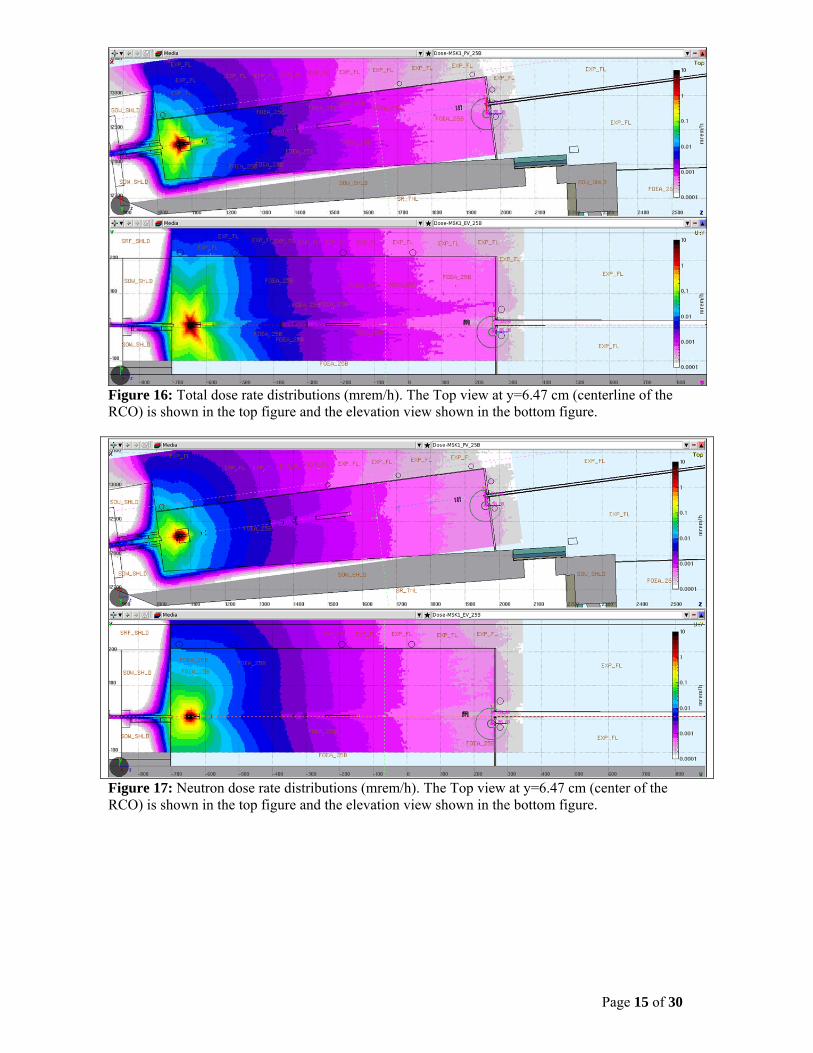
Figure 16: Total dose rate distributions (mrem/h). The Top view at y=6.47 cm (centerline of the RCO) is shown in the top figure and the elevation view shown in the bottom figure.
Figure 17: Neutron dose rate distributions (mrem/h). The Top view at y=6.47 cm (center of the RCO) is shown in the top figure and the elevation view shown in the bottom figure.
Page 16 of 30
(a)
(b)
(c)
(d)
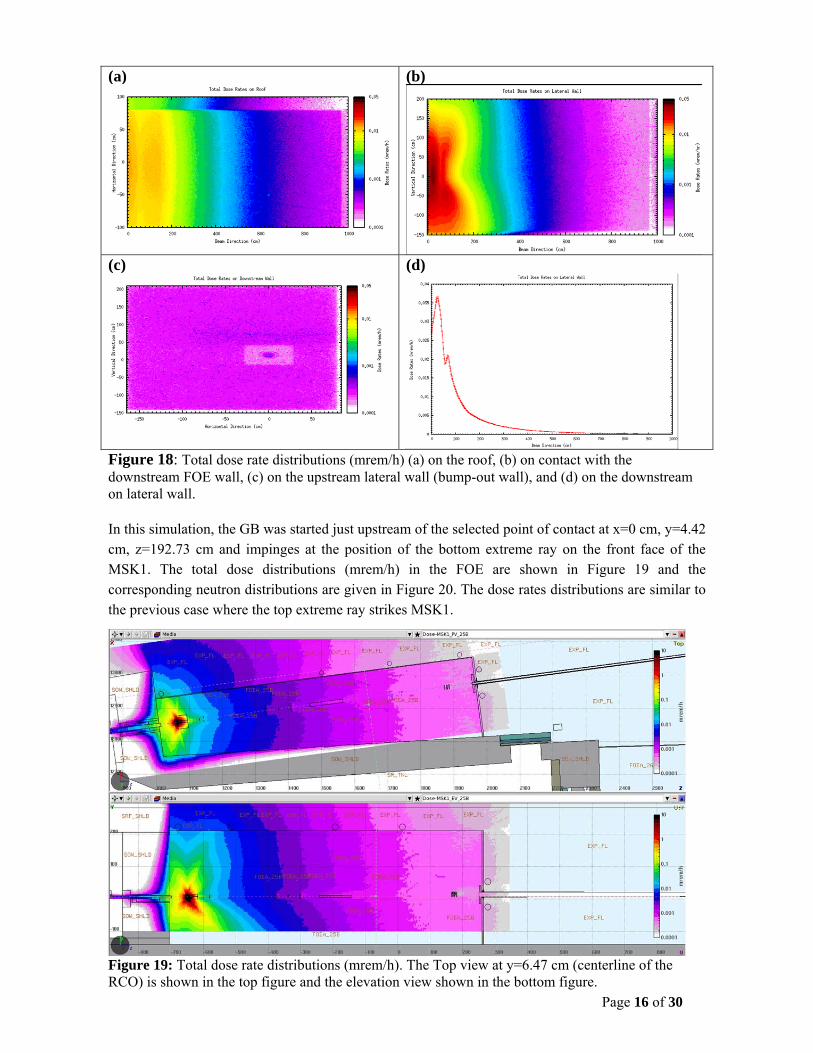
Figure 18: Total dose rate distributions (mrem/h) (a) on the roof, (b) on contact with the downstream FOE wall, (c) on the upstream lateral wall (bump-out wall), and (d) on the downstream on lateral wall. In this simulation, the GB was started just upstream of the selected point of contact at x=0 cm, y=4.42 cm, z=192.73 cm and impinges at the position of the bottom extreme ray on the front face of the MSK1. The total dose distributions (mrem/h) in the FOE are shown in Figure 19 and the corresponding neutron distributions are given in Figure 20. The dose rates distributions are similar to the previous case where the top extreme ray strikes MSK1.
Figure 19: Total dose rate distributions (mrem/h). The Top view at y=6.47 cm (centerline of the RCO) is shown in the top figure and the elevation view shown in the bottom figure.

Page 17 of 30
Figure 20: Neutron dose rate distributions (mrem/h). The Top view at y=6.47 cm (center of the RCO) is shown in the top figure and the elevation view shown in the bottom figure. 4. Synchrotron Radiation Calculation
The 07-BM (QAS) beamline is a three pole wiggler (3PW) source and its parameters are extracted from references [1] and reproduced in Table 3. It has a collimating mirror in the FE, which will deflect the synchrotron beam vertically and pass through the vertically offset RCO aperture. Therefore, the synchrotron beam entering the FOE is a mirror reflected pink beam. For simplicity, the FOE analysis below is based on a white beam, which is very conservative. The horizontal opening angle for the 07-BM (QAS) source fan entering the FOE is provided in column 2. The NSLS-II stored electron beam parameters of 3 GeV and 500 mA (See Table 1) have been used to calculate the critical energy (column 6) and the STAC8 total integrated power (column 7).
Table 3: Source Parameters Used for 07-BM (QAS) Synchrotron Calculations
Source Max. source opening
No. Of periods
Max. Beff (T)
Length (m)
Ec (keV) STAC 8 Total Power (kW) @ 500mA
3PW 3.0 mrad-H 1 1.2 0.25 6.7 0.28
The analytic code STAC8 [4] was used to calculate the ambient dose equivalent rates in the occupied areas outside the FOE, monochromatic beam transport pipe and end-station enclosure 07-BM-B. The build-up factor in shielding was included in the calculation. However, the effect of SR polarization was not considered leading to the same shielding requirements for the lateral wall and roof provided the distance from the scatter target to dose point is the same. The shielding calculations for the transport pipe and the ESEs assume that the primary bremsstrahlung has been completely stopped in the FOE. Targets for maximum scattered radiation were considered in the STAC8 calculations. These cases considered are described in Section 4.1and 4.2.

Page 18 of 30
4.1 First Optics Enclosure (FOE)
For maximum scattered radiation the scattering target is assumed to be a silicon disk of 10 cm radius and 2 cm thick tilted at grazing angle of 0.155 degree with the respect to the incident beam [4]. The position of the scatter target is assumed to be located at the DCM approximately 604 cm from the FOE downstream wall, 80 cm from the lateral wall and 210 cm from the roof. The minimum required shielding for the SR (white beam) source (no credit has been given to the secondary bremsstrahlung shielding or guillotine) and the corresponding ambient dose rates are given in Table 4. The results show that the shielding thicknesses required for the GB will largely shield for the scattered synchrotron radiation. Therefore, the existing shielding thicknesses of the FOE walls and roof, as given in Appendix 1, are more than adequate to meet the shielding design goal of 0.05 mrem/h.
Table 4: SR Shielding Design Requirements for 07BM-QAS FOE
Distance (cm) Minimum Required Shielding
Max Ambient Dose Rate (mrem/h)
Lateral wall 80 5 mm Pb 0.015 Roof 210 4 mm Pb 0.014 Downstream Wall (> 1o) 604 6 mm Pb 0.041 4.2 Transport Pipe and ESE (07-BM-B/C)
The lead thickness of the 07-BM (QAS) monochromatic beam transport pipe is 5 mm, which exceeds the minimum shielding requirement of 2 mm; specified in Reference [1]. Figure 21 shows the vertical synchrotron ray tracings, which illustrate that under certain Mirror PFM configuration, the monochromatic beam shown in section D-D could potentially strike the lead shielded transport pipe.
Figure 21: Synchrotron vertical ray tracings showing mis-steered monochromatic beam striking the shielded transport pipe (section D-D).
Page 19 of 30
We assumed a pink beam from Rh coated M1 mirror with a lowest incident angle of 2.7 mrad needed for the reflected beam to enter the FOE and incident on the first crystal of the DCM. Assuming five higher harmonic reflections (111, 333, 444, 555, and 777) of the fundamental mode of 22 keV with corresponding bandwidths [5], the dose rate is calculated directly on contact with the lead shielded transport pipe by the “NICK” card in STAC8. The calculated ambient dose rate is 2.7E-04 mrem/h for this abnormal mis-steering event and is well below the design criteria of 0.05 mrem/h.
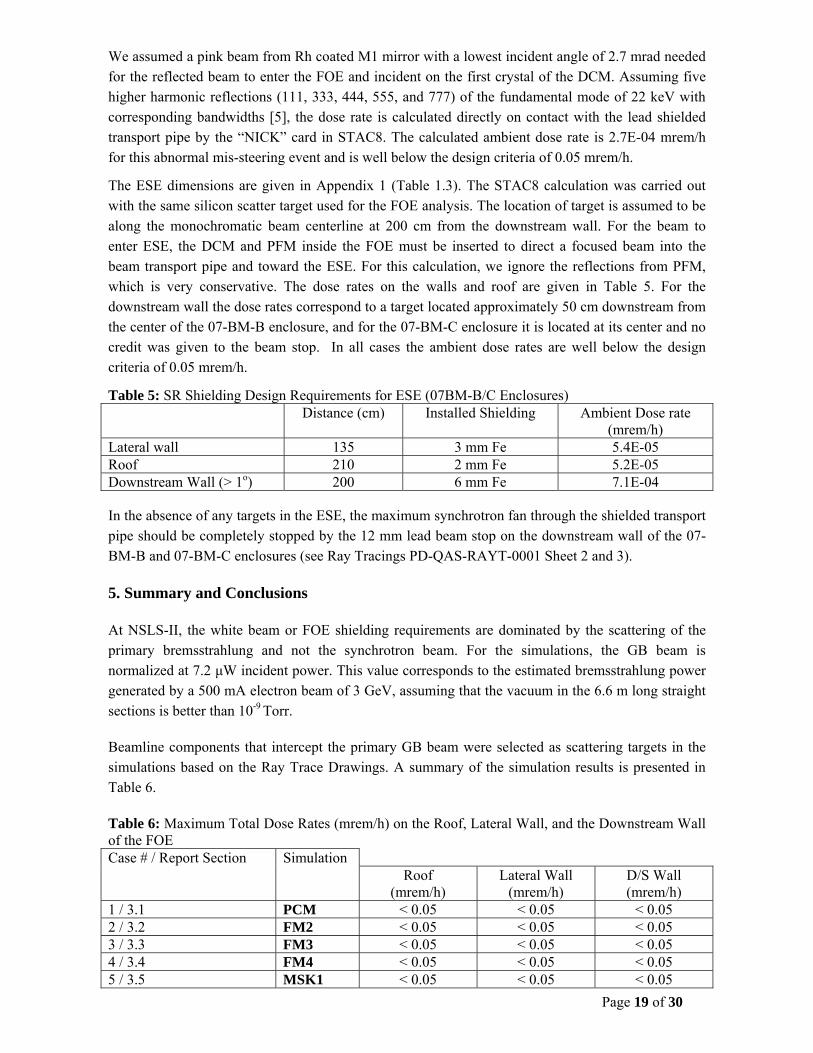
The ESE dimensions are given in Appendix 1 (Table 1.3). The STAC8 calculation was carried out with the same silicon scatter target used for the FOE analysis. The location of target is assumed to be along the monochromatic beam centerline at 200 cm from the downstream wall. For the beam to enter ESE, the DCM and PFM inside the FOE must be inserted to direct a focused beam into the beam transport pipe and toward the ESE. For this calculation, we ignore the reflections from PFM, which is very conservative. The dose rates on the walls and roof are given in Table 5. For the downstream wall the dose rates correspond to a target located approximately 50 cm downstream from the center of the 07-BM-B enclosure, and for the 07-BM-C enclosure it is located at its center and no credit was given to the beam stop. In all cases the ambient dose rates are well below the design criteria of 0.05 mrem/h.
Table 5: SR Shielding Design Requirements for ESE (07BM-B/C Enclosures) Distance (cm) Installed Shielding Ambient Dose rate
(mrem/h) Lateral wall 135 3 mm Fe 5.4E-05 Roof 210 2 mm Fe 5.2E-05 Downstream Wall (> 1o) 200 6 mm Fe 7.1E-04
In the absence of any targets in the ESE, the maximum synchrotron fan through the shielded transport pipe should be completely stopped by the 12 mm lead beam stop on the downstream wall of the 07-BM-B and 07-BM-C enclosures (see Ray Tracings PD-QAS-RAYT-0001 Sheet 2 and 3).
5. Summary and Conclusions
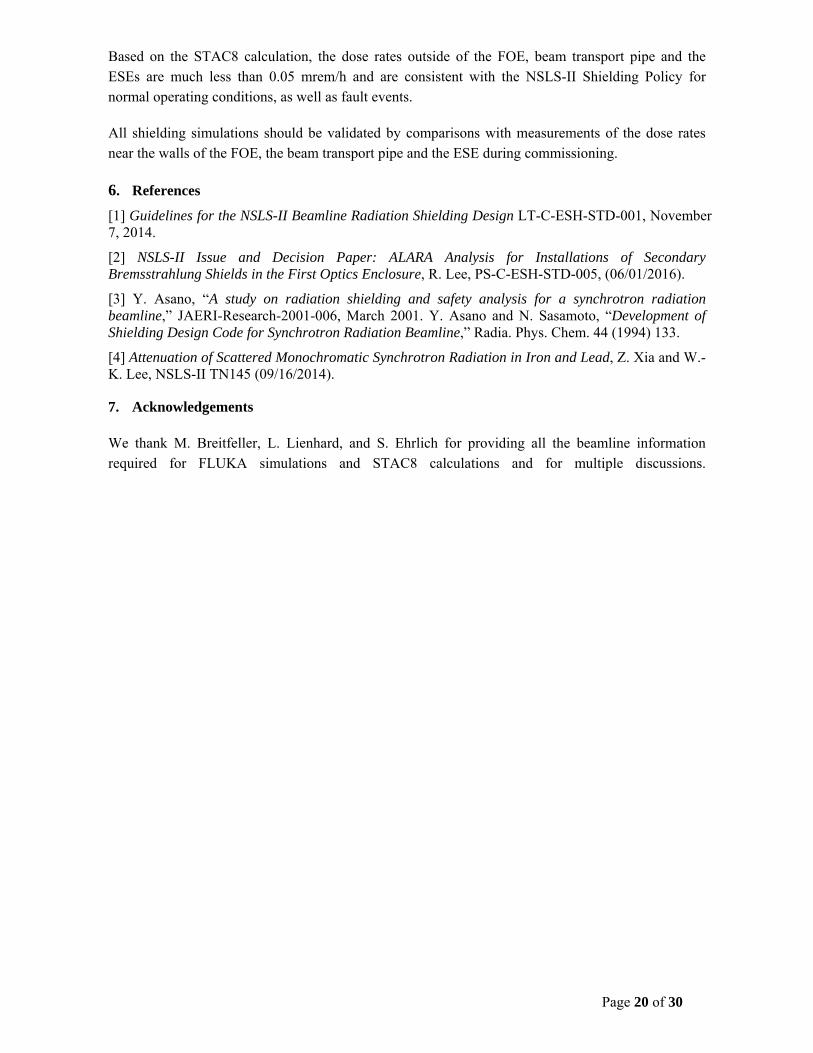
At NSLS-II, the white beam or FOE shielding requirements are dominated by the scattering of the primary bremsstrahlung and not the synchrotron beam. For the simulations, the GB beam is normalized at 7.2 μW incident power. This value corresponds to the estimated bremsstrahlung power generated by a 500 mA electron beam of 3 GeV, assuming that the vacuum in the 6.6 m long straight sections is better than 10-9 Torr.
Beamline components that intercept the primary GB beam were selected as scattering targets in the simulations based on the Ray Trace Drawings. A summary of the simulation results is presented in Table 6.
Table 6: Maximum Total Dose Rates (mrem/h) on the Roof, Lateral Wall, and the Downstream Wall of the FOE Case # / Report Section Simulation
Roof (mrem/h)
Lateral Wall (mrem/h)
D/S Wall (mrem/h)
1 / 3.1 PCM < 0.05 < 0.05 < 0.05 2 / 3.2 FM2 < 0.05 < 0.05 < 0.05 3 / 3.3 FM3 < 0.05 < 0.05 < 0.05 4 / 3.4 FM4 < 0.05 < 0.05 < 0.05 5 / 3.5 MSK1 < 0.05 < 0.05 < 0.05
Page 20 of 30
Based on the STAC8 calculation, the dose rates outside of the FOE, beam transport pipe and the ESEs are much less than 0.05 mrem/h and are consistent with the NSLS-II Shielding Policy for normal operating conditions, as well as fault events.
All shielding simulations should be validated by comparisons with measurements of the dose rates near the walls of the FOE, the beam transport pipe and the ESE during commissioning.
6. References
[1] Guidelines for the NSLS-II Beamline Radiation Shielding Design LT-C-ESH-STD-001, November 7, 2014.
[2] NSLS-II Issue and Decision Paper: ALARA Analysis for Installations of Secondary Bremsstrahlung Shields in the First Optics Enclosure, R. Lee, PS-C-ESH-STD-005, (06/01/2016).
[3] Y. Asano, “A study on radiation shielding and safety analysis for a synchrotron radiation beamline,” JAERI-Research-2001-006, March 2001. Y. Asano and N. Sasamoto, “Development of Shielding Design Code for Synchrotron Radiation Beamline,” Radia. Phys. Chem. 44 (1994) 133.
[4] Attenuation of Scattered Monochromatic Synchrotron Radiation in Iron and Lead, Z. Xia and W.-K. Lee, NSLS-II TN145 (09/16/2014).
7. Acknowledgements
We thank M. Breitfeller, L. Lienhard, and S. Ehrlich for providing all the beamline information required for FLUKA simulations and STAC8 calculations and for multiple discussions.

Page 21 of 30
Appendix 1 07-BM (QAS) Input provided by Mark Breitfeller and Lukas Lienhard: updated on Jul 24, 2017. The source point is the origin of the co-ordinate system. The FE centerline was used as the z or beam axis for the FLUKA models. Y is the vertical axis and x the horizontal axis orthogonal to the y and z axes. Table 1.1 Beamline Enclosure: First Optical Enclosure
Wall Position Thickness Material D/S End of 7-BM Ratchet Wall 24892.4 mm
D/S End of FOE (7-BM-A) Backwall 34584.2 mm 50 mm Lead Distance of Sidewall from straight CENTERLINE 805.6 mm 18 mm Lead Distance of Roof from straight CENTERLINE 2100.0 mm 4 mm Lead
Table 1.2 Beamline Transport Pipe Transport Pipe between FOE & SOE
ID = 5.75 inches (min) OD = 6.00 inches Material: Stainless Steel
Shielding Thickness = 5.0 mm Shielding Material: Lead Beampipe is 13.9 cm (y) above center line
Table 1.3 Endstation Enclosures (B&C share walls)
Wall Position Thickness Material U/S End of 7-BM-B Wall 43500 mm (z) 3 mm Steel
D/S End of 7-BM-B Backwall 48500 mm (z) 6 mm Steel D/S end of 7-BM-C Backwall 52500 mm (z) 6 mm Steel
Distance of inboard Sidewall from straight CENTERLINE (B&C)
1350 mm (x) 3 mm Steel
Distance of outboard Sidewall from straight CENTERLINE (B&C)
2150 mm (x) 3 mm Steel
Distance of Roof from straight CENTERLINE 2100 mm (y) 2 mm Steel D/S Wall beam stop location B hutch
(395mm H x 560mmV) 48439.9 mm
(U/S) Center +193mm (y)
12 mm Lead
D/S Wall beam stop location C hutch (50cm x 50cm)
52482.0 mm (U/S)
Center +273mm (y)
12 mm Lead
Page 22 of 30
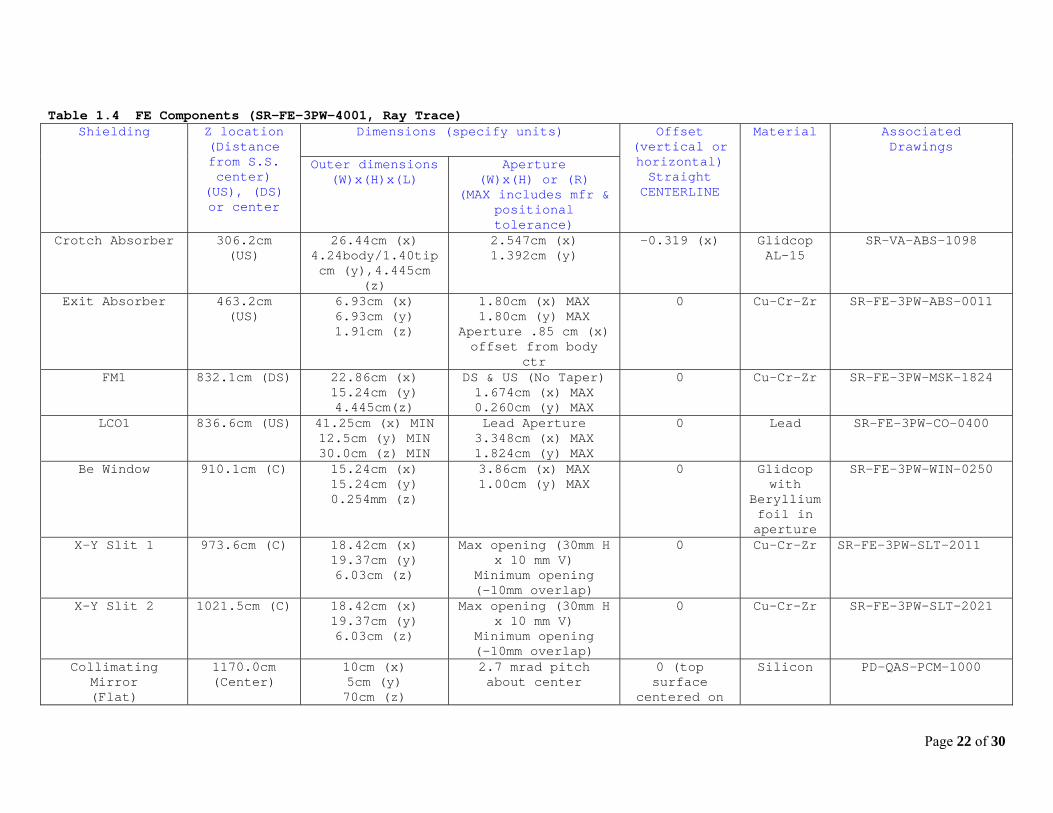
Table 1.4 FE Components (SR-FE-3PW-4001, Ray Trace) Shielding Z location
(Distance from S.S. center)
(US), (DS) or center
Dimensions (specify units) Offset (vertical or horizontal) Straight CENTERLINE
Material Associated Drawings
Outer dimensions (W)x(H)x(L)
Aperture (W)x(H) or (R)
(MAX includes mfr & positional tolerance)
Crotch Absorber 306.2cm (US)
26.44cm (x) 4.24body/1.40tip cm (y),4.445cm
(z)
2.547cm (x) 1.392cm (y)
-0.319 (x) Glidcop AL-15
SR-VA-ABS-1098
Exit Absorber 463.2cm (US)
6.93cm (x) 6.93cm (y) 1.91cm (z)
1.80cm (x) MAX 1.80cm (y) MAX
Aperture .85 cm (x) offset from body
ctr
0
Cu-Cr-Zr SR-FE-3PW-ABS-0011
FM1 832.1cm (DS) 22.86cm (x) 15.24cm (y) 4.445cm(z)
DS & US (No Taper) 1.674cm (x) MAX 0.260cm (y) MAX
0 Cu-Cr-Zr SR-FE-3PW-MSK-1824
LCO1 836.6cm (US) 41.25cm (x) MIN 12.5cm (y) MIN 30.0cm (z) MIN
Lead Aperture 3.348cm (x) MAX 1.824cm (y) MAX
0 Lead SR-FE-3PW-CO-0400
Be Window 910.1cm (C) 15.24cm (x) 15.24cm (y) 0.254mm (z)
3.86cm (x) MAX 1.00cm (y) MAX
0 Glidcop with
Beryllium foil in aperture
SR-FE-3PW-WIN-0250
X-Y Slit 1 973.6cm (C) 18.42cm (x) 19.37cm (y) 6.03cm (z)
Max opening (30mm H x 10 mm V)
Minimum opening (-10mm overlap)
0 Cu-Cr-Zr SR-FE-3PW-SLT-2011
X-Y Slit 2 1021.5cm (C) 18.42cm (x) 19.37cm (y) 6.03cm (z)
Max opening (30mm H x 10 mm V)
Minimum opening (-10mm overlap)
0 Cu-Cr-Zr SR-FE-3PW-SLT-2021
Collimating Mirror (Flat)
1170.0cm (Center)
10cm (x) 5cm (y) 70cm (z)
2.7 mrad pitch about center
0 (top surface
centered on
Silicon PD-QAS-PCM-1000

Page 23 of 30
beam) FM2 1304.7cm
(DS) 22.86cm (x) 15.24cm (y) 4.445cm(z)
DS: 3.225cm (x)MAX DS: 1.002cm (y)MAX Vert angle = 1 deg US: 1.075cm (y)MAX
+.73cm (y) Cu-Cr-Zr SR-FE-3PW-MSK-1825
Inboard Shadow Shield
1511.4cm (US)
17.5cm (x) MIN 30.0cm (y) MIN 30.0cm (z) MIN
No aperture X = -7.62cm (outboard face)
Lead SR-FE-3PW-4015
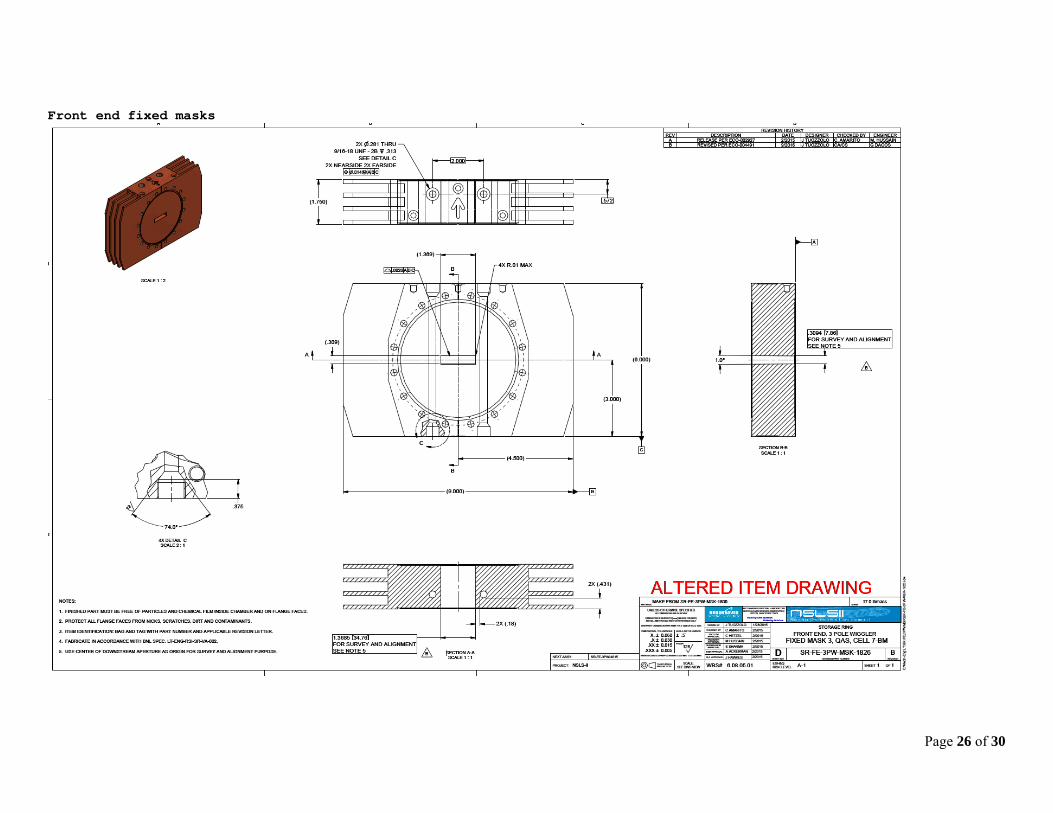
FM3 1578.4cm (DS)
22.86cm (x) 15.24cm (y) 4.445cm(z)
DS: 3.776cm (x)MAX DS: 1.086cm (y)MAX Vert angle = 1 deg US: 1.159cm (y)MAX
+2.21cm (y) Cu-Cr-Zr SR-FE-3PW-MSK-1826
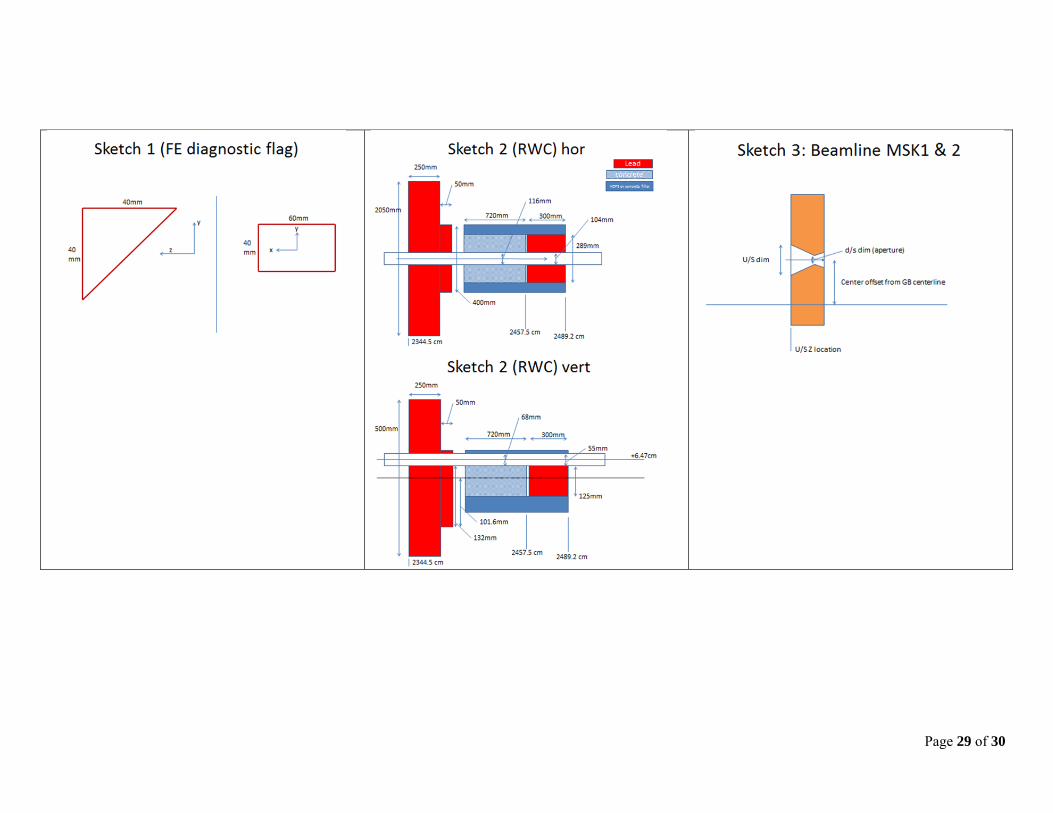
Diagnostic flag (sketch)
2038.4cm (C) 6cm (x) 4cm (y) 4cm (z)
No aperture Centered on beam when in
Cu PD-COM-DG-0100
Photon Shutter 2113.7cm (C) 15.24cm (x) 15.88cm (y) 3.175cm (z)
DS & US (No Taper) 5.334cm (x) 1.524cm (y)
(aperture offset to part C/L, y = -2.50
cm)
Y=5.10cm to SR Beam Ht when open
Cu-Cr-Zr SR-FE-3PW-PSH-0111
FM4 2145.3cm (DS)
22.86cm (x) 15.24cm (y) 4.445cm(z)
DS: 4.916cm (x)MAX DS: 1.261cm (y)MAX Vert angle = 1 deg US: 1.334cm (y)MAX
+5.27cm (y) Cu-Cr-Zr SR-FE-3PW-MSK-1827
LCO2 2149.9cm (US)
51.25cm (x) MIN 12.5cm (y) MIN 30.0cm (z) MIN
Lead Aperture 6.349cm (x) MAX 3.252cm (y) MAX
+5.27cm (y) Lead SR-FE-3PW-CO-0450
Safety Shutter1 2214.6cm (US)
17.5cm (x) MIN 17.5cm (y) MIN 30.0cm (z) MIN
Tube Aperture 9.4 cm (x) 3.4 cm (y)
Y=+5.62cm when open
Lead SR-FE-3PW-SS-4000
Safety Shutter2 2278.6cm (US)
17.5cm (x) MIN 17.5cm (y) MIN 30.0cm (z) MIN
Tube Aperture 9.4 cm (x) 3.4 cm (y)
Y=+5.96cm when open
Lead SR-FE-3PW-SS-4100
Lead in Ratchet wall RC0 (sketch)
2344.5cm (US)
205.0 cm (x) MIN 50.0 cm (y) MIN 25.0 cm (z) MIN
Lead Aperture 11.6 cm (x) MAX 6.8 cm (y) MAX
+6.47cm (y) Tube
centerline
Lead SR-FE-3PW-RCO-4000
Lead block RC1 (sketch)
2369.9cm (US)
40.0 cm (x) MIN 20.0 cm (y) MIN
Lead Aperture 11.6 cm (x) MAX
+6.47cm (y) Tube
Lead SR-FE-3PW-RCO-4000
Page 24 of 30
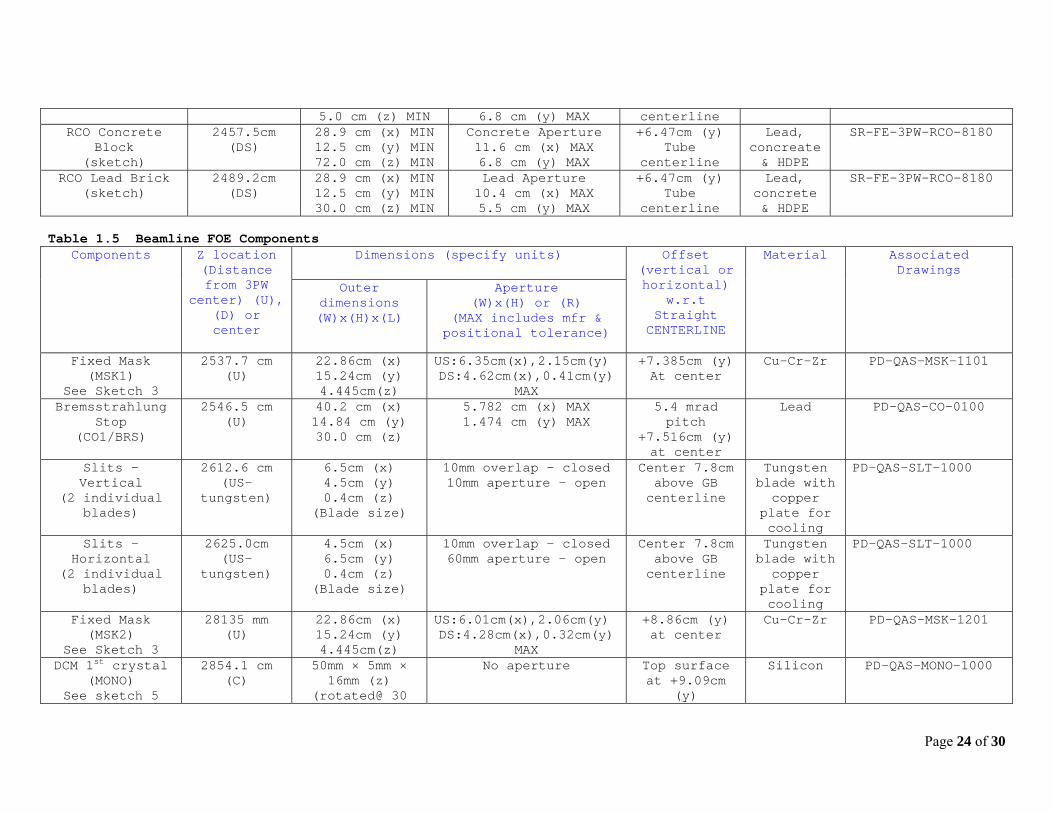
5.0 cm (z) MIN 6.8 cm (y) MAX centerline RCO Concrete
Block (sketch)
2457.5cm (DS)
28.9 cm (x) MIN 12.5 cm (y) MIN 72.0 cm (z) MIN
Concrete Aperture 11.6 cm (x) MAX 6.8 cm (y) MAX
+6.47cm (y) Tube
centerline
Lead, concreate & HDPE
SR-FE-3PW-RCO-8180
RCO Lead Brick (sketch)
2489.2cm (DS)
28.9 cm (x) MIN 12.5 cm (y) MIN 30.0 cm (z) MIN
Lead Aperture 10.4 cm (x) MAX 5.5 cm (y) MAX
+6.47cm (y) Tube
centerline
Lead, concrete & HDPE
SR-FE-3PW-RCO-8180
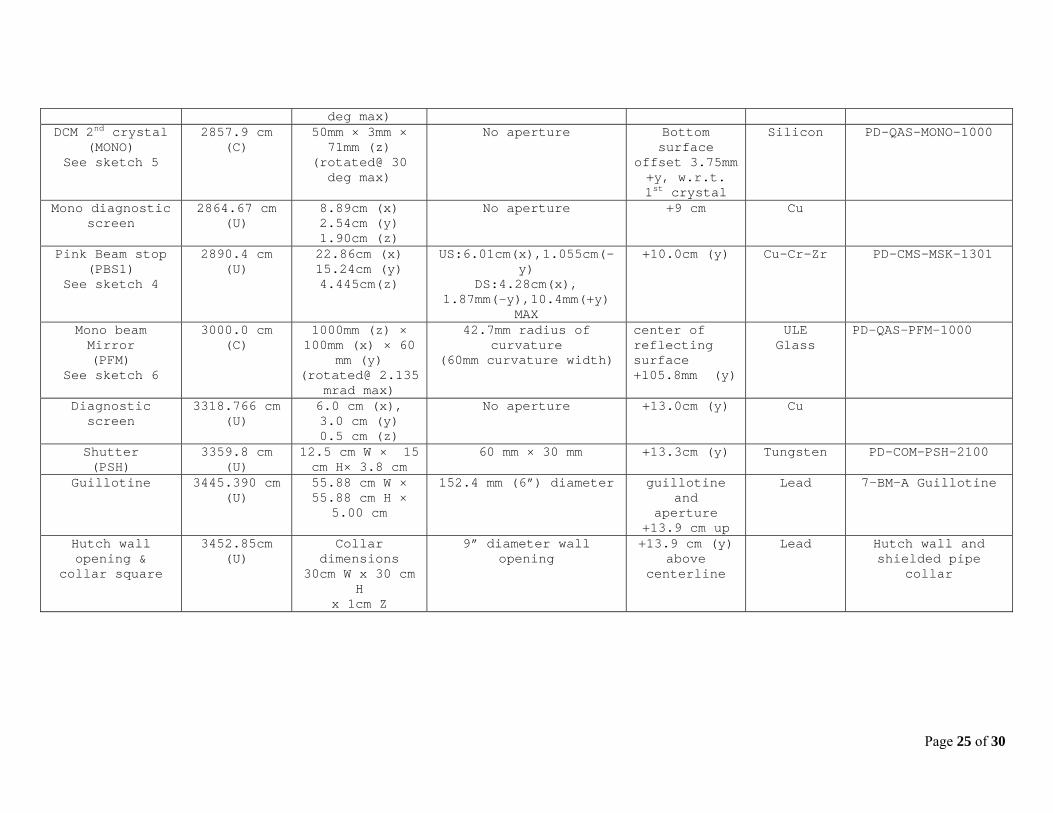
Table 1.5 Beamline FOE Components
Components Z location (Distance from 3PW
center) (U), (D) or center
Dimensions (specify units) Offset (vertical or horizontal)
w.r.t Straight CENTERLINE
Material Associated Drawings
Outer dimensions (W)x(H)x(L)
Aperture (W)x(H) or (R)
(MAX includes mfr & positional tolerance)
Fixed Mask (MSK1)
See Sketch 3
2537.7 cm (U)
22.86cm (x) 15.24cm (y) 4.445cm(z)
US:6.35cm(x),2.15cm(y) DS:4.62cm(x),0.41cm(y)
MAX
+7.385cm (y) At center
Cu-Cr-Zr PD-QAS-MSK-1101
Bremsstrahlung Stop
(CO1/BRS)
2546.5 cm (U)
40.2 cm (x) 14.84 cm (y) 30.0 cm (z)
5.782 cm (x) MAX 1.474 cm (y) MAX
5.4 mrad pitch
+7.516cm (y)at center
Lead PD-QAS-CO-0100
Slits – Vertical
(2 individual blades)
2612.6 cm (US-
tungsten)
6.5cm (x) 4.5cm (y) 0.4cm (z)
(Blade size)
10mm overlap – closed 10mm aperture – open
Center 7.8cm above GB centerline
Tungsten blade with copper
plate for cooling
PD-QAS-SLT-1000
Slits – Horizontal
(2 individual blades)
2625.0cm (US-
tungsten)
4.5cm (x) 6.5cm (y) 0.4cm (z)
(Blade size)
10mm overlap – closed 60mm aperture - open
Center 7.8cm above GB centerline
Tungsten blade with copper
plate for cooling
PD-QAS-SLT-1000
Fixed Mask (MSK2)
See Sketch 3
28135 mm (U)
22.86cm (x) 15.24cm (y) 4.445cm(z)
US:6.01cm(x),2.06cm(y) DS:4.28cm(x),0.32cm(y)
MAX
+8.86cm (y) at center
Cu-Cr-Zr PD-QAS-MSK-1201
DCM 1st crystal (MONO)
See sketch 5
2854.1 cm (C)
50mm × 5mm × 16mm (z)
(rotated@ 30
No aperture Top surface at +9.09cm
(y)
Silicon PD-QAS-MONO-1000
Page 25 of 30
deg max) DCM 2nd crystal
(MONO) See sketch 5
2857.9 cm (C)
50mm × 3mm × 71mm (z)
(rotated@ 30 deg max)
No aperture Bottom surface
offset 3.75mm +y, w.r.t. 1st crystal
Silicon PD-QAS-MONO-1000
Mono diagnostic screen
2864.67 cm (U)
8.89cm (x) 2.54cm (y) 1.90cm (z)
No aperture +9 cm Cu
Pink Beam stop (PBS1)
See sketch 4
2890.4 cm (U)
22.86cm (x) 15.24cm (y) 4.445cm(z)
US:6.01cm(x),1.055cm(-y)
DS:4.28cm(x), 1.87mm(-y),10.4mm(+y)
MAX
+10.0cm (y) Cu-Cr-Zr PD-CMS-MSK-1301
Mono beam Mirror (PFM)
See sketch 6
3000.0 cm (C)
1000mm (z) × 100mm (x) × 60
mm (y) (rotated@ 2.135
mrad max)
42.7mm radius of curvature
(60mm curvature width)
center of reflecting surface +105.8mm (y)
ULE Glass
PD-QAS-PFM-1000
Diagnostic screen
3318.766 cm (U)
6.0 cm (x), 3.0 cm (y) 0.5 cm (z)
No aperture +13.0cm (y) Cu
Shutter (PSH)
3359.8 cm (U)
12.5 cm W × 15 cm H× 3.8 cm
60 mm × 30 mm +13.3cm (y) Tungsten PD-COM-PSH-2100
Guillotine 3445.390 cm (U)
55.88 cm W × 55.88 cm H ×
5.00 cm
152.4 mm (6”) diameter guillotine and
aperture +13.9 cm up
Lead 7-BM-A Guillotine
Hutch wall opening &
collar square
3452.85cm (U)
Collar dimensions
30cm W x 30 cm H
x 1cm Z
9” diameter wall opening
+13.9 cm (y) above
centerline
Lead Hutch wall and shielded pipe
collar
Page 26 of 30
Front end fixed masks

Page 27 of 30
Ratchet wall collimator

Page 28 of 30
Front end photon shutter design
Front end slits
Page 29 of 30

Page 30 of 30


![Welcome [] · 2012. 8. 6. · National Synchrotron Light Source II (NSLS-II) at Eric Dooryhee is leading the Powder Diffraction Beamline group at NSLS-II. His science focus areas](https://img.pdfslide.net/doc/110x75/611d2455e5335a6f7c0adeae/welcome-2012-8-6-national-synchrotron-light-source-ii-nsls-ii-at-eric.jpg)