Embed Size (px)
Citation preview
8/7/2019 07-cluster analysis
http://slidepdf.com/reader/full/07-cluster-analysis 1/60
8/7/2019 07-cluster analysis
http://slidepdf.com/reader/full/07-cluster-analysis 2/60
February 24, 2011 Data Mining: Concepts and Techniques 2
Chapter 7. Cluster Analysis1. What is Cluster Analysis?
2. Types of Data in Cluster Analysis
3. A Categorization of Major Clustering Methods
4. Partitioning Methods
5. Hierarchical Methods
6. Density-Based Methods
7. Grid-Based Methods
8. Model-Based Methods
9. Clustering High-Dimensional Data
10. Constraint-Based Clustering
11. Outlier Analysis
12. Summary
8/7/2019 07-cluster analysis
http://slidepdf.com/reader/full/07-cluster-analysis 3/60
February 24, 2011 Data Mining: Concepts and Techniques 3
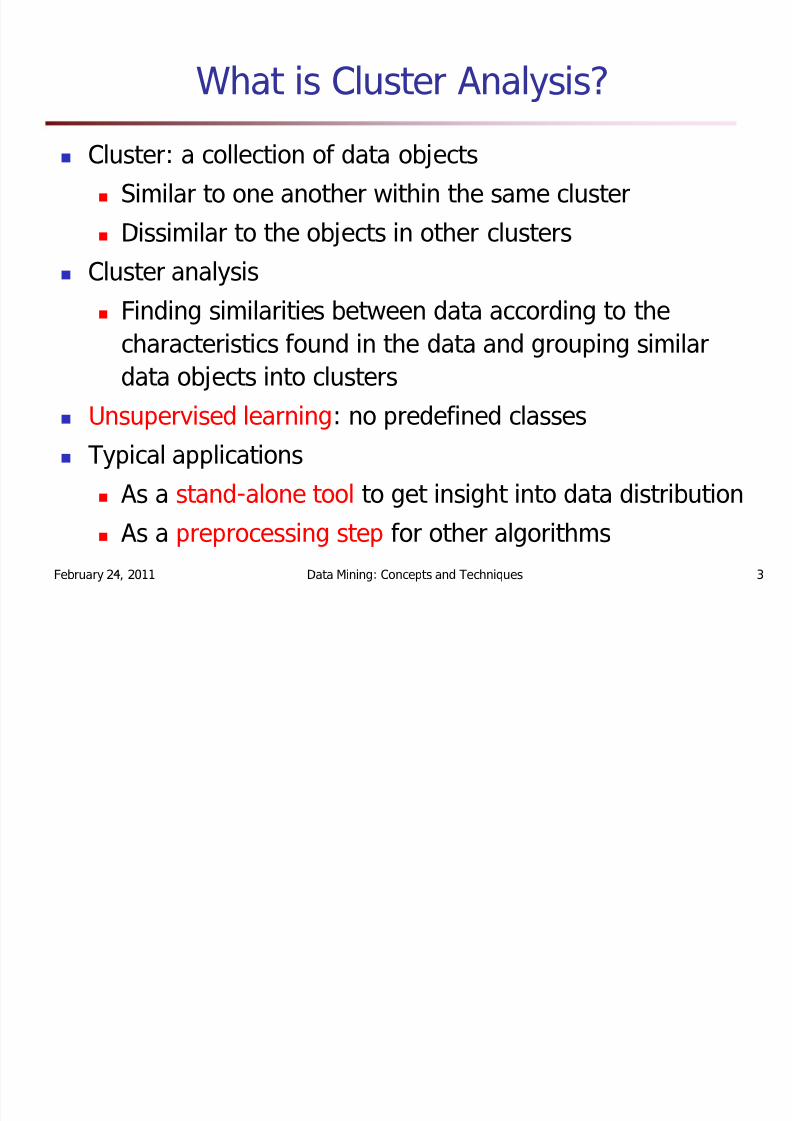
What is Cluster Analysis?
Cluster: a collection of data objectsSimilar to one another within the same clusterDissimilar to the objects in other clusters
Cluster analysisFinding similarities between data according to thecharacteristics found in the data and grouping similardata objects into clusters
Unsupervised learning : no predefined classesTypical applications
As a stand-alone tool to get insight into data distributionAs a preprocessing step for other algorithms
8/7/2019 07-cluster analysis
http://slidepdf.com/reader/full/07-cluster-analysis 4/60
February 24, 2011 Data Mining: Concepts and Techniques 4
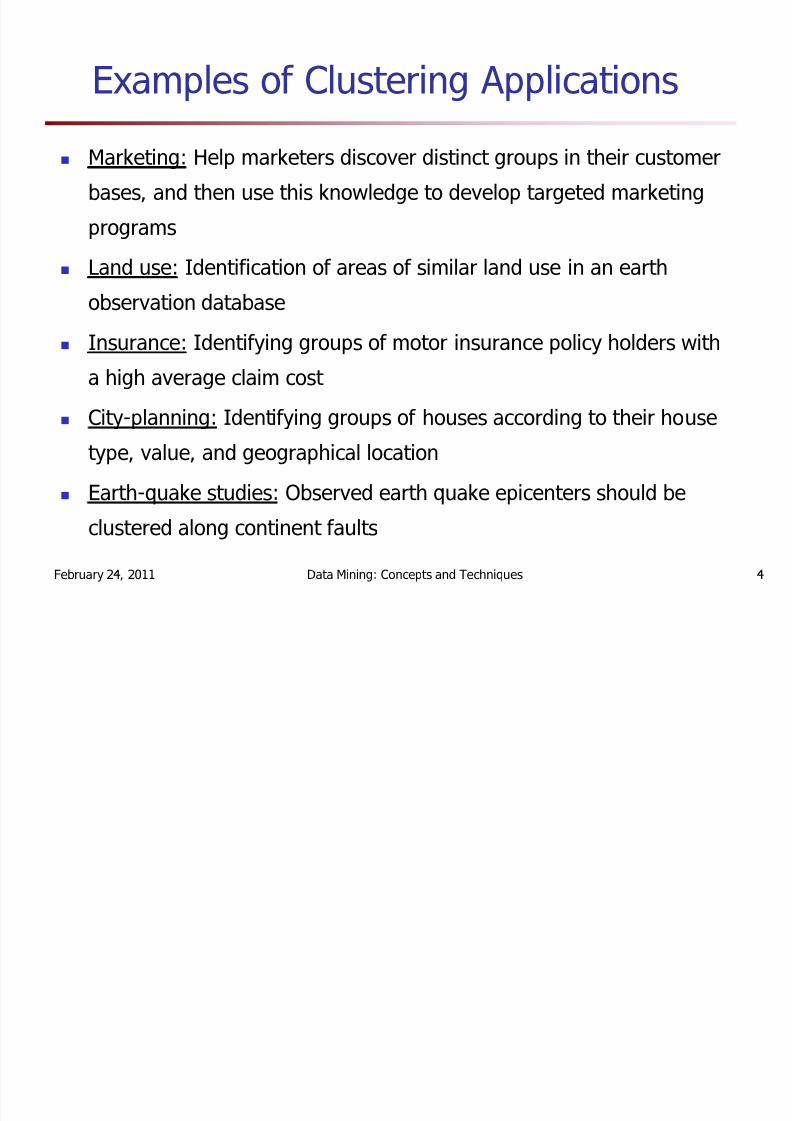
Examples of Clustering Applications
Marketing: Help marketers discover distinct groups in their customer
bases, and then use this knowledge to develop targeted marketing
programs
Land use: Identification of areas of similar land use in an earthobservation database
Insurance: Identifying groups of motor insurance policy holders with
a high average claim cost
City-planning: Identifying groups of houses according to their housetype, value, and geographical location
Earth-quake studies: Observed earth quake epicenters should be
clustered along continent faults
8/7/2019 07-cluster analysis
http://slidepdf.com/reader/full/07-cluster-analysis 5/60
February 24, 2011 Data Mining: Concepts and Techniques 5
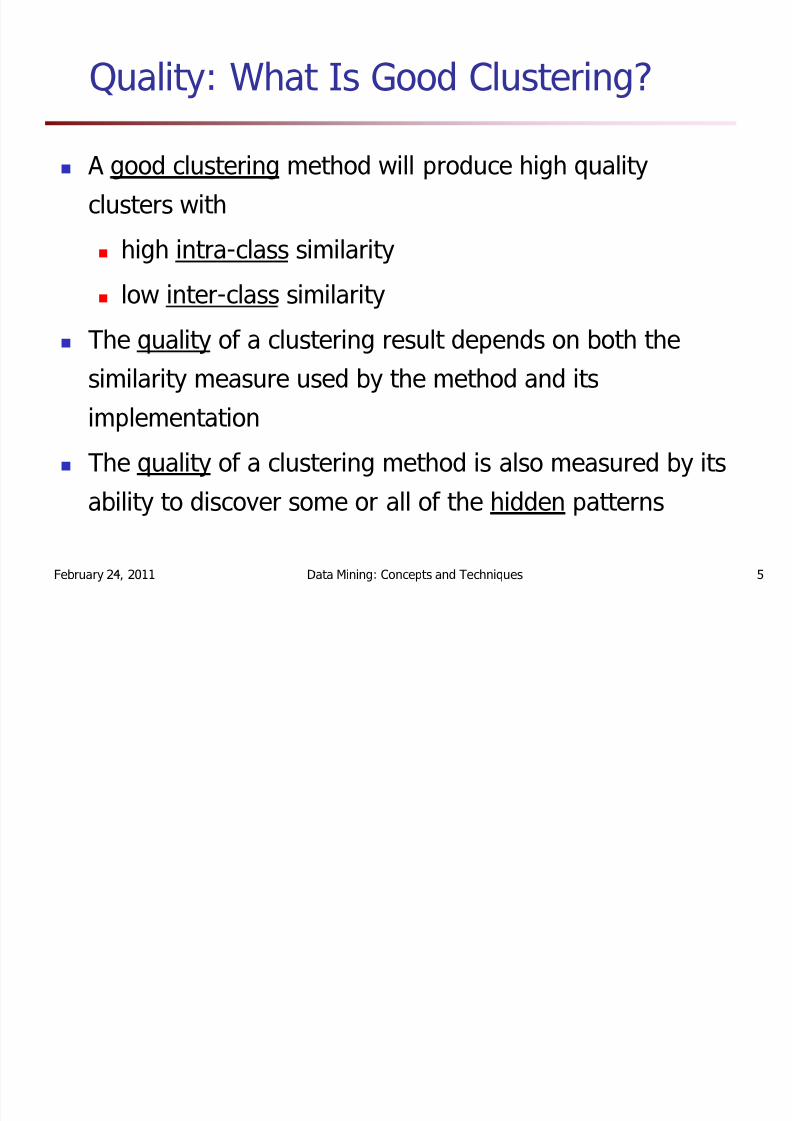
Quality: What Is Good Clustering?
A good clustering method will produce high qualityclusters with
high intra-class similarity
low inter-class similarity
The quality of a clustering result depends on both thesimilarity measure used by the method and its
implementationThe quality of a clustering method is also measured by itsability to discover some or all of the hidden patterns
8/7/2019 07-cluster analysis
http://slidepdf.com/reader/full/07-cluster-analysis 6/60
February 24, 2011 Data Mining: Concepts and Techniques 6
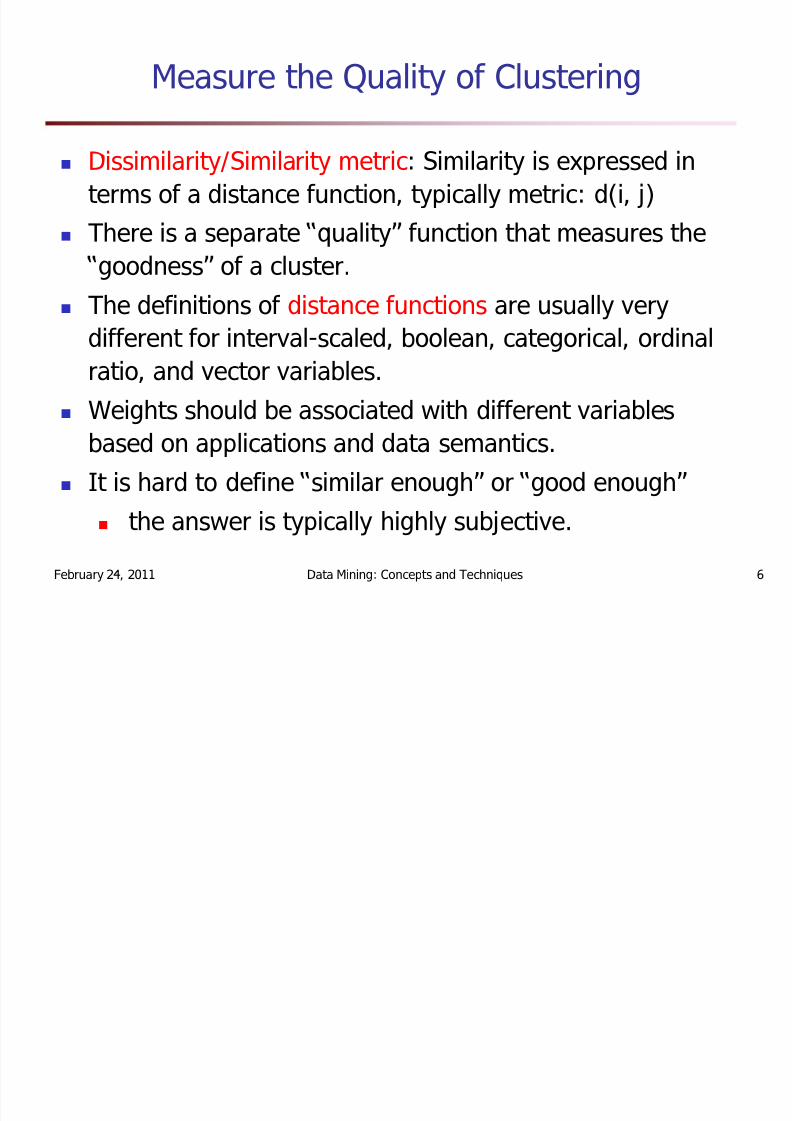
Measure the Quality of Clustering
Dissimilarity/Similarity metric : Similarity is expressed interms of a distance function, typically metric: d(i, j)There is a separate quality function that measures the
goodness of a cluster.The definitions of distance functions are usually verydifferent for interval-scaled, boolean, categorical, ordinalratio, and vector variables.
Weights should be associated with different variablesbased on applications and data semantics.It is hard to define similar enough or good enough
the answer is typically highly subjective.
8/7/2019 07-cluster analysis
http://slidepdf.com/reader/full/07-cluster-analysis 7/60
February 24, 2011 Data Mining: Concepts and Techniques 7
Requirements of Clustering in Data Mining
ScalabilityAbility to deal with different types of attributesAbility to handle dynamic data
Discovery of clusters with arbitrary shapeMinimal requirements for domain knowledge todetermine input parametersAble to deal with noise and outliers
Insensitive to order of input recordsHigh dimensionalityIncorporation of user-specified constraintsInterpretability and usability
8/7/2019 07-cluster analysis
http://slidepdf.com/reader/full/07-cluster-analysis 8/60
February 24, 2011 Data Mining: Concepts and Techniques 8
Chapter 7. Cluster Analysis
1. What is Cluster Analysis?
2. Types of Data in Cluster Analysis
3. A Categorization of Major Clustering Methods
4. Partitioning Methods
5. Hierarchical Methods
6. Density-Based Methods
7. Grid-Based Methods
8. Model-Based Methods
9. Clustering High-Dimensional Data
10. Constraint-Based Clustering
11. Outlier Analysis
12. Summary
8/7/2019 07-cluster analysis
http://slidepdf.com/reader/full/07-cluster-analysis 9/60
February 24, 2011 Data Mining: Concepts and Techniques 9
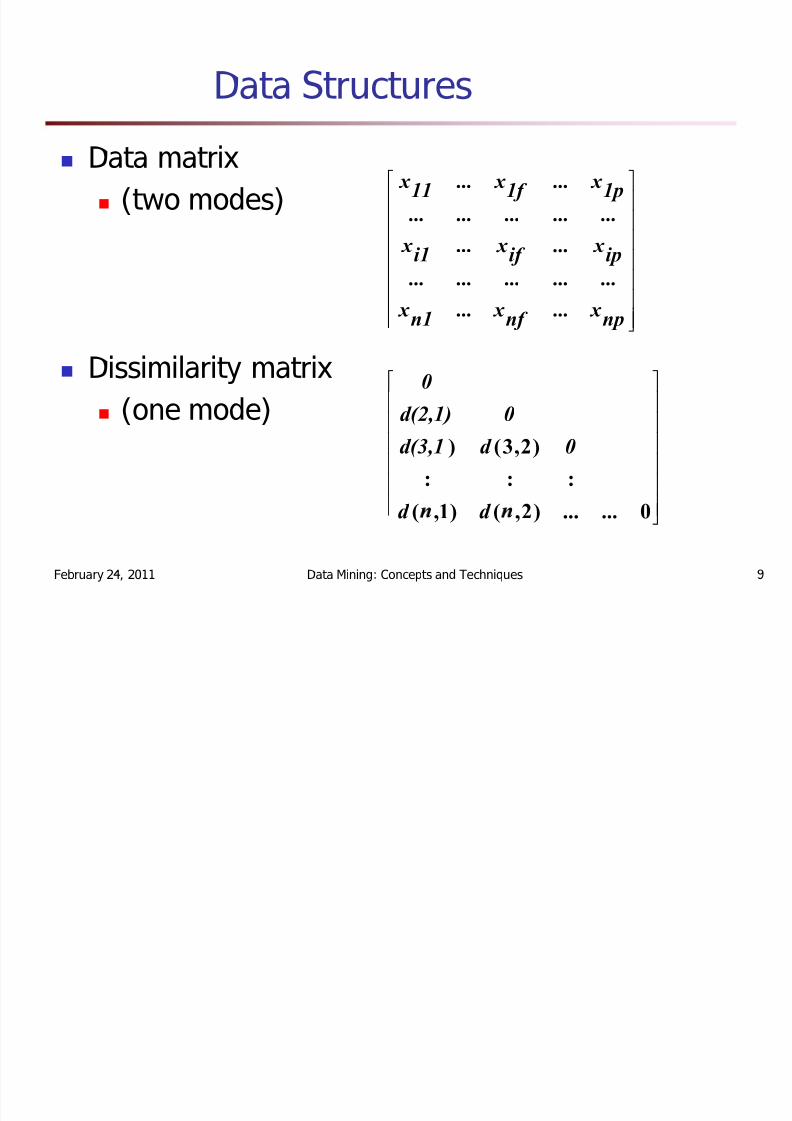
Data Structures
Data matrix(two modes)
Dissimilarity matrix
(one mode)
¼¼¼¼¼¼¼
½
»
¬¬¬¬¬¬¬«
npx ...nf x ...n1x ...............
ipx ...if x ...i1x
...............1px ...1f x ...11x
¼¼¼¼¼¼
½
»
¬¬¬¬¬¬«
0...)2,()1,(
:::
)2,3()
...d d
0d d(3,10d(2,1)
0
8/7/2019 07-cluster analysis
http://slidepdf.com/reader/full/07-cluster-analysis 10/60
February 24, 2011 Data Mining: Concepts and Techniques 10
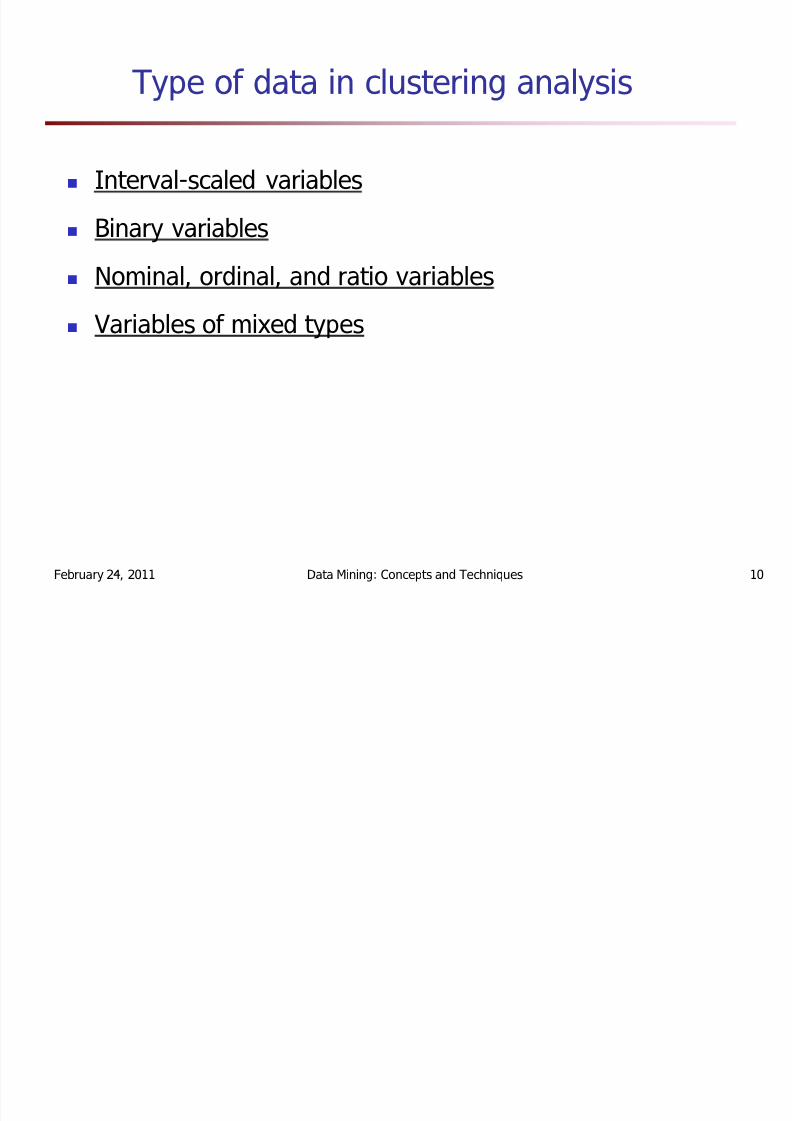
Type of data in clustering analysis
Interval-scaled variables
Binary variables
Nominal, ordinal, and ratio variablesVariables of mixed types
8/7/2019 07-cluster analysis
http://slidepdf.com/reader/full/07-cluster-analysis 11/60
February 24, 2011 Data Mining: Concepts and Techniques 11
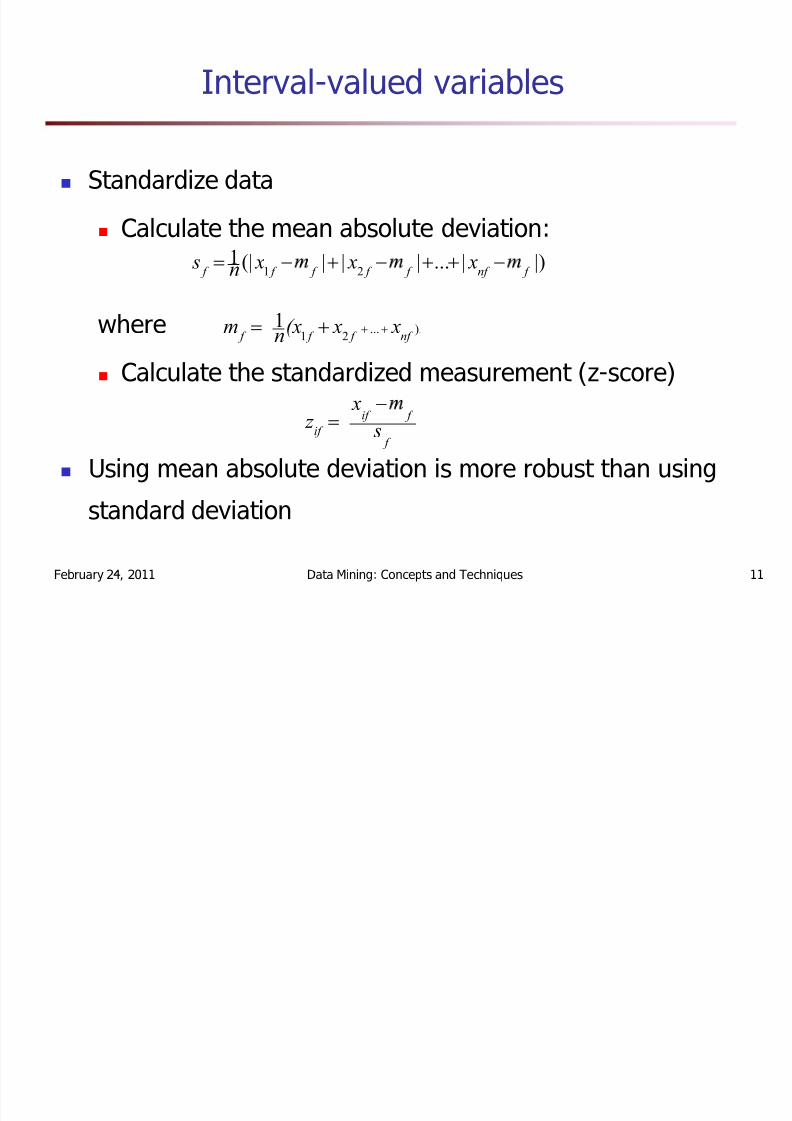
Interval-valued variables
Standardize data
Calculate the mean absolute deviation:
where
Calculate the standardized measurement (z-score)
Using mean absolute deviation is more robust than using
standard deviation
.)...211
nf f f f xx(xn m !
|)|...|||(|121 f nf f f f f f
xxxn
s !
f
f if if s
x z !
8/7/2019 07-cluster analysis
http://slidepdf.com/reader/full/07-cluster-analysis 12/60
February 24, 2011 Data Mining: Concepts and Techniques 12
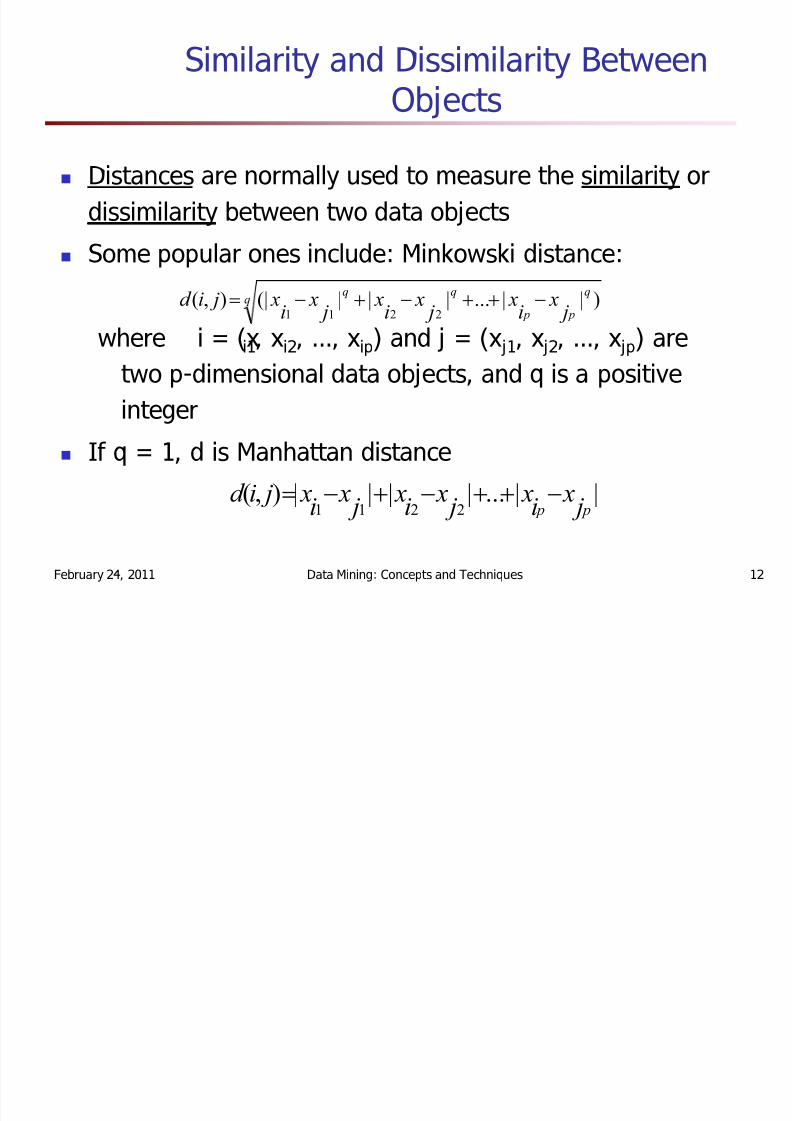
Similarity and Dissimilarity BetweenObjects
Distances are normally used to measure the similarity ordissimilarity between two data objects
Some popular ones include: Minkowski distance:
where i = (x i1, x i2, , x ip) and j = (x j1, x j2, , x jp) aretwo p-dimensional data objects, and q is a positive
integerIf q = 1, d is Manhattan distance
pp
jx
ix
jx
ix
jx
ixjid )||...|||(|),(
2211!
||...||||),(2211 pp jxixjxixjxixjid !
8/7/2019 07-cluster analysis
http://slidepdf.com/reader/full/07-cluster-analysis 13/60
February 24, 2011 Data Mining: Concepts and Techniques 13
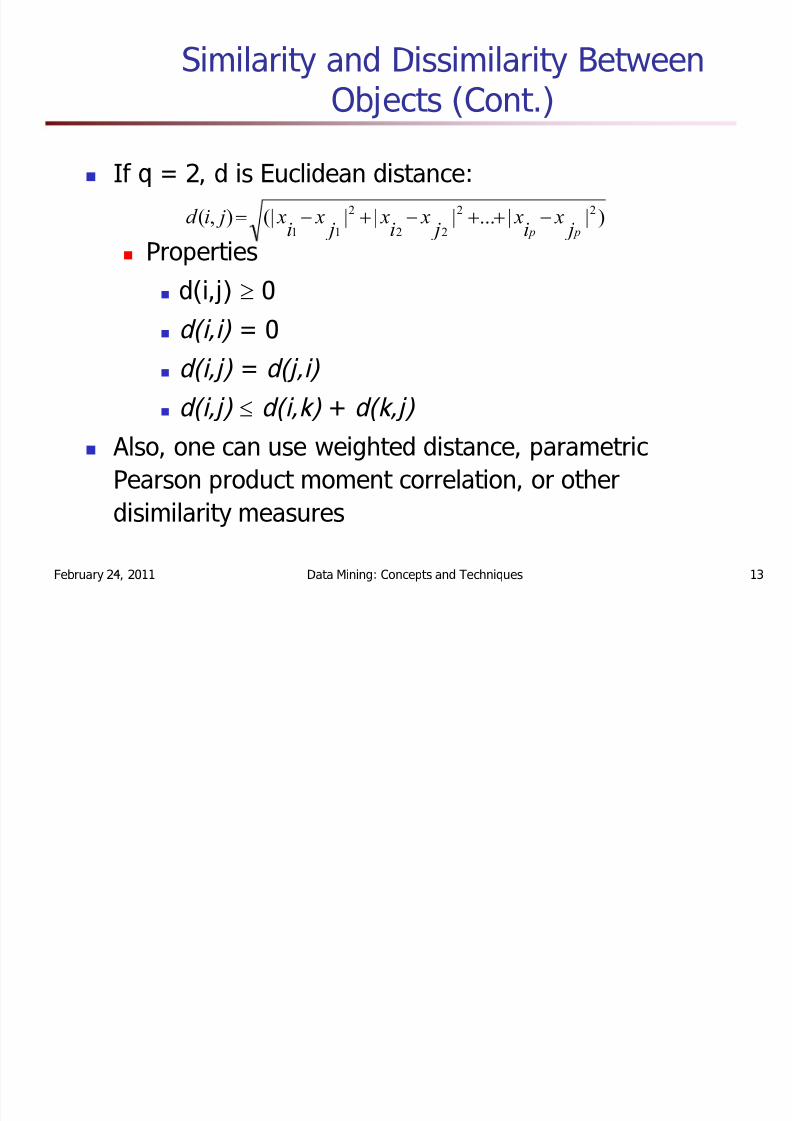
Similarity and Dissimilarity BetweenObjects (Cont.)
If q = 2, d is Euclidean distance:
Propertiesd(i,j) u 0d(i,i) = 0d(i,j) = d(j,i)
d(i,j) e d(i,k) + d(k,j) Also, one can use weighted distance, parametricPearson product moment correlation, or otherdisimilarity measures
)||...|||(|),( 22
22
2
11 pp jx
ix
jx
ix
jx
ixjid !
8/7/2019 07-cluster analysis
http://slidepdf.com/reader/full/07-cluster-analysis 14/60
February 24, 2011 Data Mining: Concepts and Techniques 14
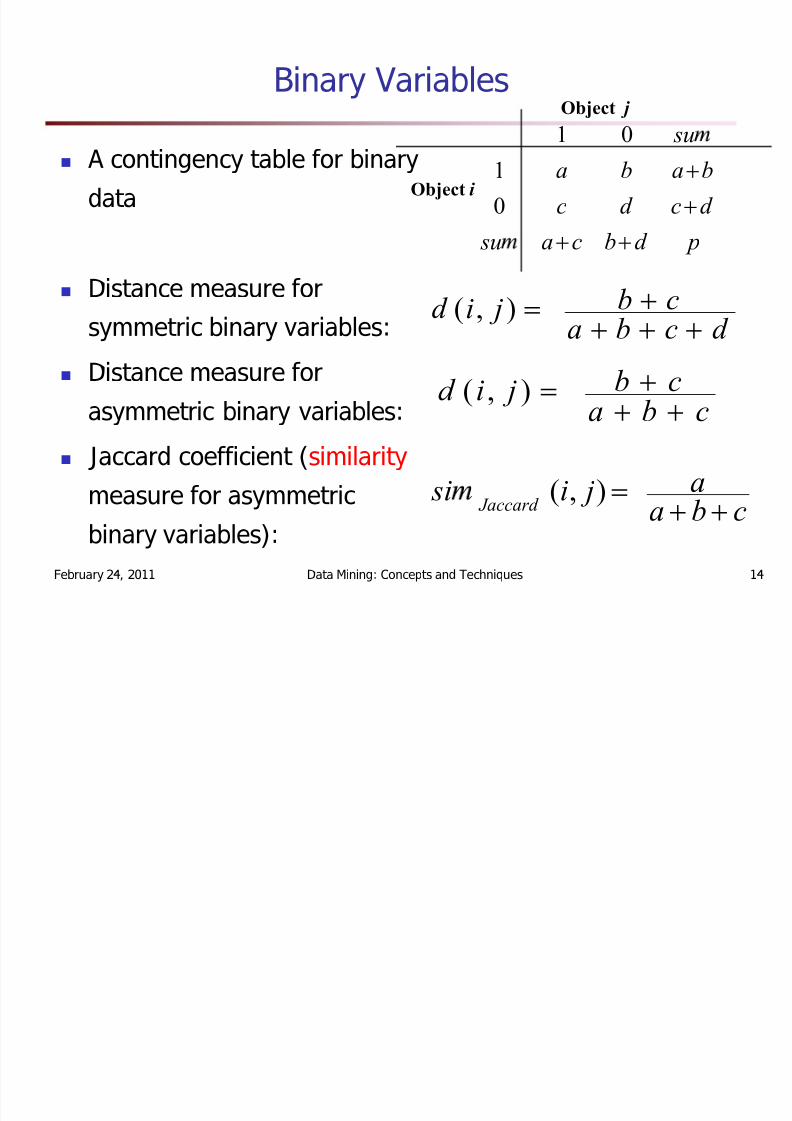
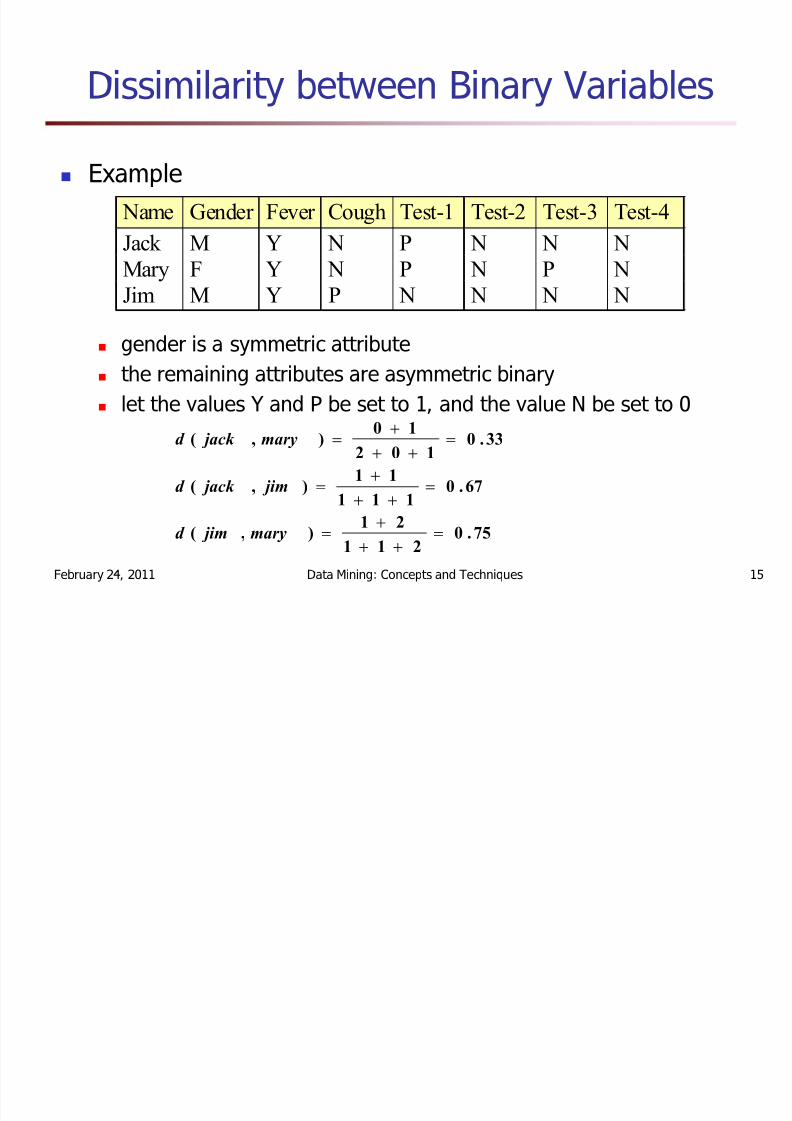
Binary Variables
A contingency table for binarydata
Distance measure forsymmetric binary variables:
Distance measure for
asymmetric binary variables:Jaccard coefficient ( similaritymeasure for asymmetricbinary variables):
d cbacb jid !),(
cba
cb jid !),(
pd bcasu
d cd c
babasu
0
101
Object i
Object j
cbaa jisi J accard
!),(
8/7/2019 07-cluster analysis
http://slidepdf.com/reader/full/07-cluster-analysis 15/60
8/7/2019 07-cluster analysis
http://slidepdf.com/reader/full/07-cluster-analysis 16/60
February 24, 2011 Data Mining: Concepts and Techniques 16
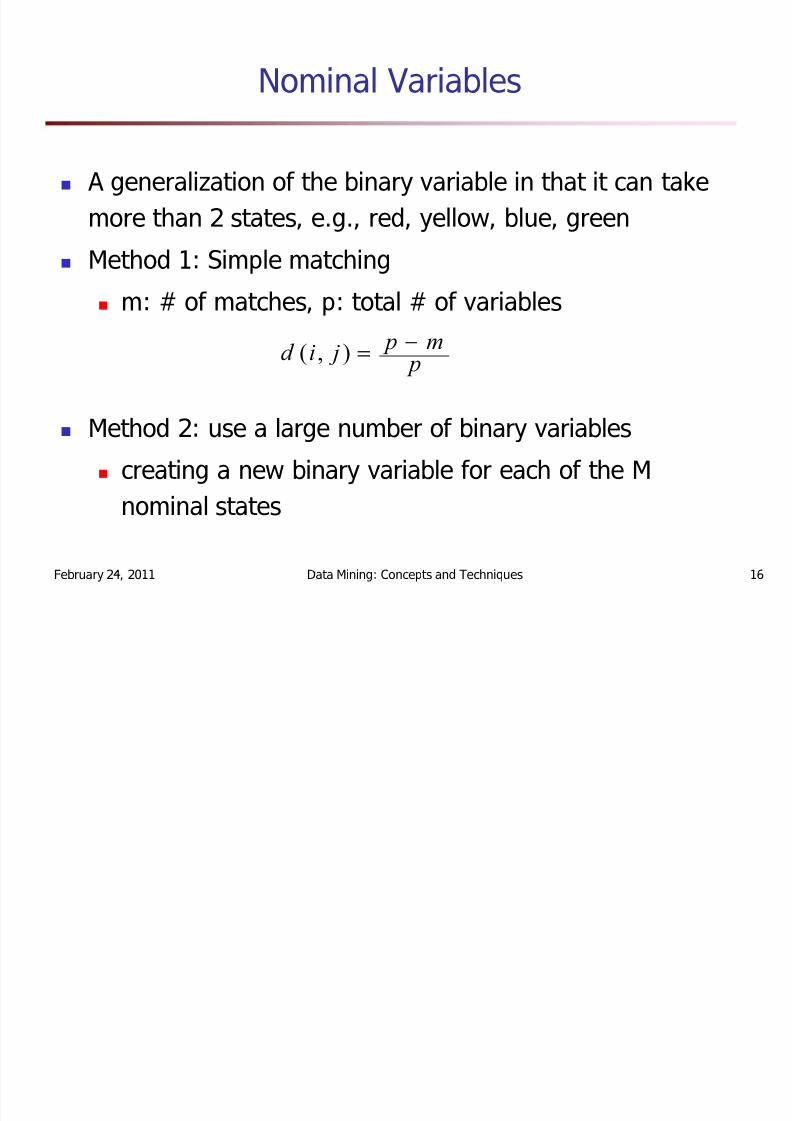
Nominal Variables
A generalization of the binary variable in that it can takemore than 2 states, e.g., red, yellow, blue, green
Method 1: Simple matching
m: # of matches, p: total # of variables
Method 2: use a large number of binary variables
creating a new binary variable for each of the Mnominal states
pmpjid !),(
8/7/2019 07-cluster analysis
http://slidepdf.com/reader/full/07-cluster-analysis 17/60
February 24, 2011 Data Mining: Concepts and Techniques 17
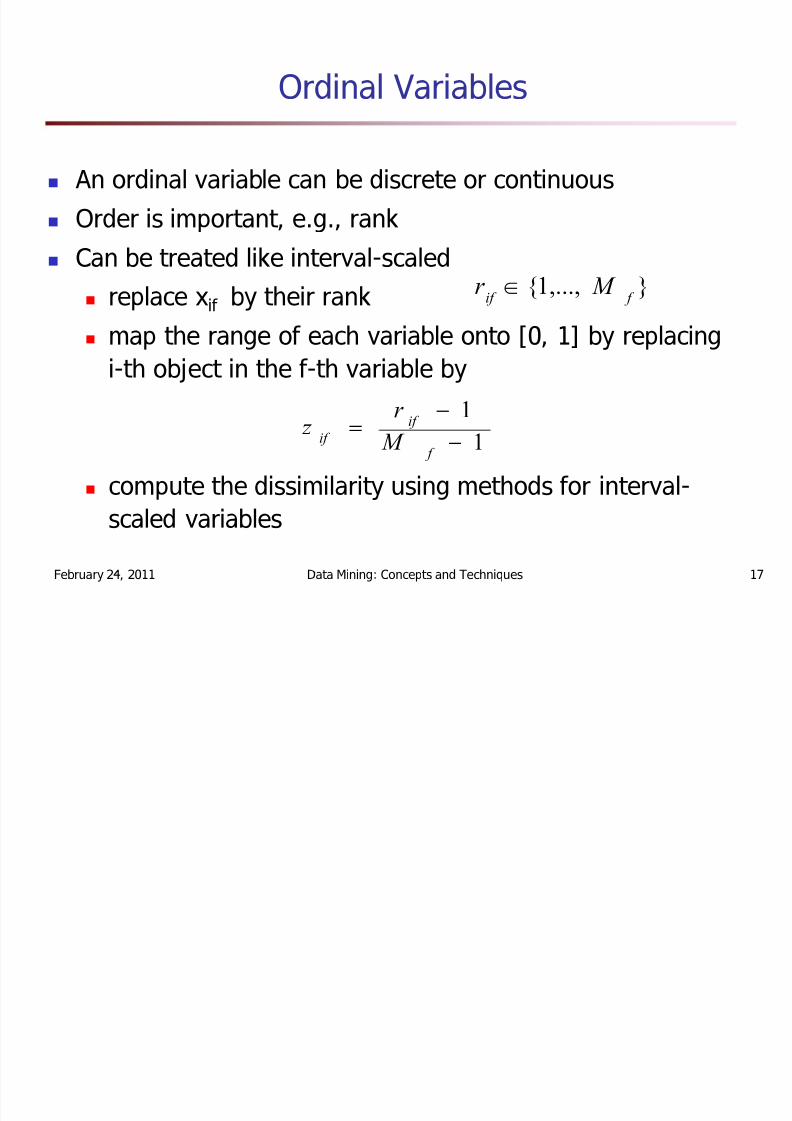
Ordinal Variables
An ordinal variable can be discrete or continuousOrder is important, e.g., rankCan be treated like interval-scaled
replace x if by their rankmap the range of each variable onto [0, 1] by replacingi-th object in the f-th variable by
compute the dissimilarity using methods for interval-scaled variables
11!
f
if if M
r z
},...,1{ f if M r
8/7/2019 07-cluster analysis
http://slidepdf.com/reader/full/07-cluster-analysis 18/60
February 24, 2011 Data Mining: Concepts and Techniques 18
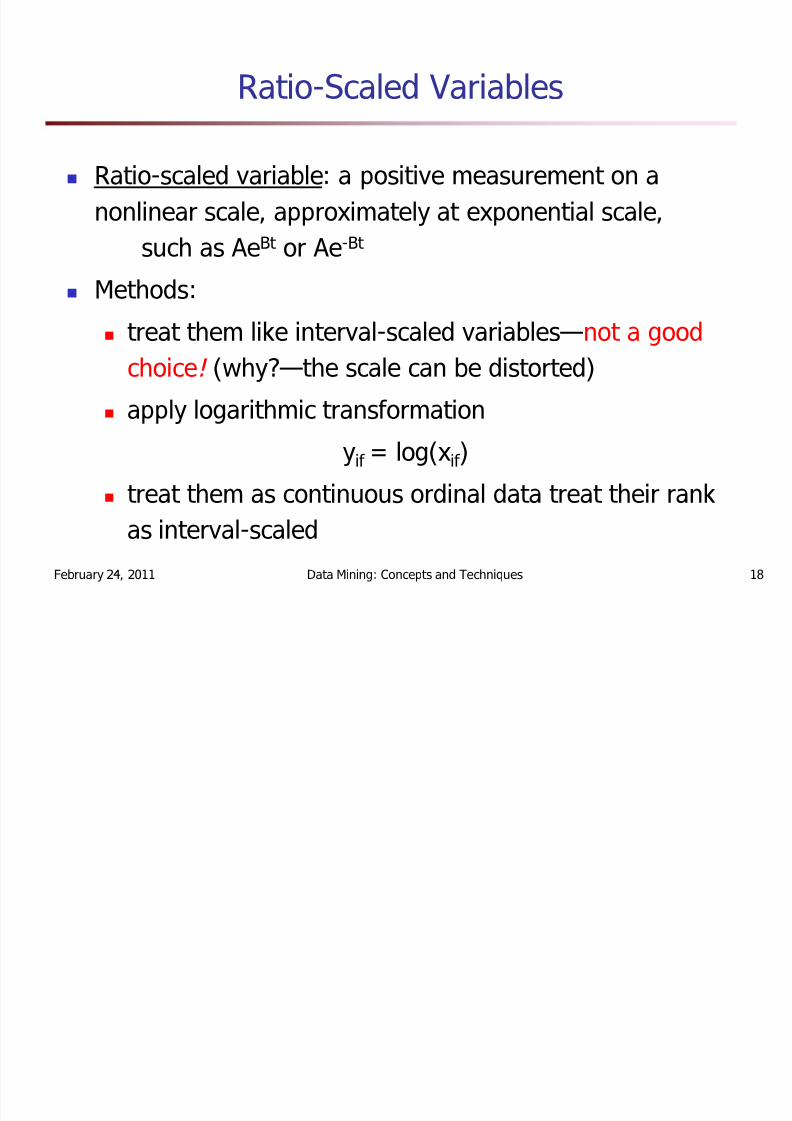
Ratio-Scaled Variables
Ratio-scaled variable: a positive measurement on anonlinear scale, approximately at exponential scale,
such as Ae Bt or Ae -Bt
Methods:
treat them like interval-scaled variables not a goodchoice! (why? the scale can be distorted)
apply logarithmic transformationyif = log(x if )
treat them as continuous ordinal data treat their rankas interval-scaled
8/7/2019 07-cluster analysis
http://slidepdf.com/reader/full/07-cluster-analysis 19/60
February 24, 2011 Data Mining: Concepts and Techniques 19
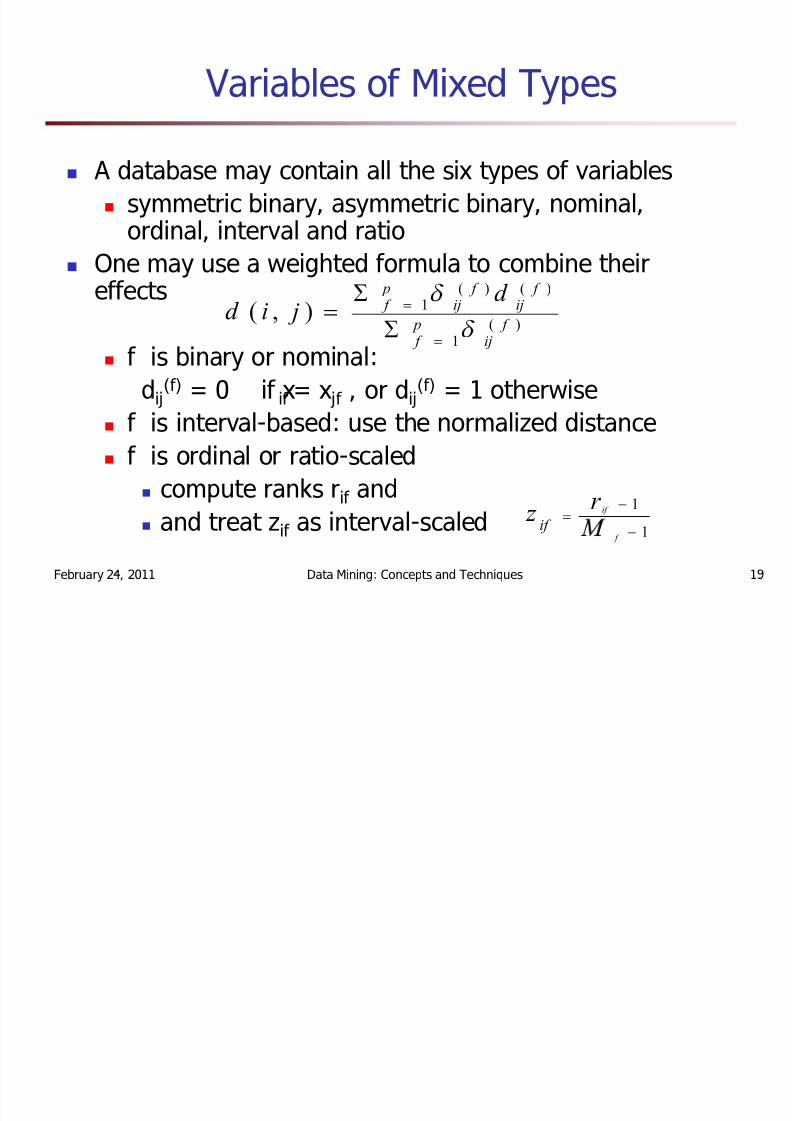
Variables of Mixed Types
A database may contain all the six types of variablessymmetric binary, asymmetric binary, nominal,ordinal, interval and ratio
One may use a weighted formula to combine theireffects
f is binary or nominal:d ij
(f) = 0 if x if = x jf , or d ij(f) = 1 otherwise
f is interval-based: use the normalized distancef is ordinal or ratio-scaled
compute ranks r if andand treat z if as interval-scaled
)(1
)()(1),(
f ij
pf
f ij
f ij
pf
d jid
H
H
!
!
7
7!
1
1!
f
if r
z if
8/7/2019 07-cluster analysis
http://slidepdf.com/reader/full/07-cluster-analysis 20/60
February 24, 2011 Data Mining: Concepts and Techniques 20
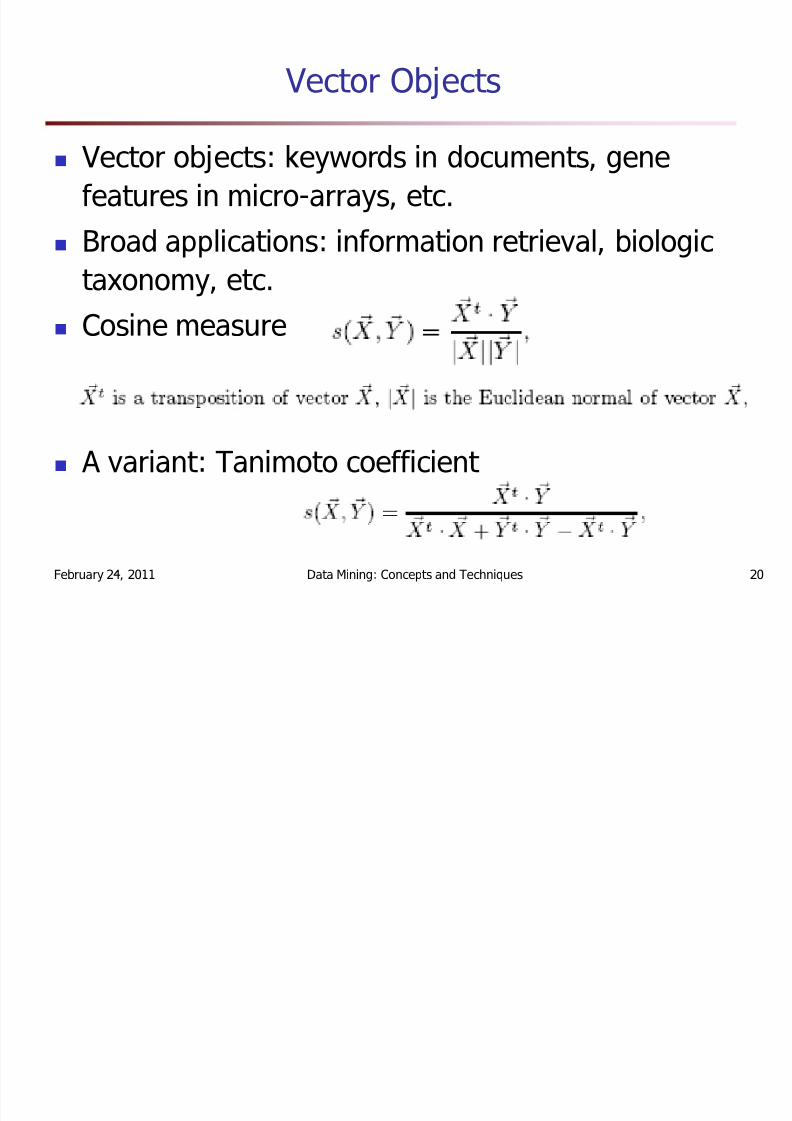
Vector Objects
Vector objects: keywords in documents, genefeatures in micro-arrays, etc.Broad applications: information retrieval, biologic
taxonomy, etc.Cosine measure
A variant: Tanimoto coefficient
8/7/2019 07-cluster analysis
http://slidepdf.com/reader/full/07-cluster-analysis 21/60
February 24, 2011 Data Mining: Concepts and Techniques 21
Chapter 7. Cluster Analysis
1. What is Cluster Analysis?
2. Types of Data in Cluster Analysis
3. A Categorization of Major Clustering Methods
4. Partitioning Methods
5. Hierarchical Methods
6. Density-Based Methods
7. Grid-Based Methods
8. Model-Based Methods
9. Clustering High-Dimensional Data
10. Constraint-Based Clustering
11. Outlier Analysis
12. Summary
8/7/2019 07-cluster analysis
http://slidepdf.com/reader/full/07-cluster-analysis 22/60
February 24, 2011 Data Mining: Concepts and Techniques 22
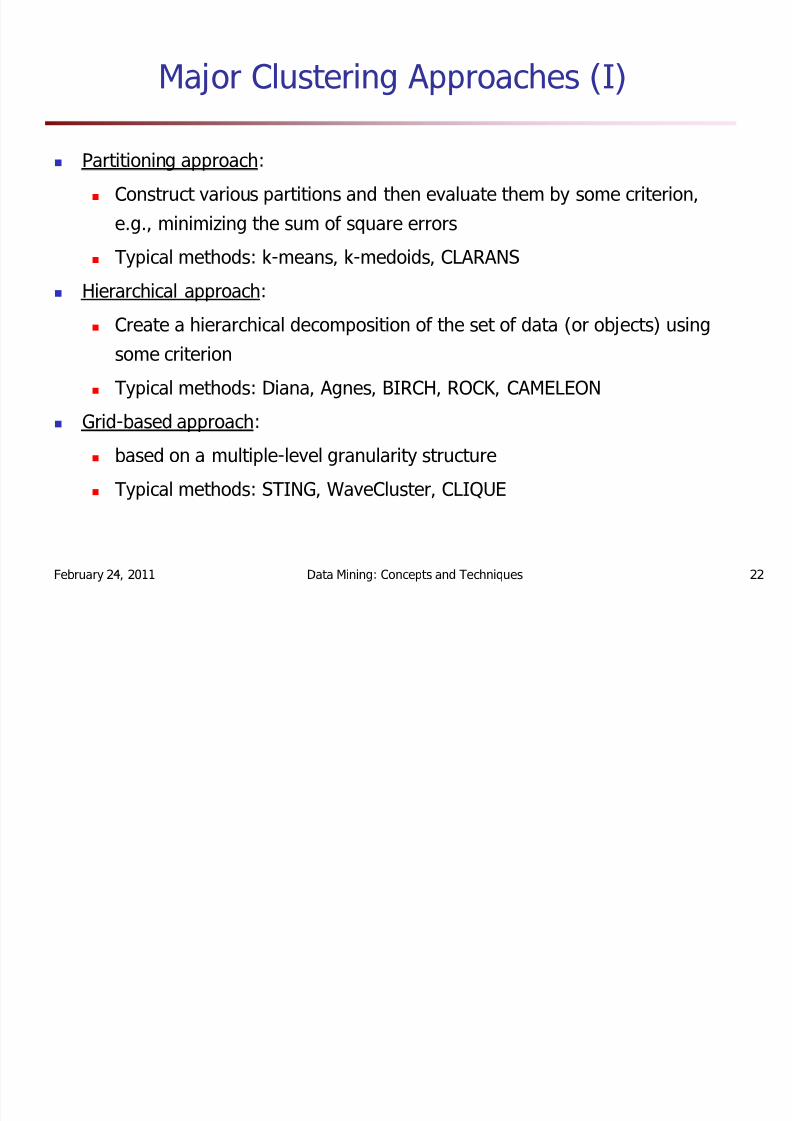
Major Clustering Approaches (I)
Partitioning approach:
Construct various partitions and then evaluate them by some criterion,e.g., minimizing the sum of square errors
Typical methods: k-means, k-medoids, CLARANS
Hierarchical approach:
Create a hierarchical decomposition of the set of data (or objects) usingsome criterion
Typical methods: Diana, Agnes, BIRCH, ROCK, CAMELEON
Grid-based approach:
based on a multiple-level granularity structure
Typical methods: STING, WaveCluster, CLIQUE
8/7/2019 07-cluster analysis
http://slidepdf.com/reader/full/07-cluster-analysis 23/60
February 24, 2011 Data Mining: Concepts and Techniques 23
Chapter 7. Cluster Analysis
1. What is Cluster Analysis?
2. Types of Data in Cluster Analysis
3. A Categorization of Major Clustering Methods
4. Partitioning Methods
5. Hierarchical Methods
6. Density-Based Methods
7. Grid-Based Methods
8. Model-Based Methods
9. Clustering High-Dimensional Data
10. Constraint-Based Clustering
11. Outlier Analysis
12. Summary
8/7/2019 07-cluster analysis
http://slidepdf.com/reader/full/07-cluster-analysis 24/60
February 24, 2011 Data Mining: Concepts and Techniques 24
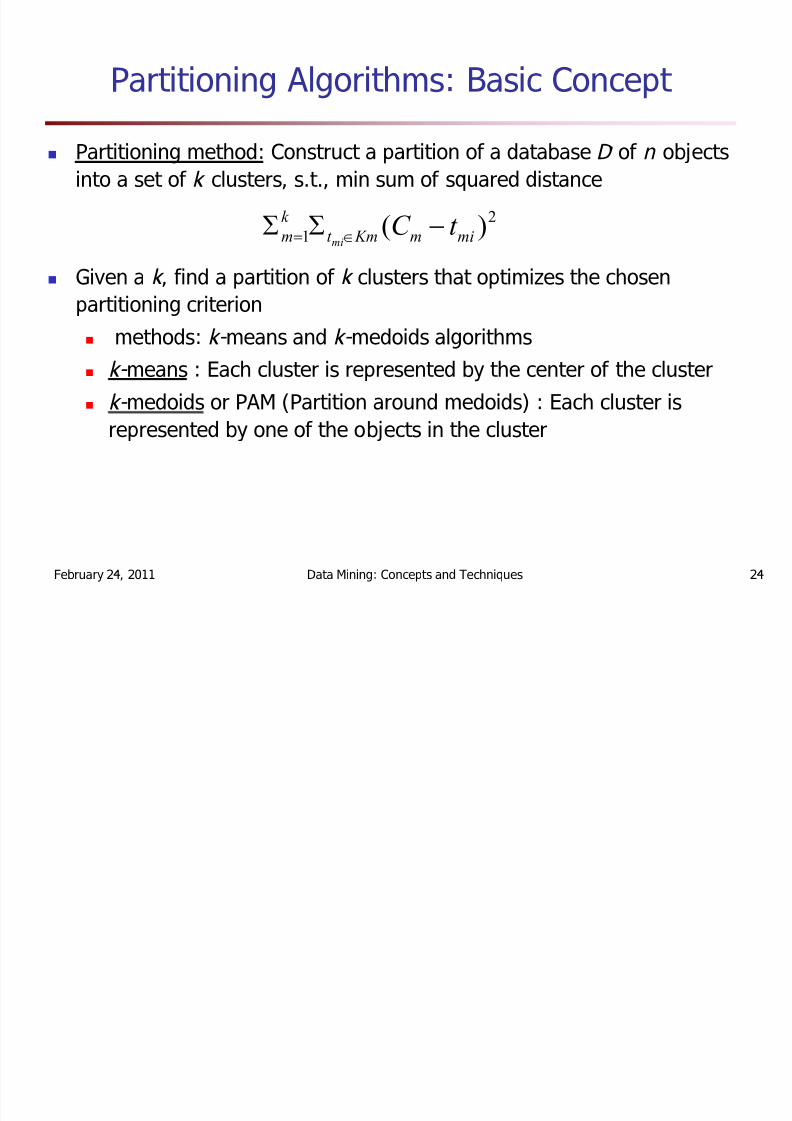
Partitioning Algorithms: Basic Concept
Partitioning method: Construct a partition of a database D of n objectsinto a set of k clusters, s.t., min sum of squared distance
Given a k , find a partition of k clusters that optimizes the chosenpartitioning criterion
methods: k- means and k- medoids algorithmsk- means : Each cluster is represented by the center of the clusterk- medoids or PAM (Partition around medoids) : Each cluster isrepresented by one of the objects in the cluster
21 )( m imKmt
k
mt C
m i77
!
8/7/2019 07-cluster analysis
http://slidepdf.com/reader/full/07-cluster-analysis 25/60
February 24, 2011 Data Mining: Concepts and Techniques 25
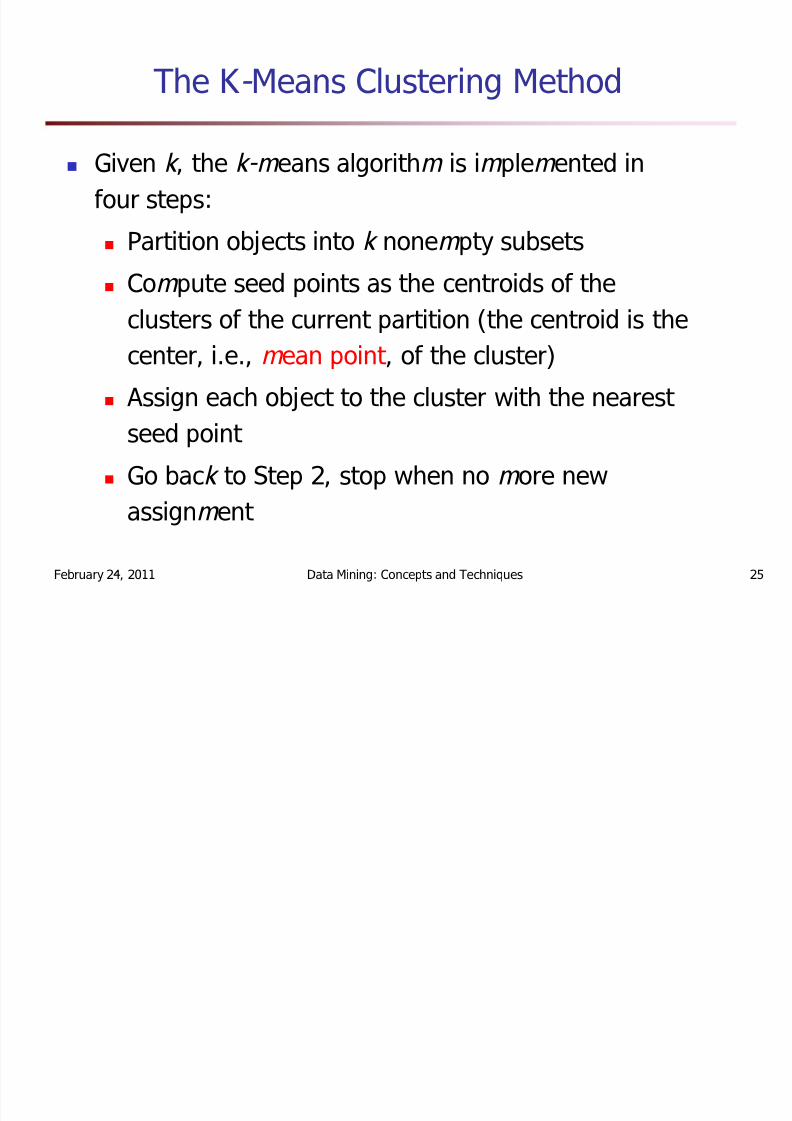
The K - Means Clustering Method
Given k , the k-m eans algorith m is im plem ented infour steps:
Partition objects into k none m pty subsets
Com pute seed points as the centroids of theclusters of the current partition (the centroid is thecenter, i.e., m ean point , of the cluster)
Assign each object to the cluster with the nearest seed point
Go bac k to Step 2, stop when no m ore newassign m ent
8/7/2019 07-cluster analysis
http://slidepdf.com/reader/full/07-cluster-analysis 26/60
February 24, 2011 Data Mining: Concepts and Techniques 26
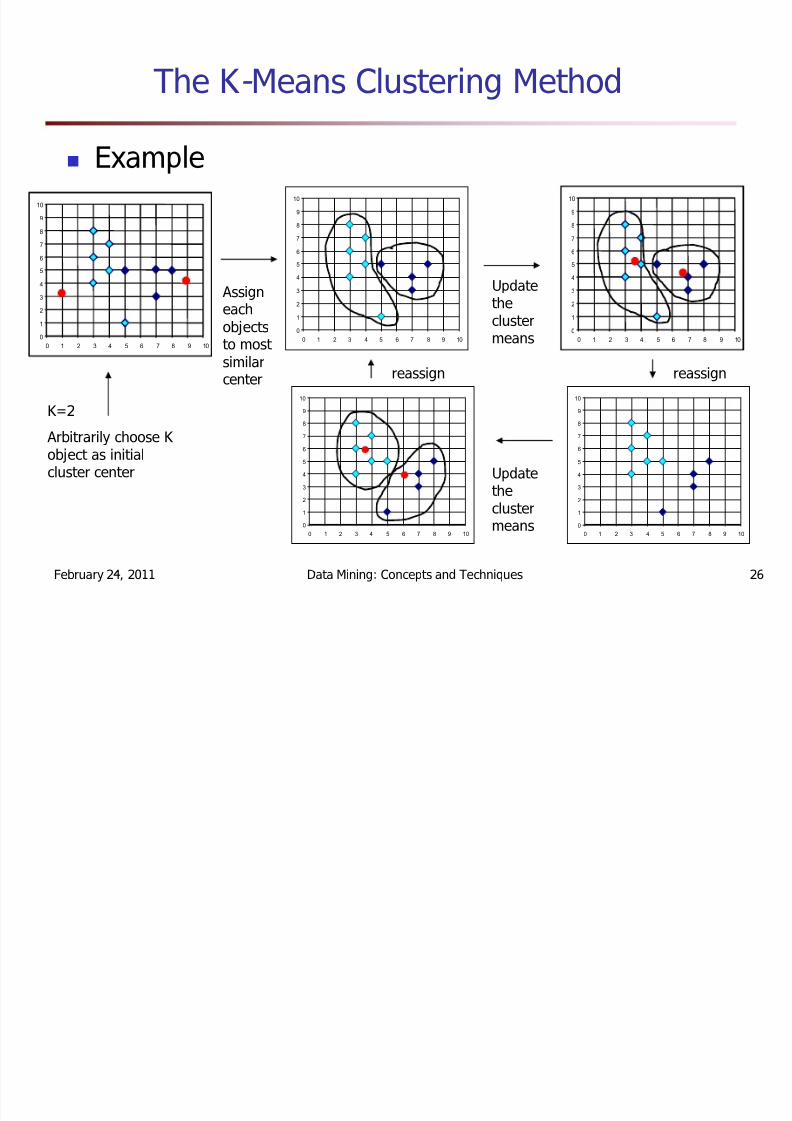
The K - Means Clustering Method
Example
0
1
2
3
4
5
6
7
8
9
10
0 1 2 3 4 5 6 7 8 9 10
0
1
2
3
4
5
6
7
8
9
10
0 1 2 3 4 5 6 7 8 9 10
0
1
2
3
4
5
6
7
8
9
10
0 1 2 3 4 5 6 7 8 9 10
0
1
2
3
4
5
6
7
8
9
10
0 1 2 3 4 5 6 7 8 9 10
0
1
2
3
4
5
6
7
8
9
10
0 1 2 3 4 5 6 7 8 9 10
K=2Arbitrarily choose K object as initialcluster center
Assigneachobjectsto most similarcenter
Updatetheclustermeans
Updatetheclustermeans
reassignreassign
8/7/2019 07-cluster analysis
http://slidepdf.com/reader/full/07-cluster-analysis 27/60
February 24, 2011 Data Mining: Concepts and Techniques 27
Comments on the K - Means Method
Strength: Relatively efficient:
Weakness
Applicable only when mean is defined, then what about
categorical data?Need to specify k, the number of clusters, in advance
Unable to handle noisy data and outliers
Not suitable to discover clusters with non - convexshapes
8/7/2019 07-cluster analysis
http://slidepdf.com/reader/full/07-cluster-analysis 28/60
February 24, 2011 Data Mining: Concepts and Techniques 28
Variations of the K - Means Method
A few variants of the k-m eans which differ in
Selection of the initial k m eans
Dissim ilarity calculations
Strategies to calculate cluster m eans
Handling categorical data: k-m odes
Replacing m eans of clusters with m odes
Using new dissi m ilarity m easures to deal with categorical objects
Using a frequency - based m ethod to update m odes of clusters
A m ixture of categorical and nu m erical data: k- prototype m ethod
8/7/2019 07-cluster analysis
http://slidepdf.com/reader/full/07-cluster-analysis 29/60
February 24, 2011 Data Mining: Concepts and Techniques 29
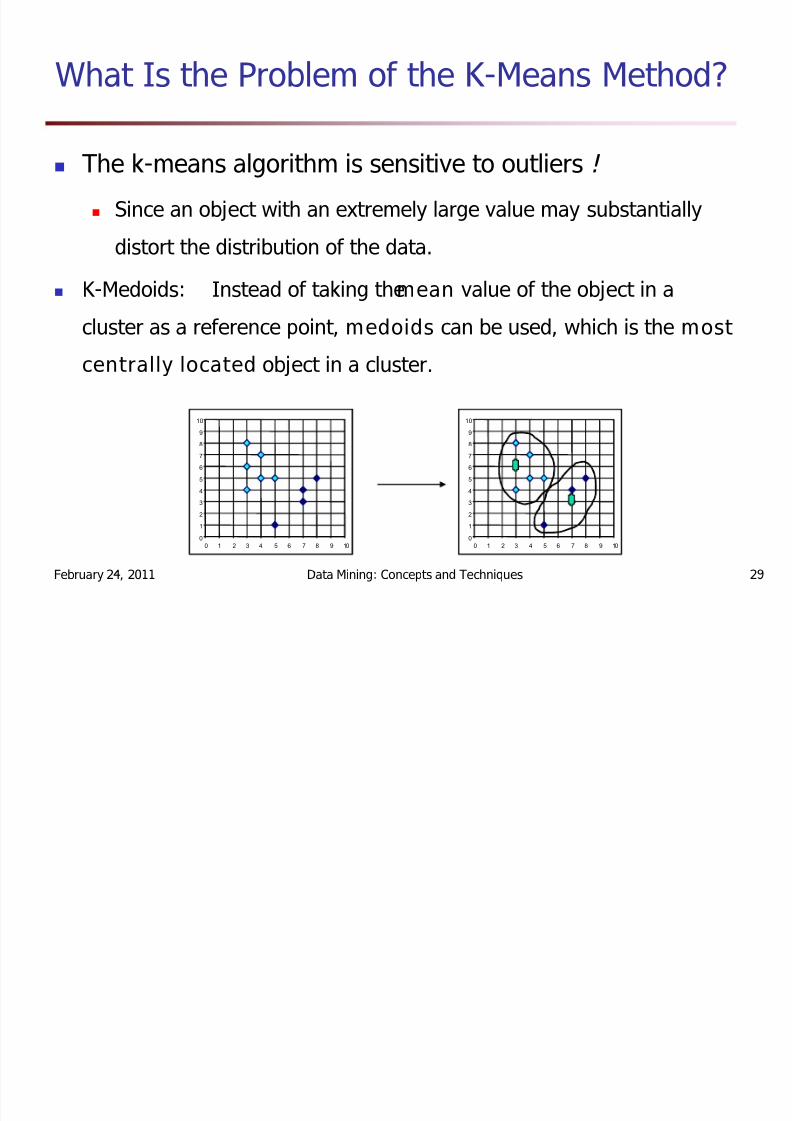
What Is the Problem of the K-Means Method?
The k-means algorithm is sensitive to outliers !
Since an object with an extremely large value may substantially
distort the distribution of the data.
K-Medoids: Instead of taking the m ean value of the object in a
cluster as a reference point, m edoids can be used, which is the m ost
centrally located object in a cluster.
0
1
2
3
4
5
6
7
8
9
10
0 1 2 3 4 5 6 7 8 9 10
0
1
2
3
4
5
6
7
8
9
10
0 1 2 3 4 5 6 7 8 9 10
8/7/2019 07-cluster analysis
http://slidepdf.com/reader/full/07-cluster-analysis 30/60
February 24, 2011 Data Mining: Concepts and Techniques 30
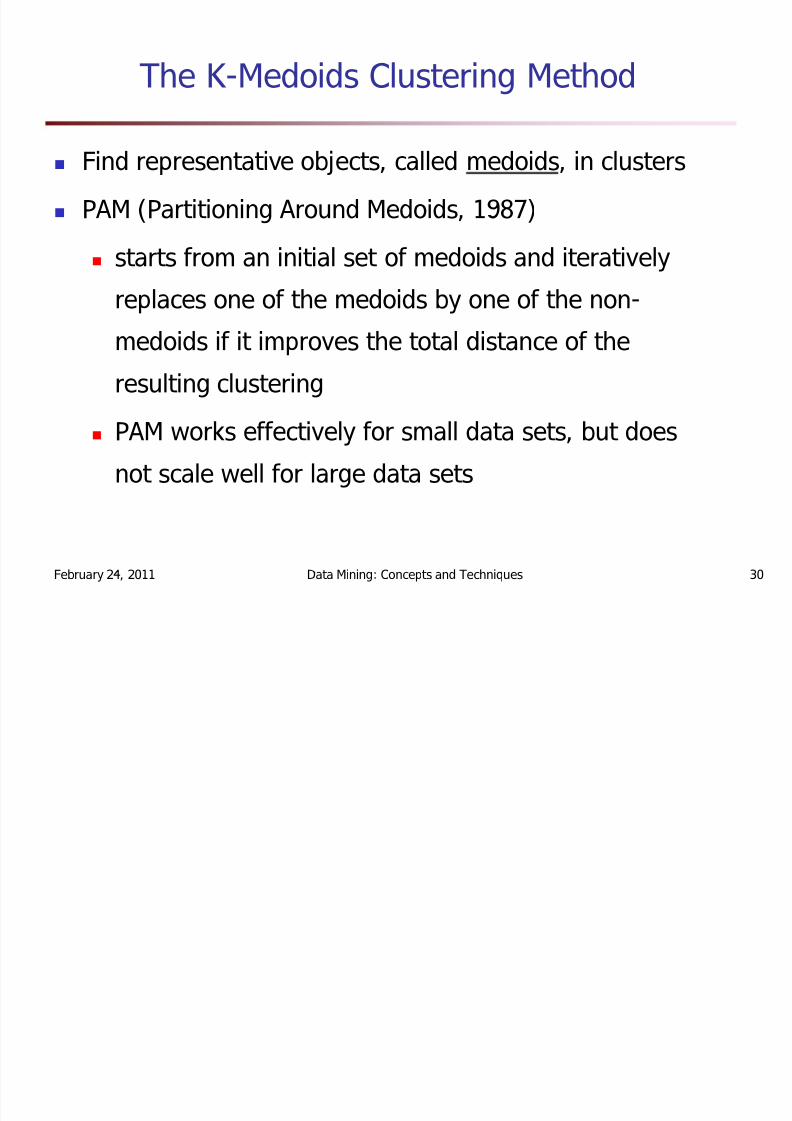
The K-Medoids Clustering Method
Find representative objects, called medoids, in clusters
PAM (Partitioning Around Medoids, 1987)
starts from an initial set of medoids and iteratively
replaces one of the medoids by one of the non-
medoids if it improves the total distance of the
resulting clustering
PAM works effectively for small data sets, but does
not scale well for large data sets

8/7/2019 07-cluster analysis
http://slidepdf.com/reader/full/07-cluster-analysis 31/60
February 24, 2011 Data Mining: Concepts and Techniques 31
A Typical K-Medoids Algorithm (PAM)
0
1
2
3
4
5
6
7
8
9
10
0 1 2 3 4 5 6 7 8 9 10
Total Cost = 20
0
1
2
3
4
5
6
7
8
9
10
0 1 2 3 4 5 6 7 8 9 10
K=2
Arbitrarychoose kobject asinitialmedoids
0
1
2
3
4
5
6
7
8
9
10
0 1 2 3 4 5 6 7 8 9 10
Assigneachremaining object tonearest medoids
Randomly select anonmedoid object,O ramdom
Computetotal cost of swapping
0
1
2
3
4
5
6
7
8
9
10
0 1 2 3 4 5 6 7 8 9 10
Total Cost = 26
Swapping Oand O ramdom
If quality isimproved.
0
1
2
3
4
5
6
7
8
9
10
0 1 2 3 4 5 6 7 8 9 10
8/7/2019 07-cluster analysis
http://slidepdf.com/reader/full/07-cluster-analysis 32/60
February 24, 2011 Data Mining: Concepts and Techniques 32
PAM (Partitioning Around Medoids) (1987)
Use real object to represent the cluster
Select k representative objects arbitrarily
For each pair of non-selected object h and selected
object i , calculate the total swapping cost TC ih
For each pair of i and h ,
If TCih < 0, i is replaced by h
Then assign each non-selected object to the most similar representative object
repeat steps 2-3 until there is no change
8/7/2019 07-cluster analysis
http://slidepdf.com/reader/full/07-cluster-analysis 33/60
February 24, 2011 Data Mining: Concepts and Techniques 33
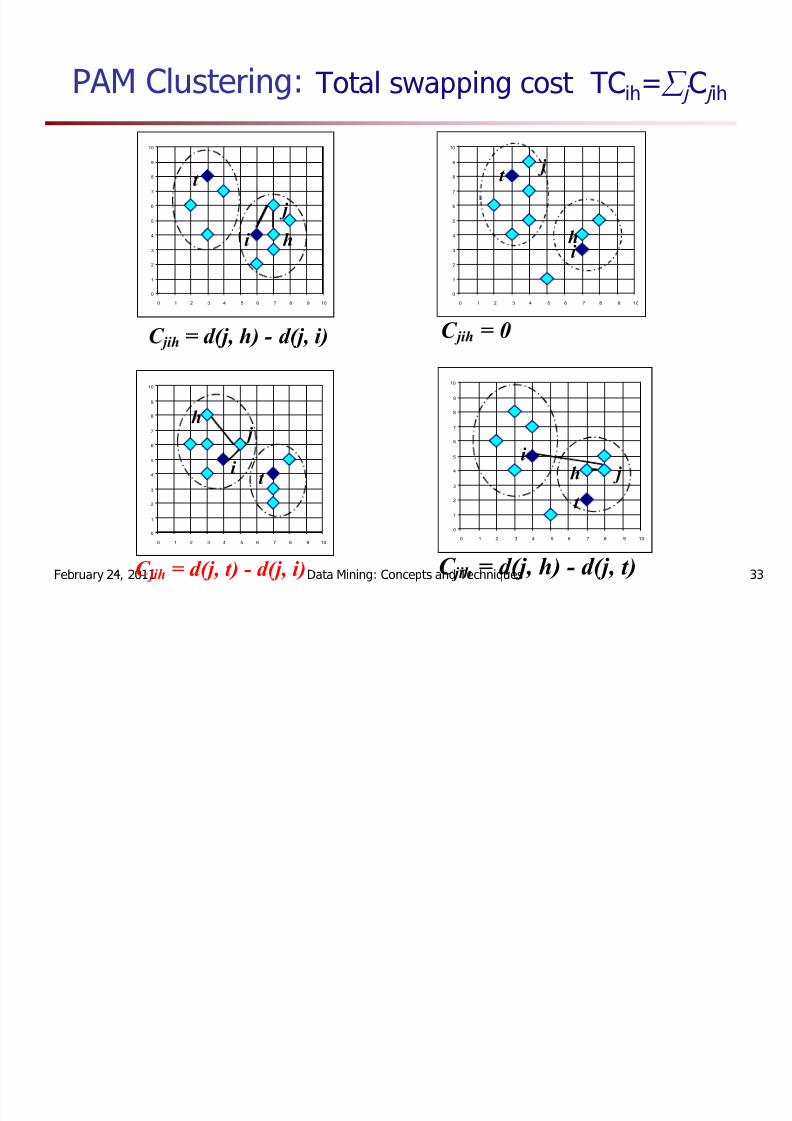
PAM Clustering: Total swapping cost TC ih= § j Cj ih
0
1
2
3
4
5
6
7
8
9
10
0 1 2 3 4 5 6 7 8 9 10
j
i h
t
C jih = 0
0
1
2
3
4
5
6
7
8
9
10
0 1 2 3 4 5 6 7 8 9 10
t
i h
j
C jih = d(j, h) - d(j, i)
0
1
2
3
4
5
6
7
8
9
10
0 1 2 3 4 5 6 7 8 9 10
h
i t
j
C jih = d(j, t) - d(j, i)
0
1
2
3
4
5
6
7
8
9
10
0 1 2 3 4 5 6 7 8 9 10
t
i h j
C jih = d(j, h) - d(j, t)
8/7/2019 07-cluster analysis
http://slidepdf.com/reader/full/07-cluster-analysis 34/60
February 24, 2011 Data Mining: Concepts and Techniques 34
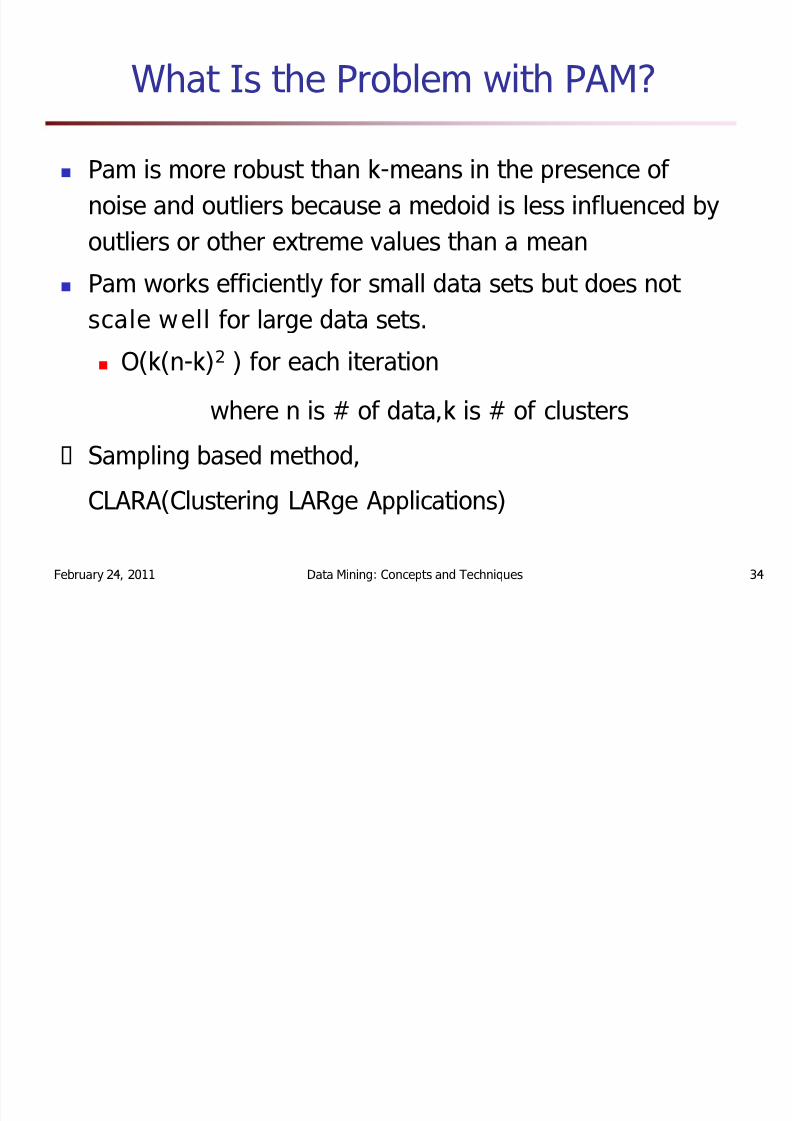
What Is the Problem with PAM?
Pam is more robust than k-means in the presence of noise and outliers because a medoid is less influenced byoutliers or other extreme values than a mean
Pam works efficiently for small data sets but does not scale well for large data sets.
O(k(n-k) 2 ) for each iteration
where n is # of data,k is # of clustersSampling based method,
CLARA(Clustering LARge Applications)
8/7/2019 07-cluster analysis
http://slidepdf.com/reader/full/07-cluster-analysis 35/60
February 24, 2011 Data Mining: Concepts and Techniques 35
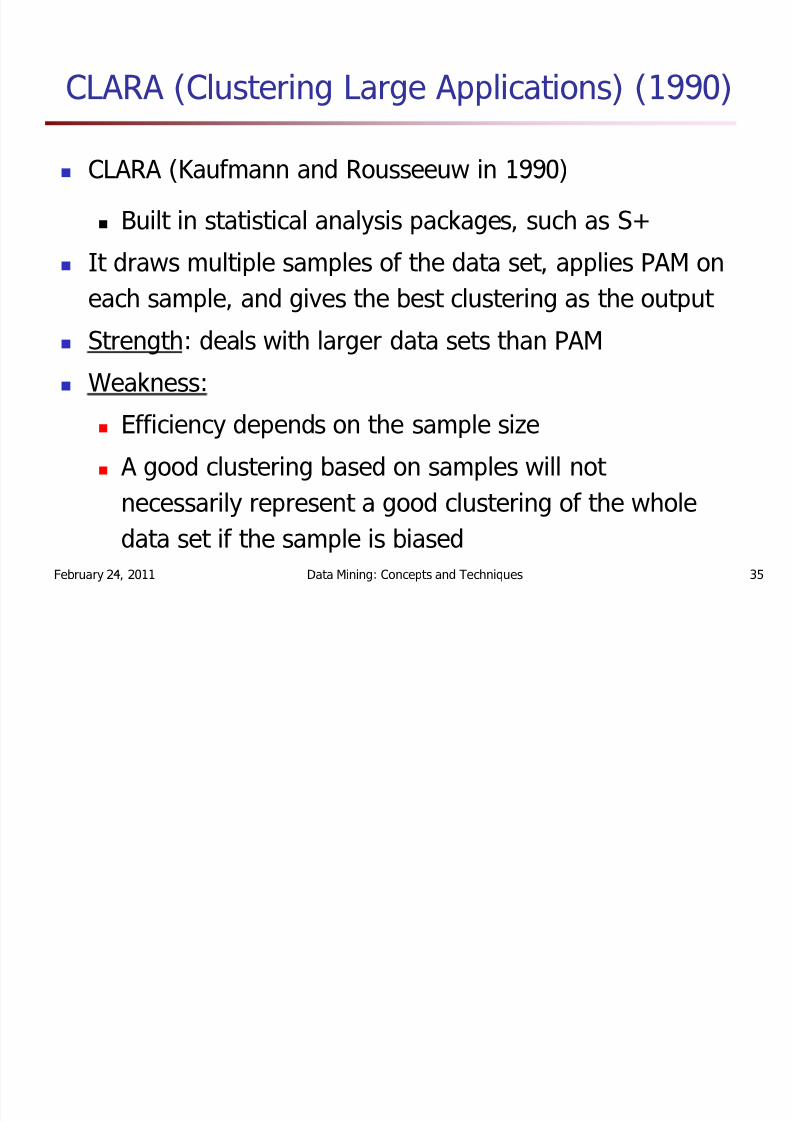
CLARA (Clustering Large Applications) (1990)
CLARA (Kaufmann and Rousseeuw in 1990)
Built in statistical analysis packages, such as S +
It draws multiple samples of the data set, applies PAM oneach sample, and gives the best clustering as the output
Strength: deals with larger data sets than PAM
Weakness:
Efficiency depends on the sample sizeA good clustering based on samples will not necessarily represent a good clustering of the wholedata set if the sample is biased
8/7/2019 07-cluster analysis
http://slidepdf.com/reader/full/07-cluster-analysis 36/60
February 24, 2011 Data Mining: Concepts and Techniques 36
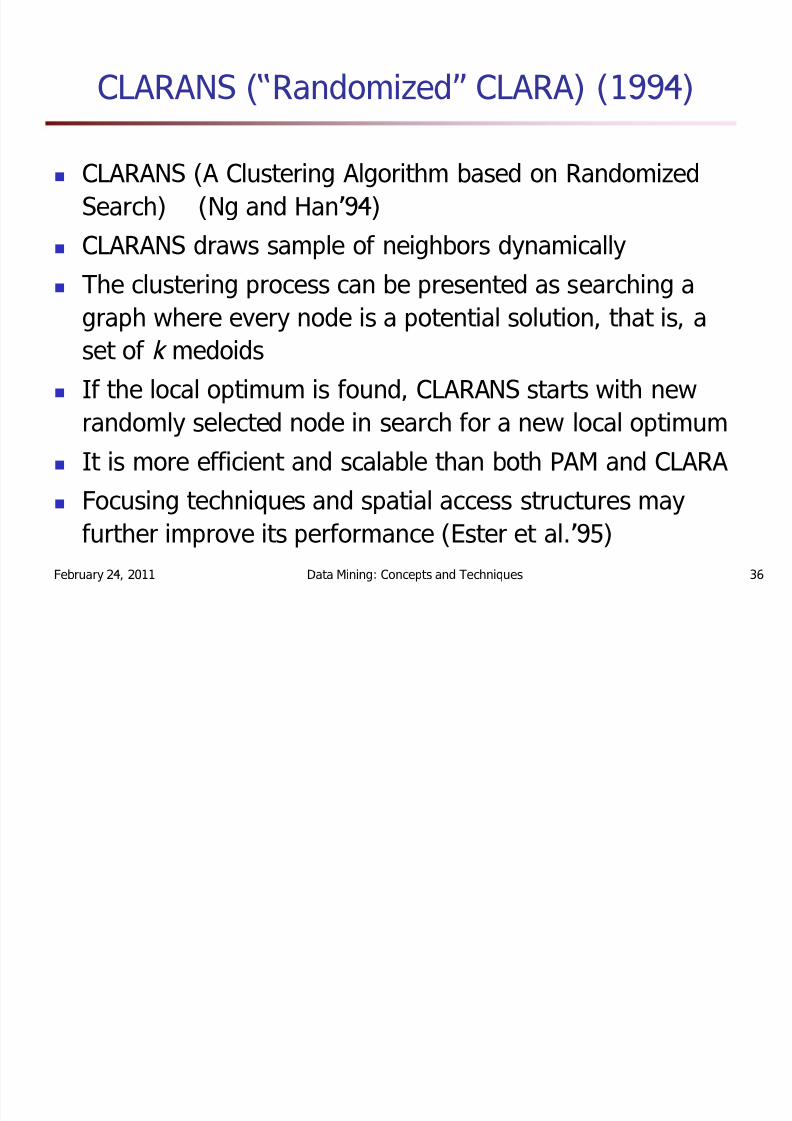
CLARANS ( Randomized CLARA) (1994)
CLARANS (A Clustering Algorithm based on RandomizedSearch) (Ng and Han 94)CLARANS draws sample of neighbors dynamically
The clustering process can be presented as searching agraph where every node is a potential solution, that is, aset of k medoidsIf the local optimum is found, CLARANS starts with new
randomly selected node in search for a new local optimumIt is more efficient and scalable than both PAM and CLARAFocusing techniques and spatial access structures mayfurther improve its performance (Ester et al. 95)
8/7/2019 07-cluster analysis
http://slidepdf.com/reader/full/07-cluster-analysis 37/60
February 24, 2011 Data Mining: Concepts and Techniques 37
Chapter 7. Cluster Analysis
1. What is Cluster Analysis?
2. Types of Data in Cluster Analysis
3. A Categorization of Major Clustering Methods
4. Partitioning Methods
5. Hierarchical Methods
6. Density-Based Methods
7. Grid-Based Methods
8. Model-Based Methods
9. Clustering High-Dimensional Data
10. Constraint-Based Clustering
11. Outlier Analysis
12. Summary
8/7/2019 07-cluster analysis
http://slidepdf.com/reader/full/07-cluster-analysis 38/60
February 24, 2011 Data Mining: Concepts and Techniques 38
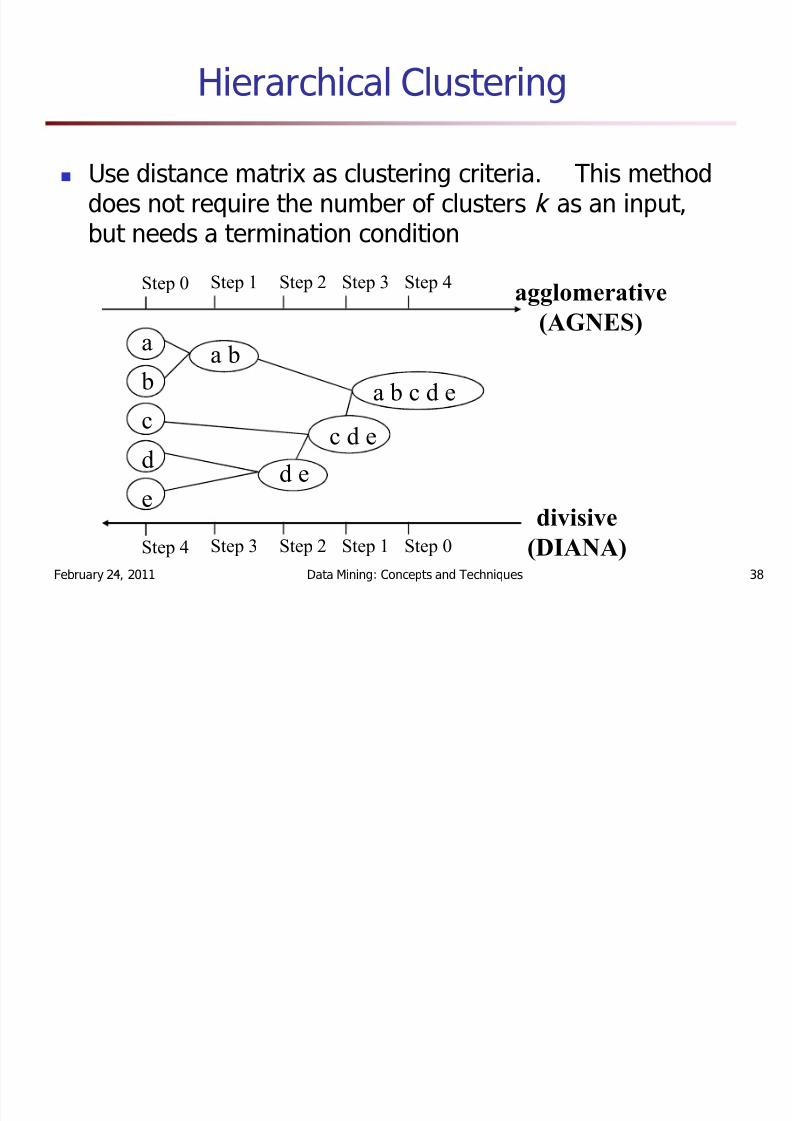
Hierarchical Clustering
Use distance matrix as clustering criteria. This methoddoes not require the number of clusters k as an input,but needs a termination condition
Step 0 Step 1 Step 2 Step 3 Step 4
b
dc
e
a a b
d e
c d e
a b c d e
Step 4 Step 3 Step 2 Step 1 Step 0
agglom er a tive(AGNES)
d ivisive
(DIANA)
8/7/2019 07-cluster analysis
http://slidepdf.com/reader/full/07-cluster-analysis 39/60
February 24, 2011 Data Mining: Concepts and Techniques 39
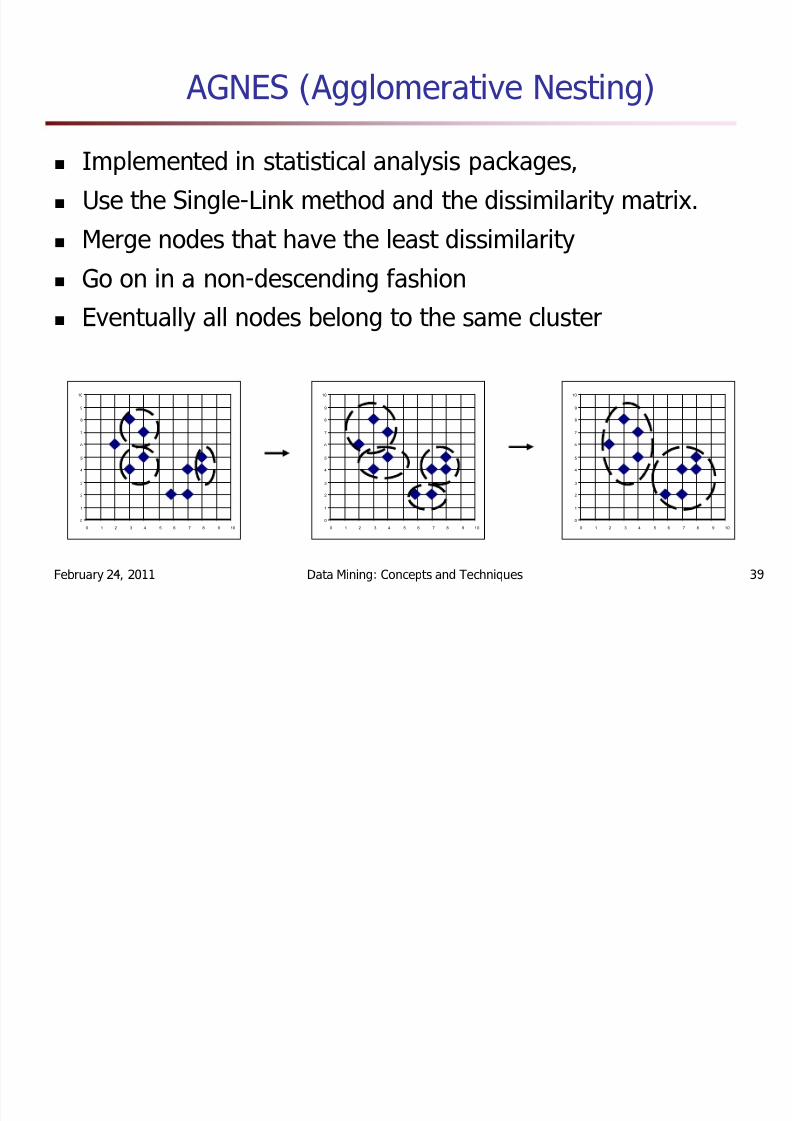
AGNES (Agglomerative Nesting)
Implemented in statistical analysis packages,Use the Single-Link method and the dissimilarity matrix.Merge nodes that have the least dissimilarity
Go on in a non-descending fashionEventually all nodes belong to the same cluster
0
1
2
3
4
5
6
7
8
9
10
0 1 2 3 4 5 6 7 8 9 10
0
1
2
3
4
5
6
7
8
9
10
0 1 2 3 4 5 6 7 8 9 10
0
1
2
3
4
5
6
7
8
9
10
0 1 2 3 4 5 6 7 8 9 10
8/7/2019 07-cluster analysis
http://slidepdf.com/reader/full/07-cluster-analysis 40/60
February 24, 2011 Data Mining: Concepts and Techniques 40
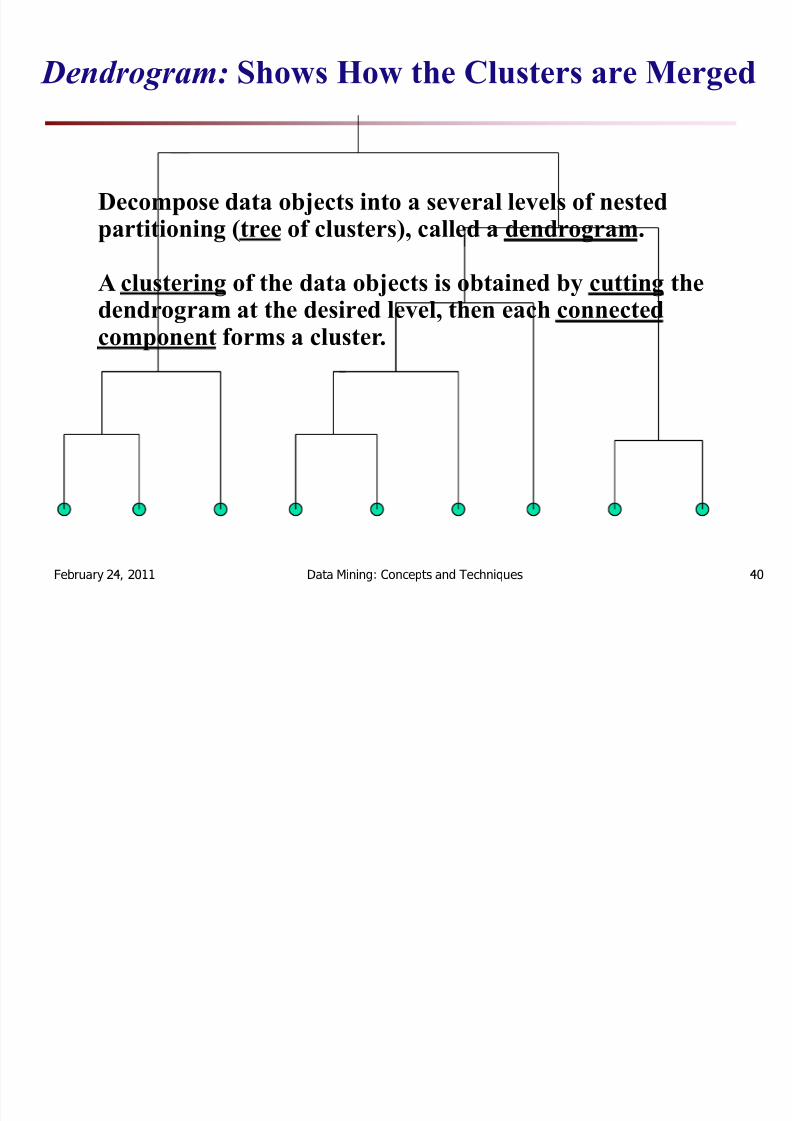
De nd rogram: Sh ow s H ow th e C lu sters a re Mer ged
Decompo se da ta objects int o a sever al leve ls of neste d pa rtiti onin g (tree of clu sters ), call ed a den d r ogr am .
A clu sterin g of the da ta objects is obt a ine d by c u ttin g theden d r og r am a t t he desire d leve l, then e ach connecte d compo nent for m s a clu ster .
8/7/2019 07-cluster analysis
http://slidepdf.com/reader/full/07-cluster-analysis 41/60
February 24, 2011 Data Mining: Concepts and Techniques 41
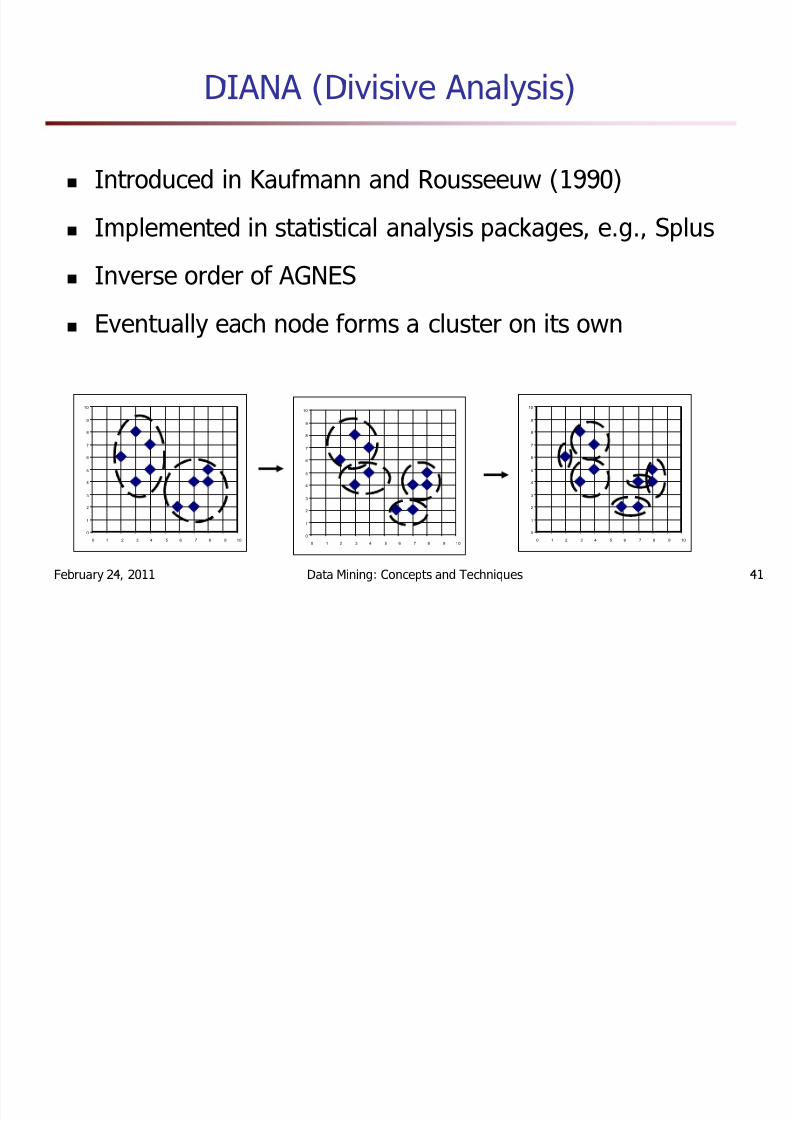
DIANA (Divisive Analysis)
Introduced in Kaufmann and Rousseeuw (1990)
Implemented in statistical analysis packages, e.g., Splus
Inverse order of AGNESEventually each node forms a cluster on its own
0
1
2
3
4
5
6
7
8
9
10
0 1 2 3 4 5 6 7 8 9 100
1
2
3
4
5
6
7
8
9
10
0 1 2 3 4 5 6 7 8 9 10
0
1
2
3
4
5
6
7
8
9
10
0 1 2 3 4 5 6 7 8 9 10
8/7/2019 07-cluster analysis
http://slidepdf.com/reader/full/07-cluster-analysis 42/60
February 24, 2011 Data Mining: Concepts and Techniques 42
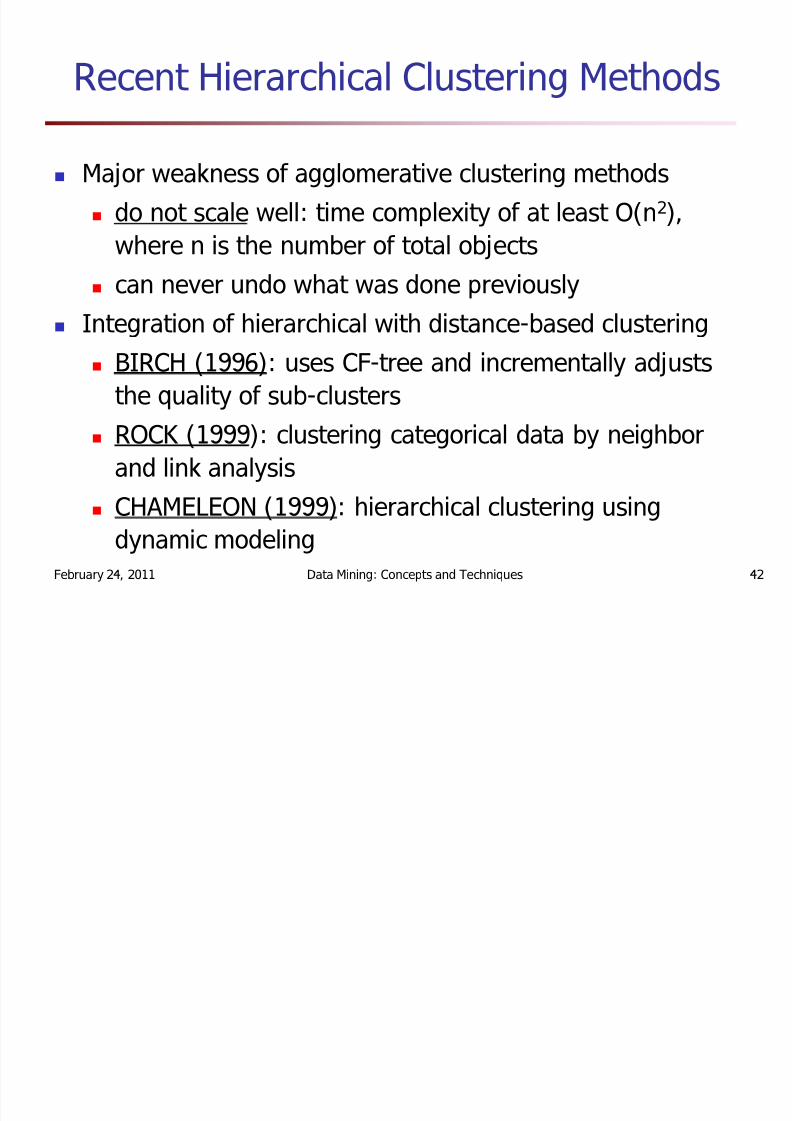
Recent Hierarchical Clustering Methods
Major weakness of agglomerative clustering methodsdo not scale well: time complexity of at least O(n 2),where n is the number of total objects
can never undo what was done previouslyIntegration of hierarchical with distance-based clustering
BIRCH (1996): uses CF-tree and incrementally adjuststhe quality of sub-clustersROCK (1999): clustering categorical data by neighborand link analysisCHAMELEON (1999): hierarchical clustering usingdynamic modeling
8/7/2019 07-cluster analysis
http://slidepdf.com/reader/full/07-cluster-analysis 43/60
February 24, 2011 Data Mining: Concepts and Techniques 43
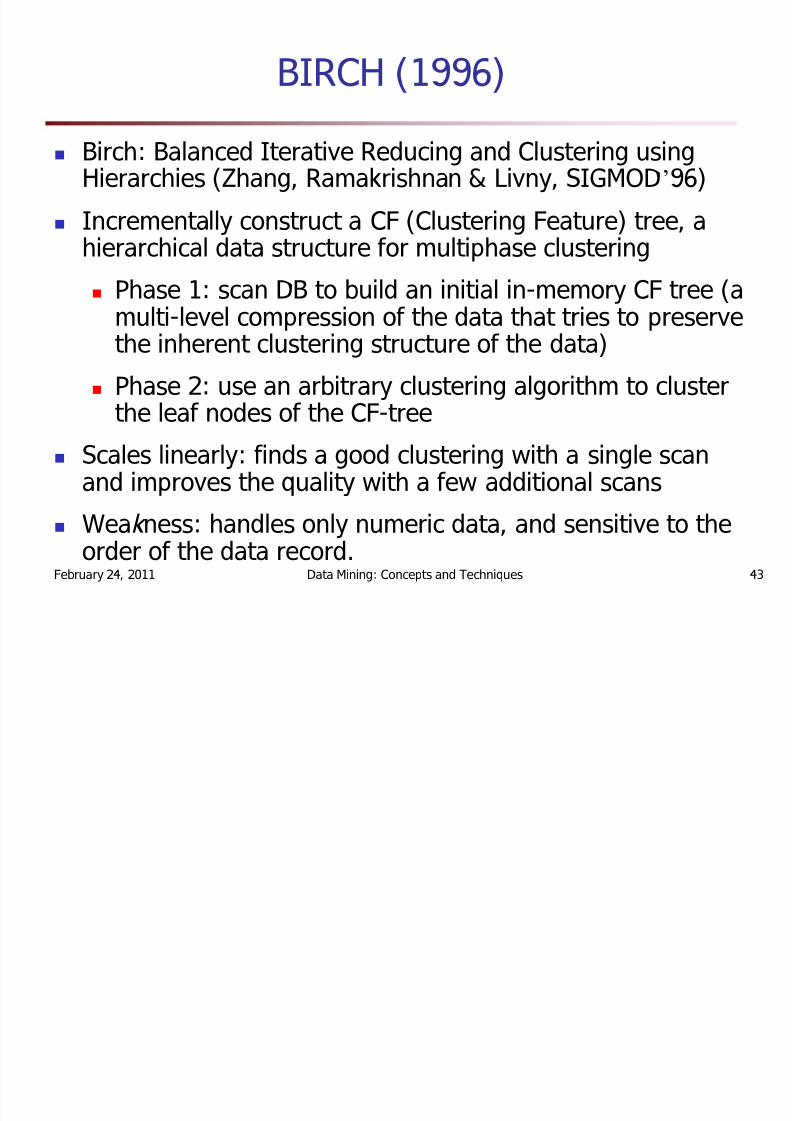
BIRCH (1996)
Birch: Balanced Iterative Reducing and Clustering usingHierarchies (Zhang, Ramakrishnan & Livny, SIGMOD ¶96)
Incrementally construct a CF (Clustering Feature) tree, ahierarchical data structure for multiphase clustering
Phase 1: scan DB to build an initial in-memory CF tree (amulti-level compression of the data that tries to preservethe inherent clustering structure of the data)
Phase 2: use an arbitrary clustering algorithm to cluster
the leaf nodes of the CF-treeScales linearly: finds a good clustering with a single scanand improves the quality with a few additional scans
Wea k ness: handles only numeric data, and sensitive to the
order of the data record.

8/7/2019 07-cluster analysis
http://slidepdf.com/reader/full/07-cluster-analysis 44/60
February 24, 2011 Data Mining: Concepts and Techniques 44
Clustering Feature Vector in BIRCH
C lu sterin g Fe a tu re : CF = (N, LS, SS)
N : Num ber of da ta po ints
LS: § N i=1 =X i
SS: § N i=1 =X i2
0
1
2
3
4
5
6
7
8
9
10
0 1 2 3 4 5 6 7 8 9 10
CF = (5, (16,30),(54,19 0))
(3,4)(2,6)(4,5)(4,7)(3,8)
8/7/2019 07-cluster analysis
http://slidepdf.com/reader/full/07-cluster-analysis 45/60
February 24, 2011 Data Mining: Concepts and Techniques 45
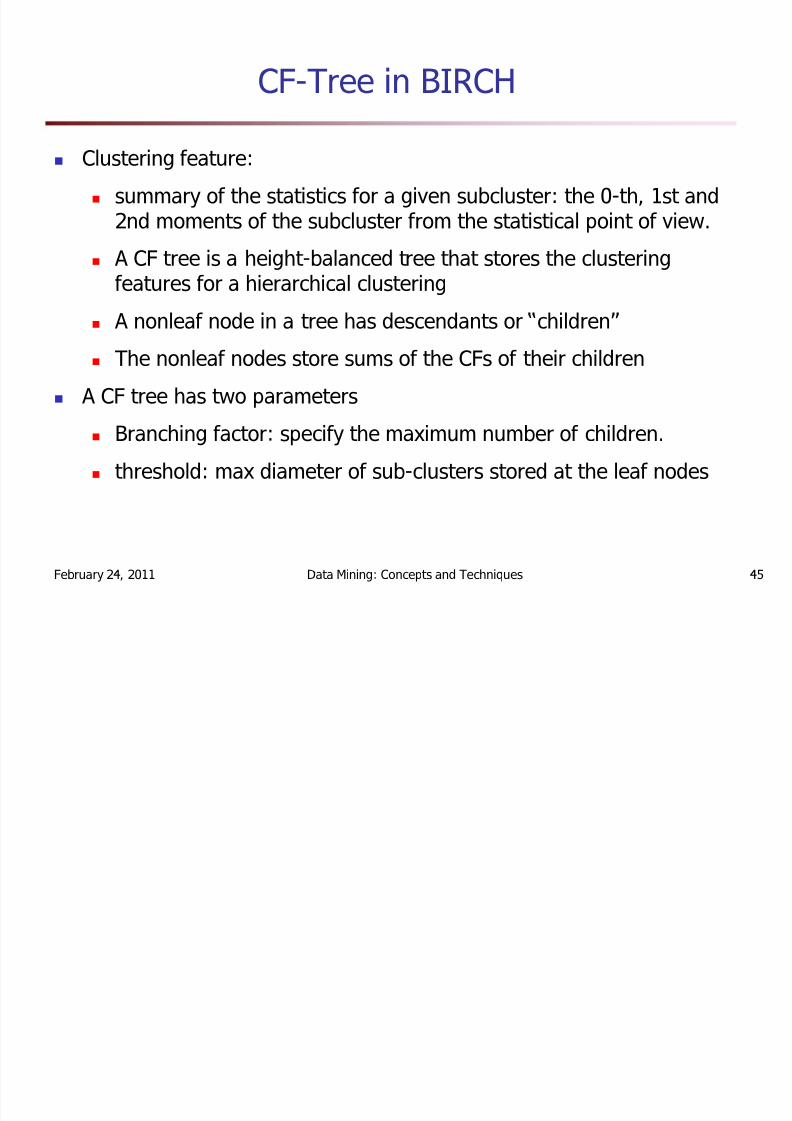
CF-Tree in BIRCH
Clustering feature:
summary of the statistics for a given subcluster: the 0-th, 1st and2nd moments of the subcluster from the statistical point of view.
A CF tree is a height-balanced tree that stores the clustering
features for a hierarchical clusteringA nonleaf node in a tree has descendants or children
The nonleaf nodes store sums of the CFs of their children
A CF tree has two parameters
Branching factor: specify the maximum number of children.
threshold: max diameter of sub-clusters stored at the leaf nodes

8/7/2019 07-cluster analysis
http://slidepdf.com/reader/full/07-cluster-analysis 46/60
February 24, 2011 Data Mining: Concepts and Techniques 46
The CF Tree Structure
CF 1
child 1
CF 3
child 3
CF 2
child 2
CF 6
child 6
CF 1
child 1
CF 3
child 3
CF 2
child 2
CF 5
child 5
CF 1 CF 2 CF 6prev next CF 1 CF 2 CF 4prev next
B = 7
L = 6
R oot
on-leaf node
Leaf node Leaf node
8/7/2019 07-cluster analysis
http://slidepdf.com/reader/full/07-cluster-analysis 47/60
February 24, 2011 Data Mining: Concepts and Techniques 47
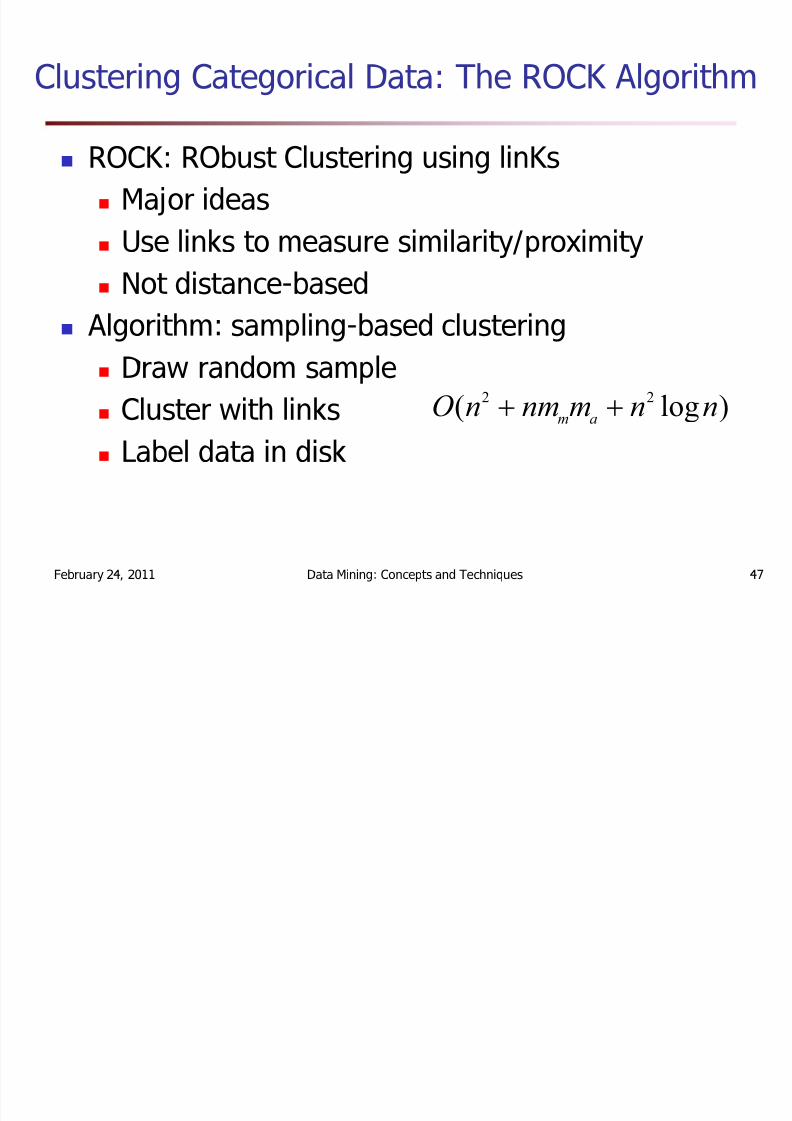
Clustering Categorical Data: The ROCK Algorithm
ROCK: RObust Clustering using linKsMajor ideasUse links to measure similarity/proximity
Not distance-basedAlgorithm: sampling-based clustering
Draw random sample
Cluster with linksLabel data in disk
On nm m n nm a( log )
2 2
8/7/2019 07-cluster analysis
http://slidepdf.com/reader/full/07-cluster-analysis 48/60
February 24, 2011 Data Mining: Concepts and Techniques 48
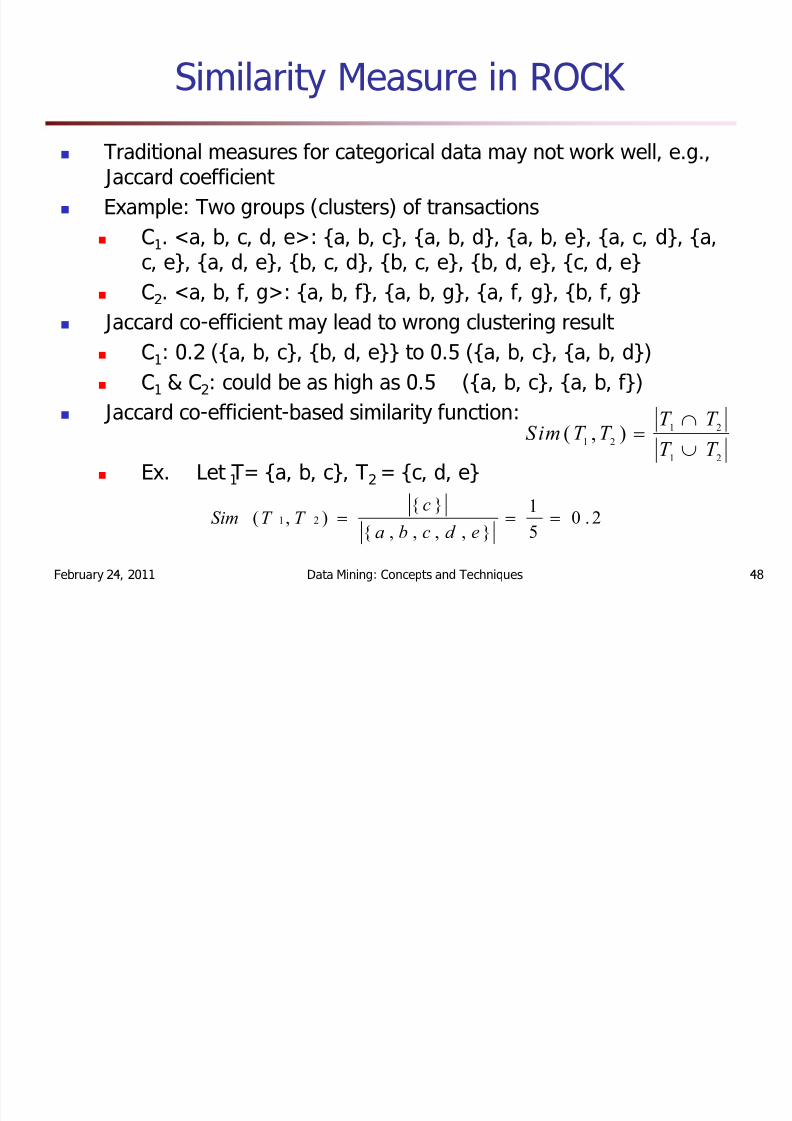
Similarity Measure in ROCK
Traditional measures for categorical data may not work well, e.g.,Jaccard coefficient Example: Two groups (clusters) of transactions
C1. < a, b, c, d, e>: {a, b, c}, {a, b, d}, {a, b, e}, {a, c, d}, {a,c, e}, {a, d, e}, {b, c, d}, {b, c, e}, {b, d, e}, {c, d, e}C2. < a, b, f, g>: {a, b, f}, {a, b, g}, {a, f, g}, {b, f, g}
Jaccard co-efficient may lead to wrong clustering result C1: 0.2 ({a, b, c}, {b, d, e}} to 0.5 ({a, b, c}, {a, b, d})C1 & C2: could be as high as 0.5 ({a, b, c}, {a, b, f})
Jaccard co-efficient-based similarity function:
Ex. Let T 1 = {a, b, c}, T 2 = {c, d, e}
S im T T T T T T
( , )1 21 2
1 2
!
2.051
},,,,{
}{),( 21 !!!
ed cba
cT T S im
8/7/2019 07-cluster analysis
http://slidepdf.com/reader/full/07-cluster-analysis 49/60
February 24, 2011 Data Mining: Concepts and Techniques 49
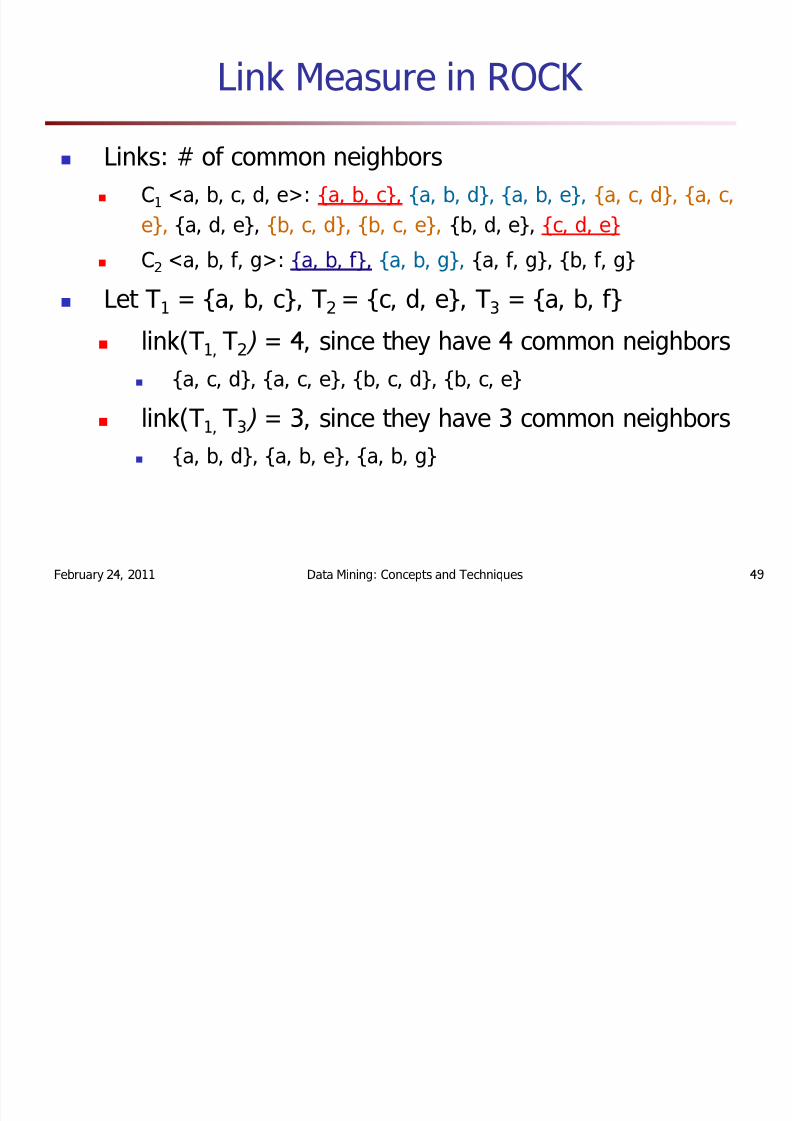
Link Measure in ROCK
Links: # of common neighborsC1 < a, b, c, d, e>: {a, b, c}, {a, b, d}, {a, b, e}, {a, c, d}, {a, c,e}, {a, d, e}, {b, c, d}, {b, c, e}, {b, d, e}, {c, d, e}
C2 < a, b, f, g>: {a, b, f}, {a, b, g}, {a, f, g}, {b, f, g}
Let T 1 = {a, b, c}, T 2 = {c, d, e}, T 3 = {a, b, f}
link(T1, T2) = 4, since they have 4 common neighbors{a, c, d}, {a, c, e}, {b, c, d}, {b, c, e}
link(T1, T3) = 3, since they have 3 common neighbors{a, b, d}, {a, b, e}, {a, b, g}
8/7/2019 07-cluster analysis
http://slidepdf.com/reader/full/07-cluster-analysis 50/60
February 24, 2011 Data Mining: Concepts and Techniques 50
CHAMELEON: Hierarchical Clustering UsingDynamic Modeling (1999)
Two clusters are merged only if the interconnectivityand closeness (proximity) between two clusters are highrelative to the internal interconnectivity of the clustersand closeness of items within the clusters
A two-phase algorithm
1. Use a graph partitioning algorithm: cluster objects into alarge number of relatively small sub-clusters
2. Use an agglomerative hierarchical clustering algorithm:find the genuine clusters by repeatedly combining thesesub-clusters
8/7/2019 07-cluster analysis
http://slidepdf.com/reader/full/07-cluster-analysis 51/60
February 24, 2011 Data Mining: Concepts and Techniques 51
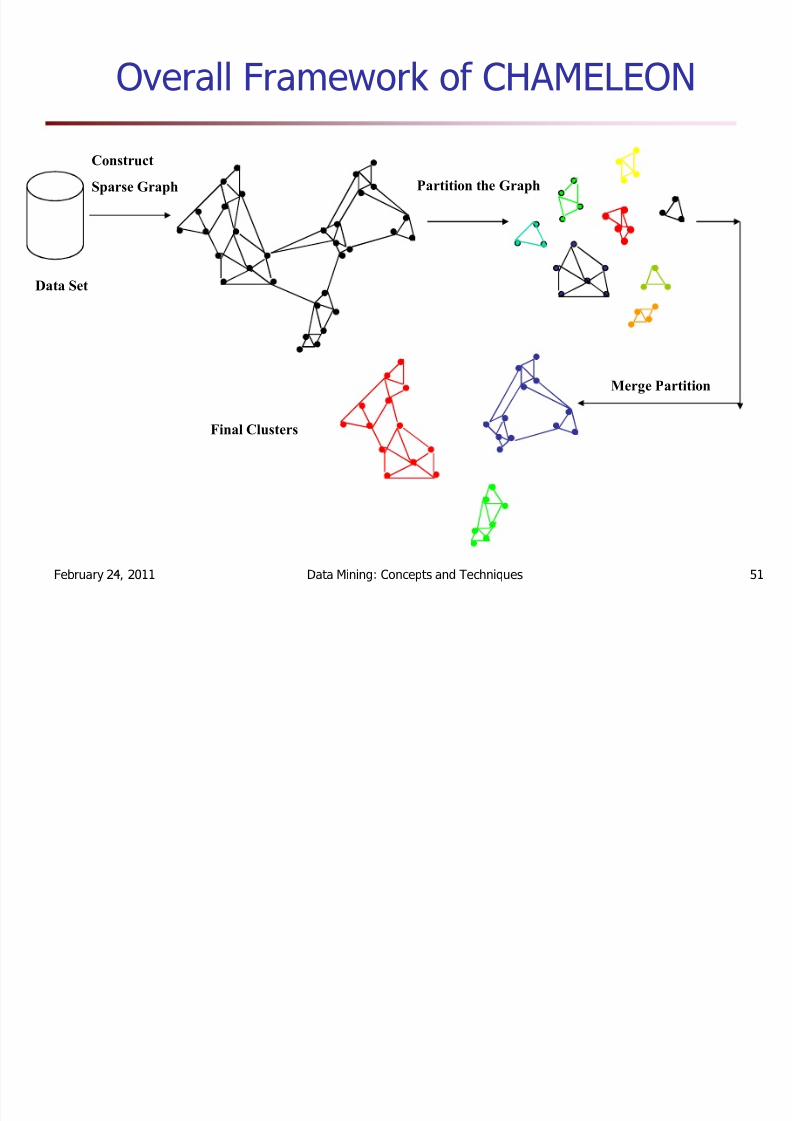
Overall Framework of CHAMELEON
C onstr u ct
Spa rse G r ap h P a rtiti on t he G r ap h
Mer ge P artiti on
Fin al C lu sters
Da ta Set
8/7/2019 07-cluster analysis
http://slidepdf.com/reader/full/07-cluster-analysis 52/60
February 24, 2011 Data Mining: Concepts and Techniques 52
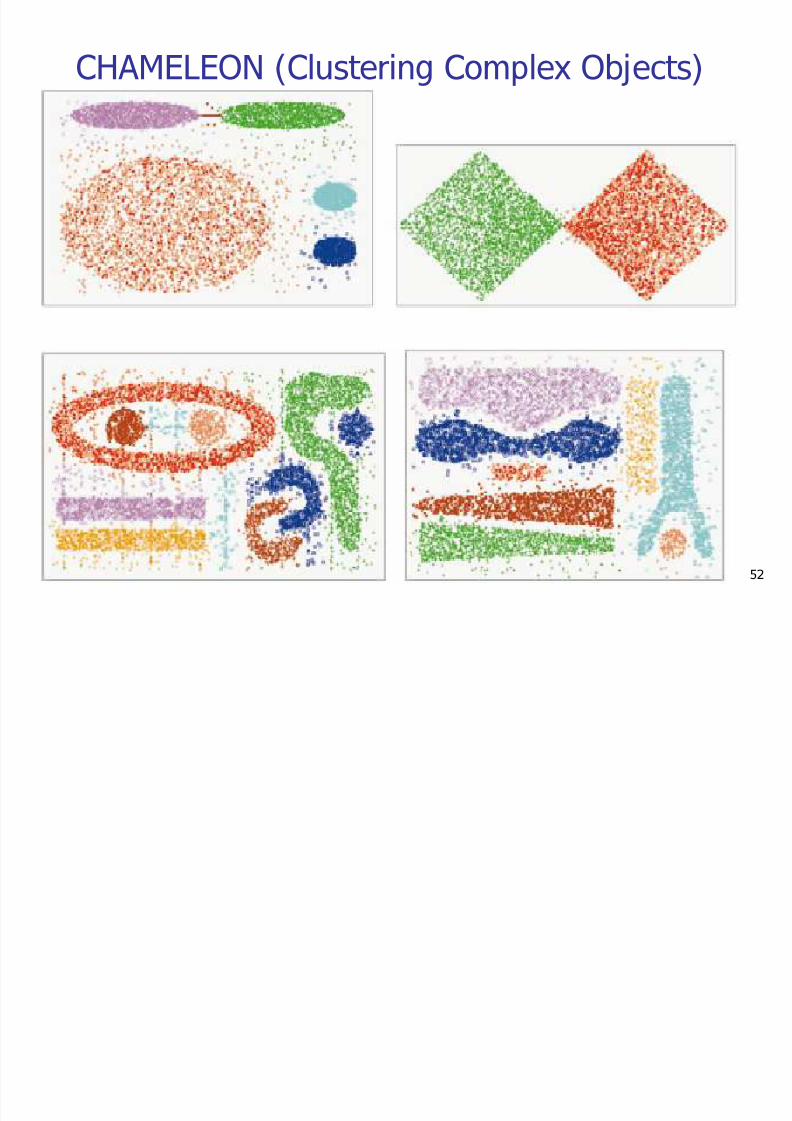
CHAMELEON (Clustering Complex Objects)
8/7/2019 07-cluster analysis
http://slidepdf.com/reader/full/07-cluster-analysis 53/60
February 24, 2011 Data Mining: Concepts and Techniques 53
Grid-Based Clustering Method
Using multi-resolution grid data structure
Several interesting methods
STING (a STatistical INformation Grid approach) by Wang,Yang and Muntz (1997)
WaveCluster by Sheikholeslami, Chatterjee, and Zhang(VLDB 98)
A multi-resolution clustering approach using wavelet method
CLIQUE: Agrawal, et al. (SIGMOD ¶98)
On high-dimensional data (thus put in the section of clusteringhigh-dimensional data
8/7/2019 07-cluster analysis
http://slidepdf.com/reader/full/07-cluster-analysis 54/60
February 24, 2011 Data Mining: Concepts and Techniques 54
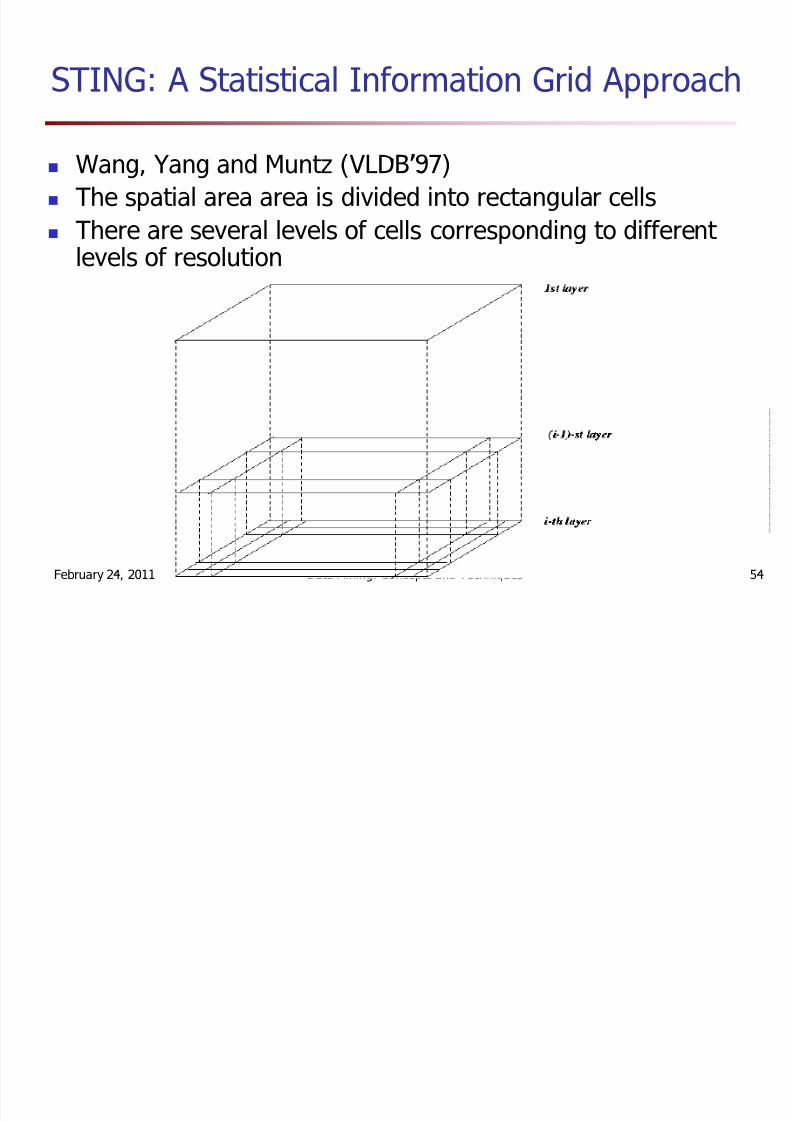
STING: A Statistical Information Grid Approach
Wang, Yang and Muntz (VLDB 97)The spatial area area is divided into rectangular cellsThere are several levels of cells corresponding to different levels of resolution
8/7/2019 07-cluster analysis
http://slidepdf.com/reader/full/07-cluster-analysis 55/60
February 24, 2011 Data Mining: Concepts and Techniques 55
The STING Clustering Method
Each cell at a high level is partitioned into a number of smaller cells in the next lower levelStatistical info of each cell is calculated and storedbeforehand and is used to answer queries
Parameters of higher level cells can be easily calculated fromparameters of lower level cellcount, mean, s, min, maxtype of distribution normal, uniform, etc.
Use a top-down approach to answer spatial data queriesStart from a pre-selected layer typically with a smallnumber of cellsFor each cell in the current level compute the confidenceinterval
8/7/2019 07-cluster analysis
http://slidepdf.com/reader/full/07-cluster-analysis 56/60
February 24, 2011 Data Mining: Concepts and Techniques 56
Comments on STING
Remove the irrelevant cells from further considerationWhen finish examining the current layer, proceed to thenext lower levelRepeat this process until the bottom layer is reachedAdvantages:
Query-independent, easy to parallelize, incrementalupdateO(K) , where K is the number of grid cells at the lowest level
Disadvantages:All the cluster boundaries are either horizontal orvertical, and no diagonal boundary is detected
8/7/2019 07-cluster analysis
http://slidepdf.com/reader/full/07-cluster-analysis 57/60
February 24, 2011 Data Mining: Concepts and Techniques 57
WaveCluster: Clustering by Wavelet Analysis (1998)
Sheikholeslami, Chatterjee, and Zhang (VLDB 98)A multi-resolution clustering approach which applies wavelet transform to the feature space
How to apply wavelet transform to find clusters
Summarizes the data by imposing a multidimensional gridstructure onto data space
These multidimensional spatial data objects are represented in an-dimensional feature space
Apply wavelet transform on feature space to find the denseregions in the feature space
Apply wavelet transform multiple times which result in clusters at different scales from fine to coarse
8/7/2019 07-cluster analysis
http://slidepdf.com/reader/full/07-cluster-analysis 58/60
February 24, 2011 Data Mining: Concepts and Techniques 58
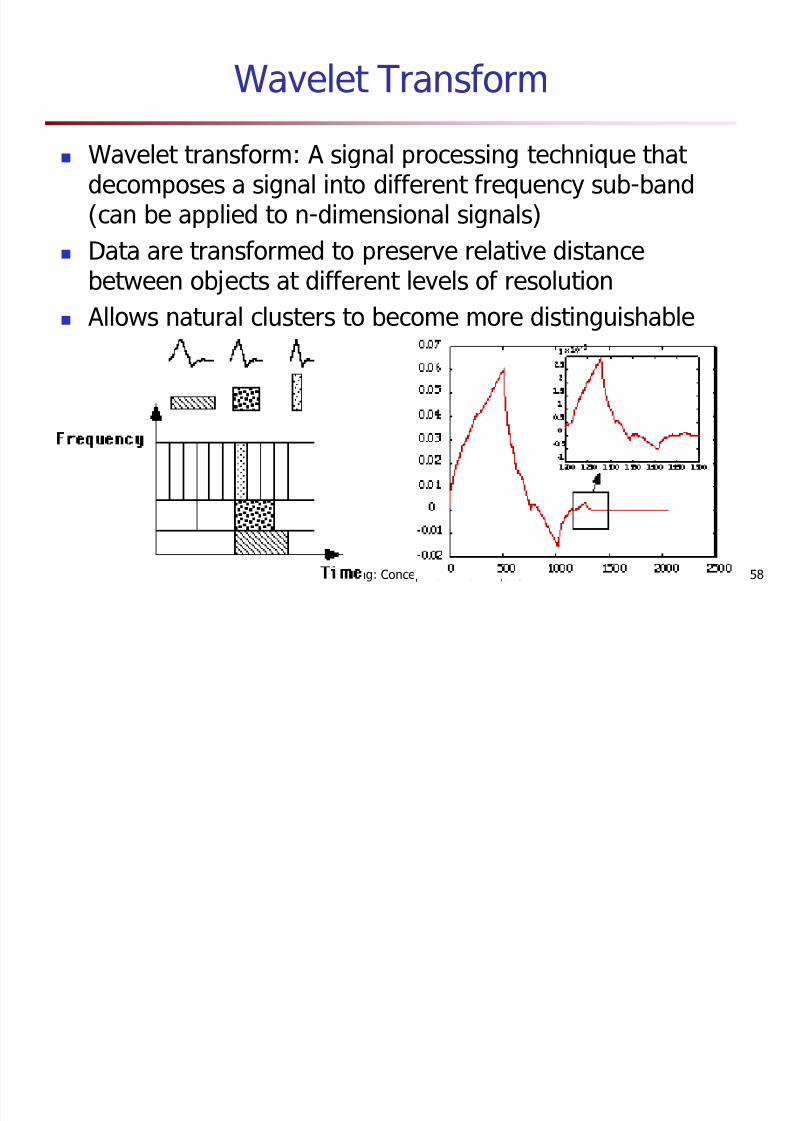
Wavelet Transform
Wavelet transform: A signal processing technique that decomposes a signal into different frequency sub-band(can be applied to n-dimensional signals)Data are transformed to preserve relative distance
between objects at different levels of resolutionAllows natural clusters to become more distinguishable
8/7/2019 07-cluster analysis
http://slidepdf.com/reader/full/07-cluster-analysis 59/60
February 24, 2011 Data Mining: Concepts and Techniques 59
The WaveCluster Algorithm
Input parameters# of grid cells for each dimensionthe wavelet, and the # of applications of wavelet transform
Why is wavelet transformation useful for clustering?Use hat-shape filters to emphasize region where points cluster,but simultaneously suppress weaker information in theirboundaryEffective removal of outliers, multi-resolution, cost effective
Major features:Complexity O(N)Detect arbitrary shaped clusters at different scalesNot sensitive to noise, not sensitive to input orderOnly applicable to low dimensional data
Both grid-based and density-based
8/7/2019 07-cluster analysis
http://slidepdf.com/reader/full/07-cluster-analysis 60/60
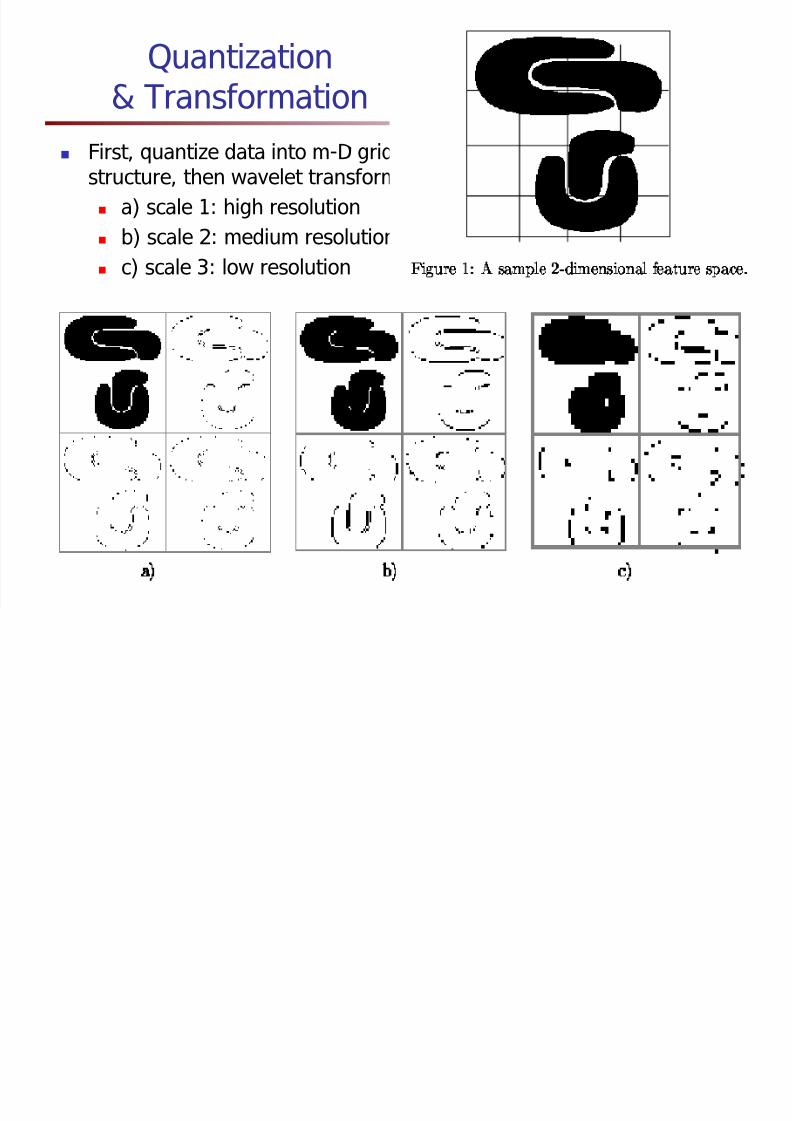
Quantization& Transformation
First, quantize data into m-D gridstructure, then wavelet transform
a) scale 1: high resolutionb) scale 2: medium resolutionc) scale 3: low resolution