Embed Size (px)
Citation preview
07Agriculture
and forestry
Neuchâtel 2020
Agriculture and foodPocket statistics 2020
2020

Published by : Federal Statistical Office (FSO)
Information: [email protected], Tel. 058 467 24 39
Editor : Sibylle Meyre, FSO
Series: Swiss Statistics
Topic : 07 Agriculture and Forestry
Original text : German
Translation: FSO language services
Layout : DIAMSection,Prepress / Print
Graphics: DIAMSection,Prepress / Print
Online: www.statistics.admin.ch
Print : www.statistics.admin.ch Federal Statistical Office, CH-2010 Neuchâtel, [email protected], tel. +41 58 463 60 60 Printed in Switzerland
Copyright : FSO, Neuchâtel 2020 Reproduction with mention of source authorised (except for commercial purposes).
FSO number : 1112-2000

Data relating to the graphs can be found at :
www.statistik.ch R Look for statistics R 07 – Agriculture and Forestry R Farming
www.statistik.ch R Search statistics R07 – Agriculture and Forestry R Food
1 Overview 4
2 Context 5
3 Agricultural structures 6
4 Primary production 10
5 Food industry, trade, catering 14
6 Consumption 16
7 Environment 18
8 International comparisons 20
9 Key cantonal figures 22
Would you like more information? 23
Table of contents

4
1
Primary food production
Consumers8.5 million people
Restaurants, tearooms, bars, canteens and caterers
Workplaces : 26 200 Jobs : 174 500
ExportsFood: CHF 8 900 million
Food retail Workplaces : 11 100
Jobs : 94 600
Food wholesale Workplaces : 3 300
Jobs : 34 100
Food industry Workplaces : 5 100
Jobs : 87 900
Agriculture Workplaces : 51 200
Jobs : 150 900 Utilised area : 10 500 km2
Fishing and aquaculture Workplaces : 200
Jobs : 500
The food supply chain in Switzerland, 2017 1
ImportsFood: CHF 11 100 million
domestic food flows food flows with the rest of the world
Sources: FCA – Foreign trade statistics; © FSO 2020 FSO – STATENT, STATPOP, Farm structure survey
1 workplaces and jobs, 2017: provisional
1 Overview

5
2
Gross self-sufficiency rate of 59%Since the early 20th century, Switzerland’s resident population has grown by a factor of 2.6 to over 8.5 million (2018). At the same time, breeding and technical progress in agriculture has seen food production increase. This has meant that 60% of food consumption (in terms of usable energy) has been covered by domestic production over the past 20 years. In 2017 the gross self-sufficiency rate was 59%. With regard to livestock products, domestic production also de-pends on imported fodder. Net self-sufficiency (2017: 52%) includes only food produced with domestic fodder.
Source: SFU – Food balance sheet © FSO 2020
Self-sufficiency rate
By usable energy
0%
20%
40%
60%
80%
100%
120%
1990 1995 2000 2005 2010 2017
gross foodstuffs of animalorigingross total foodstuffsnet total foodstuffs1
foodstuffs of plant origin
1 excluding animal production based on imported feedp provisional
new calculation method since 2007
p
2 Context

6
3
Farms
Thousands of farms
© FSO 2020Source: FSO – Farm structure survey
0
20
40
60
80
100
120
1975 1980 1985 1990 1995 2000 2005 2010 2019
organic farms
conventional farms
Farms by size
Utilised agricultural area per farm
© FSO 2020Source: FSO – Farm structure survey
0%
20%
40%
60%
80%
100%
1975 1980 1985 1990 1995 2000 2005 2010 2019
0–5 ha5–10 ha10–20 ha20–30 ha30–50 ha50+
Size classes in hectares
3 Agricultural structures

7
3
Farms continue to increase in sizeThenumberof farmsdeclinedfrom111 302 in1975to50 038 in2019. While the number of conventional farms has fallen, organic farming has gained in importance since the 1990s. The number of organic farms rose from 900 in 1990 to 7284 in 2019.
In2019,farmshadanaverageutilisedagriculturalareaof21 hec-tares. That was almost twice as much as in 1975. As a result, the number of large farms with 50 or more hectares increased. These 2900largefarms(6%ofallfarms)hadalmost205 000hectaresofutilised agricultural area (20% of the total utilised agricultural area).
Source: FSO – Vocational education and training statistics (SBG–SFPI) © FSO 2020
Education and training in crop and livestock farming
Number of vocational qualifications
0200400600800
1 0001 2001 400
1990 1994 1998 2002 2006 2010 2014 2018
VET farmer (diploma)VET agriculturalpractician (certificate)
Federal VET DiplomaFederal VET Certificate

8
3
Excluding alpine areas
grasslandcerealsother arable landoilseedspotatoes, sugar and fodder beetpermanent cropsother utilised agricultural area
70.2%
13.6%
6.8%
Utilised agricultural area, 2019
Source: FSO – Farm structure survey © FSO 2020
Total area: 1 044 000 ha
2.9%2.8% 2.3% 1.5%
Oilseed for edible vegetable oil
Hectares
© FSO 2020Source: FSO – Farm structure survey
05 000
10 00015 00020 00025 00030 00035 000
1996 1998 2000 2002 2004 2006 2008 2010 2012 2014 2016 2019
soyaoilseed rape for ediblevegetable oil
sunflowers for edible vegetable oil

9
3
Grassland accounts for 70% of the utilised agricultural areaIn 2019, the utilised agricultural area measured some 1 million hec-tares.Ofthese,730 000hectaresweregrassland.Thiswasfollowedbycereals(140 000ha),themostimportantarablecrop.Thetotalarea used to grow oilseed are increasing in size.
The number of cows is fallingCattle numbers fell by 13% between 1999 and 2019 to 1.5 million. In2019,thenumberofcowswasroughly680 000,thelowestvaluesince 1996. The number of pigs was roughly 1.4 million in 2019.
Source: FSO – Farm structure survey © FSO 2020
Numbers of livestock
Thousands
0
500
1 000
1 500
2 000
1996 2000 2004 2008 2012 2016 2019
total cattle
cowssheep and goats
pigs
From 2015, reference day has been moved from early May to 1st January.
10
4
wheatbarleygrain maizetriticalespelt, rye, oats and meslin grain
emmer, one-grained wheat, rice,millet, buckwheat
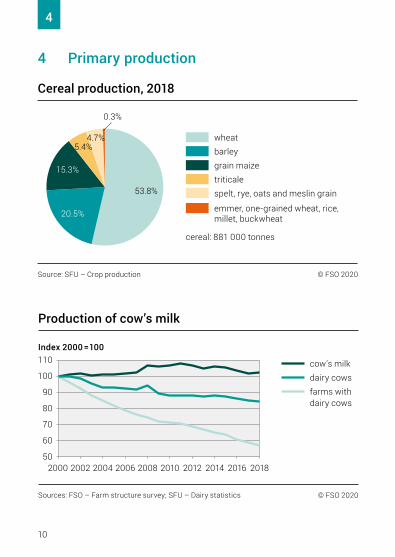
Cereal production, 2018
Source: SFU – Crop production © FSO 2020
cereal: 881 000 tonnes
15.3%
5.4%4.7%
0.3%
53.8%
20.5%
Sources: FSO – Farm structure survey; SFU – Dairy statistics © FSO 2020
50
60
70
80
90
100
110
2000 2002 2004 2006 2008 2010 2012 2014 2016 2018
dairy cowsfarms withdairy cows
cow’s milk
Production of cow’s milk
Index 2000 =100
4 Primary production
11
4
In terms of area used, wheat is the main cereal cropIn2018,around881 000tonnesofcerealwereproduced,almost10%less than in the previous year. Wheat accounted for just over half of the cereal yield. Cereal may be used for diverse purposes, whether for human consumption in the form of bread, pasta, grains and flakes (muesli) or as animal food. It may also be used in the production of beer and starch and also as seeds.
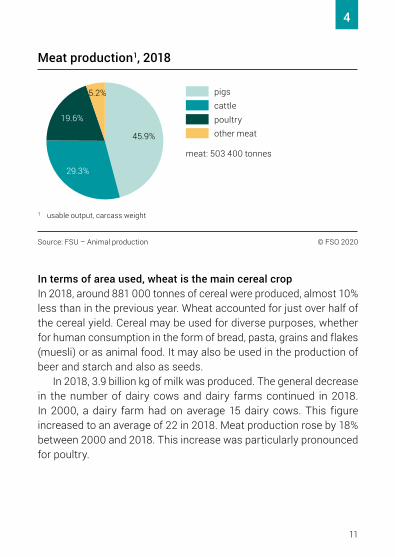
In 2018, 3.9 billion kg of milk was produced. The general decrease in the number of dairy cows and dairy farms continued in 2018. In 2000, a dairy farm had on average 15 dairy cows. This figure increased to an average of 22 in 2018. Meat production rose by 18% between 2000 and 2018. This increase was particularly pronounced for poultry.
pigscattlepoultryother meat45.9%
29.3%
19.6%
5.2%
Meat production1, 2018
Source: FSU – Animal production © FSO 2020
meat: 503 400 tonnes
1 usable output, carcass weight

12
4
milkcattlepigspoultry and eggsother animal output
special cropsarable cropsforage crops
agricultural servicesnon-agricultural secondaryactivities (non-separable)
20.3%
12.9%
8.0%
5.6%24.7%
7.1%
9.4%
7.1%4.1%
Total output of agriculture, 2018p
Source: FSO – Economic accounts for agriculture © FSO 2020
Total: CHF 10.7 billion Animal production
Crop production
Other0.8%
p provisional
Source: FSO – Economic accounts for agriculture © FSO 2020
050
100150200250
1985 1990 1995 2000 2005 2010 2015 2018
animal outputcrop output
total output
non agriculturalsecondaryactivities
agricultural services
Output of agriculture
To current prices – Index 1985 =100
Output to basic prices includes subsidies on productsand excludes taxes on products.1985–2016: definitive, 2017: semi definitive, 2018: provisional
13
4
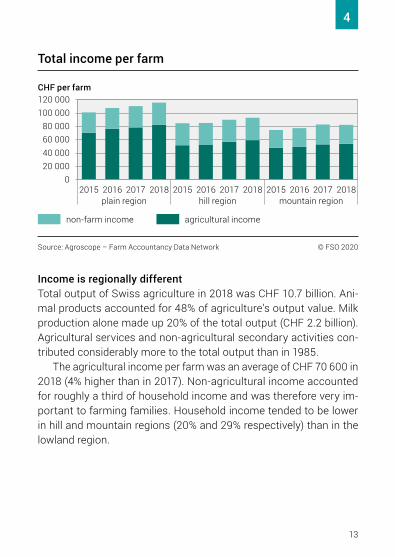
Income is regionally differentTotal output of Swiss agriculture in 2018 was CHF 10.7 billion. Ani-mal products accounted for 48% of agriculture’s output value. Milk production alone made up 20% of the total output (CHF 2.2 billion). Agricultural services and non-agricultural secondary activities con-tributed considerably more to the total output than in 1985.
TheagriculturalincomeperfarmwasanaverageofCHF70 600 in2018 (4% higher than in 2017). Non-agricultural income accounted for roughly a third of household income and was therefore very im-portant to farming families. Household income tended to be lower in hill and mountain regions (20% and 29% respectively) than in the lowland region.
Total income per farm
CHF per farm
© FSO 2020Source: Agroscope – Farm Accountancy Data Network
plain region hill region mountain region
020 00040 00060 00080 000
100 000120 000
2015 2016 2017 2018 2015 2016 2017 2018 2015 2016 2017 2018
agricultural incomenon-farm income
14
5
–3 000 –2 000 –1 000 0 1 000 2 000 3 000
fats and oils
feed
milk, eggs, honey
miscellaneous foodpreparations
coffee, tea, spices
sugar, confectionary and cocoa
cereals, products of the milling industry and their preparations
meat, fish, crustaceans,molluscs and their preparations
drinks and alcoholic beverages
fruit, vegetables and their preparations
imports exports
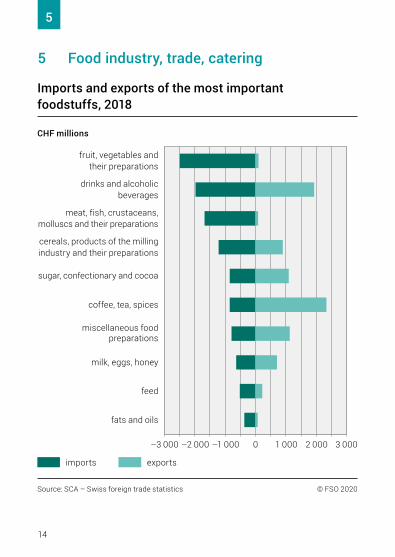
Imports and exports of the most important foodstuffs, 2018
CHF millions
© FSO 2020Source: SCA – Swiss foreign trade statistics
5 Food industry, trade, catering
15
5
Fruit and vegetables are the most commonly imported food-stuffsIn 2018, fruit and vegetables were the most commonly imported agri-cultural products in terms of value. The most common exports were not cheese or chocolate, but beverages containing water, and coffee.
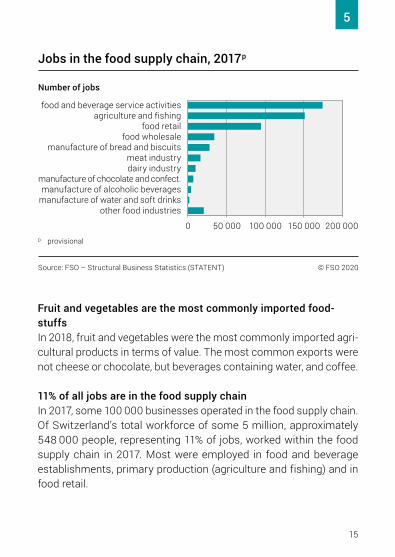
11% of all jobs are in the food supply chainIn2017,some100 000businessesoperatedinthefoodsupplychain.Of Switzerland’s total workforce of some 5 million, approximately 548 000people,representing11%ofjobs,workedwithinthefoodsupply chain in 2017. Most were employed in food and beverage establishments, primary production (agriculture and fishing) and in food retail.
Jobs in the food supply chain, 2017p
Source: FSO – Structural Business Statistics (STATENT) © FSO 2020
p provisional
0 50 000 100 000 150 000 200 000
other food industriesmanufacture of water and soft drinksmanufacture of alcoholic beverages
manufacture of chocolate and confect.dairy industrymeat industry
manufacture of bread and biscuitsfood wholesale
food retailagriculture and fishing
food and beverage service activities
Number of jobs

16
6
Consumption of selected foods, 2017p
Source: SFU – Food balance sheet © FSO 2020
p provisional
0 50 100 150 200 250
wine
sugar
potatoes
meat
cereals
vegetables
fruit
milk and dairy products
kg of raw product per head per year
cereal productsmilk, dairy products, eggssugarvegetable fats, oilspotatoes, starches, vegetables, fruit, oilseedmeatother food
2 623
1 998
1 8741 816
1 338
1 199
1 964
Food consumption in energy, 2017
Source: SFU – Food balance sheet
food total: 12 812 kJ
kJ per head per day
© FSO 2020
6 Consumption

17
6
Households spend 12% of their budget on foodInSwitzerland,dietaryenergysupplywas12 800kJpercapitaperday in 2017, taking account of waste (e. g. unsold or spoilt food, peel-ings). The target range for daily energy intake for an adult person is between7500and10 500kJ.
In 2017, approximately 842 kg of food were consumed per person. 530 kg were from plant-based and 312 kg from animal production.
In2017householdsspent roughly12%of theirbudget, i. e.onaverage CHF 1200 per month on food, including meals and drinks in restaurants. At approximately CHF 134 per month, meat was the larg-est food expenditure item, followed by the group “bread and cereals”.
meatbread and cerealsmilk, cheese, eggsvegetablesfruitsauces, salt, spices, soupsand other food productssugar, honey, chocolate and confectioneryfishoils and fats
23.0%
16.4%
15.9%
13.3%
10.2%
7.6%
7.0%
Household consumption expenditure for food, 2017
Source. FSO – Household Budget Survey © FSO 2020
average number of persons per household: 2.2
4.2% 2.4%

18
7
Source: FSO – Environmental accounting
0% 5% 10% 15% 20% 25%
agriculture,forestry
and fishing
manufacture offood products
cateringcarbon dioxide(CO2) fossilmethane (CH4)Nitrous oxide (N2O)synthetic gases
© FSO 2020
Greenhouse gas emissions from the food supply chain, 2017Proportion of total greenhouse gas emissions produced by the economy
Nitrogen balance of agricultural land, 20171
Source: FSO – Nitrogen balance © FSO 2020
Thousands of tonnes
–200
–100
0
100
200
300
input output balance
1 according to the Organisation for Economic Co-operation and Development (OECD) method
Amounts of nitrogen inputs and uptake from agricultural soil
atmospheric depositionbiological fixationinorganic and organic fertilisers(excluding manure)
manure nitrogen uptakefrom forage cropsfrom other crops
nitrogen surplus=100,000 tonnes
7 Environment

19
7
Nitrogen surplus continuesThe sectors of the food supply chain caused 24% of the greenhouse gas emissions generated by the economy as a whole in 2017. The largest share of the total methane and nitrous oxide emissions were caused by agriculture, in particular from cattle and fertilisers.
Nitrogen can become a pollutant in the environment (as ammonia in the air or as nitrate in groundwater). In the 1990s, agriculture was responsible for an annual nitrogen surplus of over 80 kg per hectare. Since then it has declined and in 2017 was approximately 66 kg per hectare.
In 2018, a total of 2050 tonnes of pesticides were sold.
0
500
1 000
1 500
2 000
2 500
2008 2009 2010 2011 2012 2013 2014 2015 2016 2017 2018
fungicides and bactericidesherbicidesinsecticides and acaricides
plant growth regulatorsmolluscicidesother plant protection products
Sales of plant protection products
Tonnes of active substances
© FSO 2020Source: FOAG

20
8
Utilised agricultural area per capita, 2016
Source: Eurostat, FSO © FSO 2020
m2 per capita
0 1 000 2 000 3 000 4 000 5 000 6 000
NetherlandsSwitzerland
GermanyItaly
United KingdomAustriaPolandFrance
DenmarkHungary
Spain
Organic agriculture, 2018
0% 5% 10% 15% 20% 25%
United KingdomNetherlands
PolandHungary
FranceGermany
EU28Spain
DenmarkItaly
SwitzerlandAustria
Source: Eurostat – Farm structure survey © FSO 2020
Share of organically farmed utilised agricultural area
8 International comparisons

21
8
In European comparison, Switzerland’s per capita agricultural area is smallSwitzerland, like the Netherlands, is among the European countries that have a small utilised agricultural area per person. The share of the utilised agricultural area that is organically farmed, however, is twice the European average. Austria is the leader in organic farming.
In 2018, the United Kingdom, Germany, Switzerland and Austria imported more food than they exported in terms of value. The Netherlands and Spain, in contrast, stand out as export countries in terms of food.
International trade of food, beverages and tobacco, 2018
–30 000 –20 000 –10 000 0 10 000 20 000 30 000
United KingdomGermany
SwitzerlandAustria
ItalyHungaryDenmark
FrancePoland
SpainNetherlands
Source: Eurostat © FSO 2020
Balance in EUR millions
import surplus
export surplus

22
9
Population and workplaces, 2017Cantons Population
in thousandsFarms organic
farms Cheese dairies p
Large super-markets p
(1000–2499m2)
Restau-rants p
ZH 1 504 3 432 388 17 58 3 140
BE 1 031 10 561 1 256 124 50 2 346
LU 407 4 601 393 41 13 765
UR 36 569 58 9 – 128
SZ 157 1 581 165 12 7 491
OW 38 625 183 13 X 92
NW 43 434 76 9 X 94
GL 40 370 88 4 X 130
ZG 125 560 85 6 5 254
FR 315 2 840 184 117 11 680
SO 271 1 358 149 5 8 625
BS 194 13 3 – 6 576
BL 287 902 135 X 10 465
SH 81 572 31 – X 215
AR 55 709 121 9 – 178
AI 16 465 26 X X 63
SG 505 3 993 459 65 23 1 401
GR 198 2 318 1 302 32 11 835
AG 671 3 256 281 6 29 1 208
TG 274 2 569 315 38 14 629
TI 354 1 098 141 14 8 1 350
VD 793 3 628 277 59 34 1 939
VS 341 2 956 323 31 16 1 488
NE 178 807 80 13 5 472
GE 495 382 33 X 23 1 599
JU 73 1021 153 8 4 193
Switzerland 8 484 51 620 6 705 637 344 21 356p provisionalX: Not available due to data protection (between 1 and 3)
Sources:FSO–Farmstructuresurvey,STATENT,STATPOP ©FSO2020
9 Key cantonal figures

23
Visit our website : www.statistik.ch R Look for statistics R07–AgricultureandForestry
Subscribe to our newsletter :www.statistik.ch R Services R Contact R Orders and subscriptions
Additional information:–Agroscope www.agroscope.ch–FederalOfficeforAgriculture(FOAG)
Agricultural reportwww.foag.admin.ch/ www.agrarbericht.ch
–FederalFoodSafetyandVeterinaryOffice (FSVO) www.fsvo.admin.ch
–FederalOfficefortheEnvironment(FOEN) www.umwelt-schweiz.ch
–FederalFinanceAdministration(FFA) www.efv.admin.ch–FederalCustomsAdministration(FCA) www.ezv.admin.ch–Eurostat ec.europa.eu/eurostat–FAO www.fao.org–SwissFarmers’Union(SFU),Agristat www.sbv-usp.ch
Would you like more information?

2
Statisticscounts for you.
www.statistics-counts.ch
Print www.statistics.admin.chFederal Statistical Office CH-2010 Neuchâ[email protected] tel. +41 58 463 60 60
Online www.statistics.admin.ch
FSO number 1112-2000