Embed Size (px)
Citation preview
DISCLOSURE APPENDIX CONTAINS ANALYST CERTIFICATIONS AND THE STATUS OF NON US ANALYSTS. US Disclosure: Credit Suisse does and seeks to do business with companies covered in its research reports. As a result, investors should be aware that the Firm may have a conflict of interest that could affect the objectivity of this report. Investors should consider this report as only a single factor in making their investment decision.
CREDIT SUISSE SECURITIES RESEARCH & ANALYTICS BEYOND INFORMATION®
Client-Driven Solutions, Insights, and Access
08 July 2013
Asia Pacific/Japan
Equity Research
REITs (REIT (Japan)) / OVERWEIGHT
Real estate sector INITIATION
Initiate coverage of third logistics REIT; GLP is
our top pick
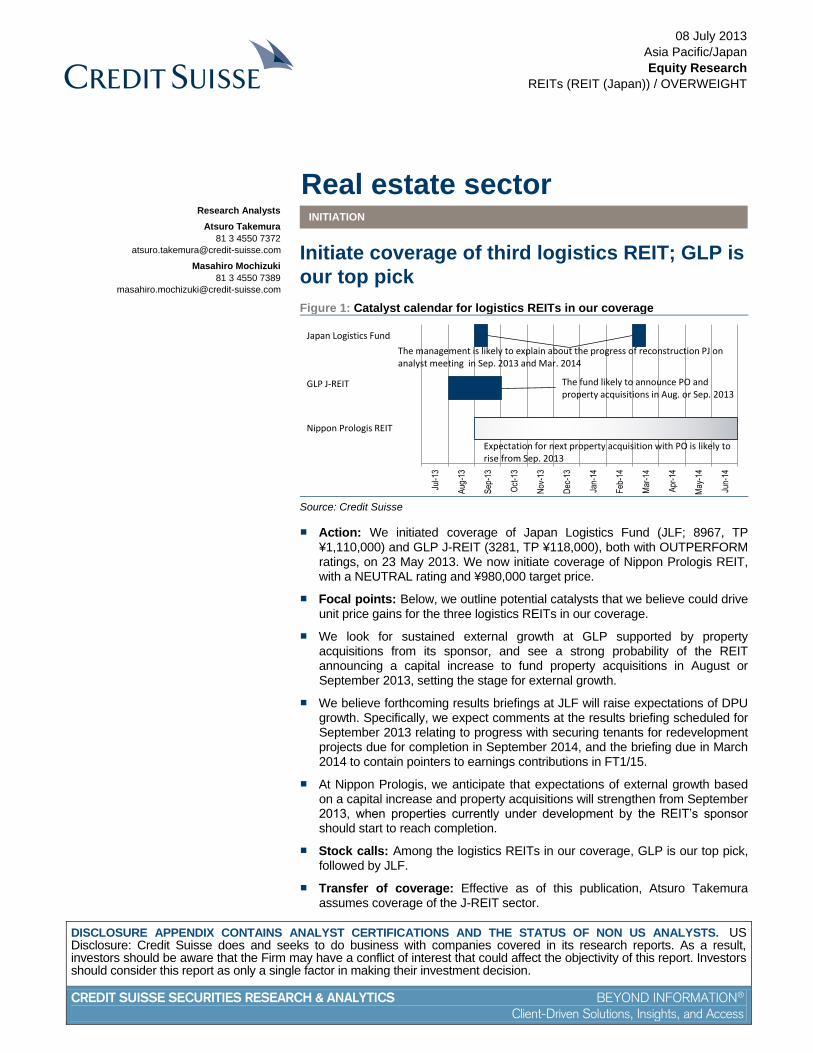
Figure 1: Catalyst calendar for logistics REITs in our coverage
0
0.2
0.4
0.6
0.8
1
1.2
Jul-1
3
Aug
-13
Sep
-13
Oct
-13
Nov
-13
Dec
-13
Jan-
14
Feb
-14
Mar
-14
Apr
-14
May
-14
Jun-
14
The fund likely to announce PO and property acquisitions in Aug. or Sep. 2013
Japan Logistics Fund
GLP J-REIT
Nippon Prologis REIT
The management is likely to explain about the progress of reconstruction PJ on analyst meeting in Sep. 2013 and Mar. 2014
Expectation for next property acquisition with PO is likely to rise from Sep. 2013
Source: Credit Suisse
■ Action: We initiated coverage of Japan Logistics Fund (JLF; 8967, TP ¥1,110,000) and GLP J-REIT (3281, TP ¥118,000), both with OUTPERFORM ratings, on 23 May 2013. We now initiate coverage of Nippon Prologis REIT, with a NEUTRAL rating and ¥980,000 target price.
■ Focal points: Below, we outline potential catalysts that we believe could drive unit price gains for the three logistics REITs in our coverage.
■ We look for sustained external growth at GLP supported by property acquisitions from its sponsor, and see a strong probability of the REIT announcing a capital increase to fund property acquisitions in August or September 2013, setting the stage for external growth.
■ We believe forthcoming results briefings at JLF will raise expectations of DPU growth. Specifically, we expect comments at the results briefing scheduled for September 2013 relating to progress with securing tenants for redevelopment projects due for completion in September 2014, and the briefing due in March 2014 to contain pointers to earnings contributions in FT1/15.
■ At Nippon Prologis, we anticipate that expectations of external growth based on a capital increase and property acquisitions will strengthen from September 2013, when properties currently under development by the REIT’s sponsor should start to reach completion.
■ Stock calls: Among the logistics REITs in our coverage, GLP is our top pick, followed by JLF.
■ Transfer of coverage: Effective as of this publication, Atsuro Takemura assumes coverage of the J-REIT sector.
Research Analysts
Atsuro Takemura
81 3 4550 7372
Masahiro Mochizuki
81 3 4550 7389
08 July 2013
Real estate sector 2
Recommend investment in two logistics REITs Logistics REITs differ from office REITs in that they generally benefit from comparatively
stable rental revenues and offer high distribution yields by virtue of the relatively high
liquidity risk premiums associated with logistics facilities. Although supply of such
properties could increase, we expect this to be offset by the demolition of older properties.
We believe Prologis’ portfolio surpasses that of its rivals in terms of property quality, but
believe that the market is likely to favor REITs offering substantial potential for DPU
growth. Among the logistics REITs in our coverage, we highlight GLP as our top pick, as
we expect the REIT to announce a capital increase to fund property acquisitions in August
or September. We also recommend JLF, as we see potential for accelerated DPU growth.
GLP our top pick among logistics REITs
Since GLP holds preferential negotiation rights for approximately ¥300bn in logistics
facilities owned by its sponsor, the REIT should be able to realize sustained external
growth. We see GLP outperforming the TSE REIT Index around end-FT8/13, when
management will likely announce a capital increase and property acquisitions.
If the REIT does not acquire additional properties, we expect GLP’s EPU to slide 15.0% in
FT8/14 due to the booking of property and other taxes. To soften the blow, we believe the
REIT will likely announce a capital increase to fund property acquisitions around the same
time.
Assuming a capital increase of ¥25bn funding the acquisition of ¥50bn in properties with
an NOI yield of 5.5% (yield after depreciation of 4.0%, borrowing costs 1.0%, management
fee 0.5%), we estimate DPU would increase by ¥159 (equivalent to 9% of our FT8/14 EPU
forecast).
Also recommend investment in JLF
We expect JLF’s work to redevelop portfolio properties (own book redevelopment, OBR)
and new acquisitions accompanied by a higher LTV to boost annualized DPU growth to
4%.
We believe that through OBR, JLF should be able to boost DPU by ¥5,046 over the next
10 years. In addition, we estimate that JLF could add a further ¥3,713 to DPU by raising
LTV from roughly 30% to about 43% over this period. A total increase of ¥8,759 (¥5,046 +
¥3,713) in DPU over the next 10 years implies an annualized DPU growth rate of 4%.
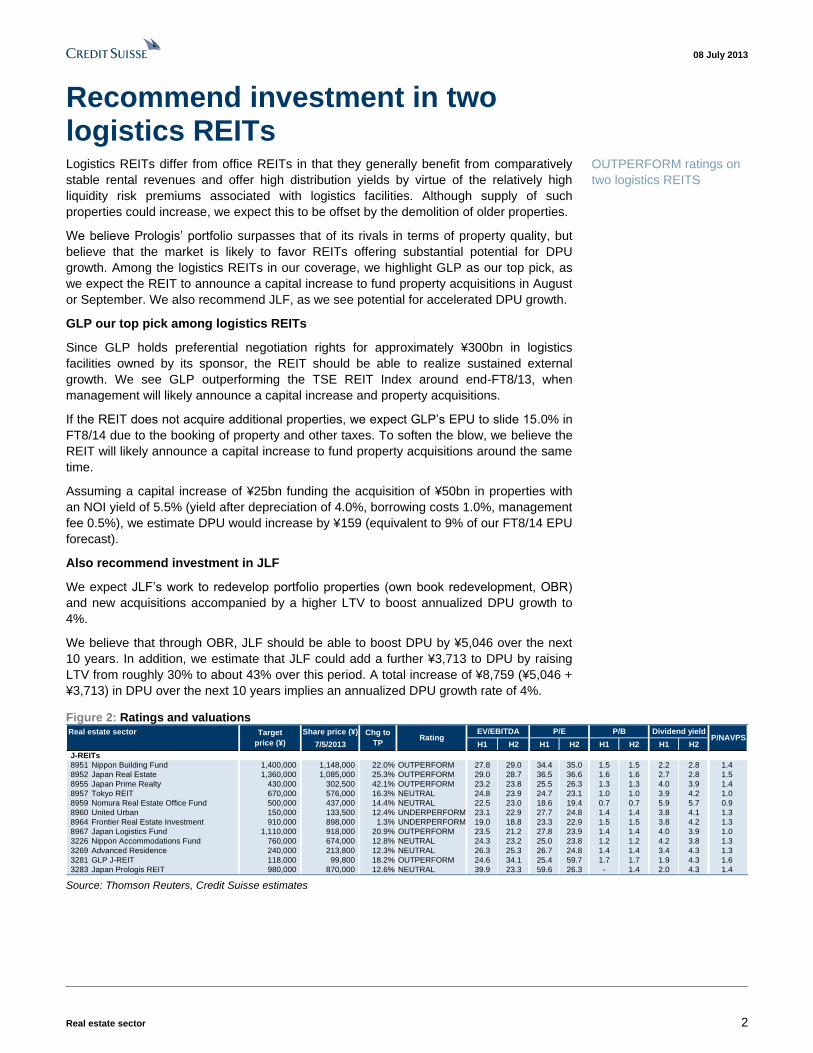
Figure 2: Ratings and valuations Real estate sector Share price (¥)
7/5/2013 H1 H2 H1 H2 H1 H2 H1 H2
J-REITs
8951 Nippon Building Fund 1,400,000 1,148,000 22.0% OUTPERFORM 27.8 29.0 34.4 35.0 1.5 1.5 2.2 2.8 1.4
8952 Japan Real Estate 1,360,000 1,085,000 25.3% OUTPERFORM 29.0 28.7 36.5 36.6 1.6 1.6 2.7 2.8 1.5
8955 Japan Prime Realty 430,000 302,500 42.1% OUTPERFORM 23.2 23.8 25.5 26.3 1.3 1.3 4.0 3.9 1.4
8957 Tokyo REIT 670,000 576,000 16.3% NEUTRAL 24.8 23.9 24.7 23.1 1.0 1.0 3.9 4.2 1.0
8959 Nomura Real Estate Office Fund 500,000 437,000 14.4% NEUTRAL 22.5 23.0 18.6 19.4 0.7 0.7 5.9 5.7 0.9
8960 United Urban 150,000 133,500 12.4% UNDERPERFORM 23.1 22.9 27.7 24.8 1.4 1.4 3.8 4.1 1.3
8964 Frontier Real Estate Investment 910,000 898,000 1.3% UNDERPERFORM 19.0 18.8 23.3 22.9 1.5 1.5 3.8 4.2 1.3
8967 Japan Logistics Fund 1,110,000 918,000 20.9% OUTPERFORM 23.5 21.2 27.8 23.9 1.4 1.4 4.0 3.9 1.0
3226 Nippon Accommodations Fund 760,000 674,000 12.8% NEUTRAL 24.3 23.2 25.0 23.8 1.2 1.2 4.2 3.8 1.3
3269 Advanced Residence 240,000 213,800 12.3% NEUTRAL 26.3 25.3 26.7 24.8 1.4 1.4 3.4 4.3 1.3
3281 GLP J-REIT 118,000 99,800 18.2% OUTPERFORM 24.6 34.1 25.4 59.7 1.7 1.7 1.9 4.3 1.6
3283 Japan Prologis REIT 980,000 870,000 12.6% NEUTRAL 39.9 23.3 59.6 26.3 - 1.4 2.0 4.3 1.4
Dividend yieldP/BP/NAVPS
Target
price (¥)
Chg to
TPRating
EV/EBITDA P/E
Source: Thomson Reuters, Credit Suisse estimates
OUTPERFORM ratings on
two logistics REITS
08 July 2013
Real estate sector 3
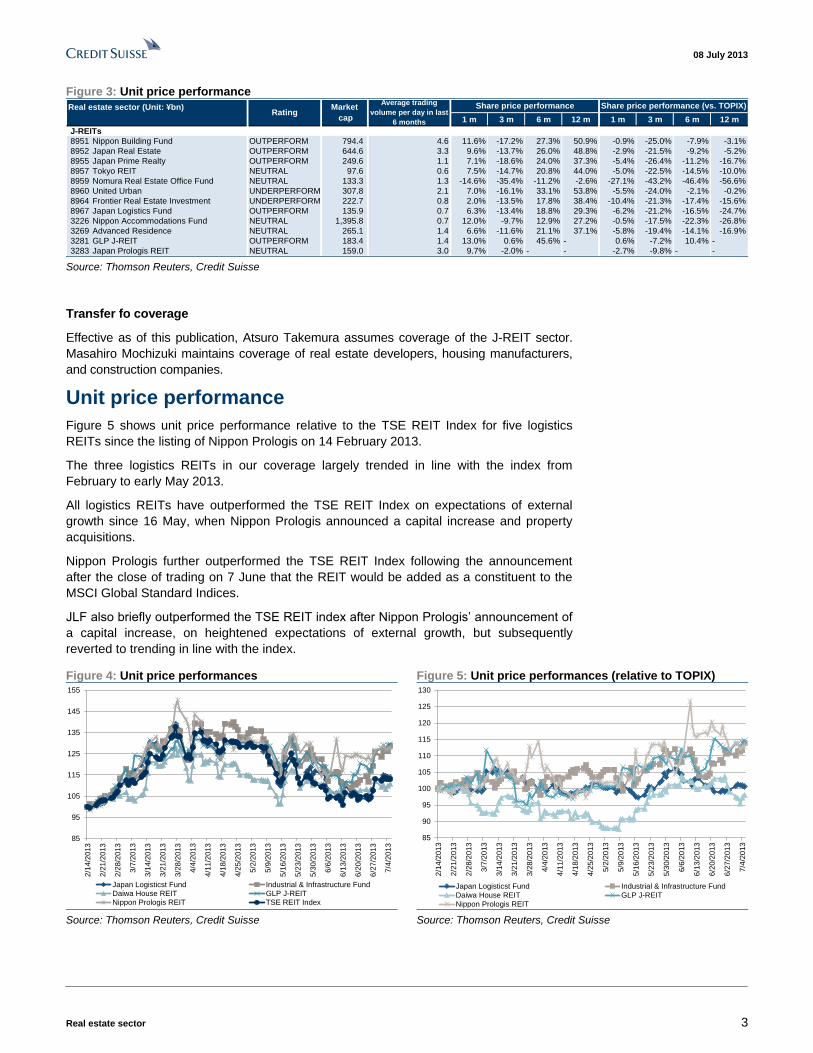
Figure 3: Unit price performance
Real estate sector (Unit: ¥bn)
1 m 3 m 6 m 12 m 1 m 3 m 6 m 12 m
J-REITs
8951 Nippon Building Fund OUTPERFORM 794.4 4.6 11.6% -17.2% 27.3% 50.9% -0.9% -25.0% -7.9% -3.1%
8952 Japan Real Estate OUTPERFORM 644.6 3.3 9.6% -13.7% 26.0% 48.8% -2.9% -21.5% -9.2% -5.2%
8955 Japan Prime Realty OUTPERFORM 249.6 1.1 7.1% -18.6% 24.0% 37.3% -5.4% -26.4% -11.2% -16.7%
8957 Tokyo REIT NEUTRAL 97.6 0.6 7.5% -14.7% 20.8% 44.0% -5.0% -22.5% -14.5% -10.0%
8959 Nomura Real Estate Office Fund NEUTRAL 133.3 1.3 -14.6% -35.4% -11.2% -2.6% -27.1% -43.2% -46.4% -56.6%
8960 United Urban UNDERPERFORM 307.8 2.1 7.0% -16.1% 33.1% 53.8% -5.5% -24.0% -2.1% -0.2%
8964 Frontier Real Estate Investment UNDERPERFORM 222.7 0.8 2.0% -13.5% 17.8% 38.4% -10.4% -21.3% -17.4% -15.6%
8967 Japan Logistics Fund OUTPERFORM 135.9 0.7 6.3% -13.4% 18.8% 29.3% -6.2% -21.2% -16.5% -24.7%
3226 Nippon Accommodations Fund NEUTRAL 1,395.8 0.7 12.0% -9.7% 12.9% 27.2% -0.5% -17.5% -22.3% -26.8%
3269 Advanced Residence NEUTRAL 265.1 1.4 6.6% -11.6% 21.1% 37.1% -5.8% -19.4% -14.1% -16.9%
3281 GLP J-REIT OUTPERFORM 183.4 1.4 13.0% 0.6% 45.6% - 0.6% -7.2% 10.4% -
3283 Japan Prologis REIT NEUTRAL 159.0 3.0 9.7% -2.0% - - -2.7% -9.8% - -
Share price performance Share price performance (vs. TOPIX)Rating
Market
cap
Average trading
volume per day in last
6 months
Source: Thomson Reuters, Credit Suisse
Transfer fo coverage
Effective as of this publication, Atsuro Takemura assumes coverage of the J-REIT sector.
Masahiro Mochizuki maintains coverage of real estate developers, housing manufacturers,
and construction companies.
Unit price performance
Figure 5 shows unit price performance relative to the TSE REIT Index for five logistics
REITs since the listing of Nippon Prologis on 14 February 2013.
The three logistics REITs in our coverage largely trended in line with the index from
February to early May 2013.
All logistics REITs have outperformed the TSE REIT Index on expectations of external
growth since 16 May, when Nippon Prologis announced a capital increase and property
acquisitions.
Nippon Prologis further outperformed the TSE REIT Index following the announcement
after the close of trading on 7 June that the REIT would be added as a constituent to the
MSCI Global Standard Indices.
JLF also briefly outperformed the TSE REIT index after Nippon Prologis’ announcement of
a capital increase, on heightened expectations of external growth, but subsequently
reverted to trending in line with the index.
Figure 4: Unit price performances Figure 5: Unit price performances (relative to TOPIX)
85
95
105
115
125
135
145
155
2/1
4/2
013
2/2
1/2
013
2/2
8/2
013
3/7
/20
13
3/1
4/2
013
3/2
1/2
013
3/2
8/2
013
4/4
/20
13
4/1
1/2
013
4/1
8/2
013
4/2
5/2
013
5/2
/20
13
5/9
/20
13
5/1
6/2
013
5/2
3/2
013
5/3
0/2
013
6/6
/20
13
6/1
3/2
013
6/2
0/2
013
6/2
7/2
013
7/4
/20
13
Japan Logisticst Fund Industrial & Infrastructure FundDaiwa House REIT GLP J-REIT
Nippon Prologis REIT TSE REIT Index
85
90
95
100
105
110
115
120
125
130
2/1
4/2
013
2/2
1/2
013
2/2
8/2
013
3/7
/20
13
3/1
4/2
013
3/2
1/2
013
3/2
8/2
013
4/4
/20
13
4/1
1/2
013
4/1
8/2
013
4/2
5/2
013
5/2
/20
13
5/9
/20
13
5/1
6/2
013
5/2
3/2
013
5/3
0/2
013
6/6
/20
13
6/1
3/2
013
6/2
0/2
013
6/2
7/2
013
7/4
/20
13
Japan Logisticst Fund Industrial & Infrastructure Fund
Daiwa House REIT GLP J-REIT
Nippon Prologis REIT Source: Thomson Reuters, Credit Suisse Source: Thomson Reuters, Credit Suisse
08 July 2013
Real estate sector 4
Characteristics of logistics facilities
Prospective stable rental revenues
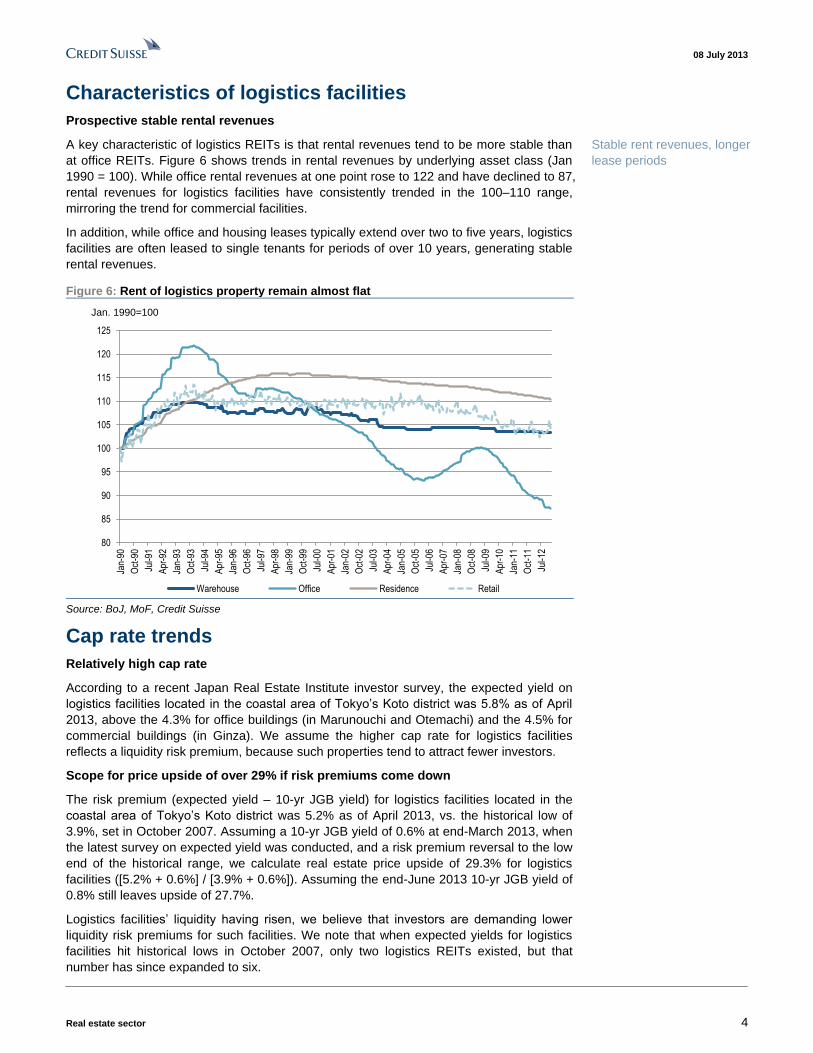
A key characteristic of logistics REITs is that rental revenues tend to be more stable than
at office REITs. Figure 6 shows trends in rental revenues by underlying asset class (Jan
1990 = 100). While office rental revenues at one point rose to 122 and have declined to 87,
rental revenues for logistics facilities have consistently trended in the 100–110 range,
mirroring the trend for commercial facilities.
In addition, while office and housing leases typically extend over two to five years, logistics
facilities are often leased to single tenants for periods of over 10 years, generating stable
rental revenues.
Figure 6: Rent of logistics property remain almost flat
80
85
90
95
100
105
110
115
120
125
Jan-
90
Oct
-90
Jul-9
1
Apr
-92
Jan-
93
Oct
-93
Jul-9
4
Apr
-95
Jan-
96
Oct
-96
Jul-9
7
Apr
-98
Jan-
99
Oct
-99
Jul-0
0
Apr
-01
Jan-
02
Oct
-02
Jul-0
3
Apr
-04
Jan-
05
Oct
-05
Jul-0
6
Apr
-07
Jan-
08
Oct
-08
Jul-0
9
Apr
-10
Jan-
11
Oct
-11
Jul-1
2
Warehouse Office Residence Retail
Jan. 1990=100
Source: BoJ, MoF, Credit Suisse
Cap rate trends
Relatively high cap rate
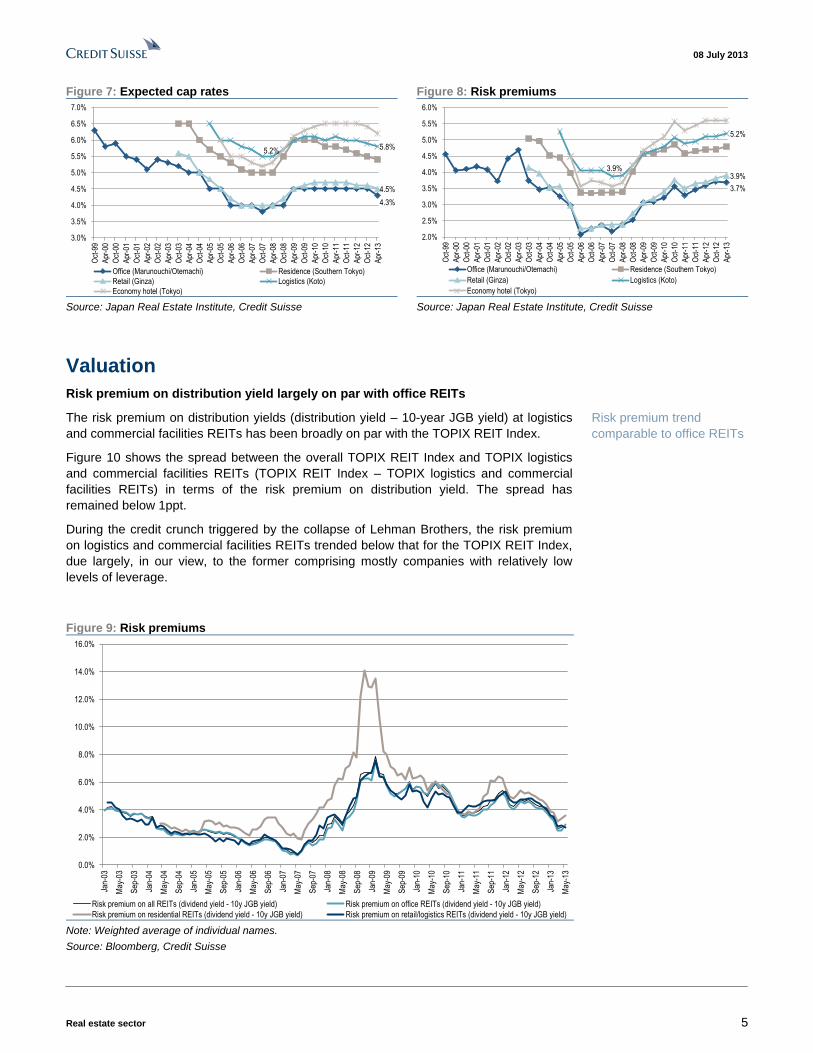
According to a recent Japan Real Estate Institute investor survey, the expected yield on
logistics facilities located in the coastal area of Tokyo’s Koto district was 5.8% as of April
2013, above the 4.3% for office buildings (in Marunouchi and Otemachi) and the 4.5% for
commercial buildings (in Ginza). We assume the higher cap rate for logistics facilities
reflects a liquidity risk premium, because such properties tend to attract fewer investors.
Scope for price upside of over 29% if risk premiums come down
The risk premium (expected yield – 10-yr JGB yield) for logistics facilities located in the
coastal area of Tokyo’s Koto district was 5.2% as of April 2013, vs. the historical low of
3.9%, set in October 2007. Assuming a 10-yr JGB yield of 0.6% at end-March 2013, when
the latest survey on expected yield was conducted, and a risk premium reversal to the low
end of the historical range, we calculate real estate price upside of 29.3% for logistics
facilities ([5.2% + 0.6%] / [3.9% + 0.6%]). Assuming the end-June 2013 10-yr JGB yield of
0.8% still leaves upside of 27.7%.
Logistics facilities’ liquidity having risen, we believe that investors are demanding lower
liquidity risk premiums for such facilities. We note that when expected yields for logistics
facilities hit historical lows in October 2007, only two logistics REITs existed, but that
number has since expanded to six.
Stable rent revenues, longer
lease periods
08 July 2013
Real estate sector 5
Figure 7: Expected cap rates Figure 8: Risk premiums
4.3%
4.5%
5.8%5.2%
3.0%
3.5%
4.0%
4.5%
5.0%
5.5%
6.0%
6.5%
7.0%
Oct
-99
Apr
-00
Oct
-00
Apr
-01
Oct
-01
Apr
-02
Oct
-02
Apr
-03
Oct
-03
Apr
-04
Oct
-04
Apr
-05
Oct
-05
Apr
-06
Oct
-06
Apr
-07
Oct
-07
Apr
-08
Oct
-08
Apr
-09
Oct
-09
Apr
-10
Oct
-10
Apr
-11
Oct
-11
Apr
-12
Oct
-12
Apr
-13
Office (Marunouchi/Otemachi) Residence (Southern Tokyo)
Retail (Ginza) Logistics (Koto)
Economy hotel (Tokyo)
3.7%
3.9%3.9%
5.2%
2.0%
2.5%
3.0%
3.5%
4.0%
4.5%
5.0%
5.5%
6.0%
Oct
-99
Apr
-00
Oct
-00
Apr
-01
Oct
-01
Apr
-02
Oct
-02
Apr
-03
Oct
-03
Apr
-04
Oct
-04
Apr
-05
Oct
-05
Apr
-06
Oct
-06
Apr
-07
Oct
-07
Apr
-08
Oct
-08
Apr
-09
Oct
-09
Apr
-10
Oct
-10
Apr
-11
Oct
-11
Apr
-12
Oct
-12
Apr
-13
Office (Marunouchi/Otemachi) Residence (Southern Tokyo)
Retail (Ginza) Logistics (Koto)
Economy hotel (Tokyo) Source: Japan Real Estate Institute, Credit Suisse Source: Japan Real Estate Institute, Credit Suisse
Valuation
Risk premium on distribution yield largely on par with office REITs
The risk premium on distribution yields (distribution yield – 10-year JGB yield) at logistics
and commercial facilities REITs has been broadly on par with the TOPIX REIT Index.
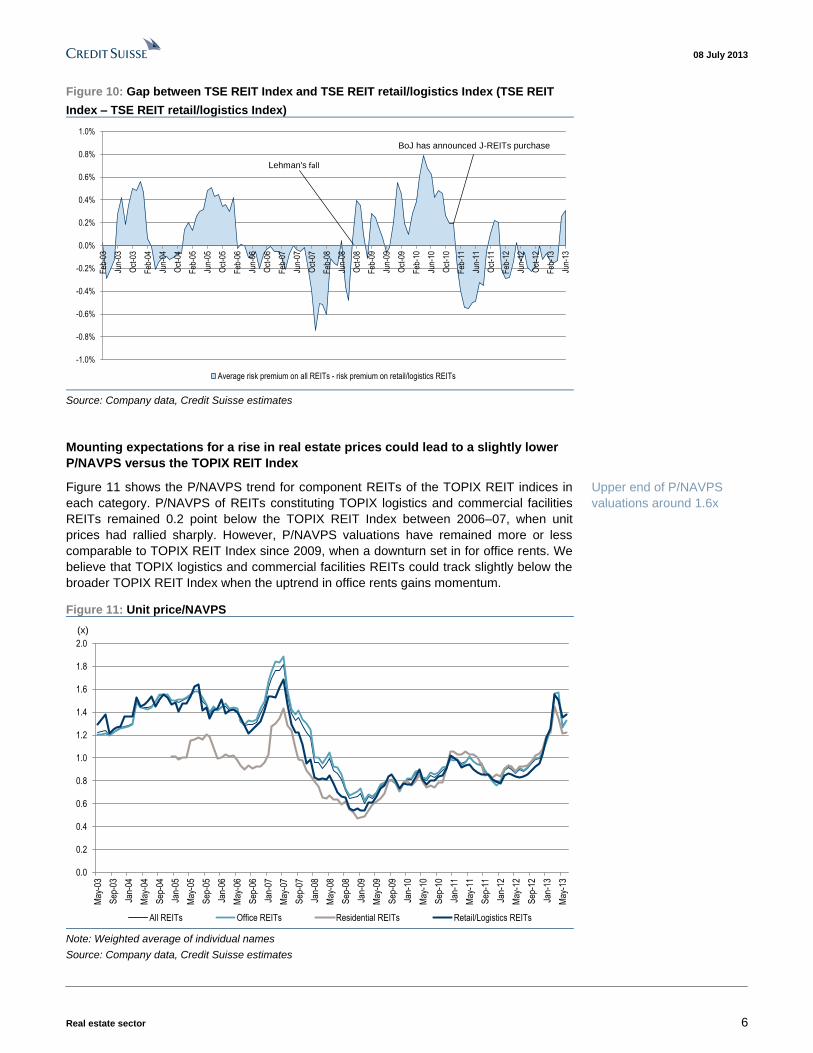
Figure 10 shows the spread between the overall TOPIX REIT Index and TOPIX logistics
and commercial facilities REITs (TOPIX REIT Index – TOPIX logistics and commercial
facilities REITs) in terms of the risk premium on distribution yield. The spread has
remained below 1ppt.
During the credit crunch triggered by the collapse of Lehman Brothers, the risk premium
on logistics and commercial facilities REITs trended below that for the TOPIX REIT Index,
due largely, in our view, to the former comprising mostly companies with relatively low
levels of leverage.
Figure 9: Risk premiums
0.0%
2.0%
4.0%
6.0%
8.0%
10.0%
12.0%
14.0%
16.0%
Jan-
03
May
-03
Sep
-03
Jan-
04
May
-04
Sep
-04
Jan-
05
May
-05
Sep
-05
Jan-
06
May
-06
Sep
-06
Jan-
07
May
-07
Sep
-07
Jan-
08
May
-08
Sep
-08
Jan-
09
May
-09
Sep
-09
Jan-
10
May
-10
Sep
-10
Jan-
11
May
-11
Sep
-11
Jan-
12
May
-12
Sep
-12
Jan-
13
May
-13
Risk premium on all REITs (dividend yield - 10y JGB yield) Risk premium on office REITs (dividend yield - 10y JGB yield)
Risk premium on residential REITs (dividend yield - 10y JGB yield) Risk premium on retail/logistics REITs (dividend yield - 10y JGB yield) Note: Weighted average of individual names.
Source: Bloomberg, Credit Suisse
Risk premium trend
comparable to office REITs
08 July 2013
Real estate sector 6
Figure 10: Gap between TSE REIT Index and TSE REIT retail/logistics Index (TSE REIT
Index – TSE REIT retail/logistics Index)
-1.0%
-0.8%
-0.6%
-0.4%
-0.2%
0.0%
0.2%
0.4%
0.6%
0.8%
1.0%
Feb
-03
Jun-
03
Oct
-03
Feb
-04
Jun-
04
Oct
-04
Feb
-05
Jun-
05
Oct
-05
Feb
-06
Jun-
06
Oct
-06
Feb
-07
Jun-
07
Oct
-07
Feb
-08
Jun-
08
Oct
-08
Feb
-09
Jun-
09
Oct
-09
Feb
-10
Jun-
10
Oct
-10
Feb
-11
Jun-
11
Oct
-11
Feb
-12
Jun-
12
Oct
-12
Feb
-13
Jun-
13
Average risk premium on all REITs - risk premium on retail/logistics REITs
Lehman's fall
BoJ has announced J-REITs purchase
Source: Company data, Credit Suisse estimates
Mounting expectations for a rise in real estate prices could lead to a slightly lower
P/NAVPS versus the TOPIX REIT Index
Figure 11 shows the P/NAVPS trend for component REITs of the TOPIX REIT indices in
each category. P/NAVPS of REITs constituting TOPIX logistics and commercial facilities
REITs remained 0.2 point below the TOPIX REIT Index between 2006–07, when unit
prices had rallied sharply. However, P/NAVPS valuations have remained more or less
comparable to TOPIX REIT Index since 2009, when a downturn set in for office rents. We
believe that TOPIX logistics and commercial facilities REITs could track slightly below the
broader TOPIX REIT Index when the uptrend in office rents gains momentum.
Figure 11: Unit price/NAVPS
0.0
0.2
0.4
0.6
0.8
1.0
1.2
1.4
1.6
1.8
2.0
May
-03
Sep
-03
Jan-
04
May
-04
Sep
-04
Jan-
05
May
-05
Sep
-05
Jan-
06
May
-06
Sep
-06
Jan-
07
May
-07
Sep
-07
Jan-
08
May
-08
Sep
-08
Jan-
09
May
-09
Sep
-09
Jan-
10
May
-10
Sep
-10
Jan-
11
May
-11
Sep
-11
Jan-
12
May
-12
Sep
-12
Jan-
13
May
-13
All REITs Office REITs Residential REITs Retail/Logistics REITs
(x)
Note: Weighted average of individual names
Source: Company data, Credit Suisse estimates
Upper end of P/NAVPS
valuations around 1.6x
08 July 2013
Real estate sector 7
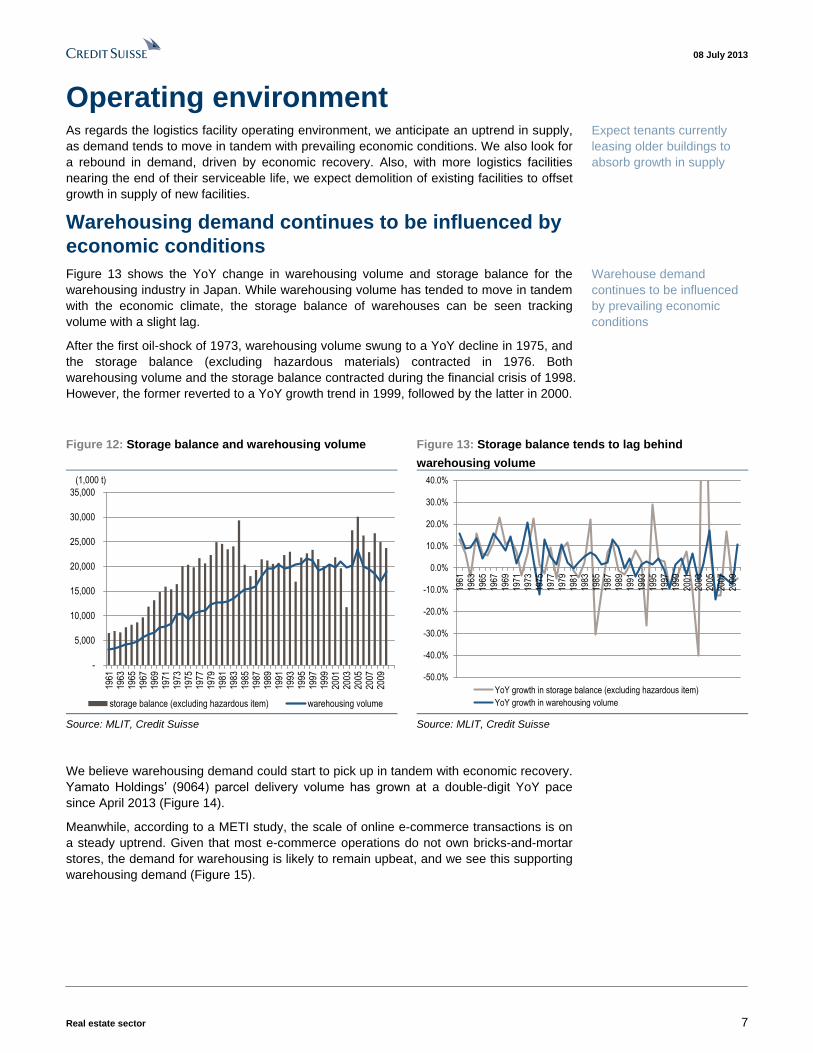
Operating environment As regards the logistics facility operating environment, we anticipate an uptrend in supply,
as demand tends to move in tandem with prevailing economic conditions. We also look for
a rebound in demand, driven by economic recovery. Also, with more logistics facilities
nearing the end of their serviceable life, we expect demolition of existing facilities to offset
growth in supply of new facilities.
Warehousing demand continues to be influenced by
economic conditions
Figure 13 shows the YoY change in warehousing volume and storage balance for the
warehousing industry in Japan. While warehousing volume has tended to move in tandem
with the economic climate, the storage balance of warehouses can be seen tracking
volume with a slight lag.
After the first oil-shock of 1973, warehousing volume swung to a YoY decline in 1975, and
the storage balance (excluding hazardous materials) contracted in 1976. Both
warehousing volume and the storage balance contracted during the financial crisis of 1998.
However, the former reverted to a YoY growth trend in 1999, followed by the latter in 2000.
Figure 12: Storage balance and warehousing volume Figure 13: Storage balance tends to lag behind
warehousing volume
-
5,000
10,000
15,000
20,000
25,000
30,000
35,000
1961
1963
1965
1967
1969
1971
1973
1975
1977
1979
1981
1983
1985
1987
1989
1991
1993
1995
1997
1999
2001
2003
2005
2007
2009
storage balance (excluding hazardous item) warehousing volume
(1,000 t)
-50.0%
-40.0%
-30.0%
-20.0%
-10.0%
0.0%
10.0%
20.0%
30.0%
40.0%
1961
1963
1965
1967
1969
1971
1973
1975
1977
1979
1981
1983
1985
1987
1989
1991
1993
1995
1997
1999
2001
2003
2005
2007
2009
YoY growth in storage balance (excluding hazardous item)
YoY growth in warehousing volume
Source: MLIT, Credit Suisse Source: MLIT, Credit Suisse
We believe warehousing demand could start to pick up in tandem with economic recovery.
Yamato Holdings’ (9064) parcel delivery volume has grown at a double-digit YoY pace
since April 2013 (Figure 14).
Meanwhile, according to a METI study, the scale of online e-commerce transactions is on
a steady uptrend. Given that most e-commerce operations do not own bricks-and-mortar
stores, the demand for warehousing is likely to remain upbeat, and we see this supporting
warehousing demand (Figure 15).
Expect tenants currently
leasing older buildings to
absorb growth in supply
Warehouse demand
continues to be influenced
by prevailing economic
conditions

08 July 2013
Real estate sector 8
Figure 14: Number of parcels handed by Yamato HDS
surged since April 2013
Figure 15: Market size for e-commerce expanding
12.9%
11.4%
-10.0%
-5.0%
0.0%
5.0%
10.0%
15.0%
Jan-
05
Jul-0
5
Jan-
06
Jul-0
6
Jan-
07
Jul-0
7
Jan-
08
Jul-0
8
Jan-
09
Jul-0
9
Jan-
10
Jul-1
0
Jan-
11
Jul-1
1
Jan-
12
Jul-1
2
Jan-
13Total number of parcels handled by Yamato HDS
3,456 3,491
5,344
6,089 6,696
7,788
8,459
-
1,000
2,000
3,000
4,000
5,000
6,000
7,000
8,000
9,000
2005 2006 2007 2008 2009 2010 2011
Market size of e-commerce
(Yen bn.)
Source: Yamato Holdings, Credit Suisse Source: METI, Credit Suisse
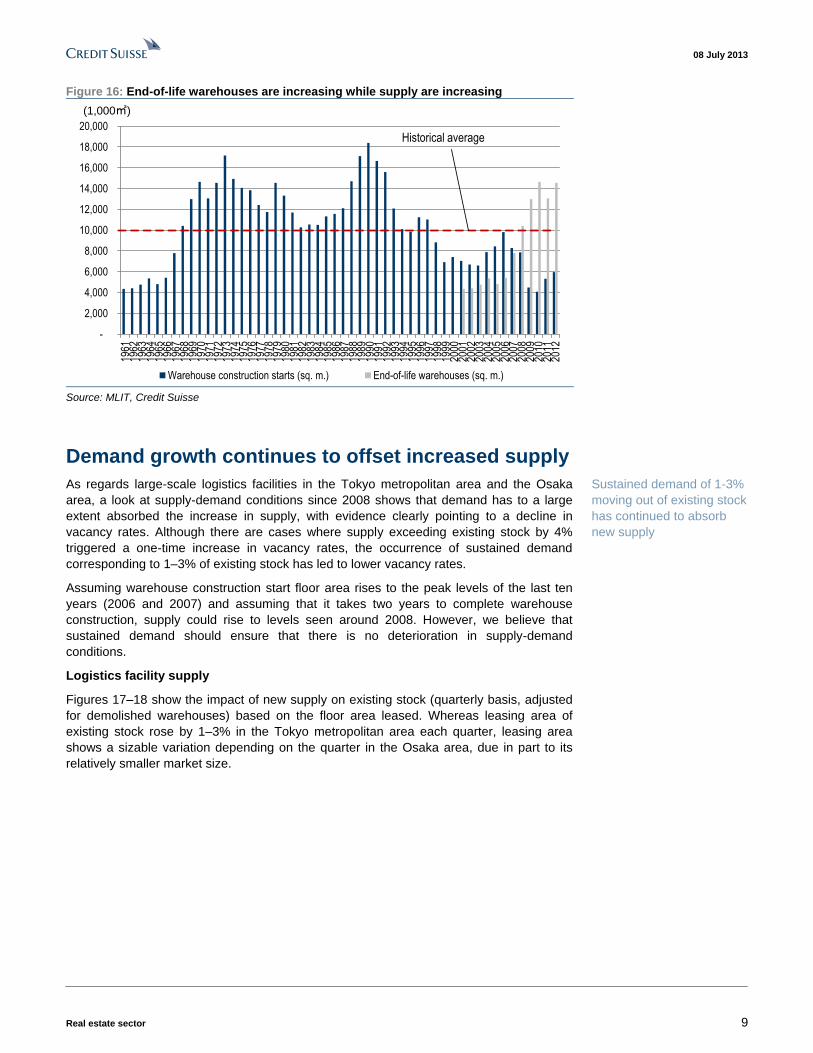
Increased demolition of old facilities should offset
growth in new supply
We expect supply of logistics facilities to increase. However, given that the number of
existing facilities reaching the end of their serviceable lives is also likely to rise, we see
little impact on the relatively newer and higher-grade properties owned by J-REITs.
As a result of both domestic and overseas developers stepping up investment in logistics
facilities in recent years, the floor area of warehouse construction starts making up new
supply has been on an uptrend after bottoming out in 2010 (Figure 16). However, 6mn
square meters of floor area in 2012 is less than a third of the area recorded in the peak
year of 1990, and barely two-thirds of the average for the last 50 years (10mn square
meters).
Moreover, we expect an increasing number of logistics facilities to reach the end of their
serviceable lives. The serviceable life of warehouses built with reinforced concrete (RC)
and steel-reinforced concrete (SRC), which constitute the bulk of supply, is 38 years.
Assuming their completion takes two years, such warehouses therefore reach the end of
their serviceable life in 40 years from the start of construction. As total warehouse
construction start floor area rose rapidly in the 1960s through the early 1970s, the number
of warehouses reaching the end of their serviceable lives is also on an uptrend.
Growing number of logistics
facilities reaching end of
serviceable life
08 July 2013
Real estate sector 9
Figure 16: End-of-life warehouses are increasing while supply are increasing
-
2,000
4,000
6,000
8,000
10,000
12,000
14,000
16,000
18,000
20,00019
6119
6219
6319
6419
6519
6619
6719
6819
6919
7019
7119
7219
7319
7419
7519
7619
7719
7819
7919
8019
8119
8219
8319
8419
8519
8619
8719
8819
8919
9019
9119
9219
9319
9419
9519
9619
9719
9819
9920
0020
0120
0220
0320
0420
0520
0620
0720
0820
0920
1020
1120
12
Warehouse construction starts (sq. m.) End-of-life warehouses (sq. m.)
(1,000㎡)
Historical average
Source: MLIT, Credit Suisse
Demand growth continues to offset increased supply
As regards large-scale logistics facilities in the Tokyo metropolitan area and the Osaka
area, a look at supply-demand conditions since 2008 shows that demand has to a large
extent absorbed the increase in supply, with evidence clearly pointing to a decline in
vacancy rates. Although there are cases where supply exceeding existing stock by 4%
triggered a one-time increase in vacancy rates, the occurrence of sustained demand
corresponding to 1–3% of existing stock has led to lower vacancy rates.
Assuming warehouse construction start floor area rises to the peak levels of the last ten
years (2006 and 2007) and assuming that it takes two years to complete warehouse
construction, supply could rise to levels seen around 2008. However, we believe that
sustained demand should ensure that there is no deterioration in supply-demand
conditions.
Logistics facility supply
Figures 17–18 show the impact of new supply on existing stock (quarterly basis, adjusted
for demolished warehouses) based on the floor area leased. Whereas leasing area of
existing stock rose by 1–3% in the Tokyo metropolitan area each quarter, leasing area
shows a sizable variation depending on the quarter in the Osaka area, due in part to its
relatively smaller market size.
Sustained demand of 1-3%
moving out of existing stock
has continued to absorb
new supply

08 July 2013
Real estate sector 10
Figure 17: Net supply/existing stock in Tokyo area Figure 18: Net supply/existing stock in Osaka area
0.0%1.0%2.0%3.0%4.0%5.0%6.0%7.0%8.0%9.0%
2008
3Q
2008
4Q
2009
1Q
2009
2Q
2009
3Q
2009
4Q
2010
1Q
2010
2Q
2010
3Q
2010
4Q
2011
1Q
2011
2Q
2011
3Q
2011
4Q
2012
1Q
2012
2Q
2012
3Q
2012
4Q
2013
1Q
Net supply/total floor
-2.0%
-1.0%
0.0%
1.0%
2.0%
3.0%
4.0%
5.0%
6.0%
7.0%
2008
3Q
2008
4Q
2009
1Q
2009
2Q
2009
3Q
2009
4Q
2010
1Q
2010
2Q
2010
3Q
2010
4Q
2011
1Q
2011
2Q
2011
3Q
2011
4Q
2012
1Q
2012
2Q
2012
3Q
2012
4Q
2013
1Q
Net supply/total floor Note: logistics properties with more than 10,000 sq.m of total floor.
1Q: Feb to Apr; 2Q: May to Jul.; 3Q: Aug to Oct.; 4Q: Nov. to Jan.
Source: Ichigo Real Estate Service, Credit Suisse
Note: logistics properties with more than 10,000 sq.m of total floor.
1Q: Feb to Apr; 2Q: May to Jul.; 3Q: Aug to Oct.; 4Q: Nov. to Jan.
Source: Ichigo Real Estate Service, Credit Suisse
Logistics facility demand
Figures 19–20 show the impact of new demand on existing stock of logistics facilities
(quarterly, leased floor area basis). In both the Tokyo metropolitan area and the Osaka
area, we see evidence for an increase in leasing area equivalent to 1–3% of existing stock
each quarter.
Figure 19: New demand/existing stock in Tokyo area Figure 20: New demand/existing stock in Osaka area
0.0%
1.0%
2.0%
3.0%
4.0%
5.0%
6.0%
7.0%
8.0%
2008
3Q
2008
4Q
2009
1Q
2009
2Q
2009
3Q
2009
4Q
2010
1Q
2010
2Q
2010
3Q
2010
4Q
2011
1Q
2011
2Q
2011
3Q
2011
4Q
2012
1Q
2012
2Q
2012
3Q
2012
4Q
2013
1Q
New demand/total floor
-1.0%
0.0%
1.0%
2.0%
3.0%
4.0%
5.0%
6.0%
2008
3Q
2008
4Q
2009
1Q
2009
2Q
2009
3Q
2009
4Q
2010
1Q
2010
2Q
2010
3Q
2010
4Q
2011
1Q
2011
2Q
2011
3Q
2011
4Q
2012
1Q
2012
2Q
2012
3Q
2012
4Q
2013
1Q
New demand/total floor Note: logistics properties with more than 10,000 sq.m of total floor.
1Q: Feb to Apr; 2Q: May to Jul.; 3Q: Aug to Oct.; 4Q: Nov. to Jan.
Source: Ichigo Real Estate Service, Credit Suisse
Note: logistics properties with more than 10,000 sq.m of total floor.
1Q: Feb to Apr; 2Q: May to Jul.; 3Q: Aug to Oct.; 4Q: Nov. to Jan.
Source: Ichigo Real Estate Service, Credit Suisse
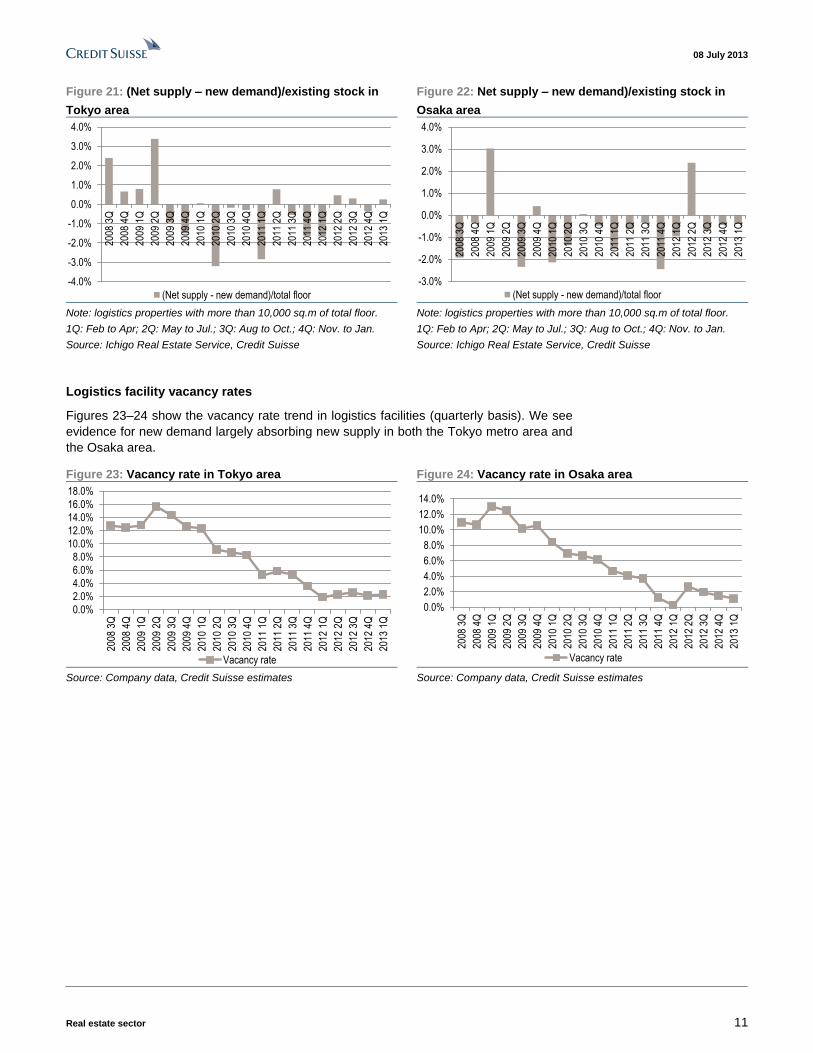
Supply–demand balance in logistics facilities
Figures 21–22 show the impact (quarterly, leased area basis) of excess supply or demand
versus existing stock (new supply – new demand). We see evidence for new demand
largely absorbing new supply in both the Tokyo metro area and the Osaka area.
08 July 2013
Real estate sector 11
Figure 21: (Net supply – new demand)/existing stock in
Tokyo area
Figure 22: Net supply – new demand)/existing stock in
Osaka area
-4.0%
-3.0%
-2.0%
-1.0%
0.0%
1.0%
2.0%
3.0%
4.0%
2008
3Q
2008
4Q
2009
1Q
2009
2Q
2009
3Q
2009
4Q
2010
1Q
2010
2Q
2010
3Q
2010
4Q
2011
1Q
2011
2Q
2011
3Q
2011
4Q
2012
1Q
2012
2Q
2012
3Q
2012
4Q
2013
1Q
(Net supply - new demand)/total floor
-3.0%
-2.0%
-1.0%
0.0%
1.0%
2.0%
3.0%
4.0%
2008
3Q
2008
4Q
2009
1Q
2009
2Q
2009
3Q
2009
4Q
2010
1Q
2010
2Q
2010
3Q
2010
4Q
2011
1Q
2011
2Q
2011
3Q
2011
4Q
2012
1Q
2012
2Q
2012
3Q
2012
4Q
2013
1Q
(Net supply - new demand)/total floor Note: logistics properties with more than 10,000 sq.m of total floor.
1Q: Feb to Apr; 2Q: May to Jul.; 3Q: Aug to Oct.; 4Q: Nov. to Jan.
Source: Ichigo Real Estate Service, Credit Suisse
Note: logistics properties with more than 10,000 sq.m of total floor.
1Q: Feb to Apr; 2Q: May to Jul.; 3Q: Aug to Oct.; 4Q: Nov. to Jan.
Source: Ichigo Real Estate Service, Credit Suisse
Logistics facility vacancy rates
Figures 23–24 show the vacancy rate trend in logistics facilities (quarterly basis). We see
evidence for new demand largely absorbing new supply in both the Tokyo metro area and
the Osaka area.
Figure 23: Vacancy rate in Tokyo area Figure 24: Vacancy rate in Osaka area
0.0%
2.0%
4.0%
6.0%
8.0%
10.0%
12.0%
14.0%
16.0%
18.0%
2008
3Q
2008
4Q
2009
1Q
2009
2Q
2009
3Q
2009
4Q
2010
1Q
2010
2Q
2010
3Q
2010
4Q
2011
1Q
2011
2Q
2011
3Q
2011
4Q
2012
1Q
2012
2Q
2012
3Q
2012
4Q
2013
1Q
Vacancy rate
0.0%
2.0%
4.0%
6.0%
8.0%
10.0%
12.0%
14.0%
2008
3Q
2008
4Q
2009
1Q
2009
2Q
2009
3Q
2009
4Q
2010
1Q
2010
2Q
2010
3Q
2010
4Q
2011
1Q
2011
2Q
2011
3Q
2011
4Q
2012
1Q
2012
2Q
2012
3Q
2012
4Q
2013
1Q
Vacancy rate
Source: Company data, Credit Suisse estimates Source: Company data, Credit Suisse estimates
08 July 2013
Real estate sector 12
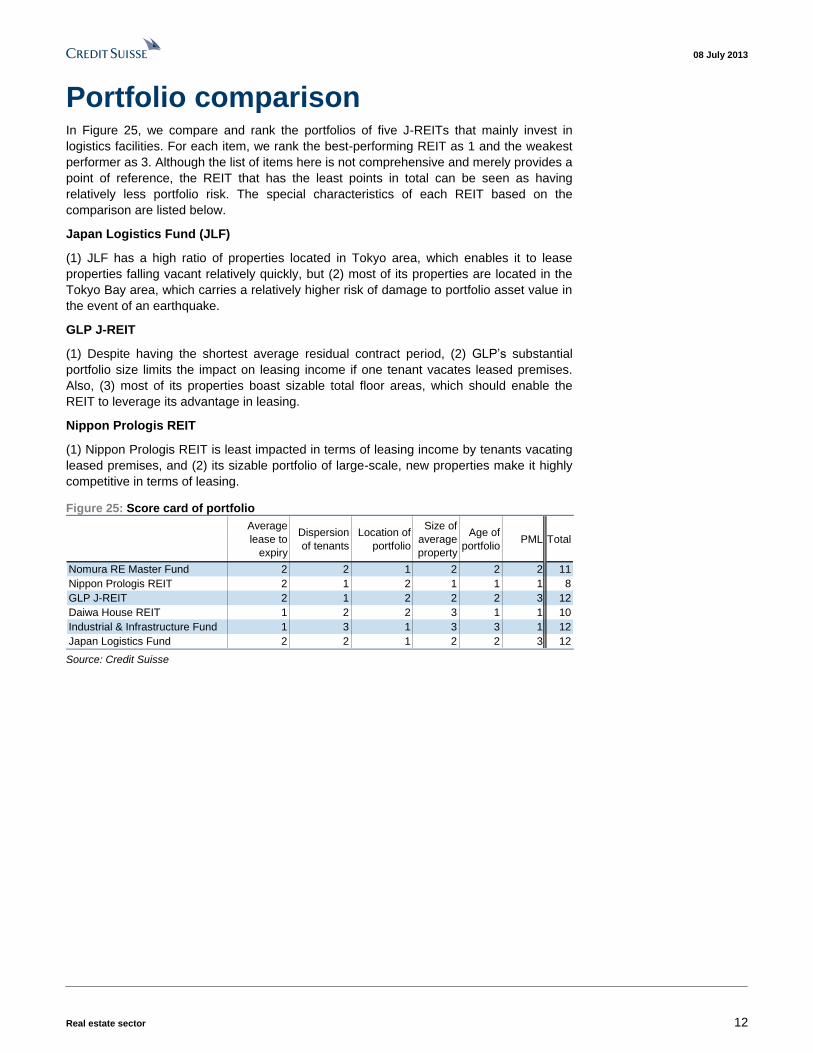
Portfolio comparison In Figure 25, we compare and rank the portfolios of five J-REITs that mainly invest in
logistics facilities. For each item, we rank the best-performing REIT as 1 and the weakest
performer as 3. Although the list of items here is not comprehensive and merely provides a
point of reference, the REIT that has the least points in total can be seen as having
relatively less portfolio risk. The special characteristics of each REIT based on the
comparison are listed below.
Japan Logistics Fund (JLF)
(1) JLF has a high ratio of properties located in Tokyo area, which enables it to lease
properties falling vacant relatively quickly, but (2) most of its properties are located in the
Tokyo Bay area, which carries a relatively higher risk of damage to portfolio asset value in
the event of an earthquake.
GLP J-REIT
(1) Despite having the shortest average residual contract period, (2) GLP’s substantial
portfolio size limits the impact on leasing income if one tenant vacates leased premises.
Also, (3) most of its properties boast sizable total floor areas, which should enable the
REIT to leverage its advantage in leasing.
Nippon Prologis REIT
(1) Nippon Prologis REIT is least impacted in terms of leasing income by tenants vacating
leased premises, and (2) its sizable portfolio of large-scale, new properties make it highly
competitive in terms of leasing.
Figure 25: Score card of portfolio
Average
lease to
expiry
Dispersion
of tenants
Location of
portfolio
Size of
average
property
Age of
portfolioPML Total
Nomura RE Master Fund 2 2 1 2 2 2 11
Nippon Prologis REIT 2 1 2 1 1 1 8
GLP J-REIT 2 1 2 2 2 3 12
Daiwa House REIT 1 2 2 3 1 1 10
Industrial & Infrastructure Fund 1 3 1 3 3 1 12
Japan Logistics Fund 2 2 1 2 2 3 12 Source: Credit Suisse
08 July 2013
Real estate sector 13
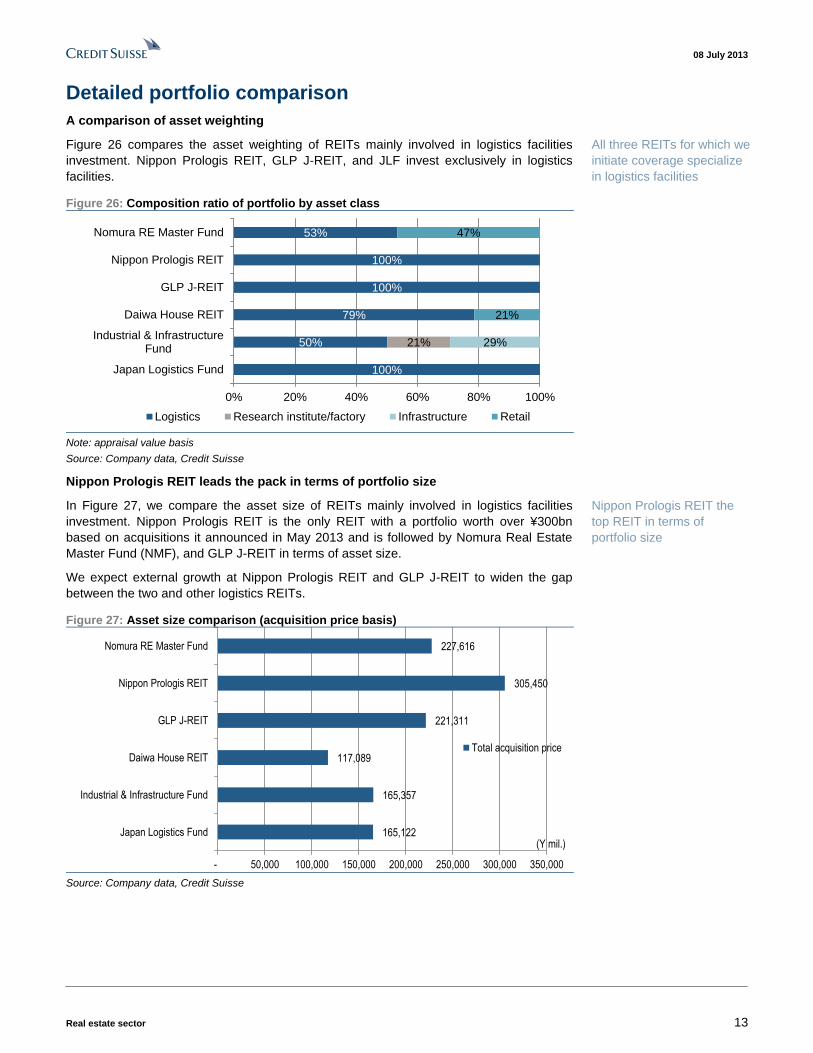
Detailed portfolio comparison
A comparison of asset weighting
Figure 26 compares the asset weighting of REITs mainly involved in logistics facilities
investment. Nippon Prologis REIT, GLP J-REIT, and JLF invest exclusively in logistics
facilities.
Figure 26: Composition ratio of portfolio by asset class
100%
50%
79%
100%
100%
53%
21% 29%
21%
47%
0% 20% 40% 60% 80% 100%
Japan Logistics Fund
Industrial & InfrastructureFund
Daiwa House REIT
GLP J-REIT
Nippon Prologis REIT
Nomura RE Master Fund
Logistics Research institute/factory Infrastructure Retail
Note: appraisal value basis
Source: Company data, Credit Suisse
Nippon Prologis REIT leads the pack in terms of portfolio size
In Figure 27, we compare the asset size of REITs mainly involved in logistics facilities
investment. Nippon Prologis REIT is the only REIT with a portfolio worth over ¥300bn
based on acquisitions it announced in May 2013 and is followed by Nomura Real Estate
Master Fund (NMF), and GLP J-REIT in terms of asset size.
We expect external growth at Nippon Prologis REIT and GLP J-REIT to widen the gap
between the two and other logistics REITs.
Figure 27: Asset size comparison (acquisition price basis)
165,122
165,357
117,089
221,311
305,450
227,616
- 50,000 100,000 150,000 200,000 250,000 300,000 350,000
Japan Logistics Fund
Industrial & Infrastructure Fund
Daiwa House REIT
GLP J-REIT
Nippon Prologis REIT
Nomura RE Master Fund
Total acquisition price
(Y mil.)
Source: Company data, Credit Suisse
All three REITs for which we
initiate coverage specialize
in logistics facilities
Nippon Prologis REIT the
top REIT in terms of
portfolio size

08 July 2013
Real estate sector 14
REITs with shorter residual leasing contracts have a diversified tenant base
Although Nippon Prologis REIT, GLP J-REIT, and JLF have short average residual leasing
contracts, their relatively diversified tenant base limits the potential impact from an
individual tenant vacating leased premises.
In Figure 28, we compare the REITs’ average residual contract period with tenants. At
around 4.5–6.3 years, the average residual contract period is relatively short for Nippon
Prologis REIT, GLP J-REIT, and JLF.
Meanwhile, Figure 29 shows a comparison of leasing income impact from one tenant
vacating leased premises (leasing income per tenant divided by total leasing income). The
ratio stands at 1.0%–2.6% for Nippon Prologis REIT, GLP J-REIT, and JLF.
Figure 28: Average lease to expiry of portfolio Figure 29: Revenue per tenant/total revenue
6.3
10.3
13.0
4.5
5.2
6.7
0 1 2 3 4 5 6 7 8 9 10 11 12 13 14
Japan Logistics Fund
Industrial & Infrastructure Fund
Daiwa House REIT
GLP J-REIT
Nippon Prologis REIT
Nomura RE Master Fund
Average lease to expiry
(years)
2.6%
4.3%
3.0%
1.9%
1.0%
2.0%
0.0% 1.0% 2.0% 3.0% 4.0% 5.0%
Japan Logistics Fund
Industrial & Infrastructure Fund
Daiwa House REIT
GLP J-REIT
Nippon Prologis REIT
Nomura RE Master FundRevenue pertenant/totalrevenue
Note: based on recent IR material. The figure for Nomura Real Estate
Master Fund is our estimate.
Source: Company data, Credit Suisse estimates
Source: Company data, Credit Suisse estimates
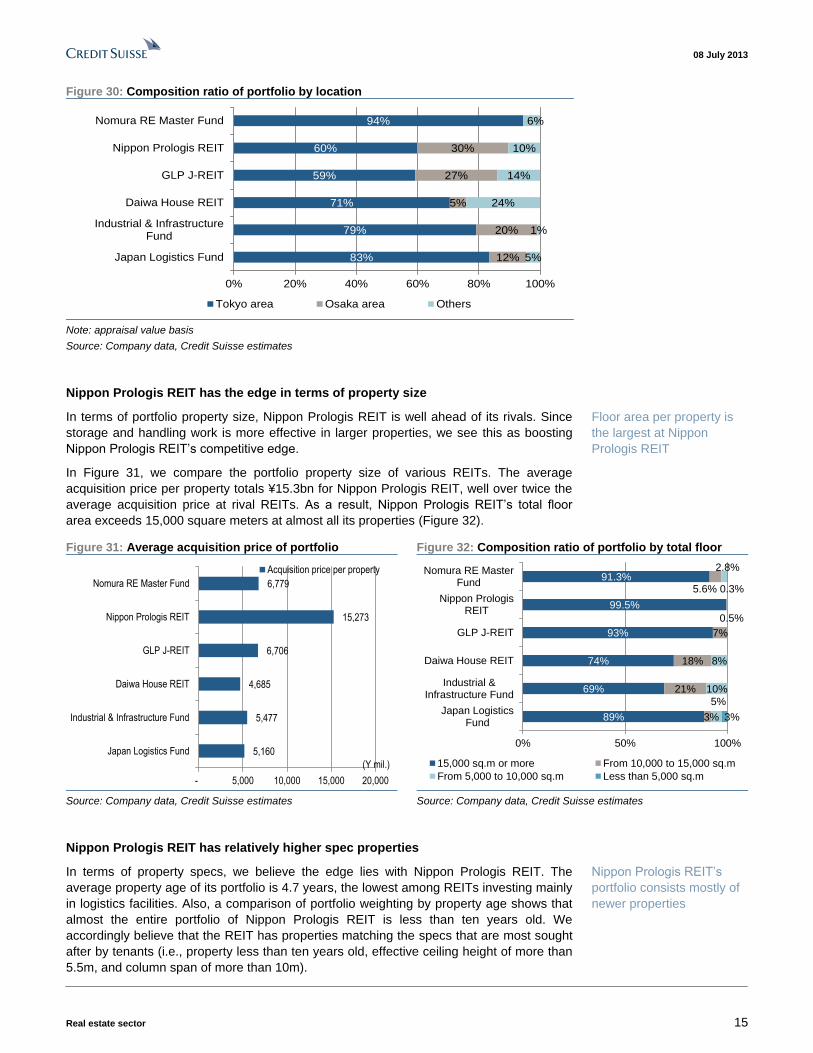
JLF has the edge in terms of tenant location in our view
In terms of tenant leasing, we believe JLF holds the edge over rivals in terms of property
location.
Properties located in the Tokyo metropolitan area account for 83% of JLF’s portfolio of
logistics facilities. Japan’s largest concentration of industry and consumer base is located
in the Tokyo metropolitan area. This not only provides the REIT with a large number of
potential tenants, but also helps it reduce the time needed for leasing properties and cut
down rent-free period offered as an incentive to tenants.
Single tenant departures
have a modest impact on
leasing income at REITs
with shorter residual leasing
contracts
Most properties owned by
JLF are located in the Tokyo
metro area
08 July 2013
Real estate sector 15
Figure 30: Composition ratio of portfolio by location
83%
79%
71%
59%
60%
94%
12%
20%
5%
27%
30%
5%
1%
24%
14%
10%
6%
0% 20% 40% 60% 80% 100%
Japan Logistics Fund
Industrial & InfrastructureFund
Daiwa House REIT
GLP J-REIT
Nippon Prologis REIT
Nomura RE Master Fund
Tokyo area Osaka area Others
Note: appraisal value basis
Source: Company data, Credit Suisse estimates
Nippon Prologis REIT has the edge in terms of property size
In terms of portfolio property size, Nippon Prologis REIT is well ahead of its rivals. Since
storage and handling work is more effective in larger properties, we see this as boosting
Nippon Prologis REIT’s competitive edge.
In Figure 31, we compare the portfolio property size of various REITs. The average
acquisition price per property totals ¥15.3bn for Nippon Prologis REIT, well over twice the
average acquisition price at rival REITs. As a result, Nippon Prologis REIT’s total floor
area exceeds 15,000 square meters at almost all its properties (Figure 32).
Figure 31: Average acquisition price of portfolio Figure 32: Composition ratio of portfolio by total floor
5,160
5,477
4,685
6,706
15,273
6,779
- 5,000 10,000 15,000 20,000
Japan Logistics Fund
Industrial & Infrastructure Fund
Daiwa House REIT
GLP J-REIT
Nippon Prologis REIT
Nomura RE Master Fund
Acquisition price per property
(Y mil.)
89%
69%
74%
93%
99.5%
91.3%
3%
21%
18%
7%
0.5%
5.6%
5%
10%
8%
2.8%
3%
0.3%
0% 50% 100%
Japan LogisticsFund
Industrial &Infrastructure Fund
Daiwa House REIT
GLP J-REIT
Nippon PrologisREIT
Nomura RE MasterFund
15,000 sq.m or more From 10,000 to 15,000 sq.m
From 5,000 to 10,000 sq.m Less than 5,000 sq.m
Source: Company data, Credit Suisse estimates Source: Company data, Credit Suisse estimates
Nippon Prologis REIT has relatively higher spec properties
In terms of property specs, we believe the edge lies with Nippon Prologis REIT. The
average property age of its portfolio is 4.7 years, the lowest among REITs investing mainly
in logistics facilities. Also, a comparison of portfolio weighting by property age shows that
almost the entire portfolio of Nippon Prologis REIT is less than ten years old. We
accordingly believe that the REIT has properties matching the specs that are most sought
after by tenants (i.e., property less than ten years old, effective ceiling height of more than
5.5m, and column span of more than 10m).
Floor area per property is
the largest at Nippon
Prologis REIT
Nippon Prologis REIT’s
portfolio consists mostly of
newer properties

08 July 2013
Real estate sector 16
Figure 33: Average age of portfolio Figure 34: Composition ratio of portfolio by ages
12.6
17.4
5.7
11.3
4.7
7.6
0 5 10 15 20
Japan Logistics Fund
Industrial & Infrastructure Fund
Daiwa House REIT
GLP J-REIT
Nippon Prologis REIT
Nomura RE Master Fund
Average age of properties
(years)
15%
40%
13%
54%
26%
48%
21%
58%
58%
46%
55%
7%
17%
1%
7%
14%
31%
62%
22%
0.5%
6.2%
0% 20% 40% 60% 80% 100%
Japan Logistics Fund
Industrial & InfrastructureFund
Daiwa House REIT
GLP J-REIT
Nippon Prologis REIT
Nomura RE Master Fund
Less than 5 years From 5 to 10 years
From 10 to 20 years 20 years or more
Note: appraisal value basis
Source: Company data, Credit Suisse estimates
Source: Company data, Credit Suisse estimates
JLF and GLP J-REIT face a relatively high risk of asset damage due to earthquake
We believe that JLF and GLP J-REIT face relatively high risk of damage to assets due to
earthquakes. At more than 10%, the probable maximum loss (in case of earthquakes) is
relatively high at both REITs.
Figure 35: Average PML of portfolio
11.9%
4.9%
3.4%
10.8%
4.5%
7.0%
0.0% 2.0% 4.0% 6.0% 8.0% 10.0% 12.0% 14.0%
Japan Logistics Fund
Industrial & Infrastructure Fund
Daiwa House REIT
GLP J-REIT
Nippon Prologis REIT
Nomura RE Master FundAverage PML
Note: appraisal value basis
Source: Company data, Credit Suisse estimates
PML value relatively high for
JLF and GLP J-REIT
08 July 2013
Real estate sector 17
Companies Mentioned (Price as of 05-Jul-2013)
Daiwa House Reit (3263.T, ¥705,000) GLP J-REIT (3281.T, ¥99,800, OUTPERFORM[V], TP ¥118,000) Ind & Infra Fund (3249.T, ¥989,000) Japan Logistics (8967.T, ¥918,000, OUTPERFORM, TP ¥1,110,000) Nippon Prologis REIT (3283.T, ¥870,000, NEUTRAL[V], TP ¥980,000) Nomura REMF (3285.T, ¥100,200) Yamato Holding Co Ltd (9064.T, ¥2,218)
Disclosure Appendix
Important Global Disclosures
Atsuro Takemura and Masahiro Mochizuki, each certify, with respect to the companies or securities that the individual analyzes, that (1) the views expressed in this report accurately reflect his or her personal views about all of the subject companies and securities and (2) no part of his or her compensation was, is or will be directly or indirectly related to the specific recommendations or views expressed in this report.
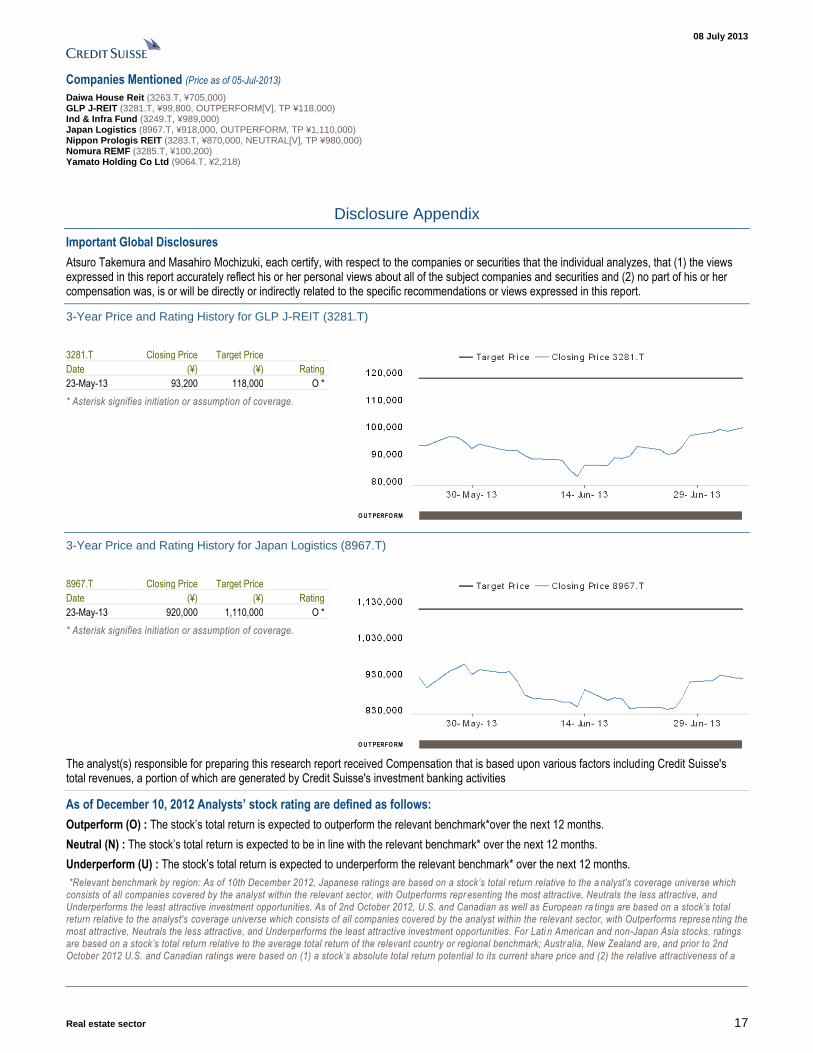
3-Year Price and Rating History for GLP J-REIT (3281.T)
3281.T Closing Price Target Price
Date (¥) (¥) Rating
23-May-13 93,200 118,000 O *
* Asterisk signifies initiation or assumption of coverage.
O U T PERFO RM
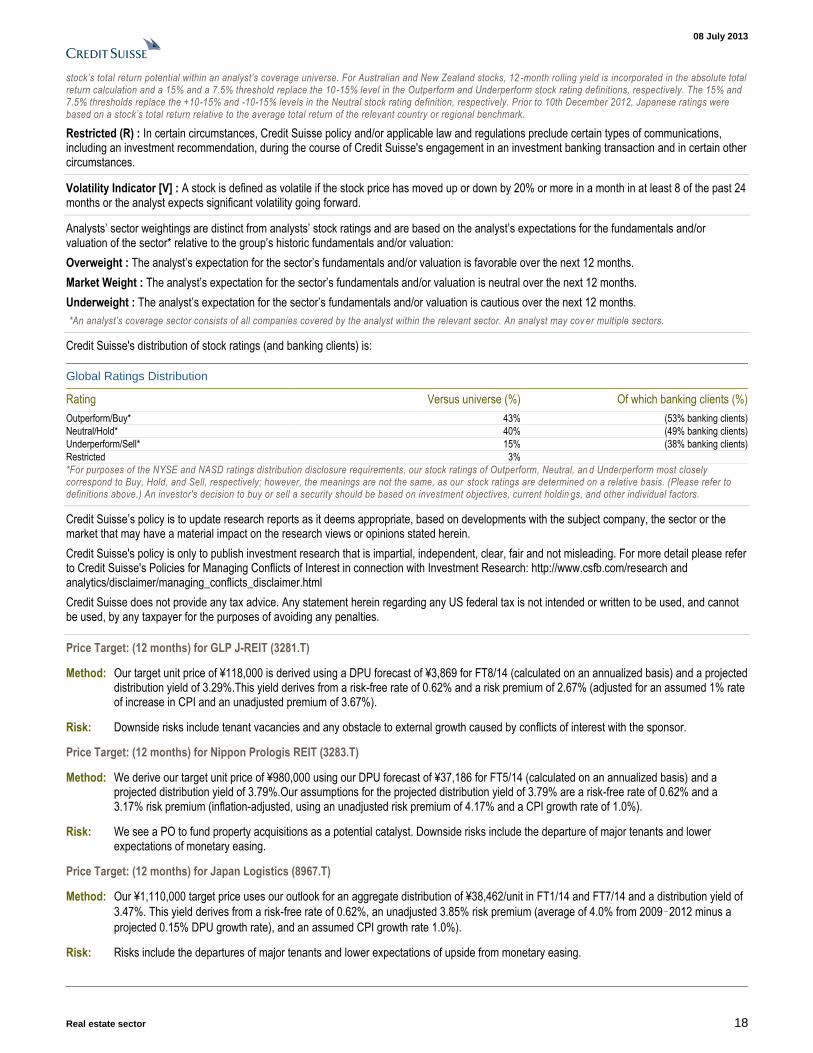
3-Year Price and Rating History for Japan Logistics (8967.T)
8967.T Closing Price Target Price
Date (¥) (¥) Rating
23-May-13 920,000 1,110,000 O *
* Asterisk signifies initiation or assumption of coverage.
O U T PERFO RM
The analyst(s) responsible for preparing this research report received Compensation that is based upon various factors including Credit Suisse's total revenues, a portion of which are generated by Credit Suisse's investment banking activities
As of December 10, 2012 Analysts’ stock rating are defined as follows:
Outperform (O) : The stock’s total return is expected to outperform the relevant benchmark*over the next 12 months.
Neutral (N) : The stock’s total return is expected to be in line with the relevant benchmark* over the next 12 months.
Underperform (U) : The stock’s total return is expected to underperform the relevant benchmark* over the next 12 months.
*Relevant benchmark by region: As of 10th December 2012, Japanese ratings are based on a stock’s total return relative to the a nalyst's coverage universe which consists of all companies covered by the analyst within the relevant sector, with Outperforms repr esenting the most attractive, Neutrals the less attractive, and Underperforms the least attractive investment opportunities. As of 2nd October 2012, U.S. and Canadian as well as European ra tings are based on a stock’s total return relative to the analyst's coverage universe which consists of all companies covered by the analyst within the relevant sector, with Outperforms represe nting the most attractive, Neutrals the less attractive, and Underperforms the least attractive investment opportunities. For Lati n American and non-Japan Asia stocks, ratings are based on a stock’s total return relative to the average total return of the relevant country or regional benchmark; Austr alia, New Zealand are, and prior to 2nd October 2012 U.S. and Canadian ratings were based on (1) a stock’s absolute total return potential to its current share price and (2) the relative attractiveness of a
08 July 2013
Real estate sector 18
stock’s total return potential within an analyst’s coverage universe. For Australian and New Zealand stocks, 12 -month rolling yield is incorporated in the absolute total return calculation and a 15% and a 7.5% threshold replace the 10-15% level in the Outperform and Underperform stock rating definitions, respectively. The 15% and 7.5% thresholds replace the +10-15% and -10-15% levels in the Neutral stock rating definition, respectively. Prior to 10th December 2012, Japanese ratings were based on a stock’s total return relative to the average total return of the relevant country or regional benchmark.
Restricted (R) : In certain circumstances, Credit Suisse policy and/or applicable law and regulations preclude certain types of communications, including an investment recommendation, during the course of Credit Suisse's engagement in an investment banking transaction and in certain other circumstances.
Volatility Indicator [V] : A stock is defined as volatile if the stock price has moved up or down by 20% or more in a month in at least 8 of the past 24 months or the analyst expects significant volatility going forward.
Analysts’ sector weightings are distinct from analysts’ stock ratings and are based on the analyst’s expectations for the fundamentals and/or valuation of the sector* relative to the group’s historic fundamentals and/or valuation:
Overweight : The analyst’s expectation for the sector’s fundamentals and/or valuation is favorable over the next 12 months.
Market Weight : The analyst’s expectation for the sector’s fundamentals and/or valuation is neutral over the next 12 months.
Underweight : The analyst’s expectation for the sector’s fundamentals and/or valuation is cautious over the next 12 months.
*An analyst’s coverage sector consists of all companies covered by the analyst within the relevant sector. An analyst may cov er multiple sectors.
Credit Suisse's distribution of stock ratings (and banking clients) is:
Global Ratings Distribution
Rating Versus universe (%) Of which banking clients (%)
Outperform/Buy* 43% (53% banking clients)
Neutral/Hold* 40% (49% banking clients)
Underperform/Sell* 15% (38% banking clients)
Restricted 3%
*For purposes of the NYSE and NASD ratings distribution disclosure requirements, our stock ratings of Outperform, Neutral, an d Underperform most closely correspond to Buy, Hold, and Sell, respectively; however, the meanings are not the same, as our stock ratings are determined on a relative basis. (Please refer to definitions above.) An investor's decision to buy or sell a security should be based on investment objectives, current holdin gs, and other individual factors.
Credit Suisse’s policy is to update research reports as it deems appropriate, based on developments with the subject company, the sector or the market that may have a material impact on the research views or opinions stated herein.
Credit Suisse's policy is only to publish investment research that is impartial, independent, clear, fair and not misleading. For more detail please refer to Credit Suisse's Policies for Managing Conflicts of Interest in connection with Investment Research: http://www.csfb.com/research and analytics/disclaimer/managing_conflicts_disclaimer.html
Credit Suisse does not provide any tax advice. Any statement herein regarding any US federal tax is not intended or written to be used, and cannot be used, by any taxpayer for the purposes of avoiding any penalties.
Price Target: (12 months) for GLP J-REIT (3281.T)
Method: Our target unit price of ¥118,000 is derived using a DPU forecast of ¥3,869 for FT8/14 (calculated on an annualized basis) and a projected distribution yield of 3.29%.This yield derives from a risk-free rate of 0.62% and a risk premium of 2.67% (adjusted for an assumed 1% rate of increase in CPI and an unadjusted premium of 3.67%).
Risk: Downside risks include tenant vacancies and any obstacle to external growth caused by conflicts of interest with the sponsor.
Price Target: (12 months) for Nippon Prologis REIT (3283.T)
Method: We derive our target unit price of ¥980,000 using our DPU forecast of ¥37,186 for FT5/14 (calculated on an annualized basis) and a projected distribution yield of 3.79%.Our assumptions for the projected distribution yield of 3.79% are a risk-free rate of 0.62% and a 3.17% risk premium (inflation-adjusted, using an unadjusted risk premium of 4.17% and a CPI growth rate of 1.0%).
Risk: We see a PO to fund property acquisitions as a potential catalyst. Downside risks include the departure of major tenants and lower expectations of monetary easing.
Price Target: (12 months) for Japan Logistics (8967.T)
Method: Our ¥1,110,000 target price uses our outlook for an aggregate distribution of ¥38,462/unit in FT1/14 and FT7/14 and a distribution yield of
3.47%. This yield derives from a risk-free rate of 0.62%, an unadjusted 3.85% risk premium (average of 4.0% from 2009–2012 minus a
projected 0.15% DPU growth rate), and an assumed CPI growth rate 1.0%).
Risk: Risks include the departures of major tenants and lower expectations of upside from monetary easing.
08 July 2013
Real estate sector 19
Please refer to the firm's disclosure website at www.credit-suisse.com/researchdisclosures for the definitions of abbreviations typically used in the target price method and risk sections.
See the Companies Mentioned section for full company names
The subject company (3283.T) currently is, or was during the 12-month period preceding the date of distribution of this report, a client of Credit Suisse.
Credit Suisse provided investment banking services to the subject company (3283.T) within the past 12 months.
Credit Suisse has received investment banking related compensation from the subject company (3283.T) within the past 12 months
Credit Suisse expects to receive or intends to seek investment banking related compensation from the subject company (3283.T) within the next 3 months.
Important Regional Disclosures
Singapore recipients should contact Credit Suisse AG, Singapore Branch for any matters arising from this research report.
The analyst(s) involved in the preparation of this report have not visited the material operations of the subject company (3281.T, 3283.T, 8967.T) within the past 12 months
Restrictions on certain Canadian securities are indicated by the following abbreviations: NVS--Non-Voting shares; RVS--Restricted Voting Shares; SVS--Subordinate Voting Shares.
Individuals receiving this report from a Canadian investment dealer that is not affiliated with Credit Suisse should be advised that this report may not contain regulatory disclosures the non-affiliated Canadian investment dealer would be required to make if this were its own report.
For Credit Suisse Securities (Canada), Inc.'s policies and procedures regarding the dissemination of equity research, please visit http://www.csfb.com/legal_terms/canada_research_policy.shtml.
As of the date of this report, Credit Suisse acts as a market maker or liquidity provider in the equities securities that are the subject of this report.
Principal is not guaranteed in the case of equities because equity prices are variable.
Commission is the commission rate or the amount agreed with a customer when setting up an account or at any time after that.
To the extent this is a report authored in whole or in part by a non-U.S. analyst and is made available in the U.S., the following are important disclosures regarding any non-U.S. analyst contributors: The non-U.S. research analysts listed below (if any) are not registered/qualified as research analysts with FINRA. The non-U.S. research analysts listed below may not be associated persons of CSSU and therefore may not be subject to the NASD Rule 2711 and NYSE Rule 472 restrictions on communications with a subject company, public appearances and trading securities held by a research analyst account.
Credit Suisse Securities (Japan) Limited ....................................................................................................Atsuro Takemura ; Masahiro Mochizuki
For Credit Suisse disclosure information on other companies mentioned in this report, please visit the website at www.credit-suisse.com/researchdisclosures or call +1 (877) 291-2683.
08 July 2013
Real estate sector 20
References in this report to Credit Suisse include all of the subsidiaries and affiliates of Credit Suisse operating under its investment banking division. For more information on our structure, please use the following link: https://www.credit-suisse.com/who_we_are/en/.This report may contain material that is not directed to, or intended for distribution to or use by, any person or entity who is a citizen or resident of or located in any locality, state, country or other jurisdiction where such distribution, publication, availability or use would be contrary to law or regulation or which would subject Credit Suisse AG or its affiliates ("CS") to any registration or licensing requirement within such jurisdiction. All material presented in this report, unless specifically indicated otherwise, is under copyright to CS. None of the material, nor its content, nor any copy of it, may be altered in any way, transmitted to, copied or distributed to any other party, without the prior express written permission of CS. All trademarks, service marks and logos used in this report are trademarks or service marks or registered trademarks or service marks of CS or its affiliates. The information, tools and material presented in this report are provided to you for information purposes only and are not to be used or considered as an offer or the solicitation of an offer to sell or to buy or subscribe for securities or other financial instruments. CS may not have taken any steps to ensure that the securities referred to in this report are suitable for any particular investor. CS will not treat recipients of this report as its customers by virtue of their receiving this report. The investments and services contained or referred to in this report may not be suitable for you and it is recommended that you consult an independent investment advisor if you are in doubt about such investments or investment services. Nothing in this report constitutes investment, legal, accounting or tax advice, or a representation that any investment or strategy is suitable or appropriate to your individual circumstances, or otherwise constitutes a personal recommendation to you. CS does not advise on the tax consequences of investments and you are advised to contact an independent tax adviser. Please note in particular that the bases and levels of taxation may change. Information and opinions presented in this report have been obtained or derived from sources believed by CS to be reliable, but CS makes no representation as to their accuracy or completeness. CS accepts no liability for loss arising from the use of the material presented in this report, except that this exclusion of liability does not apply to the extent that such liability arises under specific statutes or regulations applicable to CS. This report is not to be relied upon in substitution for the exercise of independent judgment. CS may have issued, and may in the future issue, other communications that are inconsistent with, and reach different conclusions from, the information presented in this report. Those communications reflect the different assumptions, views and analytical methods of the analysts who prepared them and CS is under no obligation to ensure that such other communications are brought to the attention of any recipient of this report. CS may, to the extent permitted by law, participate or invest in financing transactions with the issuer(s) of the securities referred to in this report, perform services for or solicit business from such issuers, and/or have a position or holding, or other material interest, or effect transactions, in such securities or options thereon, or other investments related thereto. In addition, it may make markets in the securities mentioned in the material presented in this report. CS may have, within the last three years, served as manager or co-manager of a public offering of securities for, or currently may make a primary market in issues of, any or all of the entities mentioned in this report or may be providing, or have provided within the previous 12 months, significant advice or investment services in relation to the investment concerned or a related investment. Additional information is, subject to duties of confidentiality, available on request. Some investments referred to in this report will be offered solely by a single entity and in the case of some investments solely by CS, or an associate of CS or CS may be the only market maker in such investments. Past performance should not be taken as an indication or guarantee of future performance, and no representation or warranty, express or implied, is made regarding future performance. Information, opinions and estimates contained in this report reflect a judgment at its original date of publication by CS and are subject to change without notice. The price, value of and income from any of the securities or financial instruments mentioned in this report can fall as well as rise. The value of securities and financial instruments is subject to exchange rate fluctuation that may have a positive or adverse effect on the price or income of such securities or financial instruments. Investors in securities such as ADR's, the values of which are influenced by currency volatility, effectively assume this risk. Structured securities are complex instruments, typically involve a high degree of risk and are intended for sale only to sophisticated investors who are capable of understanding and assuming the risks involved. The market value of any structured security may be affected by changes in economic, financial and political factors (including, but not limited to, spot and forward interest and exchange rates), time to maturity, market conditions and volatility, and the credit quality of any issuer or reference issuer. Any investor interested in purchasing a structured product should conduct their own investigation and analysis of the product and consult with their own professional advisers as to the risks involved in making such a purchase. Some investments discussed in this report may have a high level of volatility. High volatility investments may experience sudden and large falls in their value causing losses when that investment is realised. Those losses may equal your original investment. Indeed, in the case of some investments the potential losses may exceed the amount of initial investment and, in such circumstances, you may be required to pay more money to support those losses. Income yields from investments may fluctuate and, in consequence, initial capital paid to make the investment may be used as part of that income yield. Some investments may not be readily realisable and it may be difficult to sell or realise those investments, similarly it may prove difficult for you to obtain reliable information about the value, or risks, to which such an investment is exposed. This report may provide the addresses of, or contain hyperlinks to, websites. Except to the extent to which the report refers to website material of CS, CS has not reviewed any such site and takes no responsibility for the content contained therein. Such address or hyperlink (including addresses or hyperlinks to CS's own website material) is provided solely for your convenience and information and the content of any such website does not in any way form part of this document. Accessing such website or following such link through this report or CS's website shall be at your own risk. This report is issued and distributed in Europe (except Switzerland) by Credit Suisse Securities (Europe) Limited, One Cabot Square, London E14 4QJ, England, which is authorised by the Prudential Regulation Authority ("PRA") and regulated by the Financial Conduct Authority ("FCA") and the PRA. This report is being distributed in the United States and Canada by Credit Suisse Securities (USA) LLC; in Switzerland by Credit Suisse AG; in Brazil by Banco de Investimentos Credit Suisse (Brasil) S.A or its affiliates; in Mexico by Banco Credit Suisse (México), S.A. (transactions related to the securities mentioned in this report will only be effected in compliance with applicable regulation); in Japan by Credit Suisse Securities (Japan) Limited, Financial Instruments Firm, Director-General of Kanto Local Finance Bureau (Kinsho) No. 66, a member of Japan Securities Dealers Association, The Financial Futures Association of Japan, Japan Investment Advisers Association, Type II Financial Instruments Firms Association; elsewhere in Asia/ Pacific by whichever of the following is the appropriately authorised entity in the relevant jurisdiction: Credit Suisse (Hong Kong) Limited, Credit Suisse Equities (Australia) Limited, Credit Suisse Securities (Thailand) Limited, having registered address at 990 Abdulrahim Place, 27 Floor, Unit 2701, Rama IV Road, Silom, Bangrak, Bangkok 10500, Thailand, Tel. +66 2614 6000, Credit Suisse Securities (Malaysia) Sdn Bhd, Credit Suisse AG, Singapore Branch, Credit Suisse Securities (India) Private Limited regulated by the Securities and Exchange Board of India (registration Nos. INB230970637; INF230970637; INB010970631; INF010970631), having registered address at 9th Floor, Ceejay House, Dr.A.B. Road, Worli, Mumbai - 18, India, T- +91-22 6777 3777, Credit Suisse Securities (Europe) Limited, Seoul Branch, Credit Suisse AG, Taipei Securities Branch, PT Credit Suisse Securities Indonesia, Credit Suisse Securities (Philippines ) Inc., and elsewhere in the world by the relevant authorised affiliate of the above. Research on Taiwanese securities produced by Credit Suisse AG, Taipei Securities Branch has been prepared by a registered Senior Business Person. Research provided to residents of Malaysia is authorised by the Head of Research for Credit Suisse Securities (Malaysia) Sdn Bhd, to whom they should direct any queries on +603 2723 2020. This report has been prepared and issued for distribution in Singapore to institutional investors, accredited investors and expert investors (each as defined under the Financial Advisers Regulations) only, and is also distributed by Credit Suisse AG, Singapore branch to overseas investors (as defined under the Financial Advisers Regulations). By virtue of your status as an institutional investor, accredited investor, expert investor or overseas investor, Credit Suisse AG, Singapore branch is exempted from complying with certain compliance requirements under the Financial Advisers Act, Chapter 110 of Singapore (the "FAA"), the Financial Advisers Regulations and the relevant Notices and Guidelines issued thereunder, in respect of any financial advisory service which Credit Suisse AG, Singapore branch may provide to you. This research may not conform to Canadian disclosure requirements. In jurisdictions where CS is not already registered or licensed to trade in securities, transactions will only be effected in accordance with applicable securities legislation, which will vary from jurisdiction to jurisdiction and may require that the trade be made in accordance with applicable exemptions from registration or licensing requirements. Non-U.S. customers wishing to effect a transaction should contact a CS entity in their local jurisdiction unless governing law permits otherwise. U.S. customers wishing to effect a transaction should do so only by contacting a representative at Credit Suisse Securities (USA) LLC in the U.S. Please note that this research was originally prepared and issued by CS for distribution to their market professional and institutional investor customers. Recipients who are not market professional or institutional investor customers of CS should seek the advice of their independent financial advisor prior to taking any investment decision based on this report or for any necessary explanation of its contents. This research may relate to investments or services of a person outside of the UK or to other matters which are not authorised by the PRA and regulated by the FCA and the PRA or in respect of which the protections of the PRA and FCA for private customers and/or the UK compensation scheme may not be available, and further details as to where this may be the case are available upon request in respect of this report. CS may provide various services to US municipal entities or obligated persons ("municipalities"), including suggesting individual transactions or trades and entering into such transactions. Any services CS provides to municipalities are not viewed as "advice" within the meaning of Section 975 of the Dodd-Frank Wall Street Reform and Consumer Protection Act. CS is providing any such services and related information solely on an arm's length basis and not as an advisor or fiduciary to the municipality. In connection with the provision of the any such services, there is no agreement, direct or indirect, between any municipality (including the officials, management, employees or agents thereof) and CS for CS to provide advice to the municipality. Municipalities should consult with their financial, accounting and legal advisors regarding any such services provided by CS. In addition, CS is not acting for direct or indirect compensation to solicit the municipality on behalf of an unaffiliated broker, dealer, municipal securities dealer, municipal advisor, or investment adviser for the purpose of obtaining or retaining an engagement by the municipality for or in connection with Municipal Financial Products, the issuance of municipal securities, or of an investment adviser to provide investment advisory services to or on behalf of the municipality. If this report is being distributed by a financial institution other than Credit Suisse AG, or its affiliates, that financial institution is solely responsible for distribution. Clients of that institution should contact that institution to effect a transaction in the securities mentioned in this report or require further information. This report does not constitute investment advice by Credit Suisse to the clients of the distributing financial institution, and neither Credit Suisse AG, its affiliates, and their respective officers, directors and employees accept any liability whatsoever for any direct or consequential loss arising from their use of this report or its content. Principal is not guaranteed. Commission is the commission rate or the amount agreed with a customer when setting up an account or at any time after that.
Copyright © 2013 CREDIT SUISSE AG and/or its affiliates. All rights reserved.
Investment principal on bonds can be eroded depending on sale price or market price. In addition, there are bonds on which investment principal can be eroded due to changes in redemption amounts. Care is required when investing in such instruments.
When you purchase non-listed Japanese fixed income securities (Japanese government bonds, Japanese municipal bonds, Japanese government guaranteed bonds, Japanese corporate bonds) from CS as a seller, you will be requested to pay the purchase price only.
Real Estate_070813_E.doc


![E GLPJ-REIT 5th Presentation.ppt [互換モード] · GLP J-REIT August 2014 Fiscal Period Corporate Presentation 5 2,190 yen 2,176 yen Aug 2014 Result Feb 2014 Impact of real estate](https://img.pdfslide.net/doc/110x75/5f12e4ac90f0736d1543f3cb/e-glpj-reit-5th-fff-glp-j-reit-august-2014-fiscal-period-corporate.jpg)