Embed Size (px)
Citation preview
Au
gu
st2
00
8
.technicalanalyst.co.ukwwwThe publication for trading and investment professionals
Markets InterviewGenetic algorithms at
Quaesta Capital
Trading systemsTrading triangles
systematicallyEuro outlook:
further gains to come
Stocks in DeclineStocks in DeclineThe signs ofThe signs of
a bear marketa bear market

© 2008 Global Markets Media Limited. All rights reserved. Neither this publication nor any part of it may bereproduced, stored in a retrieval system, or transmitted in any form or by any means, electronic, mechanical,photocopying, recording or otherwise, without the prior permission of Global Markets Media Limited. While thepublisher believes that all information contained in this publication was correct at the time of going to press, theycannot accept liability for any errors or omissions that may appear or loss suffered directly or indirectly by anyreader as a result of any advertisement, editorial, photographs or other material published in The TechnicalAnalyst. No statement in this publication is to be considered as a recommendation or solicitation to buy or sellsecurities or to provide investment, tax or legal advice. Readers should be aware that this publication is notintended to replace the need to obtain professional advice in relation to any topic discussed.
CONTENTS 1 FEATURES
Defining a bear marketIs the “20% decline in stocks” definition of a
bear market really valid? We speak to severalhedge funds and bank analysts to gain theirview on how to recognise the start of a bear
market.
Outlook for the euroBoth market views this issue look at the outlook
for the euro. Despite some recent weaknessagainst the dollar and sterling, further gains look
possible or even likely.
Trading withgenetic algorithms
We speak with Christian von Strachwitz atQuaesta Capital in Frankfurt about how he uses
genetic algorithms in his trading.
AUGUST
>04
>22
>30
>
> >
WELCOMEThe discussion of bear markets has been the staple of the financial press
for the past month or so. Declining stocks in the UK and US look set to lead asharp economic downturn, and this has only added the speculation that the
equity bull market of this decade has come to an end. This month we look at thepossible definitions of a bear market and some of the strategies that can be
employed to exploit it.
We hope you enjoy this edition of the magazine
Matthew Clements, Editor
August 2008 THE TECHNICAL ANALYST 1

presents
A premier event for trading and investment professionals
Speakers include:
Automated Trading
200815 October 2008
Royal Society of Arts
London WC2Backtesting and
optimisation
Web: www.technicalanalyst.co.uk
Telephone: +44 (0)1483 573150
Register Today!
Email: [email protected]
Topics include:Who should attend:
Delegate fee: £495 + VAT
+ Data integrity+ Statistical analysis of test results+ Correlation between asset classes+ Issues in data mining+ Monte Carlo techniques+ Avoiding curve fitting
+ Traders+ Fund managers+ Hedge funds+ Proprietary dealers+ Quantitative analysts+ Algorithmic trading
managers
Automated Trading 2008 is a one day confer-ence for traders and investment managersinvolved in automated or systematic tradingacross all asset classes. Bringing together leadingexperts from the UK and US, this event willfocus on backtesting and optimisation strategiesfor those looking to develop and build their ownautomated trading system.
Emmanuel AcarDirectional Trading
David AronsonBaruch College
Urban JaekleEmilio Tomasini & Partners
Gaurav ManglaCollage LLC
Martin SewellUniversity College London
John WolbergIsrael Institute of Technology
Woon WongCardiff Business School

Editor: Matthew ClementsManaging Editor: Jim BissConsultant Editor: Trevor NeilAdvertising & subscriptions:Louiza CharalambousMarketing: Vanessa GreenEvents: Adam CooleDesign & Production:Stuart Field
The Technical Analyst is published by
Global Markets Media LtdJeffries House1-5 Jeffries PassageGuildfordGU1 4APUK
Tel: +44 (0)1483 573150Web: www.technicalanalyst.co.ukEmail: [email protected]
SUBSCRIPTIONS
Subscription rates (6 issues)UK: £160 per annumRest of world: £185 per annumElectronic pdf: £49 per annumFor information, please contact:[email protected]
ADVERTISING
For information, please contact:[email protected]
PRODUCTION
Art, design and typesetting byStuart Field.Printed by Goodman Baylis
ISSN(1742-8718)
MARKET VIEWSEUR/USD: Climbing That MountainRenewed strength for EUR/GBPGlobal Equities 2008 RoundupGann Cycles: An Outlook for US Equities in 2008
TECHNIQUESThe Commodity Channel IndexBear Markets: Definitions and StrategiesWhat happens to volume at highs and lows?Better Sentiment
INTERVIEWChristian von Strachwitz, Quaesta Capital
RESEARCH UPDATE
SOFTWARE FEATURESolving the data and analytics puzzle
BOOK REVIEWThe Evaluation and Optimization of Trading Strategies
AUTOMATED TRADING SYSTEMSA Systematic Method for Trading TrianglesHow to Survive the Markets’ CauldronThe emergence of news trading: a survey
TRAINING DIARY
04091215
18222628
30
33
35
38
394446
48
CONTENTS 2 REGULARS>
August 2008 THE TECHNICAL ANALYST 3
18 38

4 THE TECHNICAL ANALYST August 2008
Market Views
EUR/USD:CLIMBING THAT MOUNTAINBy George Davis
August 2008 THE TECHNICAL ANALYST 5
Market Views
TTThe sub prime crisis that began in the U.S. last year hashad a profound impact on financial markets. The resultingretrenchment in the housing sector and the related credit cri-sis has sent monetary shockwaves around the globe, therebytriggering an increase in volatility as a significant deleveragingprocess grips markets. All asset classes have been affected,with the U.S. dollar sideswiped by a groundswell of bearishsentiment. What does this backdrop imply for EUR/USDgoing forward and how should investors and traders positionthemselves with regard to medium-term risk? We addressthese key questions below.
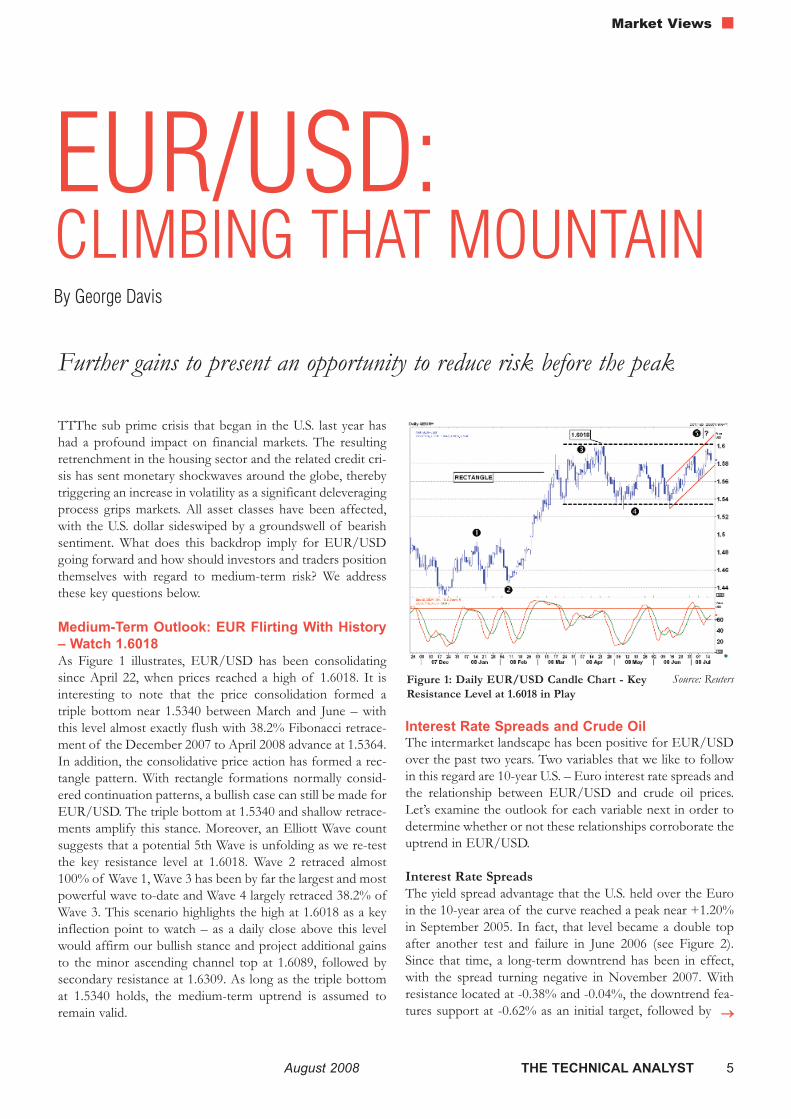
Medium-Term Outlook: EUR Flirting With History– Watch 1.6018As Figure 1 illustrates, EUR/USD has been consolidatingsince April 22, when prices reached a high of 1.6018. It isinteresting to note that the price consolidation formed atriple bottom near 1.5340 between March and June – withthis level almost exactly flush with 38.2% Fibonacci retrace-ment of the December 2007 to April 2008 advance at 1.5364.In addition, the consolidative price action has formed a rec-tangle pattern. With rectangle formations normally consid-ered continuation patterns, a bullish case can still be made forEUR/USD. The triple bottom at 1.5340 and shallow retrace-ments amplify this stance. Moreover, an Elliott Wave countsuggests that a potential 5th Wave is unfolding as we re-testthe key resistance level at 1.6018. Wave 2 retraced almost100% of Wave 1, Wave 3 has been by far the largest and mostpowerful wave to-date and Wave 4 largely retraced 38.2% ofWave 3. This scenario highlights the high at 1.6018 as a keyinflection point to watch – as a daily close above this levelwould affirm our bullish stance and project additional gainsto the minor ascending channel top at 1.6089, followed bysecondary resistance at 1.6309. As long as the triple bottomat 1.5340 holds, the medium-term uptrend is assumed toremain valid.
Interest Rate Spreads and Crude OilThe intermarket landscape has been positive for EUR/USDover the past two years. Two variables that we like to followin this regard are 10-year U.S. – Euro interest rate spreads andthe relationship between EUR/USD and crude oil prices.Let’s examine the outlook for each variable next in order todetermine whether or not these relationships corroborate theuptrend in EUR/USD.
Interest Rate SpreadsThe yield spread advantage that the U.S. held over the Euroin the 10-year area of the curve reached a peak near +1.20%in September 2005. In fact, that level became a double topafter another test and failure in June 2006 (see Figure 2).Since that time, a long-term downtrend has been in effect,with the spread turning negative in November 2007. Withresistance located at -0.38% and -0.04%, the downtrend fea-tures support at -0.62% as an initial target, followed by →→
Figure 1: Daily EUR/USD Candle Chart - KeyResistance Level at 1.6018 in Play
Source: Reuters
Further gains to present an opportunity to reduce risk before the peak

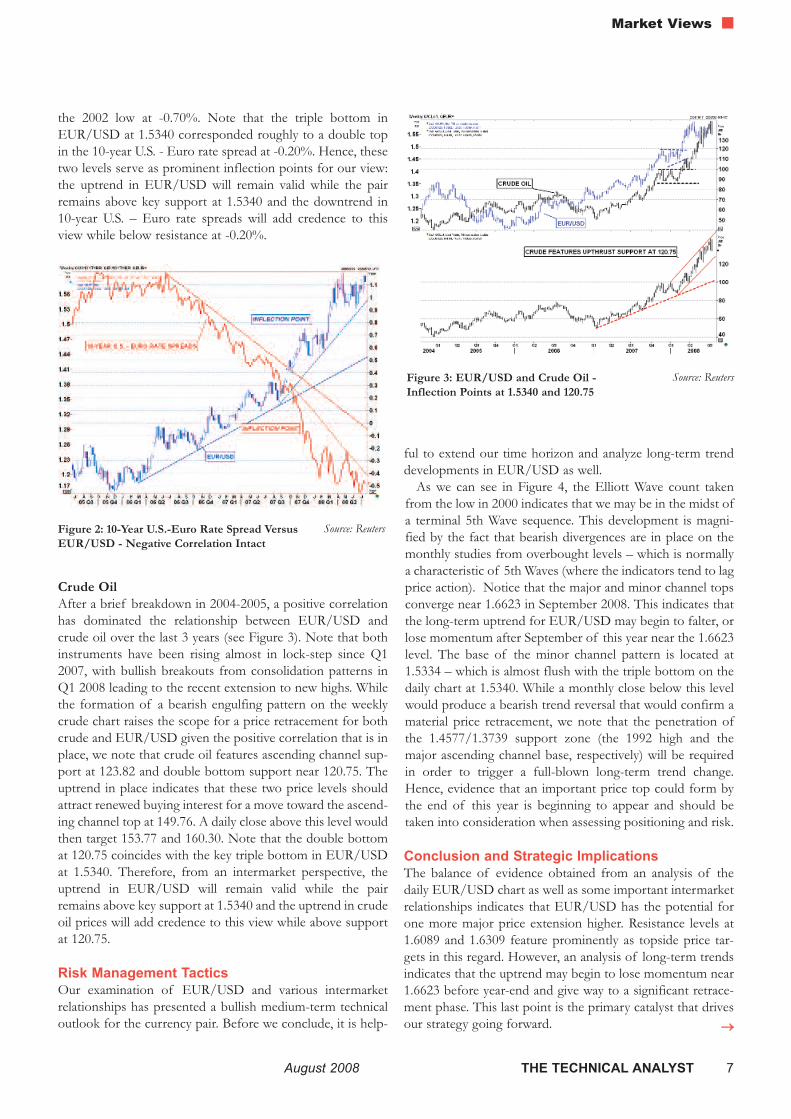
the 2002 low at -0.70%. Note that the triple bottom inEUR/USD at 1.5340 corresponded roughly to a double topin the 10-year U.S. - Euro rate spread at -0.20%. Hence, thesetwo levels serve as prominent inflection points for our view:the uptrend in EUR/USD will remain valid while the pairremains above key support at 1.5340 and the downtrend in10-year U.S. – Euro rate spreads will add credence to thisview while below resistance at -0.20%.
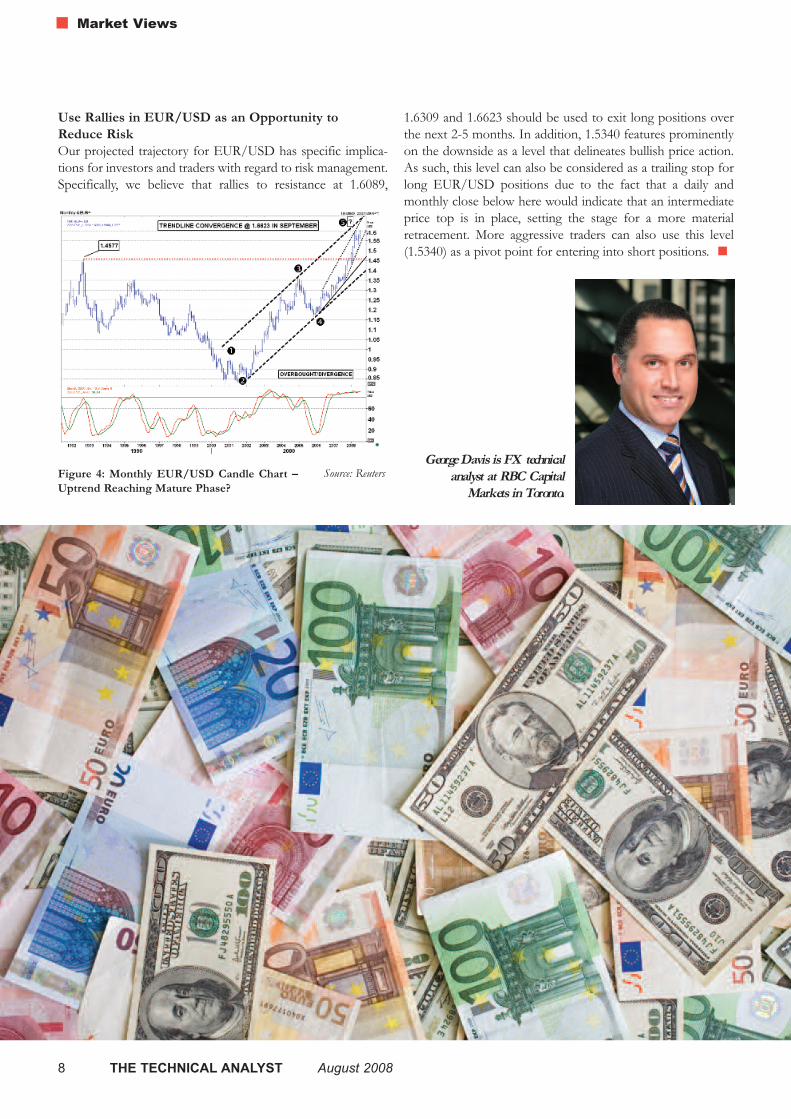
Crude OilAfter a brief breakdown in 2004-2005, a positive correlationhas dominated the relationship between EUR/USD andcrude oil over the last 3 years (see Figure 3). Note that bothinstruments have been rising almost in lock-step since Q12007, with bullish breakouts from consolidation patterns inQ1 2008 leading to the recent extension to new highs. Whilethe formation of a bearish engulfing pattern on the weeklycrude chart raises the scope for a price retracement for bothcrude and EUR/USD given the positive correlation that is inplace, we note that crude oil features ascending channel sup-port at 123.82 and double bottom support near 120.75. Theuptrend in place indicates that these two price levels shouldattract renewed buying interest for a move toward the ascend-ing channel top at 149.76. A daily close above this level wouldthen target 153.77 and 160.30. Note that the double bottomat 120.75 coincides with the key triple bottom in EUR/USDat 1.5340. Therefore, from an intermarket perspective, theuptrend in EUR/USD will remain valid while the pairremains above key support at 1.5340 and the uptrend in crudeoil prices will add credence to this view while above supportat 120.75.
Risk Management TacticsOur examination of EUR/USD and various intermarketrelationships has presented a bullish medium-term technicaloutlook for the currency pair. Before we conclude, it is help-
ful to extend our time horizon and analyze long-term trenddevelopments in EUR/USD as well.
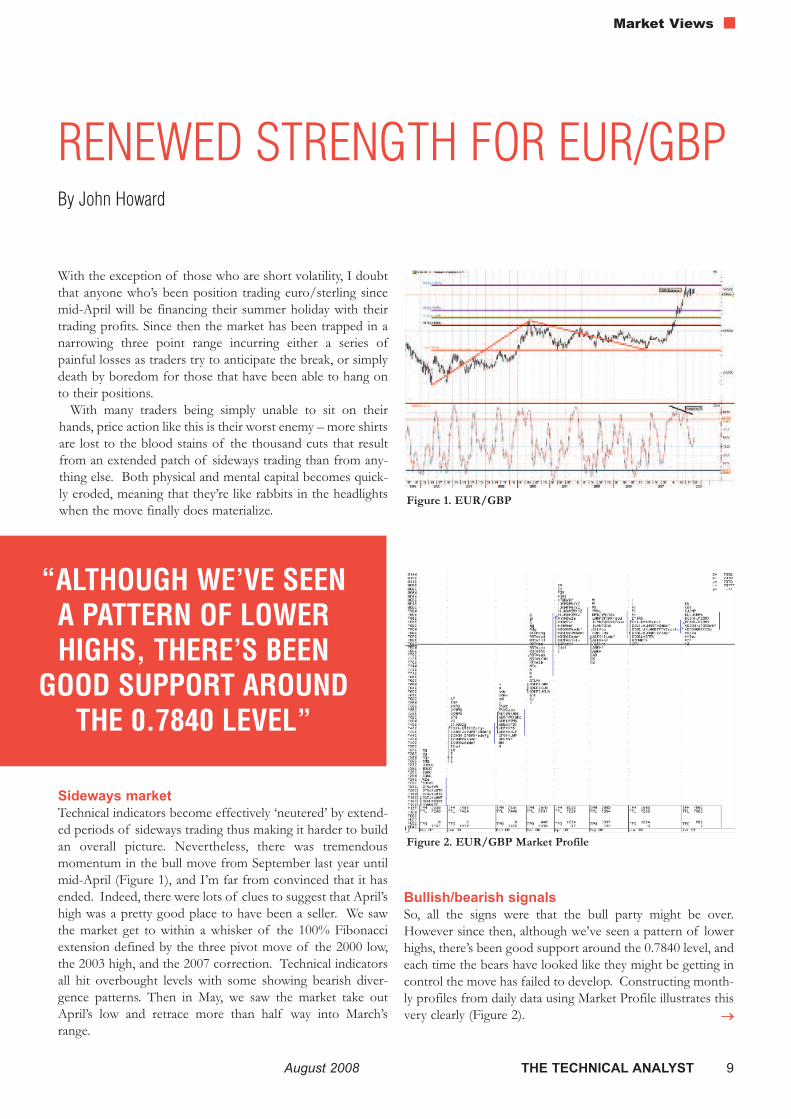
As we can see in Figure 4, the Elliott Wave count takenfrom the low in 2000 indicates that we may be in the midst ofa terminal 5th Wave sequence. This development is magni-fied by the fact that bearish divergences are in place on themonthly studies from overbought levels – which is normallya characteristic of 5th Waves (where the indicators tend to lagprice action). Notice that the major and minor channel topsconverge near 1.6623 in September 2008. This indicates thatthe long-term uptrend for EUR/USD may begin to falter, orlose momentum after September of this year near the 1.6623level. The base of the minor channel pattern is located at1.5334 – which is almost flush with the triple bottom on thedaily chart at 1.5340. While a monthly close below this levelwould produce a bearish trend reversal that would confirm amaterial price retracement, we note that the penetration ofthe 1.4577/1.3739 support zone (the 1992 high and themajor ascending channel base, respectively) will be requiredin order to trigger a full-blown long-term trend change.Hence, evidence that an important price top could form bythe end of this year is beginning to appear and should betaken into consideration when assessing positioning and risk.
Conclusion and Strategic ImplicationsThe balance of evidence obtained from an analysis of thedaily EUR/USD chart as well as some important intermarketrelationships indicates that EUR/USD has the potential forone more major price extension higher. Resistance levels at1.6089 and 1.6309 feature prominently as topside price tar-gets in this regard. However, an analysis of long-term trendsindicates that the uptrend may begin to lose momentum near1.6623 before year-end and give way to a significant retrace-ment phase. This last point is the primary catalyst that drivesour strategy going forward.
August 2008 THE TECHNICAL ANALYST 7
Market Views
→→
Figure 2: 10-Year U.S.-Euro Rate Spread VersusEUR/USD - Negative Correlation Intact
Source: Reuters
Figure 3: EUR/USD and Crude Oil - Inflection Points at 1.5340 and 120.75
Source: Reuters
Use Rallies in EUR/USD as an Opportunity to Reduce RiskOur projected trajectory for EUR/USD has specific implica-tions for investors and traders with regard to risk management.Specifically, we believe that rallies to resistance at 1.6089,
1.6309 and 1.6623 should be used to exit long positions overthe next 2-5 months. In addition, 1.5340 features prominentlyon the downside as a level that delineates bullish price action.As such, this level can also be considered as a trailing stop forlong EUR/USD positions due to the fact that a daily andmonthly close below here would indicate that an intermediateprice top is in place, setting the stage for a more materialretracement. More aggressive traders can also use this level(1.5340) as a pivot point for entering into short positions.
Market Views
8 THE TECHNICAL ANALYST August 2008
Figure 4: Monthly EUR/USD Candle Chart –Uptrend Reaching Mature Phase?
Source: ReutersGeorge Davis is FX technical
analyst at RBC CapitalMarkets in Toronto.
RENEWED STRENGTH FOR EUR/GBPBy John Howard
With the exception of those who are short volatility, I doubtthat anyone who’s been position trading euro/sterling sincemid-April will be financing their summer holiday with theirtrading profits. Since then the market has been trapped in anarrowing three point range incurring either a series ofpainful losses as traders try to anticipate the break, or simplydeath by boredom for those that have been able to hang onto their positions.
With many traders being simply unable to sit on theirhands, price action like this is their worst enemy – more shirtsare lost to the blood stains of the thousand cuts that resultfrom an extended patch of sideways trading than from any-thing else. Both physical and mental capital becomes quick-ly eroded, meaning that they’re like rabbits in the headlightswhen the move finally does materialize.
Sideways marketTechnical indicators become effectively ‘neutered’ by extend-ed periods of sideways trading thus making it harder to buildan overall picture. Nevertheless, there was tremendousmomentum in the bull move from September last year untilmid-April (Figure 1), and I’m far from convinced that it hasended. Indeed, there were lots of clues to suggest that April’shigh was a pretty good place to have been a seller. We sawthe market get to within a whisker of the 100% Fibonacciextension defined by the three pivot move of the 2000 low,the 2003 high, and the 2007 correction. Technical indicatorsall hit overbought levels with some showing bearish diver-gence patterns. Then in May, we saw the market take outApril’s low and retrace more than half way into March’srange.
Bullish/bearish signalsSo, all the signs were that the bull party might be over.However since then, although we’ve seen a pattern of lowerhighs, there’s been good support around the 0.7840 level, andeach time the bears have looked like they might be getting incontrol the move has failed to develop. Constructing month-ly profiles from daily data using Market Profile illustrates thisvery clearly (Figure 2).
Figure 1. EUR/GBP
Figure 2. EUR/GBP Market Profile
→→
August 2008 THE TECHNICAL ANALYST 9
Market Views
“ALTHOUGH WE’VE SEENA PATTERN OF LOWERHIGHS, THERE’S BEEN
GOOD SUPPORT AROUNDTHE 0.7840 LEVEL”
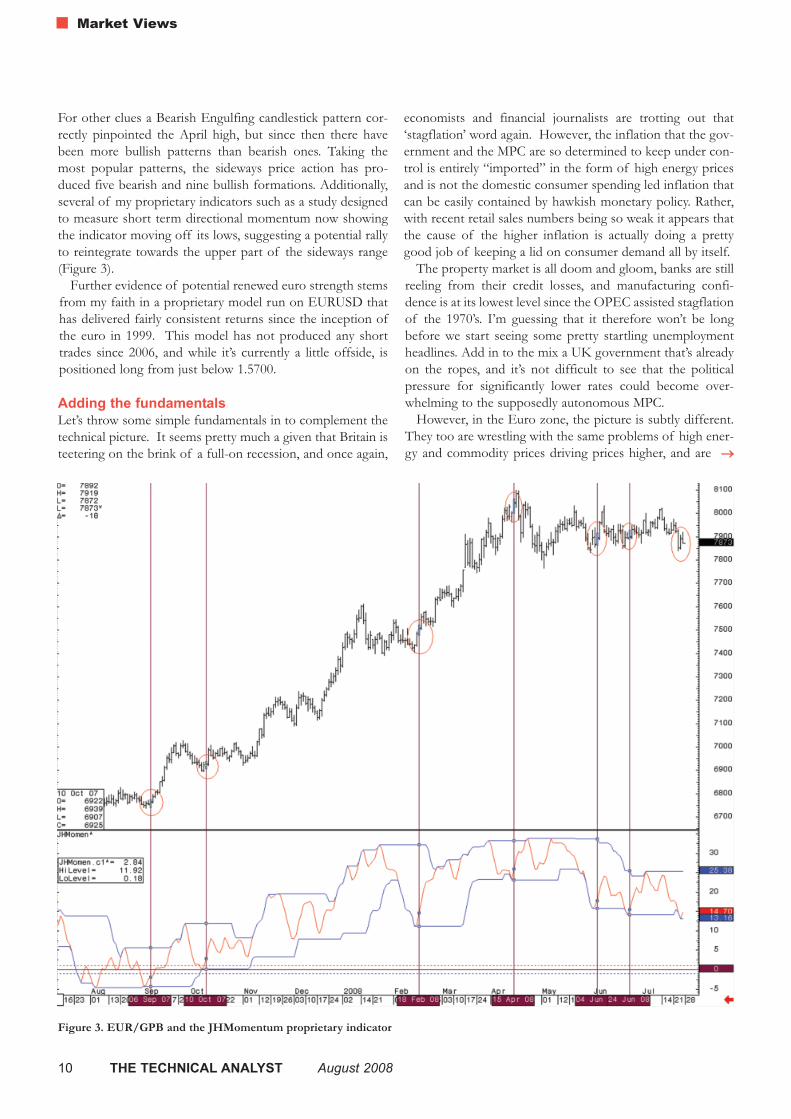
For other clues a Bearish Engulfing candlestick pattern cor-rectly pinpointed the April high, but since then there havebeen more bullish patterns than bearish ones. Taking themost popular patterns, the sideways price action has pro-duced five bearish and nine bullish formations. Additionally,several of my proprietary indicators such as a study designedto measure short term directional momentum now showingthe indicator moving off its lows, suggesting a potential rallyto reintegrate towards the upper part of the sideways range(Figure 3).
Further evidence of potential renewed euro strength stemsfrom my faith in a proprietary model run on EURUSD thathas delivered fairly consistent returns since the inception ofthe euro in 1999. This model has not produced any shorttrades since 2006, and while it’s currently a little offside, ispositioned long from just below 1.5700.
Adding the fundamentalsLet’s throw some simple fundamentals in to complement thetechnical picture. It seems pretty much a given that Britain isteetering on the brink of a full-on recession, and once again,
economists and financial journalists are trotting out that‘stagflation’ word again. However, the inflation that the gov-ernment and the MPC are so determined to keep under con-trol is entirely “imported” in the form of high energy pricesand is not the domestic consumer spending led inflation thatcan be easily contained by hawkish monetary policy. Rather,with recent retail sales numbers being so weak it appears thatthe cause of the higher inflation is actually doing a prettygood job of keeping a lid on consumer demand all by itself.
The property market is all doom and gloom, banks are stillreeling from their credit losses, and manufacturing confi-dence is at its lowest level since the OPEC assisted stagflationof the 1970’s. I’m guessing that it therefore won’t be longbefore we start seeing some pretty startling unemploymentheadlines. Add in to the mix a UK government that’s alreadyon the ropes, and it’s not difficult to see that the politicalpressure for significantly lower rates could become over-whelming to the supposedly autonomous MPC.
However, in the Euro zone, the picture is subtly different.They too are wrestling with the same problems of high ener-gy and commodity prices driving prices higher, and are
Figure 3. EUR/GPB and the JHMomentum proprietary indicator
Market Views
10 THE TECHNICAL ANALYST August 2008
→→
also seeing economic weakness develop as a combination ofeuro strength and slowing economic growth. But the situa-tion is nowhere near as serious as in Britain, and the inflationthey are seeing has many more home grown components thatwill respond to more hawkish policy.
Interest rates support euro outlook With this picture in mind, now take a look at Short Sterlingand Euribor futures. Only one month ago, the market waspricing UK rates at 6.5% and Euro zone rates at 5.5% forMarch next year. As I write, that spread has since narrowedby 60 basis points and I only see that trend continuing overthe medium term – extrapolate that into FX and one can eas-ily imagine the EURGBP bulls successfully challengingApril’s highs.
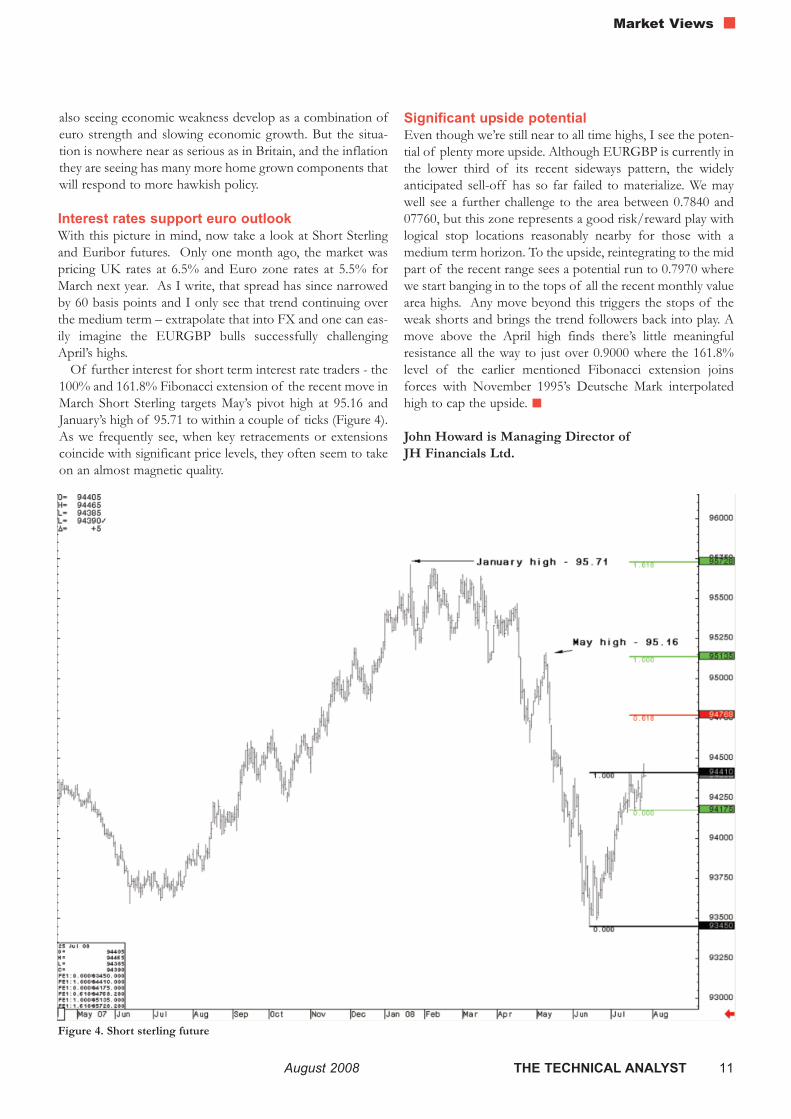
Of further interest for short term interest rate traders - the100% and 161.8% Fibonacci extension of the recent move inMarch Short Sterling targets May’s pivot high at 95.16 andJanuary’s high of 95.71 to within a couple of ticks (Figure 4).As we frequently see, when key retracements or extensionscoincide with significant price levels, they often seem to takeon an almost magnetic quality.
Significant upside potential Even though we’re still near to all time highs, I see the poten-tial of plenty more upside. Although EURGBP is currently inthe lower third of its recent sideways pattern, the widelyanticipated sell-off has so far failed to materialize. We maywell see a further challenge to the area between 0.7840 and07760, but this zone represents a good risk/reward play withlogical stop locations reasonably nearby for those with amedium term horizon. To the upside, reintegrating to the midpart of the recent range sees a potential run to 0.7970 wherewe start banging in to the tops of all the recent monthly valuearea highs. Any move beyond this triggers the stops of theweak shorts and brings the trend followers back into play. Amove above the April high finds there’s little meaningfulresistance all the way to just over 0.9000 where the 161.8%level of the earlier mentioned Fibonacci extension joinsforces with November 1995’s Deutsche Mark interpolatedhigh to cap the upside.
John Howard is Managing Director of JH Financials Ltd.
Figure 4. Short sterling future
August 2008 THE TECHNICAL ANALYST 11
Market Views
12 THE TECHNICAL ANALYST August 2008
Market Views
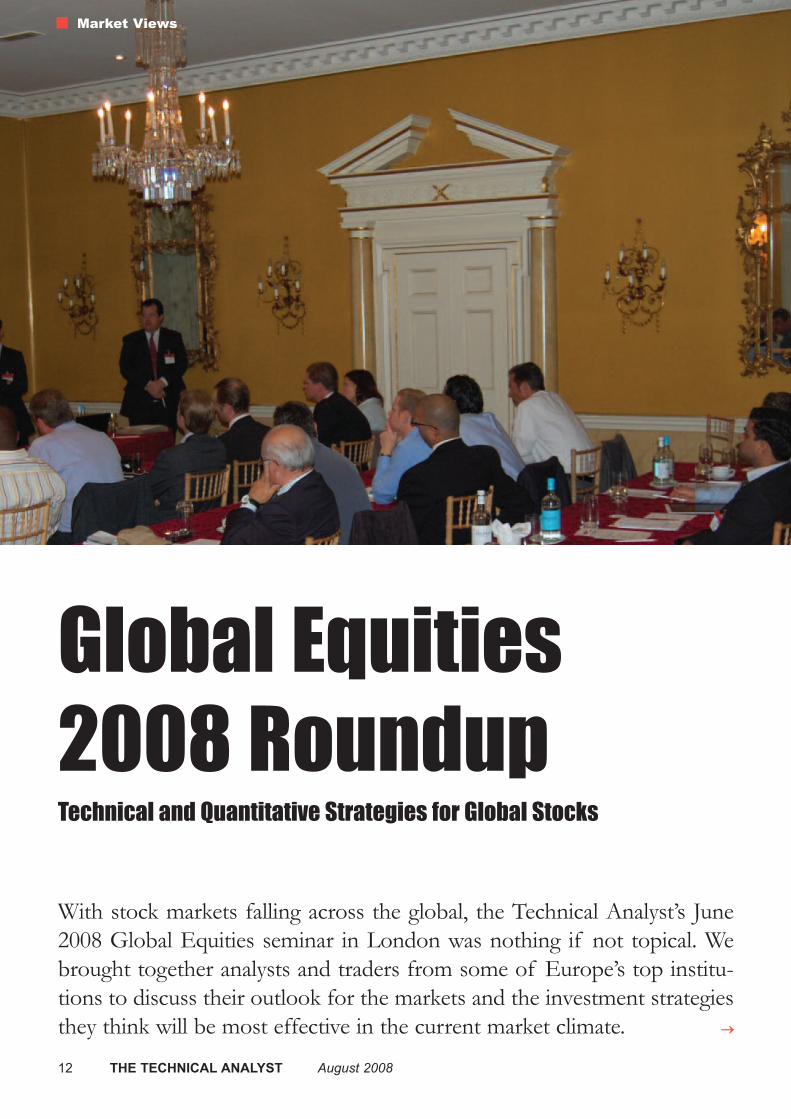
Global Equities2008 Roundup With stock markets falling across the global, the Technical Analyst’s June2008 Global Equities seminar in London was nothing if not topical. Webrought together analysts and traders from some of Europe’s top institu-tions to discuss their outlook for the markets and the investment strategiesthey think will be most effective in the current market climate. →→
Technical and Quantitative Strategies for Global Stocks
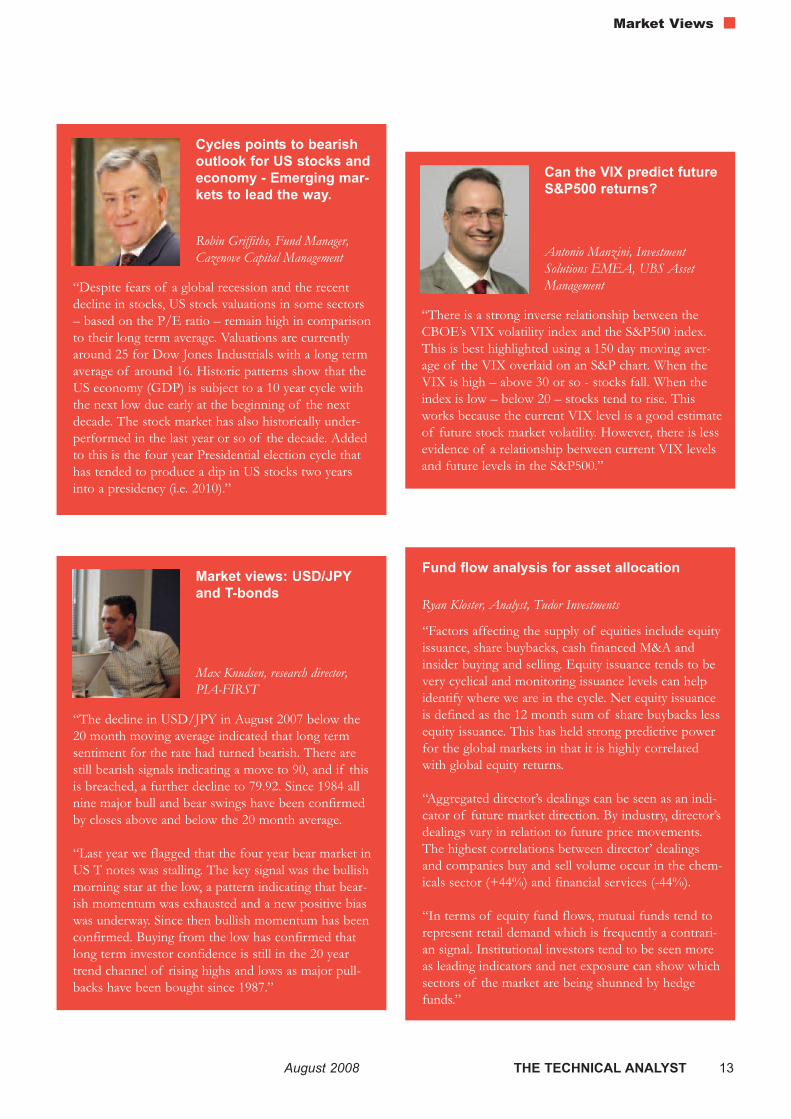
“Despite fears of a global recession and the recentdecline in stocks, US stock valuations in some sectors– based on the P/E ratio – remain high in comparisonto their long term average. Valuations are currentlyaround 25 for Dow Jones Industrials with a long termaverage of around 16. Historic patterns show that theUS economy (GDP) is subject to a 10 year cycle withthe next low due early at the beginning of the nextdecade. The stock market has also historically under-performed in the last year or so of the decade. Addedto this is the four year Presidential election cycle thathas tended to produce a dip in US stocks two yearsinto a presidency (i.e. 2010).”
August 2008 THE TECHNICAL ANALYST 13
Market Views
Cycles points to bearishoutlook for US stocks andeconomy - Emerging mar-kets to lead the way.
Robin Griffiths, Fund Manager,Cazenove Capital Management
“There is a strong inverse relationship between theCBOE’s VIX volatility index and the S&P500 index.This is best highlighted using a 150 day moving aver-age of the VIX overlaid on an S&P chart. When theVIX is high – above 30 or so - stocks fall. When theindex is low – below 20 – stocks tend to rise. Thisworks because the current VIX level is a good estimateof future stock market volatility. However, there is lessevidence of a relationship between current VIX levelsand future levels in the S&P500.”
Can the VIX predict futureS&P500 returns?
Antonio Manzini, InvestmentSolutions EMEA, UBS AssetManagement
“The decline in USD/JPY in August 2007 below the20 month moving average indicated that long termsentiment for the rate had turned bearish. There arestill bearish signals indicating a move to 90, and if thisis breached, a further decline to 79.92. Since 1984 allnine major bull and bear swings have been confirmedby closes above and below the 20 month average.
“Last year we flagged that the four year bear market inUS T notes was stalling. The key signal was the bullishmorning star at the low, a pattern indicating that bear-ish momentum was exhausted and a new positive biaswas underway. Since then bullish momentum has beenconfirmed. Buying from the low has confirmed thatlong term investor confidence is still in the 20 yeartrend channel of rising highs and lows as major pull-backs have been bought since 1987.”
Market views: USD/JPYand T-bonds
Max Knudsen, research director,PIA-FIRST
“Factors affecting the supply of equities include equityissuance, share buybacks, cash financed M&A andinsider buying and selling. Equity issuance tends to bevery cyclical and monitoring issuance levels can helpidentify where we are in the cycle. Net equity issuanceis defined as the 12 month sum of share buybacks lessequity issuance. This has held strong predictive powerfor the global markets in that it is highly correlatedwith global equity returns.
“Aggregated director’s dealings can be seen as an indi-cator of future market direction. By industry, director’sdealings vary in relation to future price movements.The highest correlations between director’ dealingsand companies buy and sell volume occur in the chem-icals sector (+44%) and financial services (-44%).
“In terms of equity fund flows, mutual funds tend torepresent retail demand which is frequently a contrari-an signal. Institutional investors tend to be seen moreas leading indicators and net exposure can show whichsectors of the market are being shunned by hedgefunds.”
Fund flow analysis for asset allocation
Ryan Kloster, Analyst, Tudor Investments

IFTA200821 st ANNUAL IFTA CONFERENCE
6-8 November 2008
Le Meridien EtoileParis, France
www.iftaparis2008.com
contact : [email protected]
Information and regular updates on the congress website
Join us in Paris from 6 to 8 November 2008
for the 21st IFTA Annual Conference
August 2008 THE TECHNICAL ANALYST 15
Market Views
Buying stocks in 2008 will require far greater discriminationthan ever before. Now stocks have reached a top and havestarted trending down, they will continue to work lower andrallies will get smaller. Severe declines will be followed byeven quicker rallies. It will be necessary most of the time fora trader to be very agile and manage positions quickly in orderto take advantage of the opportunities as they develop.
The 30-year cycleThis year comes at the end of a 5-year bull market phase. Thebull market, which began in October 2002, has lasted as longas might have been expected from a study of W.D. Gann’swork. Gann states there are usually two significant bullMarkets every thirty years. Typically, the first bull marketbegins in years ending with a “2” such as 1922, 1952 and1982, and typically ends in the 9th or “0” year of the pattern(1929, 1959, 1990). There is usually a major correction in the7th year like 1927, 1957 and 1987. The second bull market isusually shorter than the first and typically begins in the“12th” year of the pattern (1932, 1962, 1992). It is usuallyends in the “17th” year (1937, 1967, 1997), after which a con-solidation or sideways pattern of approximately 13-yearsbegins with a slight upward bias.
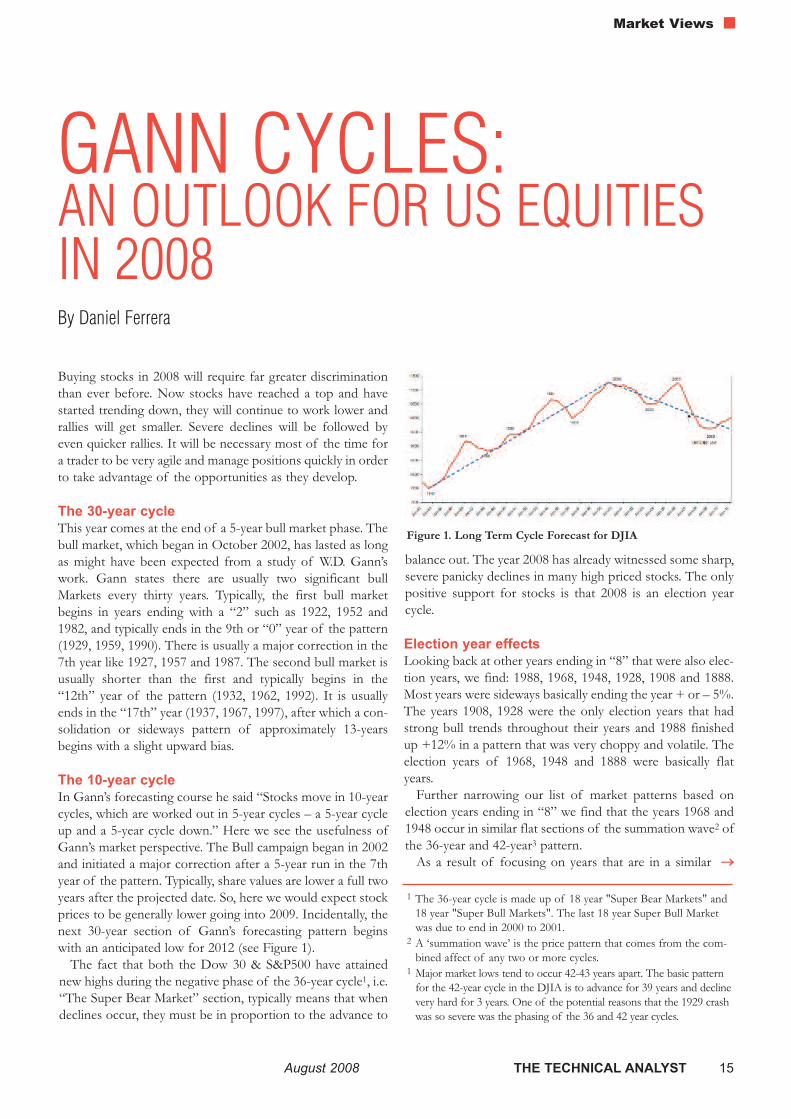
The 10-year cycleIn Gann’s forecasting course he said “Stocks move in 10-yearcycles, which are worked out in 5-year cycles – a 5-year cycleup and a 5-year cycle down.” Here we see the usefulness ofGann’s market perspective. The Bull campaign began in 2002and initiated a major correction after a 5-year run in the 7thyear of the pattern. Typically, share values are lower a full twoyears after the projected date. So, here we would expect stockprices to be generally lower going into 2009. Incidentally, thenext 30-year section of Gann’s forecasting pattern beginswith an anticipated low for 2012 (see Figure 1).
The fact that both the Dow 30 & S&P500 have attainednew highs during the negative phase of the 36-year cycle1, i.e.“The Super Bear Market” section, typically means that whendeclines occur, they must be in proportion to the advance to
balance out. The year 2008 has already witnessed some sharp,severe panicky declines in many high priced stocks. The onlypositive support for stocks is that 2008 is an election yearcycle.
Election year effectsLooking back at other years ending in “8” that were also elec-tion years, we find: 1988, 1968, 1948, 1928, 1908 and 1888.Most years were sideways basically ending the year + or – 5%.The years 1908, 1928 were the only election years that hadstrong bull trends throughout their years and 1988 finishedup +12% in a pattern that was very choppy and volatile. Theelection years of 1968, 1948 and 1888 were basically flatyears.
Further narrowing our list of market patterns based onelection years ending in “8” we find that the years 1968 and1948 occur in similar flat sections of the summation wave2 ofthe 36-year and 42-year3 pattern.
As a result of focusing on years that are in a similar
GANN CYCLES: AN OUTLOOK FOR US EQUITIESIN 2008By Daniel Ferrera
Figure 1. Long Term Cycle Forecast for DJIA
1 The 36-year cycle is made up of 18 year "Super Bear Markets" and18 year "Super Bull Markets". The last 18 year Super Bull Marketwas due to end in 2000 to 2001.
2 A ‘summation wave’ is the price pattern that comes from the com-bined affect of any two or more cycles.
1 Major market lows tend to occur 42-43 years apart. The basic patternfor the 42-year cycle in the DJIA is to advance for 39 years and declinevery hard for 3 years. One of the potential reasons that the 1929 crashwas so severe was the phasing of the 36 and 42 year cycles.
→→
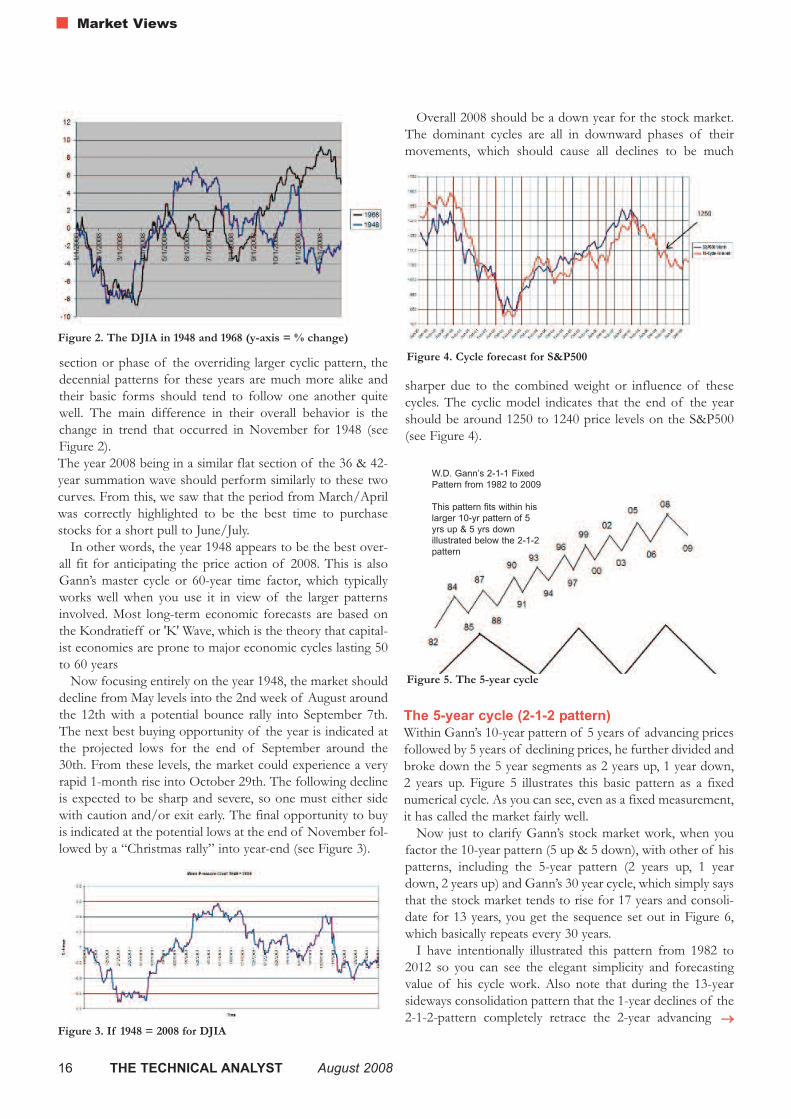
section or phase of the overriding larger cyclic pattern, thedecennial patterns for these years are much more alike andtheir basic forms should tend to follow one another quitewell. The main difference in their overall behavior is thechange in trend that occurred in November for 1948 (seeFigure 2). The year 2008 being in a similar flat section of the 36 & 42-year summation wave should perform similarly to these twocurves. From this, we saw that the period from March/Aprilwas correctly highlighted to be the best time to purchasestocks for a short pull to June/July.
In other words, the year 1948 appears to be the best over-all fit for anticipating the price action of 2008. This is alsoGann’s master cycle or 60-year time factor, which typicallyworks well when you use it in view of the larger patternsinvolved. Most long-term economic forecasts are based onthe Kondratieff or 'K' Wave, which is the theory that capital-ist economies are prone to major economic cycles lasting 50to 60 years
Now focusing entirely on the year 1948, the market shoulddecline from May levels into the 2nd week of August aroundthe 12th with a potential bounce rally into September 7th.The next best buying opportunity of the year is indicated atthe projected lows for the end of September around the30th. From these levels, the market could experience a veryrapid 1-month rise into October 29th. The following declineis expected to be sharp and severe, so one must either sidewith caution and/or exit early. The final opportunity to buyis indicated at the potential lows at the end of November fol-lowed by a “Christmas rally” into year-end (see Figure 3).
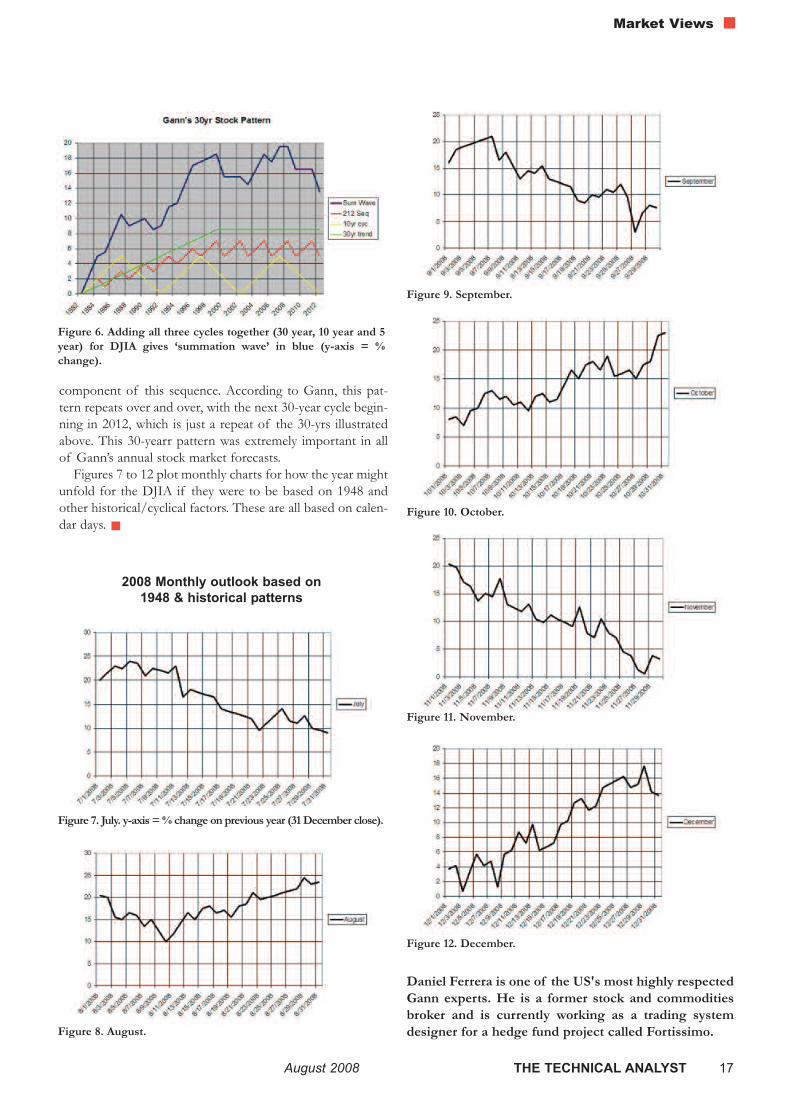
Overall 2008 should be a down year for the stock market.The dominant cycles are all in downward phases of theirmovements, which should cause all declines to be much
sharper due to the combined weight or influence of thesecycles. The cyclic model indicates that the end of the yearshould be around 1250 to 1240 price levels on the S&P500(see Figure 4).
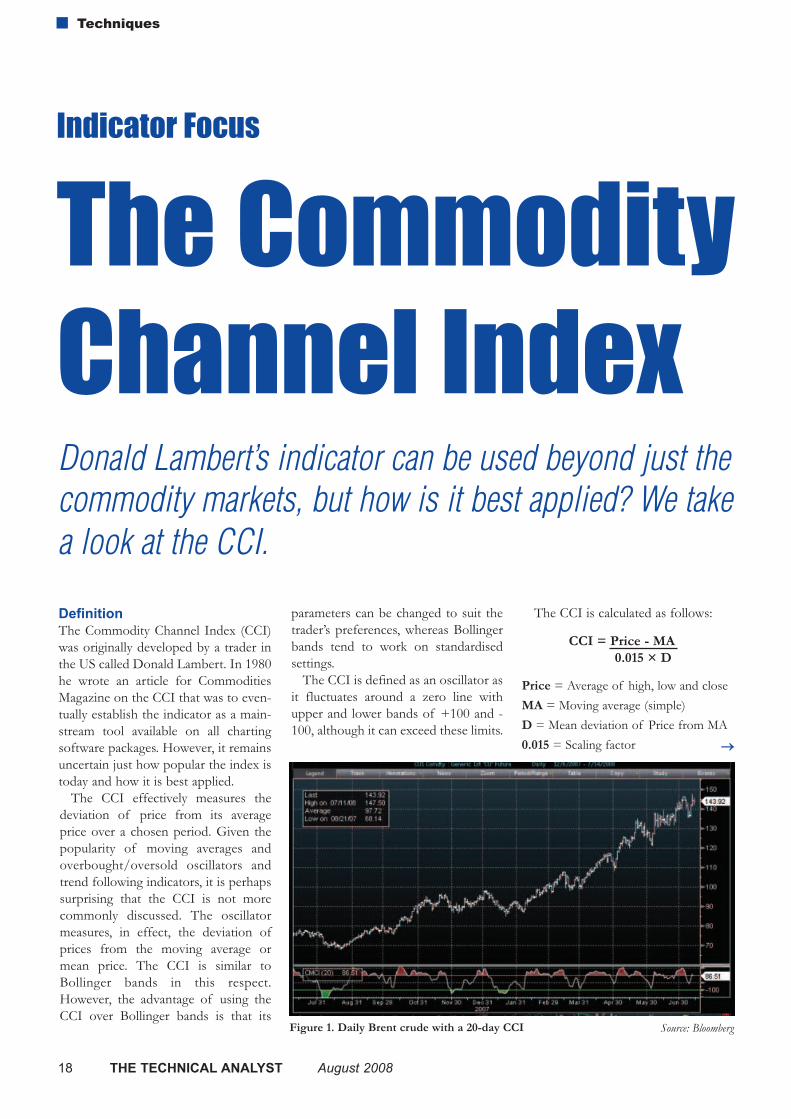
The 5-year cycle (2-1-2 pattern)Within Gann’s 10-year pattern of 5 years of advancing pricesfollowed by 5 years of declining prices, he further divided andbroke down the 5 year segments as 2 years up, 1 year down,2 years up. Figure 5 illustrates this basic pattern as a fixednumerical cycle. As you can see, even as a fixed measurement,it has called the market fairly well.
Now just to clarify Gann’s stock market work, when youfactor the 10-year pattern (5 up & 5 down), with other of hispatterns, including the 5-year pattern (2 years up, 1 yeardown, 2 years up) and Gann’s 30 year cycle, which simply saysthat the stock market tends to rise for 17 years and consoli-date for 13 years, you get the sequence set out in Figure 6,which basically repeats every 30 years.
I have intentionally illustrated this pattern from 1982 to2012 so you can see the elegant simplicity and forecastingvalue of his cycle work. Also note that during the 13-yearsideways consolidation pattern that the 1-year declines of the2-1-2-pattern completely retrace the 2-year advancing
Figure 2. The DJIA in 1948 and 1968 (y-axis = % change)
Figure 3. If 1948 = 2008 for DJIA
Figure 4. Cycle forecast for S&P500
Figure 5. The 5-year cycle
W.D. Gann’s 2-1-1 FixedPattern from 1982 to 2009
This pattern fits within hislarger 10-yr pattern of 5yrs up & 5 yrs downillustrated below the 2-1-2pattern
→→
Market Views
16 THE TECHNICAL ANALYST August 2008
component of this sequence. According to Gann, this pat-tern repeats over and over, with the next 30-year cycle begin-ning in 2012, which is just a repeat of the 30-yrs illustratedabove. This 30-yearr pattern was extremely important in allof Gann’s annual stock market forecasts.
Figures 7 to 12 plot monthly charts for how the year mightunfold for the DJIA if they were to be based on 1948 andother historical/cyclical factors. These are all based on calen-dar days.
Figure 6. Adding all three cycles together (30 year, 10 year and 5year) for DJIA gives ‘summation wave’ in blue (y-axis = %change).
Daniel Ferrera is one of the US's most highly respectedGann experts. He is a former stock and commoditiesbroker and is currently working as a trading systemdesigner for a hedge fund project called Fortissimo.
Figure 7. July. y-axis = % change on previous year (31 December close).
Figure 8. August.
Figure 9. September.
Figure 10. October.
Figure 11. November.
Figure 12. December.
2008 Monthly outlook based on 1948 & historical patterns
August 2008 THE TECHNICAL ANALYST 17
Market Views
DefinitionThe Commodity Channel Index (CCI)was originally developed by a trader inthe US called Donald Lambert. In 1980he wrote an article for CommoditiesMagazine on the CCI that was to even-tually establish the indicator as a main-stream tool available on all chartingsoftware packages. However, it remainsuncertain just how popular the index istoday and how it is best applied.
The CCI effectively measures thedeviation of price from its averageprice over a chosen period. Given thepopularity of moving averages andoverbought/oversold oscillators andtrend following indicators, it is perhapssurprising that the CCI is not morecommonly discussed. The oscillatormeasures, in effect, the deviation ofprices from the moving average ormean price. The CCI is similar toBollinger bands in this respect.However, the advantage of using theCCI over Bollinger bands is that its
parameters can be changed to suit thetrader’s preferences, whereas Bollingerbands tend to work on standardisedsettings.
The CCI is defined as an oscillator asit fluctuates around a zero line withupper and lower bands of +100 and -100, although it can exceed these limits.
The CCI is calculated as follows:
CCI = Price - MA 0.015 × D
Price = Average of high, low and close MA = Moving average (simple)D = Mean deviation of Price from MA0.015 = Scaling factor
Donald Lambert’s indicator can be used beyond just thecommodity markets, but how is it best applied? We takea look at the CCI.
→→
The CommodityChannel Index
Figure 1. Daily Brent crude with a 20-day CCI
Indicator Focus
Source: Bloomberg
18 THE TECHNICAL ANALYST August 2008
Techniques

August 2008 THE TECHNICAL ANALYST 19
Techniques
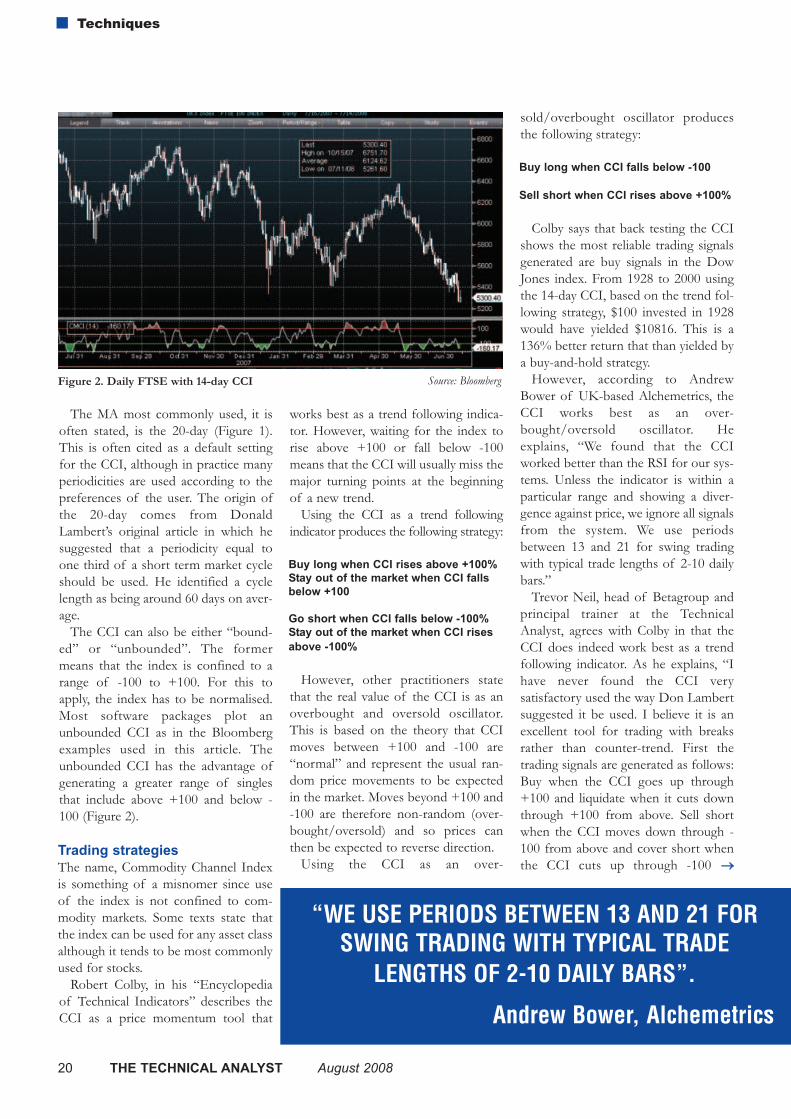
The MA most commonly used, it isoften stated, is the 20-day (Figure 1).This is often cited as a default settingfor the CCI, although in practice manyperiodicities are used according to thepreferences of the user. The origin ofthe 20-day comes from DonaldLambert’s original article in which hesuggested that a periodicity equal toone third of a short term market cycleshould be used. He identified a cyclelength as being around 60 days on aver-age.
The CCI can also be either “bound-ed” or “unbounded”. The formermeans that the index is confined to arange of -100 to +100. For this toapply, the index has to be normalised.Most software packages plot anunbounded CCI as in the Bloombergexamples used in this article. Theunbounded CCI has the advantage ofgenerating a greater range of singlesthat include above +100 and below -100 (Figure 2).
Trading strategies The name, Commodity Channel Indexis something of a misnomer since useof the index is not confined to com-modity markets. Some texts state thatthe index can be used for any asset classalthough it tends to be most commonlyused for stocks.
Robert Colby, in his “Encyclopediaof Technical Indicators” describes theCCI as a price momentum tool that
works best as a trend following indica-tor. However, waiting for the index torise above +100 or fall below -100means that the CCI will usually miss themajor turning points at the beginningof a new trend.
Using the CCI as a trend followingindicator produces the following strategy:
Buy long when CCI rises above +100%Stay out of the market when CCI fallsbelow +100
Go short when CCI falls below -100%Stay out of the market when CCI risesabove -100%
However, other practitioners statethat the real value of the CCI is as anoverbought and oversold oscillator.This is based on the theory that CCImoves between +100 and -100 are“normal” and represent the usual ran-dom price movements to be expectedin the market. Moves beyond +100 and-100 are therefore non-random (over-bought/oversold) and so prices canthen be expected to reverse direction.
Using the CCI as an over-
sold/overbought oscillator producesthe following strategy:
Buy long when CCI falls below -100
Sell short when CCI rises above +100%
Colby says that back testing the CCIshows the most reliable trading signalsgenerated are buy signals in the DowJones index. From 1928 to 2000 usingthe 14-day CCI, based on the trend fol-lowing strategy, $100 invested in 1928would have yielded $10816. This is a136% better return that than yielded bya buy-and-hold strategy.
However, according to AndrewBower of UK-based Alchemetrics, theCCI works best as an over-bought/oversold oscillator. Heexplains, “We found that the CCIworked better than the RSI for our sys-tems. Unless the indicator is within aparticular range and showing a diver-gence against price, we ignore all signalsfrom the system. We use periodsbetween 13 and 21 for swing tradingwith typical trade lengths of 2-10 dailybars.”
Trevor Neil, head of Betagroup andprincipal trainer at the TechnicalAnalyst, agrees with Colby in that theCCI does indeed work best as a trendfollowing indicator. As he explains, “Ihave never found the CCI very satisfactory used the way Don Lambert suggested it be used. I believe it is anexcellent tool for trading with breaksrather than counter-trend. First thetrading signals are generated as follows:Buy when the CCI goes up through+100 and liquidate when it cuts downthrough +100 from above. Sell shortwhen the CCI moves down through -100 from above and cover short whenthe CCI cuts up through -100
20 THE TECHNICAL ANALYST August 2008
Techniques
Figure 2. Daily FTSE with 14-day CCI Source: Bloomberg
“WE USE PERIODS BETWEEN 13 AND 21 FORSWING TRADING WITH TYPICAL TRADE
LENGTHS OF 2-10 DAILY BARS”.
Andrew Bower, Alchemetrics
→→
from below. Secondly use a periodmuch larger than normal, say 80 or
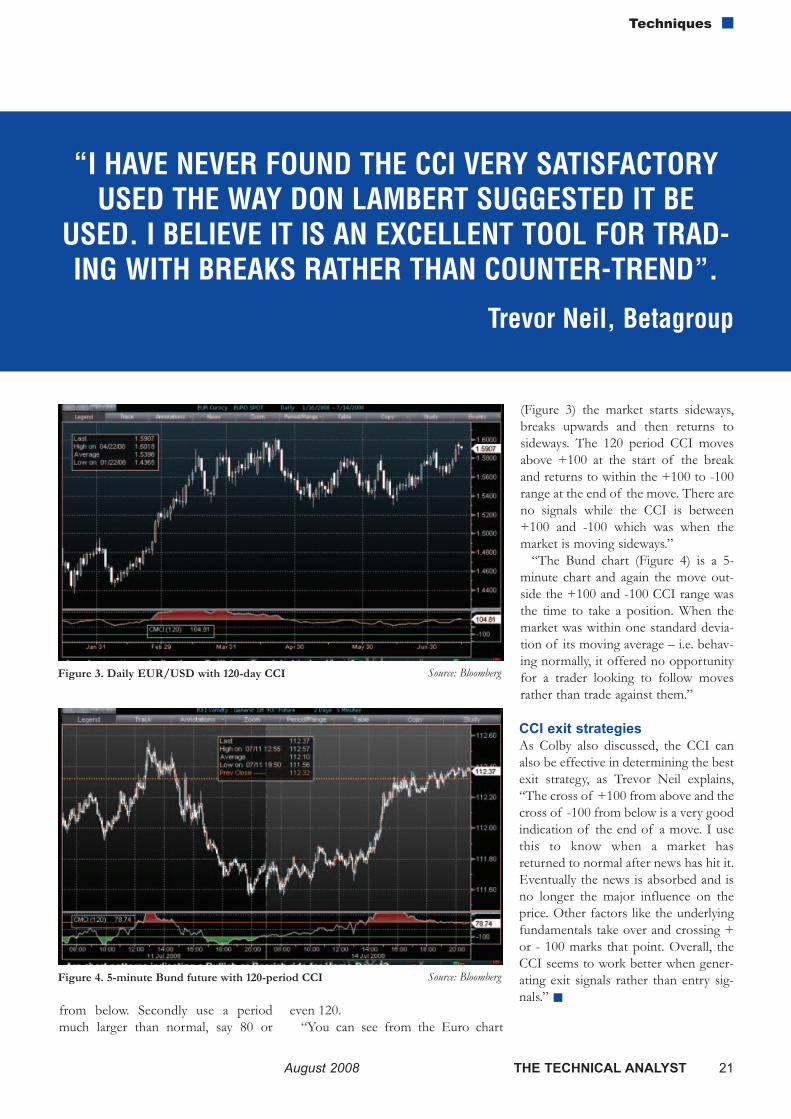
even 120. “You can see from the Euro chart
(Figure 3) the market starts sideways,breaks upwards and then returns tosideways. The 120 period CCI movesabove +100 at the start of the breakand returns to within the +100 to -100range at the end of the move. There areno signals while the CCI is between+100 and -100 which was when themarket is moving sideways.”
“The Bund chart (Figure 4) is a 5-minute chart and again the move out-side the +100 and -100 CCI range wasthe time to take a position. When themarket was within one standard devia-tion of its moving average – i.e. behav-ing normally, it offered no opportunityfor a trader looking to follow movesrather than trade against them.”
CCI exit strategies As Colby also discussed, the CCI canalso be effective in determining the bestexit strategy, as Trevor Neil explains,“The cross of +100 from above and thecross of -100 from below is a very goodindication of the end of a move. I usethis to know when a market hasreturned to normal after news has hit it.Eventually the news is absorbed and isno longer the major influence on theprice. Other factors like the underlyingfundamentals take over and crossing +or - 100 marks that point. Overall, theCCI seems to work better when gener-ating exit signals rather than entry sig-nals.”
Figure 3. Daily EUR/USD with 120-day CCI Source: Bloomberg
Figure 4. 5-minute Bund future with 120-period CCI Source: Bloomberg
“I HAVE NEVER FOUND THE CCI VERY SATISFACTORYUSED THE WAY DON LAMBERT SUGGESTED IT BE
USED. I BELIEVE IT IS AN EXCELLENT TOOL FOR TRAD-ING WITH BREAKS RATHER THAN COUNTER-TREND”.
Trevor Neil, Betagroup
August 2008 THE TECHNICAL ANALYST 21
Techniques

Bear Markets: Definitions and Strategies
22 THE TECHNICAL ANALYST August 2008
Techniques
What is a bear market? Recent news reports have focusedrelentlessly on the move of the majorequity indices into bear market territo-ry. Much has been made of the 20%decline “rule”. Indeed in July, US equi-ties did fall 20% from their peak inOctober and European indices fell 25%from their peak in June last year.
Some analysts say this decline musthappen over two to three monthswhich allows for sharp declines, such as1987 where a 20% fall retraced quicklywithout a bear market ensuing.Alternative definitions or confirma-tions of a bear market include a 20%decline from the market’s 52-week high(rather than the most recent peak). Ithas also been said the decline must beaccompanied by a fall below the 200-day moving average.
According to Albert Edwards,Equity Strategist at Societe Generaleand a well known long time bear, “Thebear market definition is purely arbi-trary but seems to have been collective-ly adopted by the industry, a bit like
technical recession definition being twoback to back negative quarters of GDPgrowth.”
Harry Schultz who publishes thefamous HSL newsletter in the US saysthe current talk of a bear market fitswith his experience. “A 20% fall in theDow is when it is clear that whateverhad driven the market up in the preced-
ing bull market is no longer there. Theweek after the Bear Stearns bail out,one of my staff spoke at an investmentclub on April 11th and announced thatthe US was in a bear market which at aminimum would last for 24 months.
“Now many in the print media are get-ting round to admitting we are in a bearmarket, but are writing articles quotingWarren Buffet saying he hopes his stocksfall 50% so he can buy more at fire saleprices. This sounds a lot like 1930 whenmajor investors like the Rockefellersbought halfway down the fall becausethey were convinced the decline was allover. It is never over until volumeshrinks and nobody is interested in buy-ing anything anymore. As long as folks
look for places to buy back in, we knowwe have further to fall.”
Market sentiment James Chu, Chief Investment officer atBlue Sky Asset Management in Londonsays, “I see the 20% definition more asa confirmation. I think you need to seea 20% decline over a period of twomonths or a quarter. The problem thenis in deciding whether a continuation ofthe bear market is likely or whetherthere are interesting value opportunitiesto be had.
“A year or so ago, we we saw stockmarkets in China and India correctingover 20%, before staging a quick recov-ery and continuing the bull trend. Wetherefore see the term "bear market"more as a reflection of market sentimentrather than confirmation of a trend. Abear market is simply one where theyhave lost money in investment.”
A recent report by Mislav Matejka,Senior Equity Quantitative Strategist atJP Morgan Chase in London, looks atbear markets in the major indices overthe past 100 years in the US and 40years in Europe. He found that therehave been 19 bear markets in the USsince 1900 defined as a 20% fall inprice. For the S&P500 the median fallin prices during a technical recession is32% with an average duration of 14months. In Europe, the median fall inprices is 35% although the duration ismuch shorter at only 6 months. Unlikeprevious recessions, P/E ratios in theUS remain quite high at 20, still abovethe long-term average of 15.4. →→
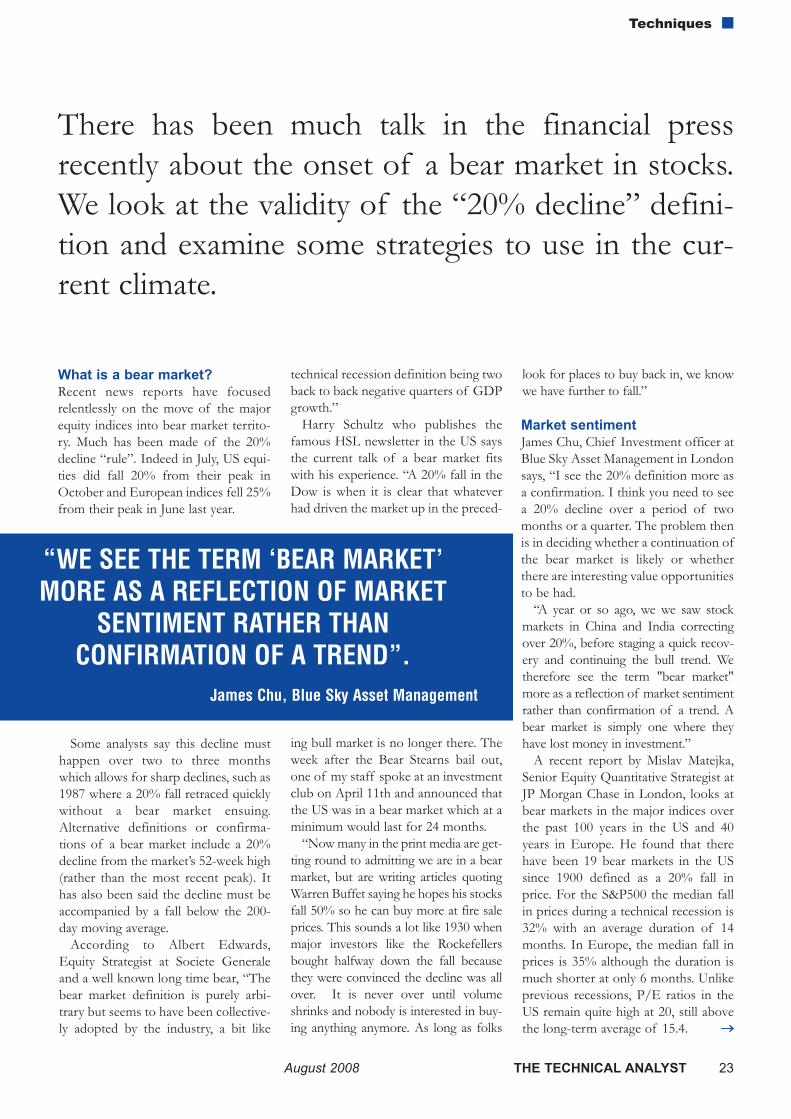
There has been much talk in the financial pressrecently about the onset of a bear market in stocks.We look at the validity of the “20% decline” defini-tion and examine some strategies to use in the cur-rent climate.
“WE SEE THE TERM ‘BEAR MARKET’MORE AS A REFLECTION OF MARKET
SENTIMENT RATHER THAN CONFIRMATION OF A TREND”.
James Chu, Blue Sky Asset Management
August 2008 THE TECHNICAL ANALYST 23
Techniques
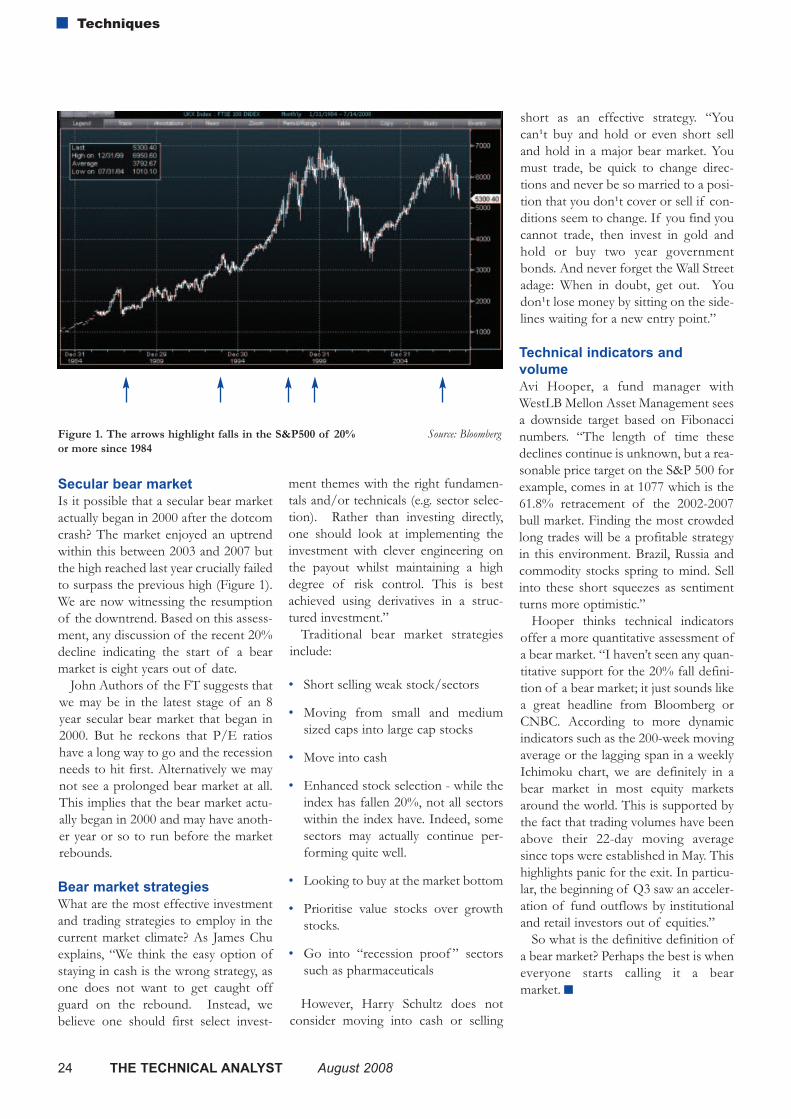
Secular bear market Is it possible that a secular bear marketactually began in 2000 after the dotcomcrash? The market enjoyed an uptrendwithin this between 2003 and 2007 butthe high reached last year crucially failedto surpass the previous high (Figure 1).We are now witnessing the resumptionof the downtrend. Based on this assess-ment, any discussion of the recent 20%decline indicating the start of a bearmarket is eight years out of date.
John Authors of the FT suggests thatwe may be in the latest stage of an 8year secular bear market that began in2000. But he reckons that P/E ratioshave a long way to go and the recessionneeds to hit first. Alternatively we maynot see a prolonged bear market at all.This implies that the bear market actu-ally began in 2000 and may have anoth-er year or so to run before the marketrebounds.
Bear market strategies What are the most effective investmentand trading strategies to employ in thecurrent market climate? As James Chuexplains, “We think the easy option ofstaying in cash is the wrong strategy, asone does not want to get caught offguard on the rebound. Instead, webelieve one should first select invest-
ment themes with the right fundamen-tals and/or technicals (e.g. sector selec-tion). Rather than investing directly,one should look at implementing theinvestment with clever engineering onthe payout whilst maintaining a highdegree of risk control. This is bestachieved using derivatives in a struc-tured investment.”
Traditional bear market strategiesinclude:
• Short selling weak stock/sectors
• Moving from small and mediumsized caps into large cap stocks
• Move into cash
• Enhanced stock selection - while theindex has fallen 20%, not all sectorswithin the index have. Indeed, somesectors may actually continue per-forming quite well.
• Looking to buy at the market bottom
• Prioritise value stocks over growthstocks.
• Go into “recession proof ” sectorssuch as pharmaceuticals
However, Harry Schultz does notconsider moving into cash or selling
short as an effective strategy. “Youcan¹t buy and hold or even short selland hold in a major bear market. Youmust trade, be quick to change direc-tions and never be so married to a posi-tion that you don¹t cover or sell if con-ditions seem to change. If you find youcannot trade, then invest in gold andhold or buy two year governmentbonds. And never forget the Wall Streetadage: When in doubt, get out. Youdon¹t lose money by sitting on the side-lines waiting for a new entry point.”
Technical indicators and volume Avi Hooper, a fund manager withWestLB Mellon Asset Management seesa downside target based on Fibonaccinumbers. “The length of time thesedeclines continue is unknown, but a rea-sonable price target on the S&P 500 forexample, comes in at 1077 which is the61.8% retracement of the 2002-2007bull market. Finding the most crowdedlong trades will be a profitable strategyin this environment. Brazil, Russia andcommodity stocks spring to mind. Sellinto these short squeezes as sentimentturns more optimistic.”
Hooper thinks technical indicatorsoffer a more quantitative assessment ofa bear market. “I haven’t seen any quan-titative support for the 20% fall defini-tion of a bear market; it just sounds likea great headline from Bloomberg orCNBC. According to more dynamicindicators such as the 200-week movingaverage or the lagging span in a weeklyIchimoku chart, we are definitely in abear market in most equity marketsaround the world. This is supported bythe fact that trading volumes have beenabove their 22-day moving averagesince tops were established in May. Thishighlights panic for the exit. In particu-lar, the beginning of Q3 saw an acceler-ation of fund outflows by institutionaland retail investors out of equities.”
So what is the definitive definition ofa bear market? Perhaps the best is wheneveryone starts calling it a bear market.
Figure 1. The arrows highlight falls in the S&P500 of 20%or more since 1984
Source: Bloomberg
24 THE TECHNICAL ANALYST August 2008
Techniques

presents
A premier event for traders and investment managers
Speakers include:
FX Trading2008
24 October 2008
30 Pavillion Road
London SW1
Register Today!
Topics Covered: Who should attend:
Gerry Celaya Redtower AssetManagement
Xavier Porterfield FX Concepts
Francis Breedon Imperial College
Kristjan KasikovCitigroup
Elena Ambrosiadou IKOS AssetManagement
Delegate fee: £495 + VATRegister by 31 August for £100 early bird discount = £395 + VAT
Per-Erik Karlsson Advantage Financial
+ Intra-day volume + Advanced trend following + Future of the carry trade + Top currency fund techniques + Time-of-day patterns + Long term FX strategies
+ Fund managers + Hedge funds + Traders + Risk managers + Analysts + Brokers
The Technical Analyst is proud to present “FX Trading Strategies”, a one day seminar for traders, investment managers and analysts. Bringing together leading experts in the field of currency trading and fund management, the event will look to assess the effectiveness of the various FX trading strategies such as trend following and the carry trade in the current market climate.
Web: www.technicalanalyst.co.uk
Telephone: +44 (0)1483 573150Email: [email protected]
Strategies
It’s almost a given, even amongst the most committed effi-cient market protagonists, that price highs and price lowsplay a significant role in trader and investment psychology.In technical analysis, the role is even more overt. Price highsand lows are the basis upon which patterns are drawn, pricetargets estimated, breakouts related to, and many oscillatorsand indictors built around.
Many strategies, particularly in equities, are also builtaround an observation of what happens to volumes at suchcrucial levels and/or as these levels are breeched, but therestill remains some doubt as to what exactly happens to vol-ume around these important points. Does volume rise lin-early as the value of n in ‘n-day’ highs and lows rises? Howlong do abnormal levels of turnover persist for after a highor low is reached? And does such information tell us any-thing about the returns available?
Two researchers at Rutgers University in the US – BruceMizrach and Susan Weerts – have tried to provide quantita-tive answers to these questions.
Random sample of US equities Mizrach, an associate professor in the economics depart-ment and a former economist at the Federal Reserve Bankof New York, and Susan Weerts, also in the economicsdepartment, randomly selected 1,000 stocks from theNYSE and NASDAQ from all the stocks that traded on thetwo exchanges between 1 January 1993 and 31 October2003. 849 stocks were included in the final sample andseven n-day high and low intervals were included in thestudy, namely: 10-day, 25-day, 50-day, 100-day, 150-day, 200-day and 52-week.
Turnover rises dramatically on the day Several things are clear from their work. Firstly, turnoverdoes indeed go up significantly on days when n-day highsare made for all intervals except the 10-day high. Meanturnover rises from 7% for the 25-day high to a staggering69% for the 52-week high. In percentile terms, turnover isin the 75th percentile for the 25-day high and in the 90thpercentile for the 52-week high. For n-day lows, surges inturnover are less pronounced, which Mizrach and Weertssay is consistent with the usual result that bull markets havehigher volume. Mean turnover increases from 6% for the50-day low to 26% for the 150-day low. Both the 10-dayand 25-day intervals fall below the sample means.
Volume drifts backWhat happens to volume after the highs or lows are made?The authors looked at what they termed “the persistence ofturnover” for ten days after the n-day high/low is made,and found that turnover drifts down after a price-high ismade. Abnormal turnover is significantly negative for 10- to100-day highs after the second day for the full ten days. Onthe other hand, while turnover also falls for the 200-day and52-week highs, the initial surge is so large that turnover isstill abnormally positive for six to ten days after the event.
For price lows, abnormal turnover also falls after theevent day. The 10-day, 50-day, 150-day and 52-week lowshow significantly negative abnormal turnover for the fullten days after the low is achieved.
Buy the lowsMizrach and Weerts then looked at the returns available totraders. Sure enough, if a trader can capture the pricemovement on the event day then there is profit to be had.For example, abnormal returns on event day highs rangefrom 2.7% for the 52-week high to 3.4% for the 50-day.
Capturing these returns obviously requires a certain skilland the method by which one might be able to do this isnot discussed in the paper. However, of greater interest, iswhat they term the “persistence of returns”. In otherwords, are there returns to be had after the event day?
26 THE TECHNICAL ANALYST August 2008
Techniques
1 151 stocks were discarded due to changes in symbols and notenough data.
2 Although there is a noticeable drop from the 200-day low to the 52-week low.
What happens to volume athighs and lows?
"FOR THE 200-DAY AND 52-WEEKHIGHS, THE INITIAL SURGE IS SOLARGE THAT TURNOVER IS STILLABNORMALLY POSITIVE FOR SIXTO TEN DAYS AFTER THE EVENT."
→→
In this regard, the authors note there is a negative, one-day abnormal return after an n-day high is achieved.Unfortunately, this reversal is not particularly large and onlyslightly exceeds -0.5%. Abnormal returns are almost zeroafter the second day.
More encouragingly, Mizrach and Weerts also noted thatreturns reverse after an n-day low but, in contrast to thehighs, the risk reward tradeoff is excellent. Abnormalreturns for going long after an n-day low range from 0.5%for the 10-day to 1.2% for the 52-week. Risk adjustedreturns are significantly positive for n > 25.
Their conclusion is stark. “Traders should not shortstocks hitting new lows. There are strong, persistent rever-sals with significant risk adjusted returns on long positionsfor up to six days following an n-day low.” The results “sug-gest ignoring the trend when n-day highs are achieved andbeing contrarian on n-day lows.”
Reference: Bruce Mizrach and Susan Weerts , “High and Lows: ABehavioural and Technical Analysis”, forthcoming in AppliedFinancial Economics. An electronic copy of this paper is available atwww.ssrn.com.
August 2008 THE TECHNICAL ANALYST 27
Techniques
The following article identifies two broad categories of sen-timent indices currently used as a proxy for true market sen-timent and the inherent flaws of each. As an alternative tothese imperfect solutions, we introduce a new approach andmethodology employed by the First Coverage Sell-SideSentiment Index. As you’ll see, we believe this finally managesto resolve many of the more troubling issues discussed andimproves markedly on existing solutions.
Current SolutionsPrevious attempts to create a sentiment indicator have broad-ly fallen into two categories. The first are based primarily onsurveys. This group would include indices such as the Sentix,the Consensus Bullish Sentiment Index and the Advisor’sSentiment, to name a few. The second type of sentimentindicator is generated by examining past actions investorshave taken in other areas of the markets. This group wouldinclude indicators derived by Put /Call Ratios, Marketinflows, the Commitment of Traders Report, Vickers InsiderIndex, and others.
Both models have obvious flaws.For one, indicators created using survey answers are limit-
ed by the patience of individuals to answer questions. It’ssimple to ask someone what they think of a particular mar-ket over the upcoming week, but it gets much more difficultto generate responses for each sector, sub sector and ticker.Eventually, instead of being able to get an answer for thenext question, the questioner becomes an imposition and is
shown the door. Because of this, ‘sentiment’ by survey hasonly ever been able to be applied at the highest levels and hasnever been generated on a consistent basis with any degree ofmarket granularity thereby significantly limiting its applicabil-ity across a broad range of investment strategies.
Beyond the limited depth of information obtained via sur-vey indicators, there is also always the question of credibility.History is full of people not saying exactly what they mean,why would surveys about the market be any different?Throw in the added twist that money and profits are on theline, that people can be ‘talking their book’, or even just goingalong with the crowd to minimize their own risk, it’s littlewonder that indicators derived by surveys have a history ofonly working at the extremes and even then as contrary indi-cators.
Alternatively, models that calculate sentiment by deriving itfrom other objective data have the benefit of being able togenerate much greater granularity. However, here the chal-lenge is eliminating white noise or extraneous influencesfrom the data.
Since these indicators are unable to ask a clear question asin a survey situation, one can never be certain if what they’regetting is a clear answer. Truth be told, it’s almost a certain-ty the other way, that what is being called and isolated as ‘sen-timent’ is being impacted by other concerns. Is VIX onlycapturing the fear in the market place? Is the COT report justgiving you the overall sentiment of the Commercial traders?Clearly, the answer in all these situations is ‘No’.
BETTER SENTIMENTBy Randy Cass
→→
28 THE TECHNICAL ANALYST August 2008
Techniques
For decades, institutional investors have sought to generate Alpha by bettergauging the sentiment of other market participants. After all, what betterway to profit than to try and understand the underlying thoughts of thosearound you prior to making investment decisions? Even with such obviousincentives to succeed, attempts to create a conclusive and credible predictive‘sentiment’ indicator have consistently fallen short.
’Derived’ sentiment indicators, incorporate extraneous fac-tors when they should instead be isolated from the equationentirely.
While institutional investors continue to use traditionalmeasures of sentiment, the search for a superior indicatorcontinues in earnest.
A Better WayIdeally, an improved sentiment indicator would be able totake the best of both worlds and eliminate the worst. A newindicator, if built ideally, would be based upon the real-worldactions of investors as opposed to their potentially subjectiveresponses, and would also ensure that ‘noise’ was strippedaway from the overall equation. In addition, it’s important toestablish a process that can provides granularity all the waydown to the ticker level.
Finally, and perhaps most importantly, investors shouldknow that the opinions being relied upon to derive sentimentare being given in an environment where there are ramifica-tions for being wrong and rewards for being right. Any otherscenario leads to questions about credibility, possible ambigu-ity and external noise surrounding the integrity of the data.There must be consequences to the originator of the opinionthat incentivize them to provide their ‘best’ answer so theaggregated sentiment levels are built upon ‘clean’ data deliv-ered with confidence and surety.
It is these requirements that have led to the developmentand introduction of The First Coverage Sell-Side SentimentIndex (FCSSI). .
The FCSSI represents live, real-world trade informationand data generated by more than 300 sell-side firms and com-municated via the First Coverage platform. Because everypiece of information sent through the platform is deliveredto their current buy-side clients and then evaluated againstactual market performance, the more than 1,000 sell-sideindividuals using the system only send what they considertheir best information. It is an environment where the data isprivate, secure and, most importantly, evaluted by the buy-side to subsequently compensate their sell-side coverage. Inshort, the process to derive the data is the perfect mechanismto finally draw that tight link between an opinion offered anda consequence generated.
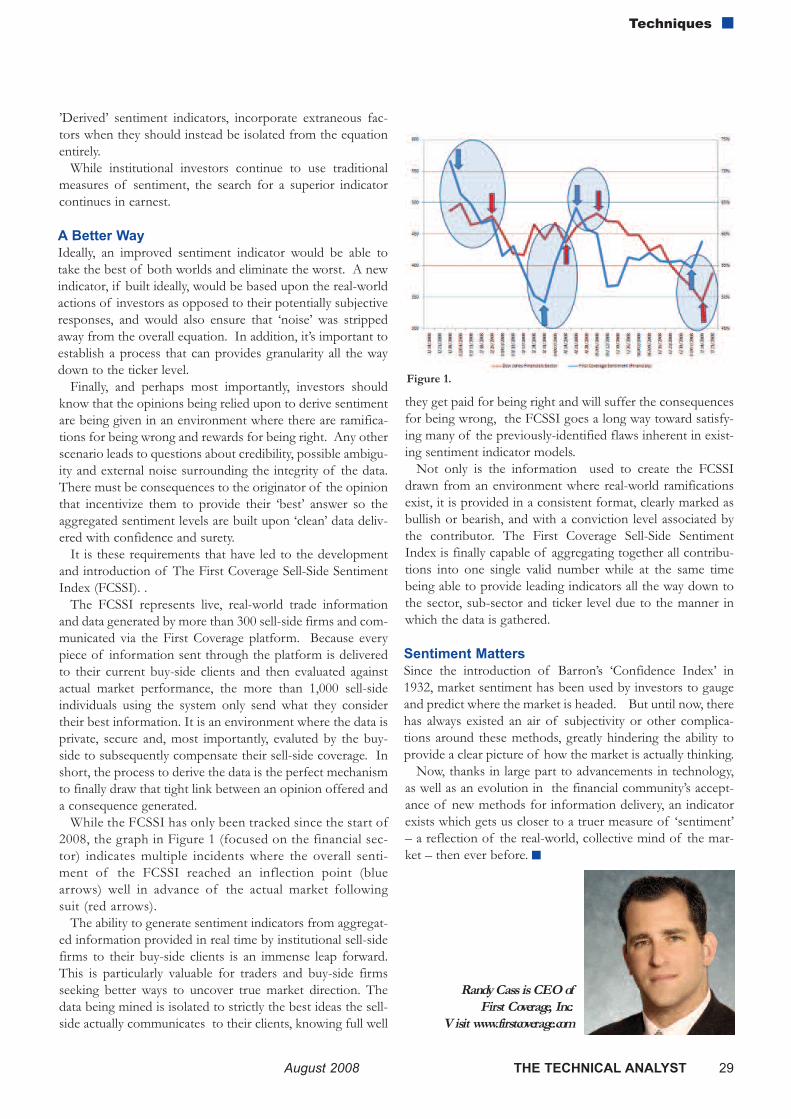
While the FCSSI has only been tracked since the start of2008, the graph in Figure 1 (focused on the financial sec-tor) indicates multiple incidents where the overall senti-ment of the FCSSI reached an inflection point (bluearrows) well in advance of the actual market followingsuit (red arrows).
The ability to generate sentiment indicators from aggregat-ed information provided in real time by institutional sell-sidefirms to their buy-side clients is an immense leap forward.This is particularly valuable for traders and buy-side firmsseeking better ways to uncover true market direction. Thedata being mined is isolated to strictly the best ideas the sell-side actually communicates to their clients, knowing full well
they get paid for being right and will suffer the consequencesfor being wrong, the FCSSI goes a long way toward satisfy-ing many of the previously-identified flaws inherent in exist-ing sentiment indicator models.
Not only is the information used to create the FCSSIdrawn from an environment where real-world ramificationsexist, it is provided in a consistent format, clearly marked asbullish or bearish, and with a conviction level associated bythe contributor. The First Coverage Sell-Side SentimentIndex is finally capable of aggregating together all contribu-tions into one single valid number while at the same timebeing able to provide leading indicators all the way down tothe sector, sub-sector and ticker level due to the manner inwhich the data is gathered.
Sentiment MattersSince the introduction of Barron’s ‘Confidence Index’ in1932, market sentiment has been used by investors to gaugeand predict where the market is headed. But until now, therehas always existed an air of subjectivity or other complica-tions around these methods, greatly hindering the ability toprovide a clear picture of how the market is actually thinking.
Now, thanks in large part to advancements in technology,as well as an evolution in the financial community’s accept-ance of new methods for information delivery, an indicatorexists which gets us closer to a truer measure of ‘sentiment’– a reflection of the real-world, collective mind of the mar-ket – then ever before.
Figure 1.
August 2008 THE TECHNICAL ANALYST 29
Techniques
Randy Cass is CEO of First Coverage, Inc.
V isit www.firstcoverage.com

INTERVIEW
Christian von Strachwitz is theCEO of Frankfurt basedQuaesta Capital, a hedge fundspecialising in managedaccounts using a systematictrading method employinggenetic algorithms. Christianwas a founder of theDortmund Intelligence Projectspecialising in computationalintelligence.
He talks to the TechnicalAnalyst about his use of genet-ic algorithms in his tradingstrategies.
TA: Can you explain what funds you manage?
Currently we are managing one program, thevTraderFX which is a pure currency strategy trading themajor currency pairs. It started in September 2006 and wehave now €270 million in assets under management. Theprogram is offered in a managed account setup and as aGerman onshore fund. In 2007 the program returned
Interview
30 THE TECHNICAL ANALYST August 2008

12.16% and so far in 2008 we are up 4.20%. Our goal is todeliver a decent return with a very risk-averse profile. Ourvolatility is around 3.5%.
TA: Can you tell me something about your work with theDortmund Intelligence Project?
We’ve founded Dortmund Intelligence Project (DIP) in2002. We chose this name because the research has a lot to dowith computational intelligence. DIP’S mission is to solvecomplex problems and one of our problems now is to beprofitable in currency markets. The guys at Dortmund areconstantly enhancing and further developing our vTraderengine. What we have realised is that we benefit a lot fromsolving totally different tasks we are working on, e.g. naturallanguage processing.
At the same time they are working on different applicationswhich are interesting for us and other market participants. Togive an example: what they are really enthusiastic about iswhat they call dipStream. It’s a framework where you canwork directly with different datastreams, prices, text etc. andyou can do whatever you want with these streams. One cangraphically program functions or rules or pricing formulas,test and use them in only one cycle. I think this will giveunprecedented power to managers or order desks.
TA: How was vTrader developed?
Dr. Wolfgang Kantschik and I met in the late 90s whenhe worked at the Institute of System Analytics of theUniversity of Dortmund. We decided to research together inorder to develop an engine for problem solving. One of ourfirst applications was the development of chess algorithms.Since my background is in asset management we’ve devel-oped a specific version looking at financial markets which wecall vTrader.
TA: How do you use vTrader to trade and how do youbenchmark its performance?
vTrader generates specific trading signals which areequipped with the corresponding stop-loss and eventual aprofit target. We are currently applying vTrader for intra-week currency trading using it to decide when to enter themarket. The question of benchmarking is a very difficult one; webenchmark ourselves against some systematic managers andmore importantly against our anticipated and expectedbehaviour.
TA: How does vTrader determine trade exit points?
vTrader has uses three separate criteria to determinewhen the program should exit a trade: a time stop (due tointra-week nature on Friday), a standard stop loss and profit
target, and a close/reverse position signal (every trading day).
TA: Can you explain how an evolutionary algorithmworks in relation to trading systems?
Trading systems are often regarded as more or less stat-ic which is generally not favourable. Evolutionary algorithmsare one of many possible means that can be used in order todevelop trading systems. They are to a limited extent adaptiveand so can change according to different market environ-ments.
TA: Would you therefore describe your funds as fullyautomated?
Our strategy is fully systematic – not fully automated.We are working on a high-frequency strategy where we willapply automated trading. We have a lot of respect regardingseveral operational aspects of automated trading so we aretherefore moving pretty slow into this domain.
TA: You mention stop-loss management and profit tar-gets on your website in relation to your managedaccounts. How are these set?
Stop-loss and profit targets are always set immediatelyafter market entry. The calculation is systematic. Like many ofothers we are relying on a volatility oriented stop placement– I think that’s pretty straight forward. Obviously we trail ourstop-loss after having reached specific predefined price levels.We tend not to optimize this to a maximum because one ofour dogmas is to have a robust setup.
TA: How easily would it be for a prop desk/hedge fundto set up a genetic algorithm trading model? Is theexpertise out there and easily sourced?
It is difficult to answer this question. The expertise isout there but you need more than that: you need manyexperts and they should be prepared to jump the inevitablelimits of their preferred methodology. At the same time it isvital to have somebody with financial markets experience andknowledge about the working of the technology. If you gotthese resources in place and commit the necessary time, Iwould be pretty optimistic.
TA: What would you say are the challenges of usinggenetic algorithms in trading systems?
Before coming to this question let me clarify some-thing: genetic algorithms, evolutionary strategies and geneticprogramming sound similar but are quite different approach-es with specific strengths and weaknesses. The major chal-lenge is that if you apply one of these approaches you shouldknow the traps and pitfalls. Another challenge is that →→
Interview
August 2008 THE TECHNICAL ANALYST 31

many trading system oriented tasks are not properly stated.The challenge, and now I speaking in general terms beyondsimple genetic algorithms, is the incredible power such com-putational intelligence methods can develop. The chancesthat the machine is outsmarting you and not the market aresubstantial. Even if it sounds simplistic, it is a lot about ask-ing the right questions instead of throwing things at amachine and hoping for the right answer.
TA: There has been a lot of talk about using neural net-works, artificial intelligence and fuzzy logic etc…intrading systems although they are still not widely used.Does this say anything about their validity in exploitingmarket inefficiencies?
No not at all. I think one of the big misunderstandingsis to consider every single method as a universal problemsolver. That’s definitely not possible – you would never try tobuild a house limiting yourself to just a screwdriver. You usetools for specific tasks and that’s exactly how you can applythese methods.
TA: How do you go about testing the algorithm? Howdo you determine your sampling criteria?
CVS: We are testing our algorithms with historical and artifi-cial time series. Since we are talking about inductive learningwe have to show something with might be considered signif-icant in order to gather knowledge and benefit from it.Having said that, we think the sampling is not an issue for us.
TA: How do evaluate the forecasting capability of youralgorithm?
The forecasting ability is a lot less important than manypeople think. Our algorithms are looking to make a direction-al statement only if they identify an opportunity. A consider-able portion of time our algorithms (or vTraders) are just lazyand flat which we totally understand.
TA: Are your FX models trend following in nature?
Since we are looking at directional positions we areeither trend or countertrend on a micro-trend basis. The dis-tinction of trend vs. range oriented is here only a question ofthe time frame one applies.
TA: What technical analysis do your rules use?
Our algorithms might use technical analysis, such astraditional indicators as well as traditional charting elements.We have found little value in using these tools in a direct man-ner. Apparently it makes more sense to incorporate small ele-ments of let’s say a chart support line with non-traditionalthings like wavelets or fuzzy logic.
TA: Are the rules derived from the algorithm purelytechnical in nature? Can you give us some idea of whatthey are?
Our algorithms are normally a blend of pattern recog-nition, wavelets, fuzzy logic, statistics etc. so in a way they aretechnical. We have found that roughly 95% of our algorithmsare at least hybrid in nature regarding the methodologicaldomains. We might have algorithms which have a traditionalpattern recognition element such as, “...if the high of the lastx days is higher than something, and the low y days ago issomething…” combined with a specifically develop waveletkernel filter. An important point for us is to be able to under-stand the mindset behind every algorithm.
TA: What do you use as a fitness function?
Our fitness function is very simple and I think that isthe result of many mistakes and experiences we’ve made. Thebottom line is that one should define the fitness functionexactly according to the goal one has. If there is any mappinginvolved you had better be careful.
TA: How does a genetic algorithm avoid overfitting?
Overfitting is one of the big traps regarding systemdevelopment. No method you apply is able to avoid it. Theway these methods are used determines if overfitting is pos-sible.
TA: What are the characteristics of your “best perform-ance rule”?
We are re-inventing our algorithms every week. Thereare some surviving vTrader algorithms which might be inproduction mode for a couple of months but normally theyare retiring after 1-2 weeks. Our best algorithms tend to bepicky and have a good notion about the environment they aredealing with. In other words, the best ones are the ones whichknow when their time is over.
TA: How does your algorithm perform over time com-pared to a buy and hold strategy?
We do not compare ourselves to buy and hold. Ourinvestors are expecting absolute return with a limited risk.
TA: What is the future of genetic algorithms for trading?
We think that algorithmic trading which is based onsome evolutionary methods will further gain ground. One ofthe main changes we will see in the future will be the way peo-ple will be using inductive learning methods and possiblecombinations with existing expert knowledge. On the otherhand the life expectancy of trading systems will substantiallysuffer. It’s a little bit like an arms race here.
Interview
32 THE TECHNICAL ANALYST August 2008
Overconfidence in our own expertise
Head-and-shoulders patterns can be usedto generate trading profits, but not in theway we might expect. This is the conclu-sion of three US-based researchers whouse a pattern recognition algorithm todetermine whether head-and-shouldersprice patterns have predictive power forfuture stock returns in the S&P 500 andthe Russell 2000. They find little or nosupport for the profitability of a stand-alone trading strategy but do find strongevidence that the pattern has power to
predict excess returns. According to Paul Weller, one of the
authors of the paper, “Although the stand-alone trading strategy earns on average lessthan the risk free rate of interest, it is sub-stantially negatively correlated with thereturn to the market portfolio. What thismeans is that a trader can combine the head-and-shoulders trading strategy with a passiveposition in the market and reduce overallrisk exposure. Alternatively he can lever hiscombined position to reproduce the risk
exposure of the market portfolio alone andgenerate a return significantly higher thanthe market. We find in some cases that theoptimal combination of the head-and-shoulders strategy and market portfolio cangenerate a return 6 to 8% above the marketfor the same risk exposure.”
Savin, Gene, Weller, Paul A. and Zvingelis, J Nis,"The Predictive Power of Head-and-ShouldersPrice Patterns in the U.S. Stock Market" (Spring2007). Journal of Financial Econometrics, Vol. 5,Issue 2, pp. 243-265, 2007
Head-and-shoulders can reduce risk
Using a dataset from Norway coveringcommon stock investments and employ-ment relationships for individualinvestors, two researchers have foundthat individuals hold an excess weight instocks that are professionally close. Forexample, after excluding holdings ofown-company stock, investors hold onaverage 14 % of their portfolio in stockswithin their five-digit industry ofemployment, in spite of the poor hedg-ing properties of such placements. They
tested whether investments in profes-sionally close stocks are driven by asym-metric information or by a behavioralbias. They found no evidence that invest-ment in professionally close stocks isassociated with a superior return, andconclude that a behavioral bias is themost likely explanation.
Doskeland, Trond and Hvide, Hans K.,"Expertise Bias in Individuals' Stock MarketInvestments" (July 10, 2008).
There is much evidence on the existenceof an industry momentum effect, indi-cating that industries with relatively highpast returns will continue to outperform,and industries with relatively low pastreturns will continue to underperform.However these studies have so farfocused on industries that cannot betraded directly, making it difficult toexploit the industry momentum effect.Now two Dutch researchers fromErasmus University in Rotterdam haveanalyzed the profitability of industrymomentum strategies based on two setsof exchange traded funds. They find that
the paper profits from academic studiesof about 5% per annum are also presentin their sample from 2000 to 2007.However, when they estimate the trans-actions costs on these industry momen-tum strategies, accounting for (a) the bid-ask spread, (b) the broker commissionand (c) short selling costs, they find that,given their estimated transactions costs,the paper profits from industry momen-tum strategies disappear.
Swinkels, Laurens A.P. and Tjong-A-Tjoe,Liam, "Can Exchange Traded Funds Be Used toExploit Industry Momentum?" (June 24, 2008).
Contrarian strategies do not work for thecommodity futures market, according toJoelle Miffre of EDHEC GraduateSchool of Management and GeorgiosRallis of Cass Business School. Theirstudy tests for the presence of short-termcontinuation and long-term reversals incommodity futures prices. While they saycontrarian strategies do not work, theirpaper identifies 13 profitable momentumstrategies that generate over 9% averagereturn a year. A closer analysis of the con-stituents of the long-short portfoliosreveals that the momentum strategies buybackwardated contracts and sell contan-goed contracts. The correlation betweenthe momentum returns and the returns oftraditional asset classes is also found to below, making the commodity-based rela-tive-strength portfolios excellent candi-dates for inclusion in well-diversified port-folios.
Miffre, J. and Georgios, R., “Momentum strate-gies in commodity futures markets”, Journal ofBanking and Finance, Vol. 31, No. 6, 2007.
Stocks, like houses, cars, watches, andother products, exude affect - that is, theyare considered good or bad, beautiful orugly; they are admired or disliked. Affectplays an overt role in the pricing of hous-
es, cars, and watches, but according tostandard financial theory, it plays no rolein the pricing of financial assets. ThreeUS based researchers provide a behav-ioural asset-pricing model in whichexpected returns are high not only whenobjective risk is high but also when sub-jective risk is high. High subjective risk
comes with negative affect. Investors pre-fer stocks with positive affect, whichboosts the prices of such stocks anddepresses their returns.
Statman, M., Fisher, K., and Anginer, D.,“Perspectives-Affect in a Behavioral Asset-Pricing Model”, Financial Analysts Journal,
MOMENTUM ANDCOMMODITIES
TRADING INDUSTRY MOMENTUM
DESIRABLE ASSETS
Research Update
August 2008 THE TECHNICAL ANALYST 33

Momentum fades in emerging marketsTwo researchers from the Central Bankof Brazil have examined momentum andreversals in 15 emerging markets. In con-trast to other research on momentum inemerging markets, they found significantevidence of reversals in most of theEmerging Stock Markets analyzed. Theauthors say there are many several possi-ble explanations for this puzzle. A com-mon interpretation for short-termmomentum in emerging markets is the
slow diffusion of information, leading toan underreaction in the markets. Theresearchers speculate that the period ofslow information diffusion is over, andthat the increase in the amounts of infor-mation available and the rates at whichthe information reaches investors is lead-ing to overconfidence and overreaction.Thus the momentum phenomenon mayhave disappeared. Another of their inter-pretations is that the introduction of
internet brokers is making stock tradingmore widely available to small individualinvestors and as these small investorstend to have a behaviour driven by thedisposition effect and engage in contrari-an strategies, this may lead to reversals instock returns.
Ornelas, J. and Fernandes, J., “Momentum andReversal Puzzle in Emerging Markets”, IcfaiJournal of Behavioral Finance, Forthcoming.
COMBINED STRATEGYFOR COMMODITIESCombining momentum and term struc-ture signals into a trading strategy forcommodity futures is significantly prof-itable, according to a joint paperbetween researchers at Cass BusinessSchool and EDHEC Graduate Schoolof Management. The authors show thatan abnormal annualized return of21.02% is possible through a strategythat exploits both momentum and termstructure, clearly outperforming eitherof the single strategies when imple-mented by themselves.
Fuertes, Ana-Maria, Miffre, Joelle and Rallis,Georgios, "Tactical Allocation in CommodityFutures Markets: Combining Momentum andTerm Structure Signals" (May 2008).
A global approach toasset allocation Two Dutch researchers have turned theirattention to global tactical asset alloca-tion, a topic which they say has receivedlittle attention compared to market tim-ing for single asset classes. They find thatmomentum and value strategies appliedto global tactical asset allocation acrosstwelve asset classes deliver statisticallyand economically significant abnormalreturns. For a long top-quartile and short
bottom-quartile portfolio based on acombination of momentum and valuesignals they find a return of 12% perannum over the period 1986 to 2007.
Blitz, David and van Vliet, Pim, "GlobalTactical Cross-Asset Allocation: ApplyingValue and Momentum Across Asset Classes "(September 2008, 06). ERIM Report SeriesReference No. ERS-2008-033-F&A
SLUGGISH REACTION TOEARLY BIRDS Does the stock market react differently to earnings informationthat is released relatively early? Two US based researchers havefound that immediate market reactions to early reporters areweaker than those to late or middle reporters. They find thatstock market returns subsequent to earnings announcementsare stronger for the positive earnings surprises of earlyreporters than late reporters, indicating that the market system-atically underreacts to the positive surprises of early reporters.
Cerniglia, Joseph and Livnat, Joshua, “First Come First Disserved”,Journal of Investment Management, Vol 6, No. 2, Second Quarter 2008.
All papers are available from the Social Science ResearchNetwork, SSRN, www.ssrn.com
Research Update
34 THE TECHNICAL ANALYST August 2008
How many fund man-agers does it take…?Kartik Patel of Prisma Capital Partners asks the question:“What is the appropriate number of hedge funds to be held ina fund-of-funds portfolio with the purpose of meeting a typicalbenchmark mandated by institutional investors.” According tohis research, 40 managers are sufficient to beat the chosenbenchmark.
Patel, K., “How Many Fund Managers Does a Fund of Funds Need?”Pensions: An International Journal, Vol. 13, No. 1-2, pp. 61-69, 2008.
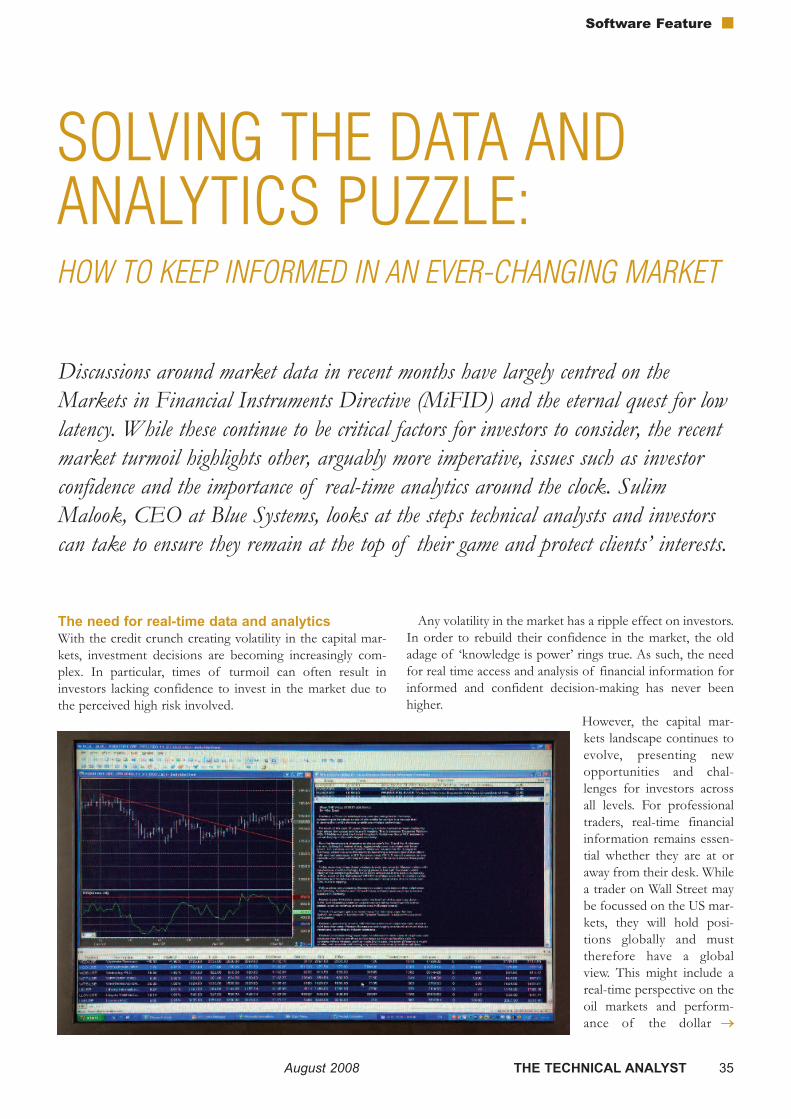
SOLVING THE DATA ANDANALYTICS PUZZLE: HOW TO KEEP INFORMED IN AN EVER-CHANGING MARKET
August 2008 THE TECHNICAL ANALYST 35
Software Feature
The need for real-time data and analyticsWith the credit crunch creating volatility in the capital mar-kets, investment decisions are becoming increasingly com-plex. In particular, times of turmoil can often result ininvestors lacking confidence to invest in the market due tothe perceived high risk involved.
Any volatility in the market has a ripple effect on investors.In order to rebuild their confidence in the market, the oldadage of ‘knowledge is power’ rings true. As such, the needfor real time access and analysis of financial information forinformed and confident decision-making has never beenhigher.
However, the capital mar-kets landscape continues toevolve, presenting newopportunities and chal-lenges for investors acrossall levels. For professionaltraders, real-time financialinformation remains essen-tial whether they are at oraway from their desk. Whilea trader on Wall Street maybe focussed on the US mar-kets, they will hold posi-tions globally and musttherefore have a globalview. This might include areal-time perspective on theoil markets and perform-ance of the dollar →→
Discussions around market data in recent months have largely centred on theMarkets in Financial Instruments Directive (MiFID) and the eternal quest for lowlatency. While these continue to be critical factors for investors to consider, the recentmarket turmoil highlights other, arguably more imperative, issues such as investorconfidence and the importance of real-time analytics around the clock. SulimMalook, CEO at Blue Systems, looks at the steps technical analysts and investorscan take to ensure they remain at the top of their game and protect clients’ interests.
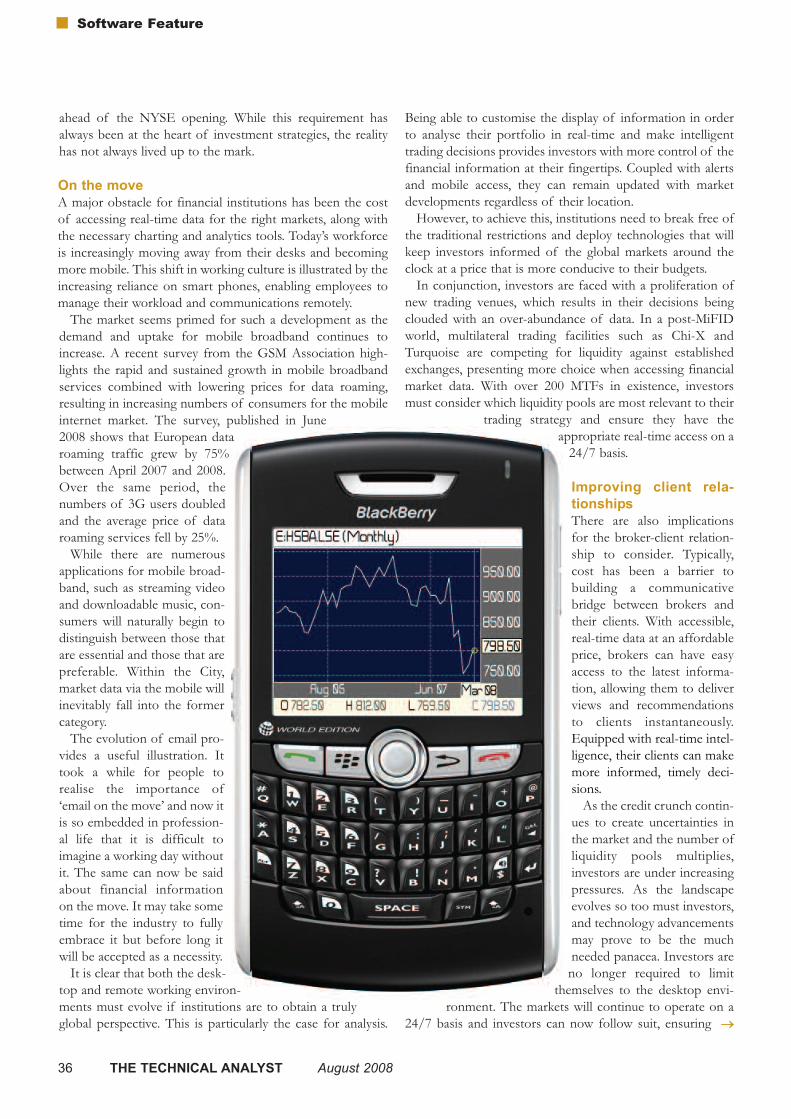
ahead of the NYSE opening. While this requirement hasalways been at the heart of investment strategies, the realityhas not always lived up to the mark.
On the moveA major obstacle for financial institutions has been the costof accessing real-time data for the right markets, along withthe necessary charting and analytics tools. Today’s workforceis increasingly moving away from their desks and becomingmore mobile. This shift in working culture is illustrated by theincreasing reliance on smart phones, enabling employees tomanage their workload and communications remotely.
The market seems primed for such a development as thedemand and uptake for mobile broadband continues toincrease. A recent survey from the GSM Association high-lights the rapid and sustained growth in mobile broadbandservices combined with lowering prices for data roaming,resulting in increasing numbers of consumers for the mobileinternet market. The survey, published in June2008 shows that European dataroaming traffic grew by 75%between April 2007 and 2008.Over the same period, thenumbers of 3G users doubledand the average price of dataroaming services fell by 25%.
While there are numerousapplications for mobile broad-band, such as streaming videoand downloadable music, con-sumers will naturally begin todistinguish between those thatare essential and those that arepreferable. Within the City,market data via the mobile willinevitably fall into the formercategory.
The evolution of email pro-vides a useful illustration. Ittook a while for people torealise the importance of‘email on the move’ and now itis so embedded in profession-al life that it is difficult toimagine a working day withoutit. The same can now be saidabout financial informationon the move. It may take sometime for the industry to fullyembrace it but before long itwill be accepted as a necessity.
It is clear that both the desk-top and remote working environ-ments must evolve if institutions are to obtain a trulyglobal perspective. This is particularly the case for analysis.
Being able to customise the display of information in orderto analyse their portfolio in real-time and make intelligenttrading decisions provides investors with more control of thefinancial information at their fingertips. Coupled with alertsand mobile access, they can remain updated with marketdevelopments regardless of their location.
However, to achieve this, institutions need to break free ofthe traditional restrictions and deploy technologies that willkeep investors informed of the global markets around theclock at a price that is more conducive to their budgets.
In conjunction, investors are faced with a proliferation ofnew trading venues, which results in their decisions beingclouded with an over-abundance of data. In a post-MiFIDworld, multilateral trading facilities such as Chi-X andTurquoise are competing for liquidity against establishedexchanges, presenting more choice when accessing financialmarket data. With over 200 MTFs in existence, investorsmust consider which liquidity pools are most relevant to their
trading strategy and ensure they have theappropriate real-time access on a
24/7 basis.
Improving client rela-tionshipsThere are also implicationsfor the broker-client relation-ship to consider. Typically,cost has been a barrier tobuilding a communicativebridge between brokers andtheir clients. With accessible,real-time data at an affordableprice, brokers can have easyaccess to the latest informa-tion, allowing them to deliverviews and recommendationsto clients instantaneously.Equipped with real-time intel-ligence, their clients can makemore informed, timely deci-sions.
As the credit crunch contin-ues to create uncertainties inthe market and the number ofliquidity pools multiplies,investors are under increasingpressures. As the landscapeevolves so too must investors,and technology advancementsmay prove to be the muchneeded panacea. Investors areno longer required to limit
themselves to the desktop envi-ronment. The markets will continue to operate on a
24/7 basis and investors can now follow suit, ensuring →→
Software Feature
36 THE TECHNICAL ANALYST August 2008
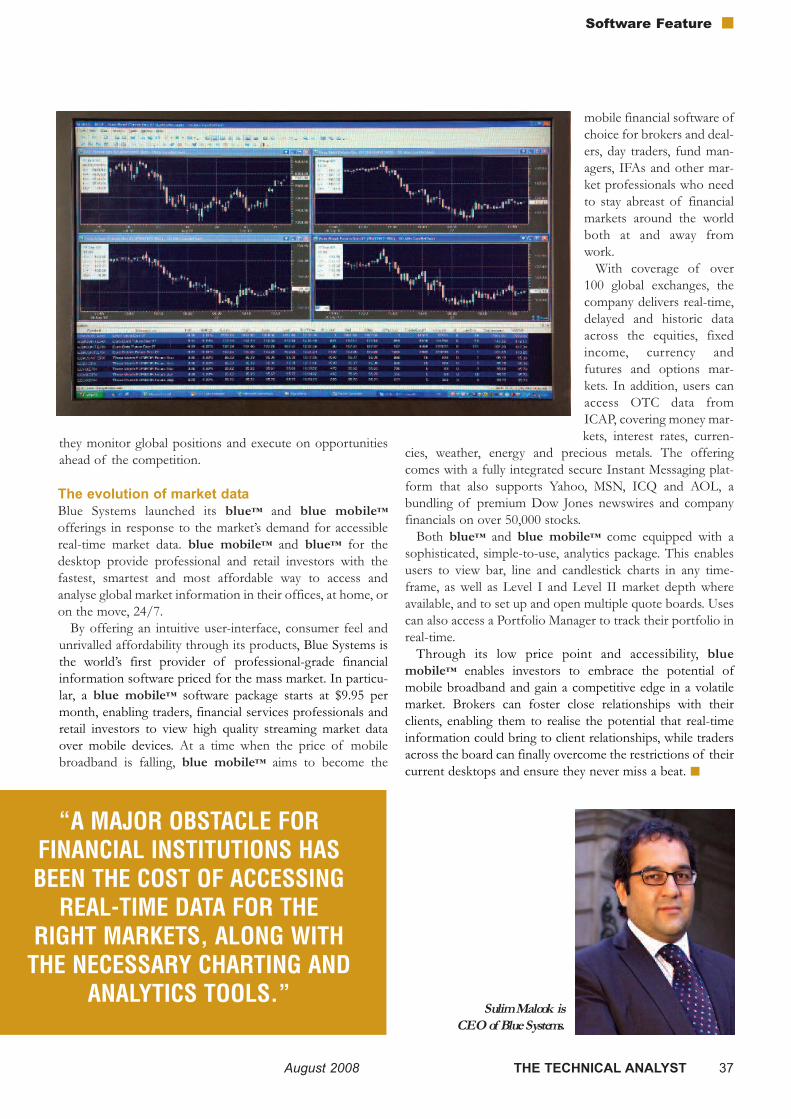
they monitor global positions and execute on opportunitiesahead of the competition.
The evolution of market dataBlue Systems launched its blue™ and blue mobile™offerings in response to the market’s demand for accessiblereal-time market data. blue mobile™ and blue™ for thedesktop provide professional and retail investors with thefastest, smartest and most affordable way to access andanalyse global market information in their offices, at home, oron the move, 24/7.
By offering an intuitive user-interface, consumer feel andunrivalled affordability through its products, Blue Systems isthe world’s first provider of professional-grade financialinformation software priced for the mass market. In particu-lar, a blue mobile™ software package starts at $9.95 permonth, enabling traders, financial services professionals andretail investors to view high quality streaming market dataover mobile devices. At a time when the price of mobilebroadband is falling, blue mobile™ aims to become the
mobile financial software ofchoice for brokers and deal-ers, day traders, fund man-agers, IFAs and other mar-ket professionals who needto stay abreast of financialmarkets around the worldboth at and away fromwork.
With coverage of over100 global exchanges, thecompany delivers real-time,delayed and historic dataacross the equities, fixedincome, currency andfutures and options mar-kets. In addition, users canaccess OTC data fromICAP, covering money mar-kets, interest rates, curren-
cies, weather, energy and precious metals. The offeringcomes with a fully integrated secure Instant Messaging plat-form that also supports Yahoo, MSN, ICQ and AOL, abundling of premium Dow Jones newswires and companyfinancials on over 50,000 stocks.
Both blue™ and blue mobile™ come equipped with asophisticated, simple-to-use, analytics package. This enablesusers to view bar, line and candlestick charts in any time-frame, as well as Level I and Level II market depth whereavailable, and to set up and open multiple quote boards. Usescan also access a Portfolio Manager to track their portfolio inreal-time.
Through its low price point and accessibility, bluemobile™ enables investors to embrace the potential ofmobile broadband and gain a competitive edge in a volatilemarket. Brokers can foster close relationships with theirclients, enabling them to realise the potential that real-timeinformation could bring to client relationships, while tradersacross the board can finally overcome the restrictions of theircurrent desktops and ensure they never miss a beat.
August 2008 THE TECHNICAL ANALYST 37
Software Feature
Sulim Malook is CEO of Blue Systems.
“A MAJOR OBSTACLE FORFINANCIAL INSTITUTIONS HASBEEN THE COST OF ACCESSINGREAL-TIME DATA FOR THE
RIGHT MARKETS, ALONG WITHTHE NECESSARY CHARTING AND
ANALYTICS TOOLS.”
It has been stated time and again that money is most often lost trading because of the“human” mistakes of traders. Building a system is the way to overcome the draw backs ofdiscretionary trading, although developing a profitable automated system presents difficul-
ties of its own. These challenges are addressed in this new book. Robert Pardo is well known in the field of automated trading having run his own consultan-
cy and money management firm, (Pardo Group), since leaving Salomon Brothers. This is thesecond edition of his first book published back in 1992. With the technological advances intrading systems and analysis since that time, an updated edition is undoubtedly long overdue.Given the widespread interest in building and using trading systems, there are surprisingly fewbooks available on the subject. The dominant publication in this area is Perry Kaufman’s “NewTrading Systems and Methods” published by Wiley (2005). While no new book is likely to com-pete with Kaufman’s in its range, there may be more to say on the specifics of testing and opti-mising a trading strategy.
Pardo has succeeded to a large extent with this latest book. If you are looking to develop amechanical strategy from scratch but don’t want to be bogged with technical trading theorythen Pardo’s book is for you. He wastes no time in getting down to a step-by-step explanationof testing and optimising your system once you have a model or rule based strategy in mind.Furthermore, he talks you through some of the pitfalls to be encountered in such things asdata sampling and optimisation that will nonetheless take time, effort and experience to accom-plish successfully. They are after all the key to successful systematic trading.
There are numerous variables and criteria to consider in developing a model and Pardo takesyou through these step-by-step, even if his style is overly verbose at times. A subject that is ofparticular interest is the so called, Walk-Forward Analysis - a term coined by Pardo for out-of-sample testing that is conducted after the model has been optimised. Aside from testing therobustness of the model, most systematic strategies tend to have a profitability half life andneed periodical fine-tuning to ensure its continued validity. This is due in part to the problemof shifting markets (a problem detected by Walk-Forward Analysis) where the market condi-tions under which the model was developed and tested no longer apply. Therefore the modelhas to be modified to take account of this. This is a vital area of system optimisation that iswell covered by Pardo.
If anything lets this book down it is its layout. The chapter headings and sub-headings arevague and too many points are repeated in different parts of the book. However, this is oneof the very few books available on the development and optimisation of trading systems andfor that reason alone it is an essential read.
By Robert PardoPublished by Wiley 334 pages ISBN: 0470128011£45.00
THE EVALUATION AND OPTIMIZATION OF TRADINGSTRATEGIES
All of the above books are available from the Global Investor bookshop at a discount. Please call +44(0)1730 233870 and quote "The Technical Analyst magazine".
Book Review
38 THE TECHNICAL ANALYST August 2008
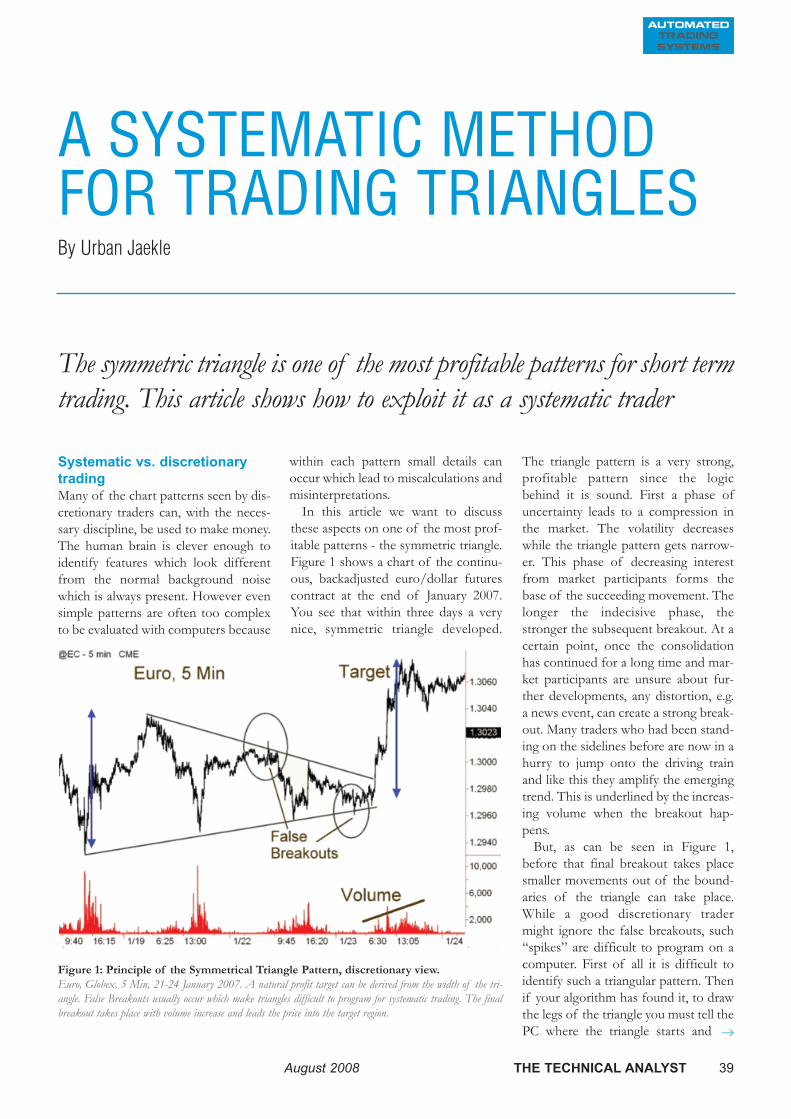
A SYSTEMATIC METHODFOR TRADING TRIANGLES By Urban Jaekle
Systematic vs. discretionarytradingMany of the chart patterns seen by dis-cretionary traders can, with the neces-sary discipline, be used to make money.The human brain is clever enough toidentify features which look differentfrom the normal background noisewhich is always present. However evensimple patterns are often too complexto be evaluated with computers because
within each pattern small details canoccur which lead to miscalculations andmisinterpretations.
In this article we want to discussthese aspects on one of the most prof-itable patterns - the symmetric triangle.Figure 1 shows a chart of the continu-ous, backadjusted euro/dollar futurescontract at the end of January 2007.You see that within three days a verynice, symmetric triangle developed.
The triangle pattern is a very strong,profitable pattern since the logicbehind it is sound. First a phase ofuncertainty leads to a compression inthe market. The volatility decreaseswhile the triangle pattern gets narrow-er. This phase of decreasing interestfrom market participants forms thebase of the succeeding movement. Thelonger the indecisive phase, thestronger the subsequent breakout. At acertain point, once the consolidationhas continued for a long time and mar-ket participants are unsure about fur-ther developments, any distortion, e.g.a news event, can create a strong break-out. Many traders who had been stand-ing on the sidelines before are now in ahurry to jump onto the driving trainand like this they amplify the emergingtrend. This is underlined by the increas-ing volume when the breakout hap-pens.
But, as can be seen in Figure 1,before that final breakout takes placesmaller movements out of the bound-aries of the triangle can take place.While a good discretionary tradermight ignore the false breakouts, such“spikes” are difficult to program on acomputer. First of all it is difficult toidentify such a triangular pattern. Thenif your algorithm has found it, to drawthe legs of the triangle you must tell thePC where the triangle starts and
The symmetric triangle is one of the most profitable patterns for short termtrading. This article shows how to exploit it as a systematic trader
→→
August 2008 THE TECHNICAL ANALYST 39
Figure 1: Principle of the Symmetrical Triangle Pattern, discretionary view. Euro, Globex, 5 Min, 21-24 January 2007. A natural profit target can be derived from the width of the tri-angle. False Breakouts usually occur which make triangles difficult to program for systematic trading. The finalbreakout takes place with volume increase and leads the price into the target region.
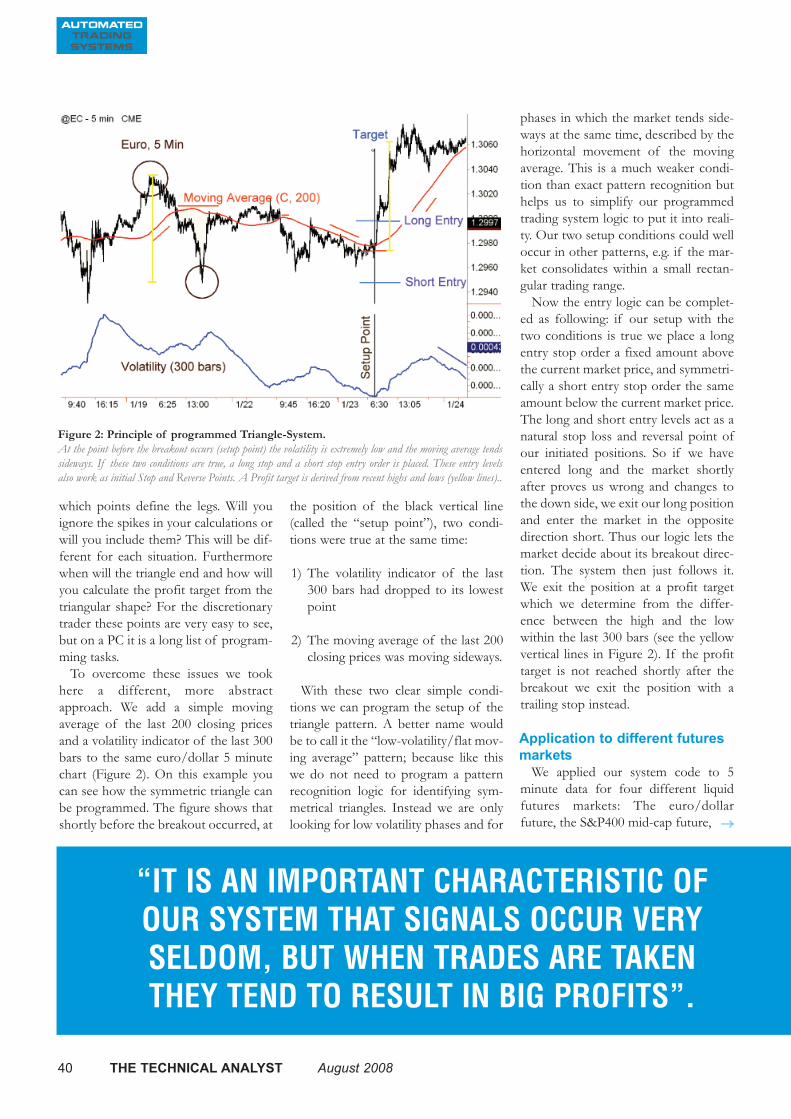
which points define the legs. Will youignore the spikes in your calculations orwill you include them? This will be dif-ferent for each situation. Furthermorewhen will the triangle end and how willyou calculate the profit target from thetriangular shape? For the discretionarytrader these points are very easy to see,but on a PC it is a long list of program-ming tasks.
To overcome these issues we tookhere a different, more abstractapproach. We add a simple movingaverage of the last 200 closing pricesand a volatility indicator of the last 300bars to the same euro/dollar 5 minutechart (Figure 2). On this example youcan see how the symmetric triangle canbe programmed. The figure shows thatshortly before the breakout occurred, at
the position of the black vertical line(called the “setup point”), two condi-tions were true at the same time:
1) The volatility indicator of the last300 bars had dropped to its lowestpoint
2) The moving average of the last 200closing prices was moving sideways.
With these two clear simple condi-tions we can program the setup of thetriangle pattern. A better name wouldbe to call it the “low-volatility/flat mov-ing average” pattern; because like thiswe do not need to program a patternrecognition logic for identifying sym-metrical triangles. Instead we are onlylooking for low volatility phases and for
phases in which the market tends side-ways at the same time, described by thehorizontal movement of the movingaverage. This is a much weaker condi-tion than exact pattern recognition buthelps us to simplify our programmedtrading system logic to put it into reali-ty. Our two setup conditions could welloccur in other patterns, e.g. if the mar-ket consolidates within a small rectan-gular trading range.
Now the entry logic can be complet-ed as following: if our setup with thetwo conditions is true we place a longentry stop order a fixed amount abovethe current market price, and symmetri-cally a short entry stop order the sameamount below the current market price.The long and short entry levels act as anatural stop loss and reversal point ofour initiated positions. So if we haveentered long and the market shortlyafter proves us wrong and changes tothe down side, we exit our long positionand enter the market in the oppositedirection short. Thus our logic lets themarket decide about its breakout direc-tion. The system then just follows it.We exit the position at a profit targetwhich we determine from the differ-ence between the high and the lowwithin the last 300 bars (see the yellowvertical lines in Figure 2). If the profittarget is not reached shortly after thebreakout we exit the position with atrailing stop instead.
Application to different futuresmarkets
We applied our system code to 5minute data for four different liquidfutures markets: The euro/dollarfuture, the S&P400 mid-cap future,
Figure 2: Principle of programmed Triangle-System. At the point before the breakout occurs (setup point) the volatility is extremely low and the moving average tendssideways. If these two conditions are true, a long stop and a short stop entry order is placed. These entry levelsalso work as initial Stop and Reverse Points. A Profit target is derived from recent highs and lows (yellow lines)..
“IT IS AN IMPORTANT CHARACTERISTIC OF OUR SYSTEM THAT SIGNALS OCCUR VERY SELDOM, BUT WHEN TRADES ARE TAKEN THEY TEND TO RESULT IN BIG PROFITS”.
→→
40 THE TECHNICAL ANALYST August 2008
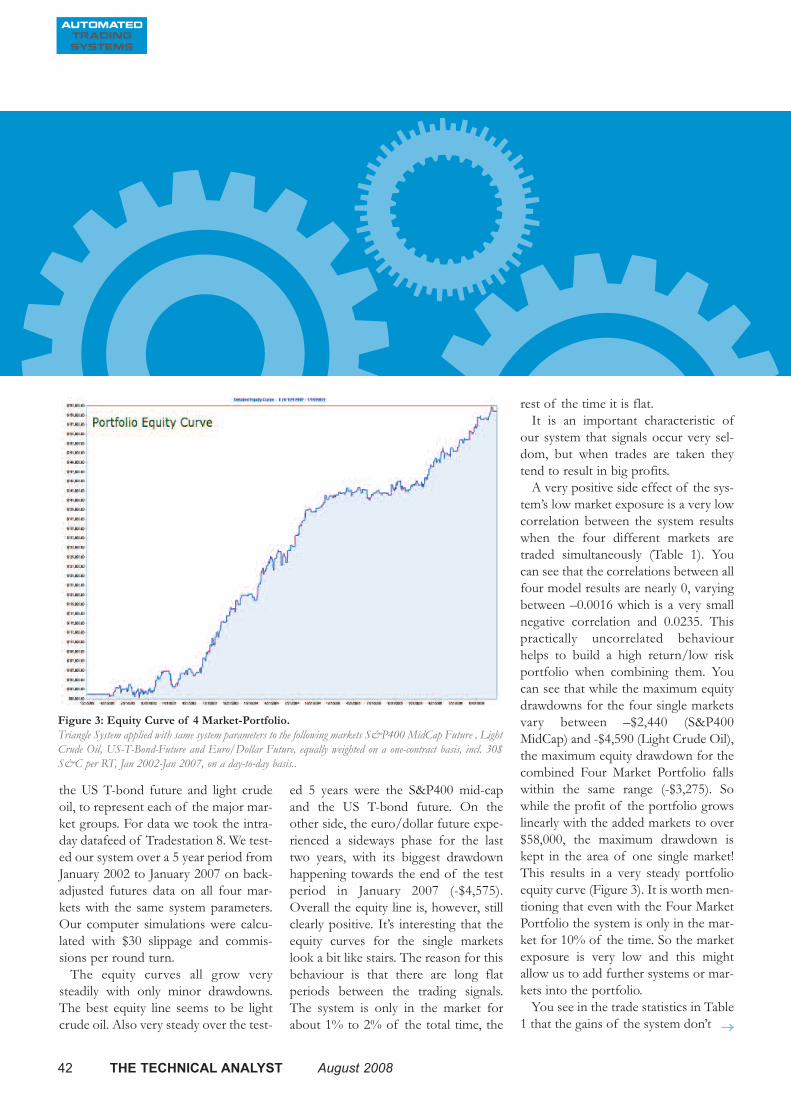
the US T-bond future and light crudeoil, to represent each of the major mar-ket groups. For data we took the intra-day datafeed of Tradestation 8. We test-ed our system over a 5 year period fromJanuary 2002 to January 2007 on back-adjusted futures data on all four mar-kets with the same system parameters.Our computer simulations were calcu-lated with $30 slippage and commis-sions per round turn.
The equity curves all grow verysteadily with only minor drawdowns.The best equity line seems to be lightcrude oil. Also very steady over the test-
ed 5 years were the S&P400 mid-capand the US T-bond future. On theother side, the euro/dollar future expe-rienced a sideways phase for the lasttwo years, with its biggest drawdownhappening towards the end of the testperiod in January 2007 (-$4,575).Overall the equity line is, however, stillclearly positive. It’s interesting that theequity curves for the single marketslook a bit like stairs. The reason for thisbehaviour is that there are long flatperiods between the trading signals.The system is only in the market forabout 1% to 2% of the total time, the
rest of the time it is flat.It is an important characteristic of
our system that signals occur very sel-dom, but when trades are taken theytend to result in big profits.
A very positive side effect of the sys-tem’s low market exposure is a very lowcorrelation between the system resultswhen the four different markets aretraded simultaneously (Table 1). Youcan see that the correlations between allfour model results are nearly 0, varyingbetween –0.0016 which is a very smallnegative correlation and 0.0235. Thispractically uncorrelated behaviourhelps to build a high return/low riskportfolio when combining them. Youcan see that while the maximum equitydrawdowns for the four single marketsvary between –$2,440 (S&P400MidCap) and -$4,590 (Light Crude Oil),the maximum equity drawdown for thecombined Four Market Portfolio fallswithin the same range (-$3,275). Sowhile the profit of the portfolio growslinearly with the added markets to over$58,000, the maximum drawdown iskept in the area of one single market!This results in a very steady portfolioequity curve (Figure 3). It is worth men-tioning that even with the Four MarketPortfolio the system is only in the mar-ket for 10% of the time. So the marketexposure is very low and this mightallow us to add further systems or mar-kets into the portfolio.
You see in the trade statistics in Table1 that the gains of the system don’t
Figure 3: Equity Curve of 4 Market-Portfolio. Triangle System applied with same system parameters to the following markets S&P400 MidCap Future , LightCrude Oil, US-T-Bond-Future and Euro/Dollar Future, equally weighted on a one-contract basis, incl. 30$S&C per RT, Jan 2002-Jan 2007, on a day-to-day basis..
→→
42 THE TECHNICAL ANALYST August 2008
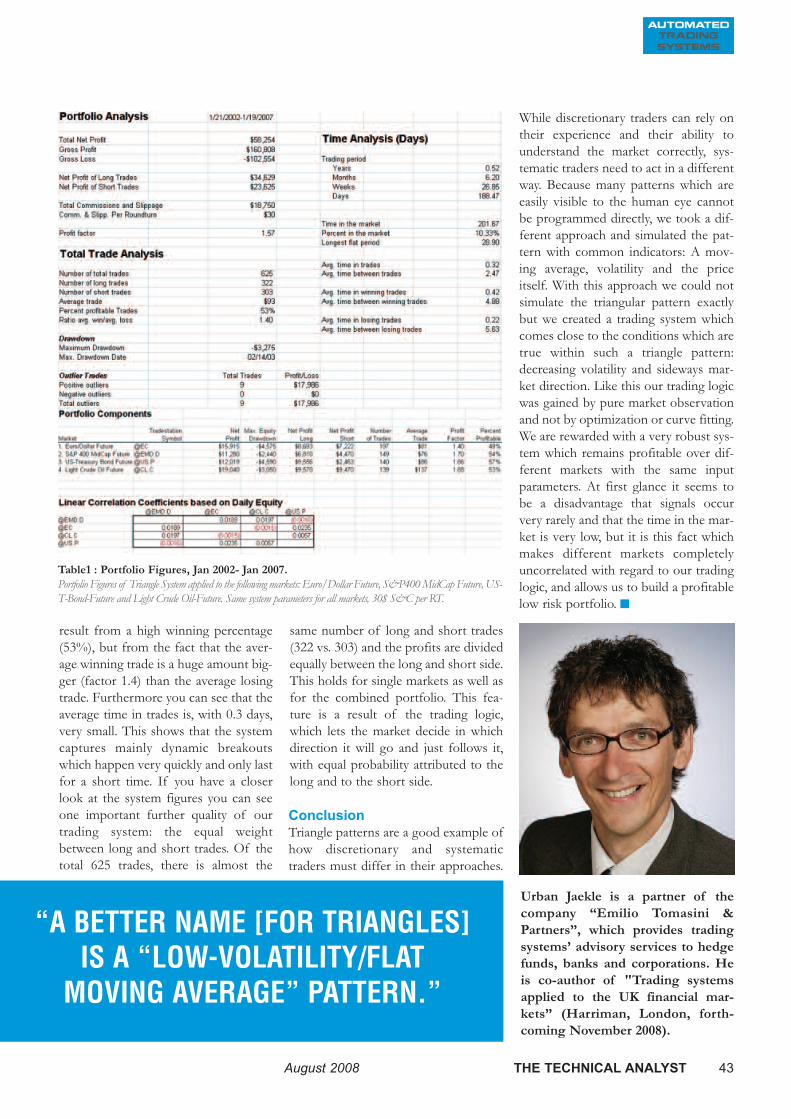
result from a high winning percentage(53%), but from the fact that the aver-age winning trade is a huge amount big-ger (factor 1.4) than the average losingtrade. Furthermore you can see that theaverage time in trades is, with 0.3 days,very small. This shows that the systemcaptures mainly dynamic breakoutswhich happen very quickly and only lastfor a short time. If you have a closerlook at the system figures you can seeone important further quality of ourtrading system: the equal weightbetween long and short trades. Of thetotal 625 trades, there is almost the
same number of long and short trades(322 vs. 303) and the profits are dividedequally between the long and short side.This holds for single markets as well asfor the combined portfolio. This fea-ture is a result of the trading logic,which lets the market decide in whichdirection it will go and just follows it,with equal probability attributed to thelong and to the short side.
ConclusionTriangle patterns are a good example ofhow discretionary and systematictraders must differ in their approaches.
While discretionary traders can rely ontheir experience and their ability tounderstand the market correctly, sys-tematic traders need to act in a differentway. Because many patterns which areeasily visible to the human eye cannotbe programmed directly, we took a dif-ferent approach and simulated the pat-tern with common indicators: A mov-ing average, volatility and the priceitself. With this approach we could notsimulate the triangular pattern exactlybut we created a trading system whichcomes close to the conditions which aretrue within such a triangle pattern:decreasing volatility and sideways mar-ket direction. Like this our trading logicwas gained by pure market observationand not by optimization or curve fitting.We are rewarded with a very robust sys-tem which remains profitable over dif-ferent markets with the same inputparameters. At first glance it seems tobe a disadvantage that signals occurvery rarely and that the time in the mar-ket is very low, but it is this fact whichmakes different markets completelyuncorrelated with regard to our tradinglogic, and allows us to build a profitablelow risk portfolio.
Table1 : Portfolio Figures, Jan 2002- Jan 2007. Portfolio Figures of Triangle System applied to the following markets: Euro/Dollar Future, S&P400 MidCap Future, US-T-Bond-Future and Light Crude Oil-Future. Same system parameters for all markets, 30$ S&C per RT.
“A BETTER NAME [FOR TRIANGLES]IS A “LOW-VOLATILITY/FLAT MOVING AVERAGE” PATTERN.”
Urban Jaekle is a partner of thecompany “Emilio Tomasini &Partners”, which provides tradingsystems’ advisory services to hedgefunds, banks and corporations. Heis co-author of "Trading systemsapplied to the UK financial mar-kets” (Harriman, London, forth-coming November 2008).
August 2008 THE TECHNICAL ANALYST 43
HOW TO SURVIVE THE MARKETS’ CAULDRONBy Ben Van Vliet
Paradigm shiftsThe markets smell of poison'd entrailsand eye of newt right now, and they’regoing to for a while. Now and for thecoming quarters, or maybe years, peo-ple’s perceptions of value and risk andreturn will rock about as gloom anddoom and forecasts change. In themarkets’ cauldron are boiling all man-ner of paradigm shifts to sear the great-est traders and their precious models.The strategies they’ve cooked up andbacktested can’t handle the new regime.(Bill Miller, who once beat the stockmarket 15 years in a row with his LeggMason Value Fund, has “performed sopoorly the past two and a half yearsthat Morningstar now gives the fundone star.”1) Algorithms proved overthe paradigms of the past aren’t validanymore. The past, then, really won’tbe an indication of the future anymore.
So, what’s a trader to do in the face ofwicked shifts in market data, rapidchanges in central bank policy, andfears of inflation? How can one sur-vive till the next long-term regimearrives?
The answer to these (and other tradingquestions) is to focus on rapidly buildingnew strategies, implementing them, andquickly shutting them down when theyno longer work. The answer is not tostop trading altogether, but rather to con-tinue trading, being careful to pull theplug before losing big. The answer is toknow when the strategy you’re trading isno longer the strategy you backtested.
Successful trading today needs real-time,quantifiable signals as to when things arebreaking down.
Statistical Process Control So, how does one go about that, youask? Well, with maths, of course. But,not just any maths. The mathematics ofquality. These signals can work bywrapping your trading algorithmsinside a quality control system, namelystatistical process control (SPC).
SPC goes back to the 1920s andWestern Electric, part of Bell Labs,where Walter Shewhart perceived thatreal-world processes, like those in man-ufacturing, rarely generate normallydistributed data. He concluded thatthese processes display inherent varia-tion (called common variation) andspecial variation. Absence or presenceof special variation determineswhether a process is in or out of con-trol. Edwards Deming appliedShewhart’s methods during World WarII to improve the quality of weapons.After the war he took SPC to Japan andtransformed Japanese industry.
The underlying assumption in SPC isthat a manufacturing process will churnout products whose properties varyslightly from their designed values,even when the production line is run-ning normally, and these variances canbe analyzed statistically to control theprocess. If the production processitself changes (say, for example, if themachine breaks down), this distribu-
tion will shift or spread out. If thischange is allowed to continue, the partsproduced may fall outside the toler-ances of the customer, causing theproduct to be rejected.
Trading strategies churn out per-formance metrics, like return and stan-dard deviation, of course, but also oneslike ratio of winners to losers, averagetime in trade; portfolio metrics too, likesector weights, and even value at risk.The key is to know when these metricsare no longer behaving like they did inyour backtest, a good signal then thatyour trading strategy is out of controland in danger of crashing.
SPC control charts can record theperformance of strategy outputs.Control limits on these charts, deter-mined through backtesting, will showthe normal range within which a trad-ing or investment system can safelyoperate. If the performance is withinthese limits, then this system is workingnormally. If some performance datafalls outside these limits, something haschanged for the worse and the tradingor investment system is out of control.
Xbar and R charts are the most com-monly used SPC charts. Xbar chartsshow sample means, and R charts sam-ple ranges. Interpreted together theyallow tracking of both the center andvariation of a process. Two othercharts are d charts, for the number ofdefective units (say losing trades), and pcharts, for fraction defective.Cumulative sum charts (CUSUM)
Double, double, toil and trouble
→→
44 THE TECHNICAL ANALYST August 2008

August 2008 THE TECHNICAL ANALYST 45
plot the cumulative sum of deviationsof successive samples from the aver-age. Exponentially weighted movingaverage (EWMA) charts plot theweighted average of current and allprevious values. (Of course, the actualapplication of SPC depends on thetype of trading or investment strategyyou are using and the backtestingmethod employed. Performance met-rics and their SPC charts will be differ-ent for every system.)
Eliminating uncontrolled variationNow, an out of control signal only tellsyou that your trading strategy is per-forming differently than your backtesttold you it should. What to do about itis the next step: eliminating the uncon-trolled variation through root causeanalysis, with processes like ANOVA,design of experiments, the five whys,and Pareto analysis. The steps then are:
• Define the uncontrolled perform-ance using evidence from SPCcharts.
• List issues that potentially con-tributed to the nonconformance.
• Identify root, or assignable, causes.Root causes could be anything frompolitical or economic shifts, tochanges in an exchange matchingalgorithm, to new competing sys-tems coming online.
• Develop recommendations for fixesas part of continuous improvementprocess, called kaizen.
• Re-research, re-backtest, and re-implement the fixed trading strategy,or shut it down completely.
• Begin again monitoring the fixedtrading or investment system withSPC. Kaizen itself really begins with a
robust trading or investment strategydevelopment process. The methodolo-gy my colleague Andrew Kumiega andI present (aptly named K|V in ourbook Quality Money Management) followsa research-backtest-implement-manageset of stages. In our methodology, def-inition of performance metrics hap-pens up front, during the researchstage. A short backtest, using goodclean transparent data, then shouldconfirm the validity and repeatability ofthe trading/investment process.Repeatable strategies merit risk capitalfor implementation, and workingstrategies are monitored and managedusing SPC.
In the first step of SPC, you shouldassess the performance of a trad-ing/investment strategy versus the per-formance observed during the back-test. A second step should analyze per-formance relative to its benchmark.The third step, value at risk, attempts topredict how a portfolio will behave inthe future, which can also be viewedthrough the lens of SPC.
The final step is kaizen again, whichbrings you back to the very beginningto root out uncontrolled variation, tocontinuously improve the performanceof your trading strategies. This is whatwill make you the “recession champi-on”2 as Michael Lewis calls it.
When profit margins are tight, andrisk is high, the goal during periods ofmarket turmoil should be to reduce thewaste—the uncontrolled, unexplainedvariation—from your trading strategies.Apply SPC to monitor your tradingstrategies, and focus on root causeanalysis to shut them down quickly, orbetter yet use kaizen to fine tune themfor improved performance. The reduc-tion of waste will allow you to survivethe market turmoil and even make itwork for you; whenever it ends (and itwill), you will emerge in a muchstronger position, ready to start racingagain in the lead.
Benjamin Van Vliet is the associatedirector of the MSc in FinancialMarkets at Illinois Institute ofTechnology’s Stuart Graduate Schoolof Business. He is also course direc-tor for the Institute for MarketTechnology’s Certified TradingSystem Developer (CTSD) courseand author of “Building AutomatedTrading Systems” and “QualityMoney Management”, both pub-lished by Academic Press. Seewww.technicalanalyst.co.uk/training fordetails of the CTSD qualification andtraining.
“THE UNDERLYING ASSUMPTION IN SPC IS THATA MANUFACTURING PROCESS WILL CHURN OUTPRODUCTS WHOSE PROPERTIES VARY SLIGHTLY
FROM THEIR DESIGN VALUES.”
1 Kinnel, Russel. 2008. “Is Bill Miller Toast?” From Kiplinger's Personal Finance. August.2 Lewis, Michael. 2008. “Rules to Keep Your Skin in Wall Street Massacre” www.bloomberg.com. July 2.
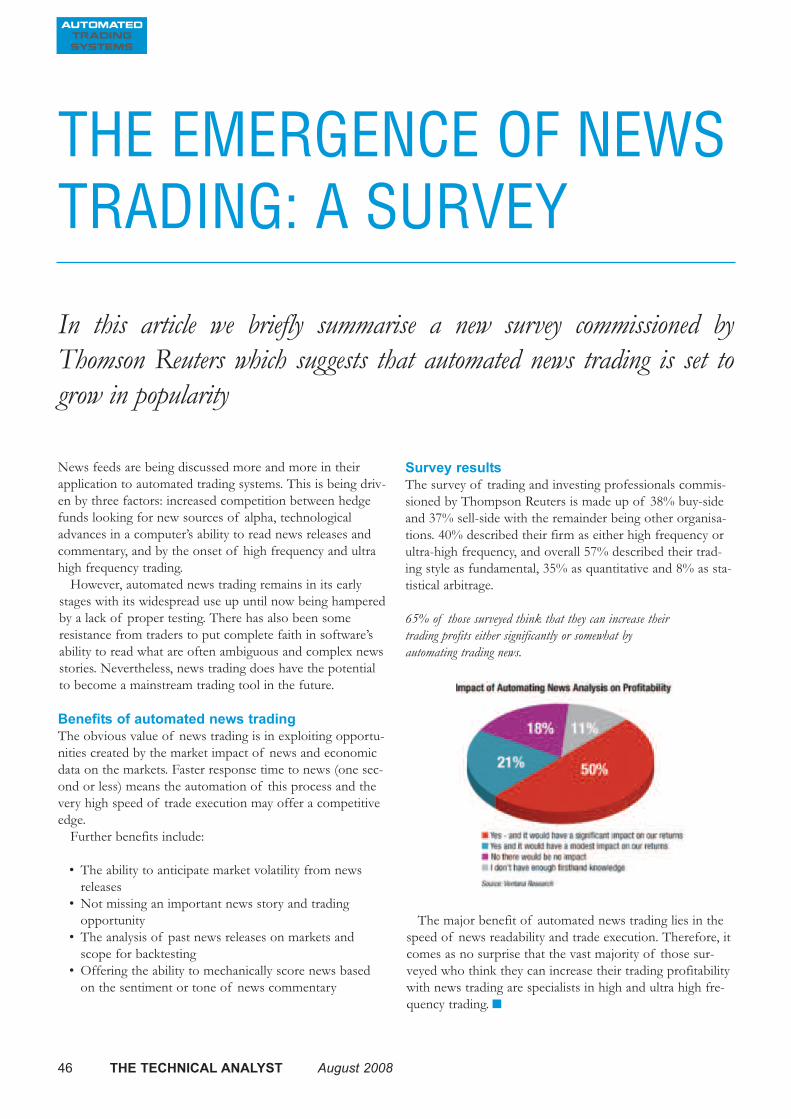
THE EMERGENCE OF NEWS TRADING: A SURVEY
News feeds are being discussed more and more in theirapplication to automated trading systems. This is being driv-en by three factors: increased competition between hedgefunds looking for new sources of alpha, technologicaladvances in a computer’s ability to read news releases andcommentary, and by the onset of high frequency and ultrahigh frequency trading.
However, automated news trading remains in its earlystages with its widespread use up until now being hamperedby a lack of proper testing. There has also been someresistance from traders to put complete faith in software’sability to read what are often ambiguous and complex newsstories. Nevertheless, news trading does have the potentialto become a mainstream trading tool in the future.
Benefits of automated news trading The obvious value of news trading is in exploiting opportu-nities created by the market impact of news and economicdata on the markets. Faster response time to news (one sec-ond or less) means the automation of this process and thevery high speed of trade execution may offer a competitiveedge.
Further benefits include:
• The ability to anticipate market volatility from newsreleases
• Not missing an important news story and tradingopportunity
• The analysis of past news releases on markets andscope for backtesting
• Offering the ability to mechanically score news basedon the sentiment or tone of news commentary
Survey resultsThe survey of trading and investing professionals commis-sioned by Thompson Reuters is made up of 38% buy-sideand 37% sell-side with the remainder being other organisa-tions. 40% described their firm as either high frequency orultra-high frequency, and overall 57% described their trad-ing style as fundamental, 35% as quantitative and 8% as sta-tistical arbitrage.
65% of those surveyed think that they can increase their trading profits either significantly or somewhat by automating trading news.
The major benefit of automated news trading lies in thespeed of news readability and trade execution. Therefore, itcomes as no surprise that the vast majority of those sur-veyed who think they can increase their trading profitabilitywith news trading are specialists in high and ultra high fre-quency trading.
In this article we briefly summarise a new survey commissioned byThomson Reuters which suggests that automated news trading is set togrow in popularity
46 THE TECHNICAL ANALYST August 2008

August 2008 THE TECHNICAL ANALYST 47

Principal Trainer
Trevor Neil
Trevor Neil became a commodities trader at Merrill Lynch in the mid 1970’s before going on to work at LIFFE giving technical
analysis support to �oor traders.
In 2000 he became head of technical analysis at Bloomberg where he was responsible for training and technical analysis software development.
Full course details can be found at: www.technicalanalyst.co.uk/training
For further information email: [email protected]
Register online at: www.technicalanalyst.co.uk or call: +44 (0)1483 573150
Course Details
Duration:
Courses are run from 9am to 5pm and include lunch and refreshments.
Who Should Attend:
Traders, fund managers, hedge funds, risk managers, analysts and brokers
The essential technical analysis course providing a thorough grounding in TA techniques for traders and investment managers new to the subject.
This highly regarded 2-day course provides in-depth training in the most e!ective technical trading strategies for more experienced market professionals.
Recognising that portfolio managers and analysts do not need the kind of technical analysis used by day-traders and dealers, this course concentrates on market timing from a longer-term point of view. This course is designed to give a timing overlay for fundamental decisions.
Training Courses
Training with The Technical Analyst
The Technical Analyst o!ers a range of exciting training courses for traders and investment managers. We also o!er specialist in-house training on request.
ADVANCED TECHNICAL ANALYSIS (2 DAYS)
TA FOR THE PORTFOLIO MANAGER
INTRODUCTION TO TECHNICAL ANALYSIS
24/25 September London20/21 November Hong Kong
23 September London19 November Hong Kong
PAIRS TRADING
FURTHER COURSES
1 October London
DEMARK INDICATORS 13 November London
CERTIFIED TRADING SYSTEM DEVELOPER Quali"cation & training in systems development (see website for details)
AUTOMATED TRADING WORKSHOP12 November London
25/56 November London
Our very popular course for all market professionals looks at a variety of trading techniques for developing an e!ective short term trading strategy.
SHORT TERM TRADING WORKSHOP (2 DAYS)
15/16 October London

GET QUALIFIED IN TECHNICAL ANALYSIS
For more information on how to join and what is involved in passing
the STA Diploma exam, visit our website at: www.sta-uk.org or call
us on +44 7000 710207
The Society of Technical Analysts (STA) represents and accreditsprofessional and private Technical Analysts operating in the UK
Originally established in the 1960s, the STA provides its members:• Education Monthly lectures and regular teaching courses in technical analysis
• Research The STA Journal publishes research papers on TA techniques and approaches
• Meetings Provide members the opportunity to discuss technical approaches and markets
• Representation The STA lobbies on behalf of analysts with data vendors, exchanges and regulators.
The STA represents the UK at the International Federation of Technical Analysts (IFTA)
• Accreditation The STA Diploma Exam is internationally recognised as a professional level qualification
in Technical Analysis

Uses Bloomberg or Reuters codes
Ultra fast scanning and alerting
Unlimited charts on your screens
Libraries full of custom indicators
Make the most of your Bloomberg or Reuters data for a low monthly fee
Program and backtest any strategy
Report writer, logos and notes
Chart all your Excel data
Price targets – Risk Reward ratios
Advanced Trading Tools
Updata Professional version 6.1 out now Download a free trial - www.updata.co.uk
Updata is a registered 3rd Party Application - Bloomberg or Reuters. All trademarks are the property of their respective owners.
Contact us direct: [email protected] Call for a demo: +44 (0)20 8874 4747
Increase the power of your marketterminal
Market professionals in over 30 countries rely on Updata software