Embed Size (px)
Citation preview
08/2003 1
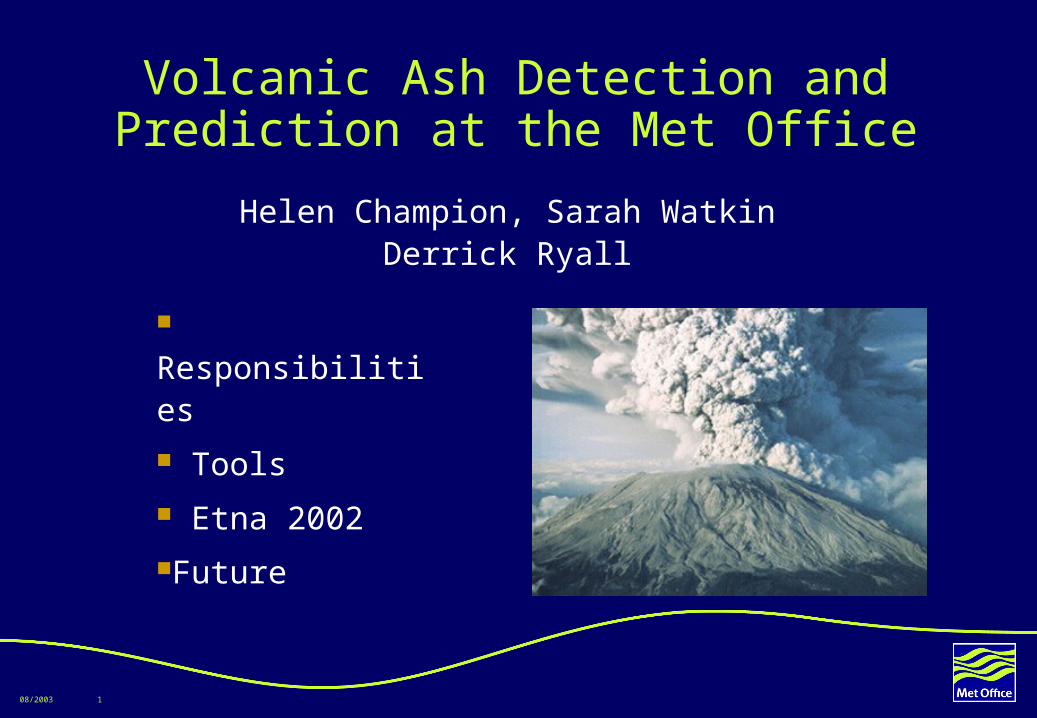
Volcanic Ash Detection and Prediction at the Met Office
Helen Champion, Sarah WatkinDerrick Ryall
Responsibilities
Tools
Etna 2002
Future
08/2003 2
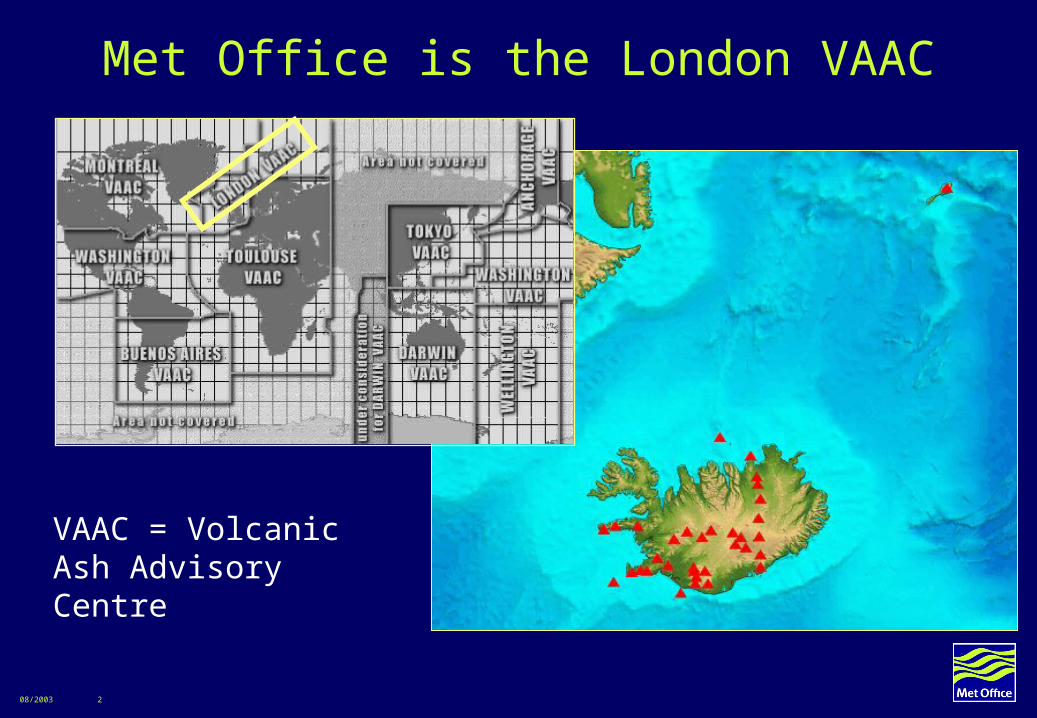
Met Office is the London VAAC
VAAC = Volcanic Ash Advisory Centre
08/2003 3
28 October 2002 1316 UTC
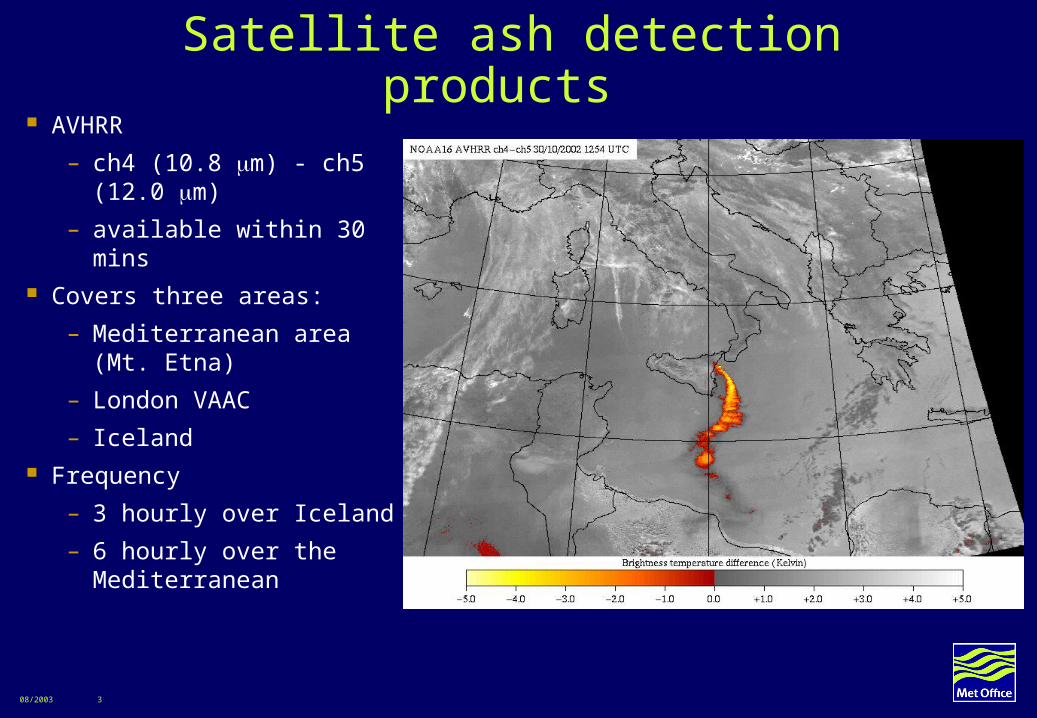
Satellite ash detection products AVHRR
– ch4 (10.8 m) - ch5 (12.0 m)
– available within 30 mins Covers three areas:
– Mediterranean area (Mt. Etna)
– London VAAC
– Iceland Frequency
– 3 hourly over Iceland
– 6 hourly over the Mediterranean
08/2003 4
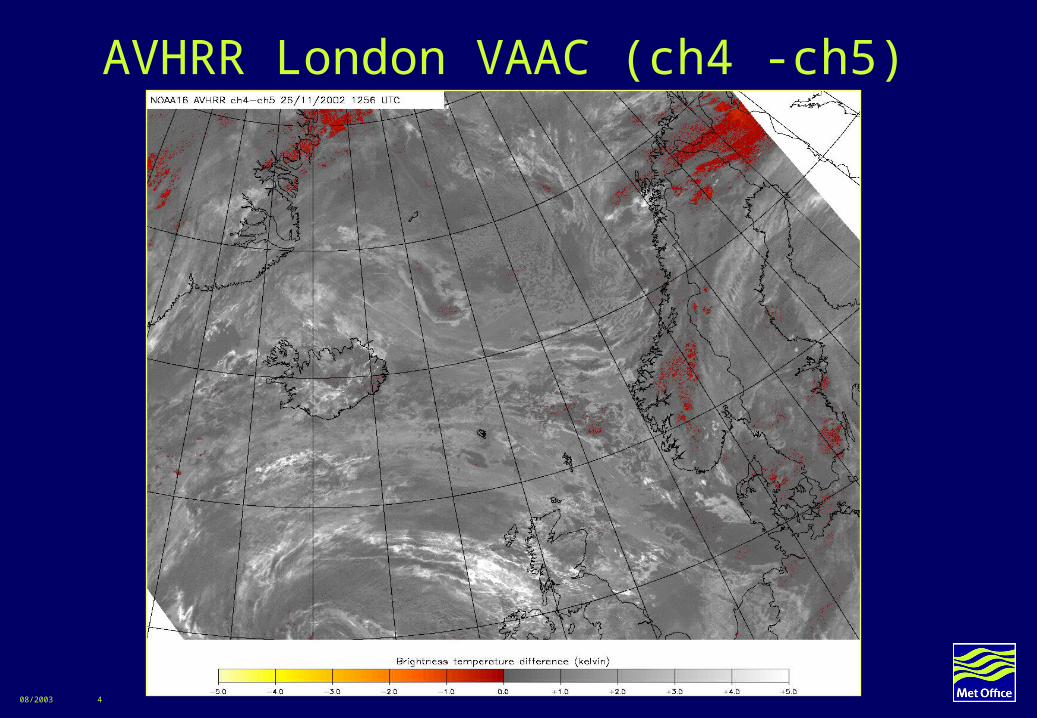
AVHRR London VAAC (ch4 -ch5)
08/2003 5
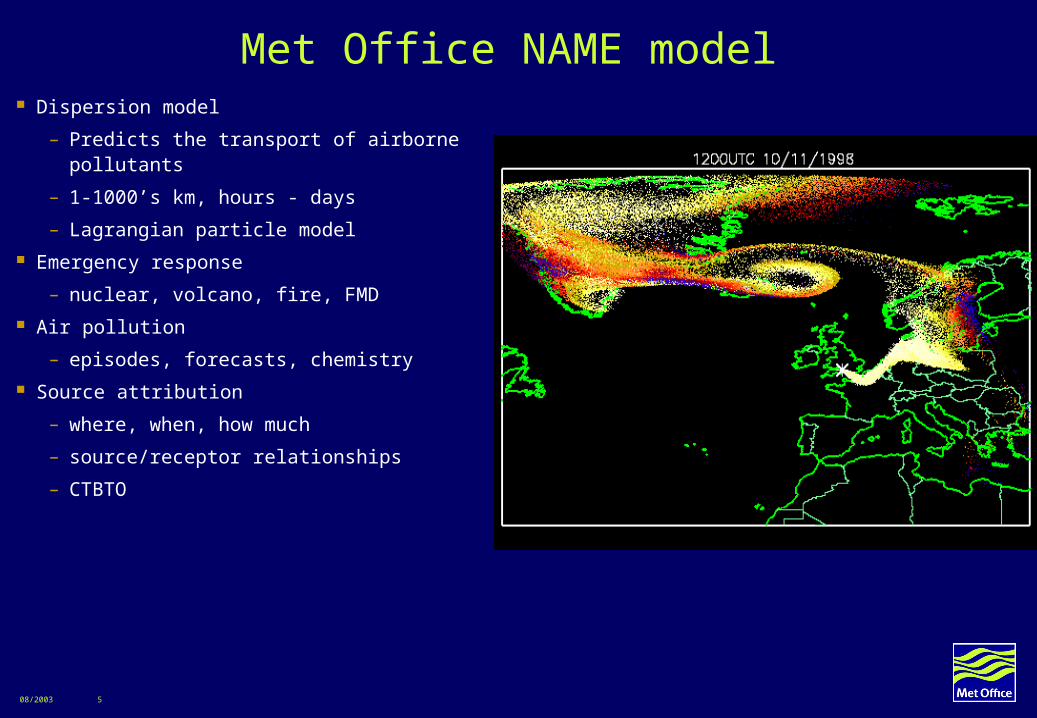
Met Office NAME model Dispersion model
– Predicts the transport of airborne pollutants
– 1-1000’s km, hours - days
– Lagrangian particle model
Emergency response
– nuclear, volcano, fire, FMD
Air pollution
– episodes, forecasts, chemistry
Source attribution
– where, when, how much
– source/receptor relationships
– CTBTO
08/2003 6
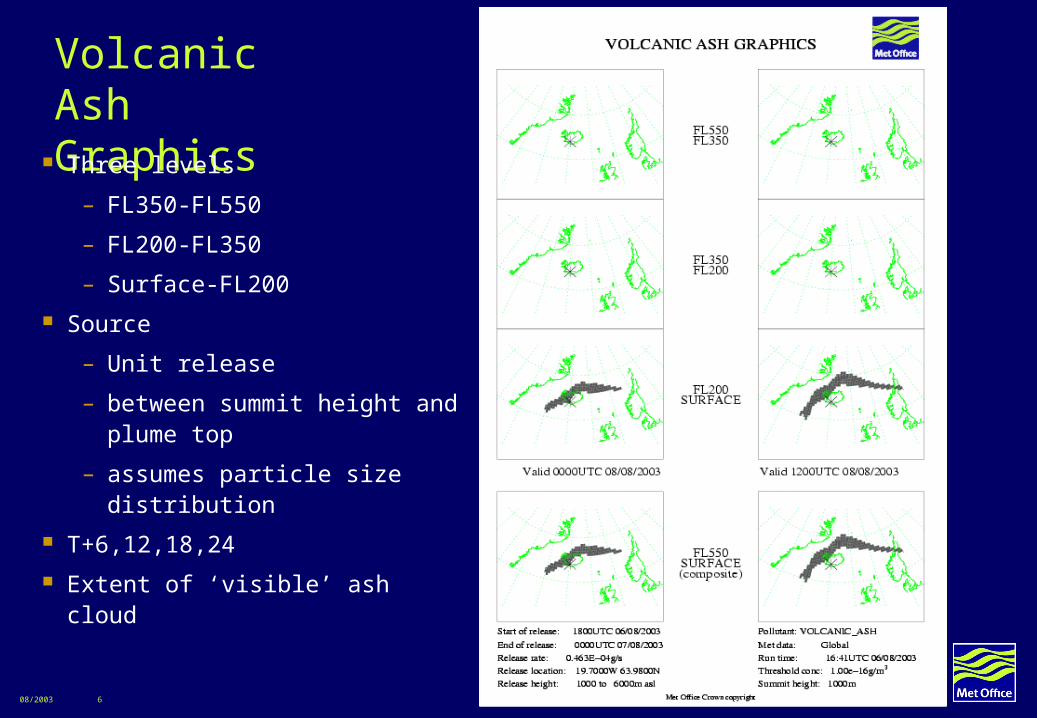
Volcanic Ash Graphics
Three levels
– FL350-FL550
– FL200-FL350
– Surface-FL200
Source
– Unit release
– between summit height and plume top
– assumes particle size distribution
T+6,12,18,24
Extent of ‘visible’ ash cloud
08/2003 7
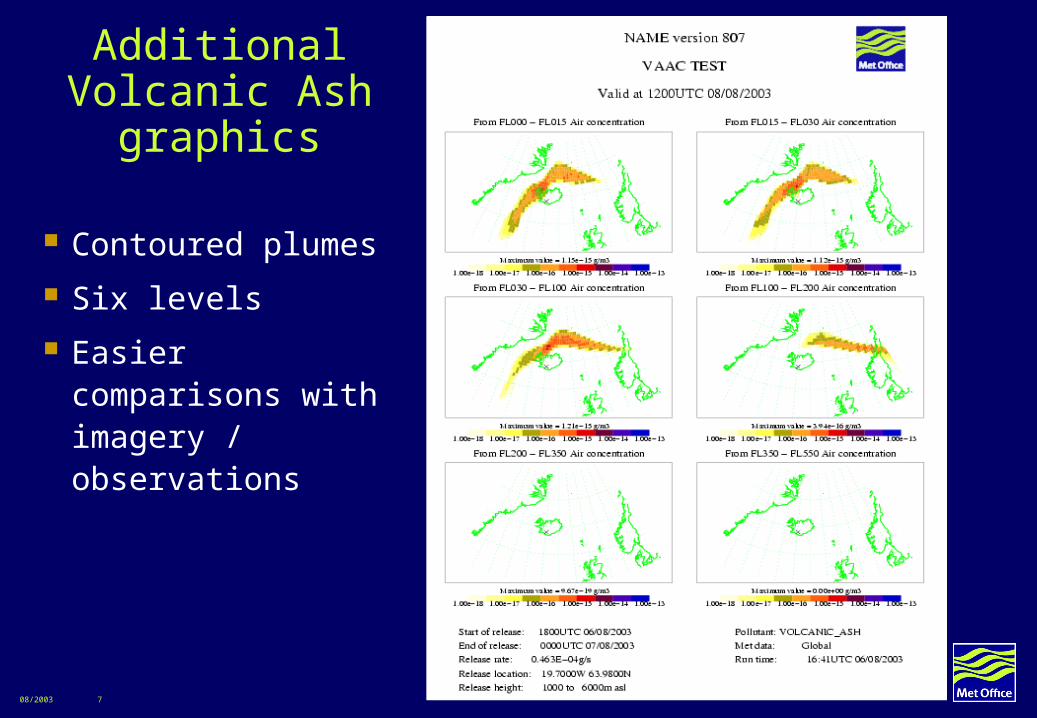
Additional Volcanic Ash graphics
Contoured plumes
Six levels
Easier comparisons with imagery / observations
08/2003 8
Recent Improvements to NAME
Automated plotting threshold for visual ash cloud concentrations
– Previously manual forecaster input based on obs
Upgraded to use ‘New Dynamics’ version of Unified Model
– 3 hourly global fields to T+144, ~60km resolution
– Increased vertical resolution (particularly near tropopause)
Revised boundary layer turbulence schemes
08/2003 9
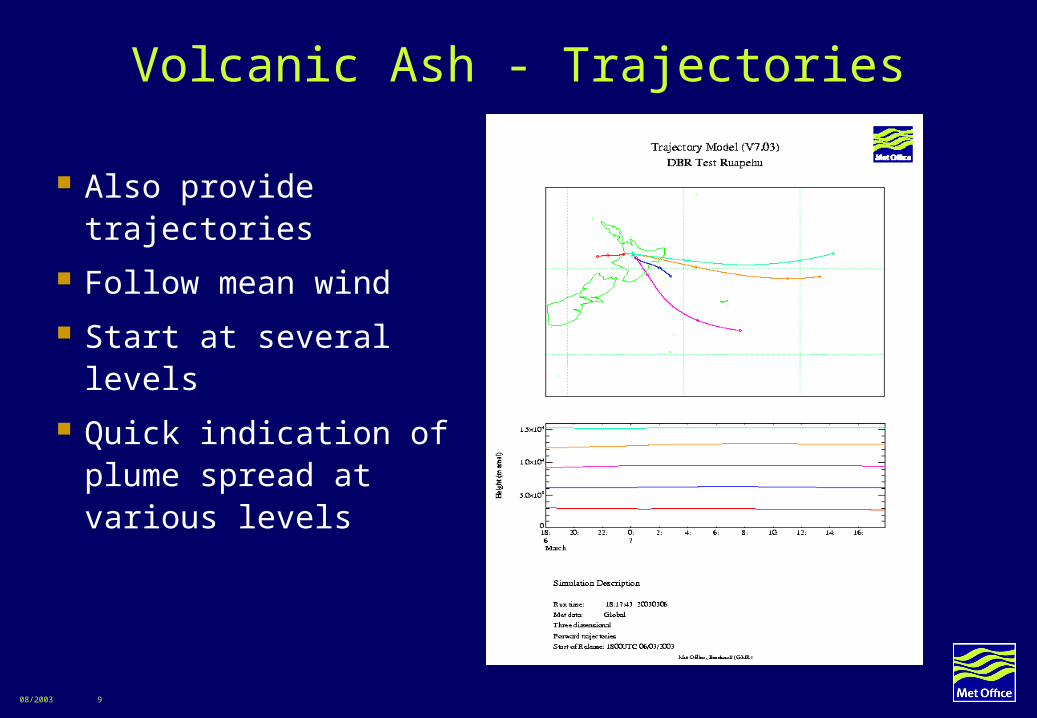
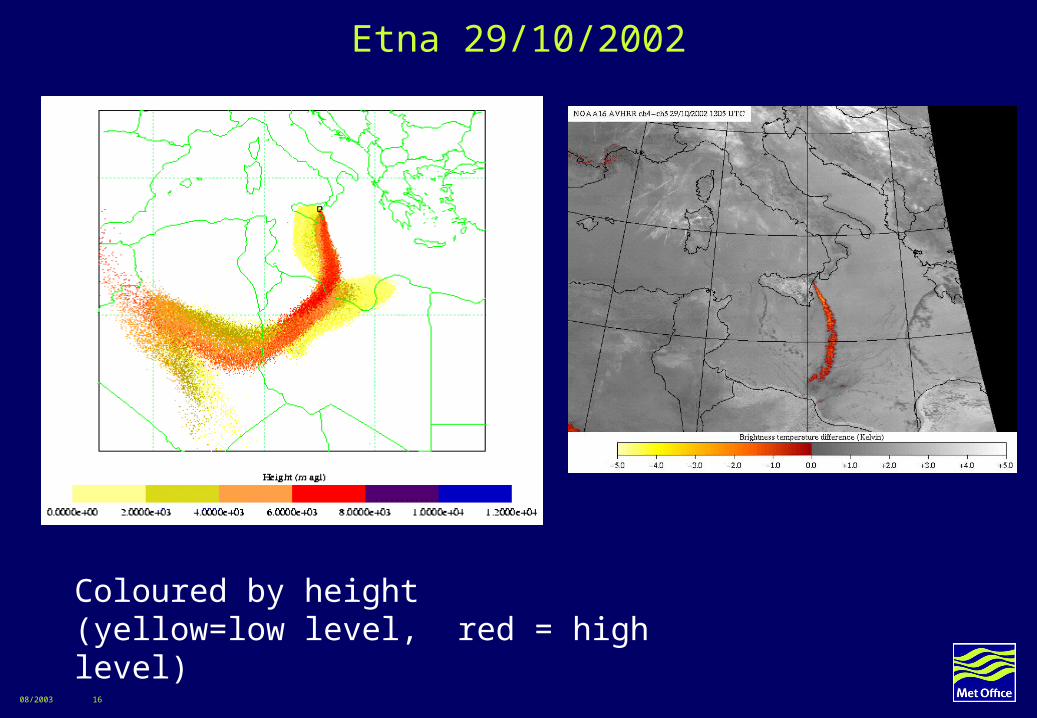
Volcanic Ash - Trajectories
Also provide trajectories
Follow mean wind
Start at several levels
Quick indication of plume spread at various levels
08/2003 10
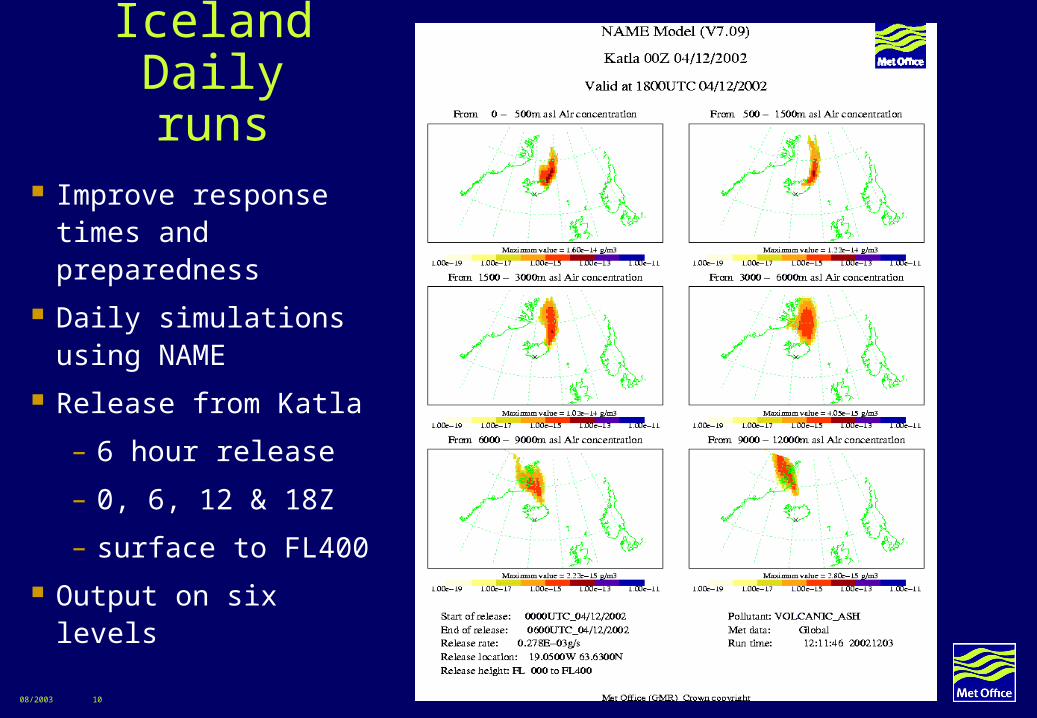
IcelandDaily runs
Improve response times and preparedness
Daily simulations using NAME
Release from Katla
– 6 hour release
– 0, 6, 12 & 18Z
– surface to FL400
Output on six levels
08/2003 11
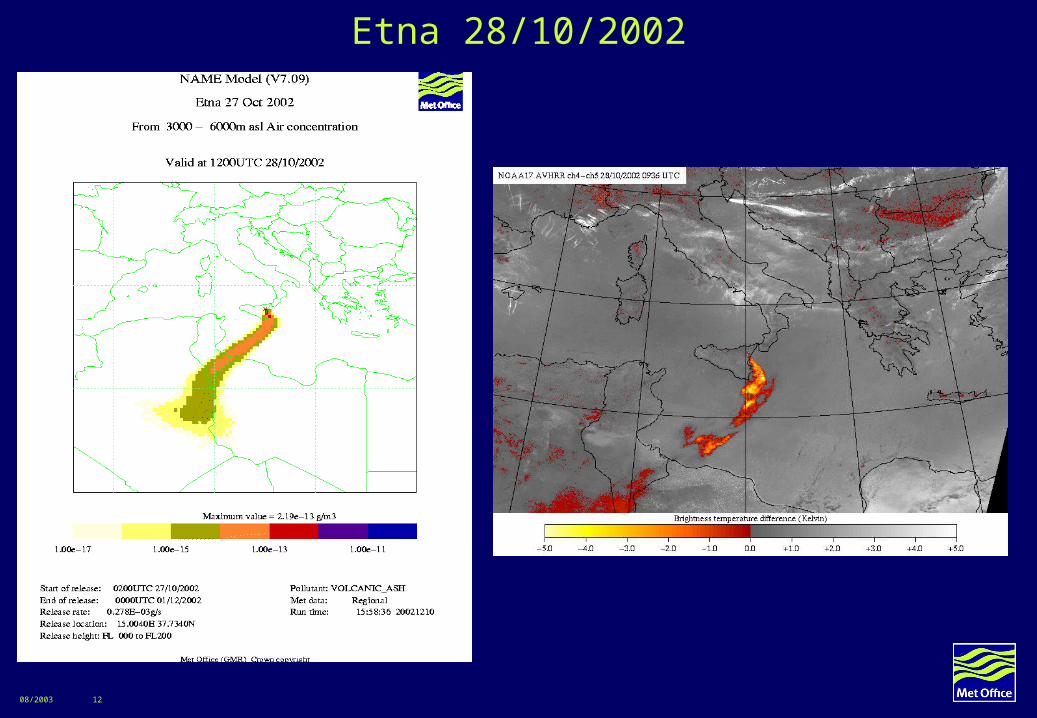
Etna eruption 2002
27 Oct 2002 Etna erupted to ~FL200
Emissions continued over several days
Useful case to look at
– Full range of satellite imagery
– Area largely cloud free
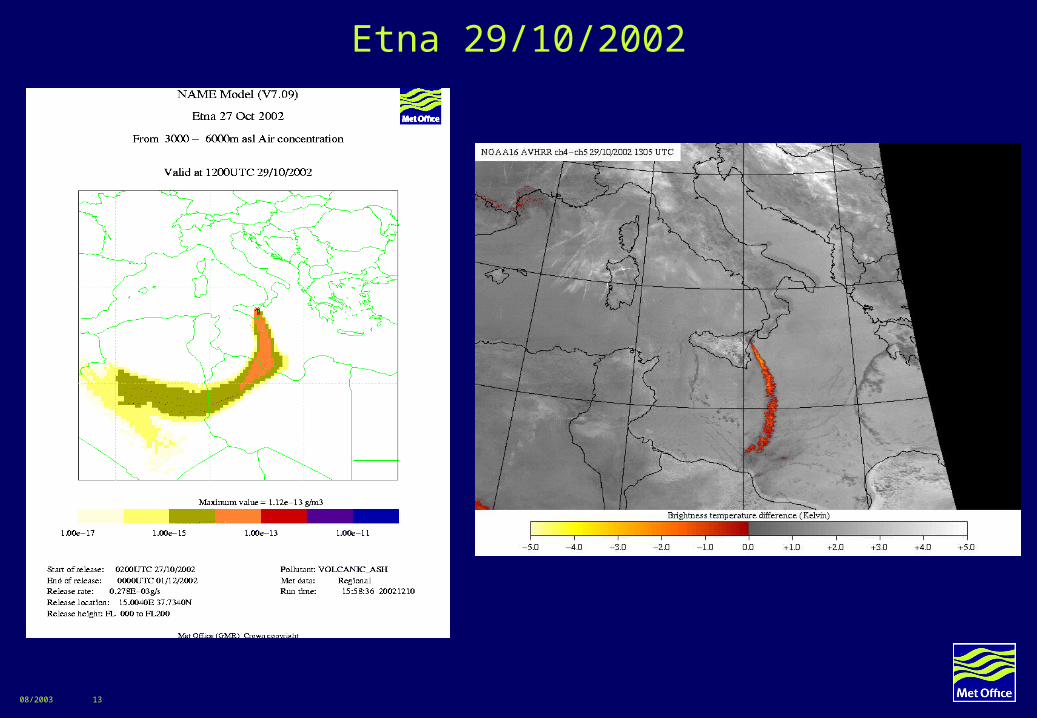
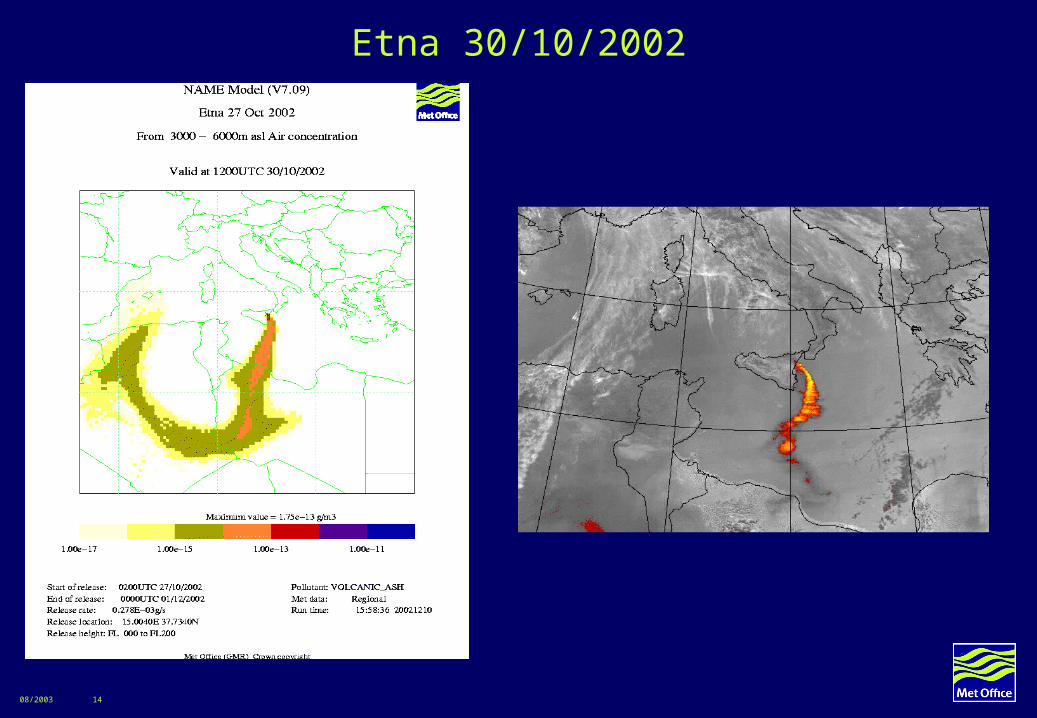
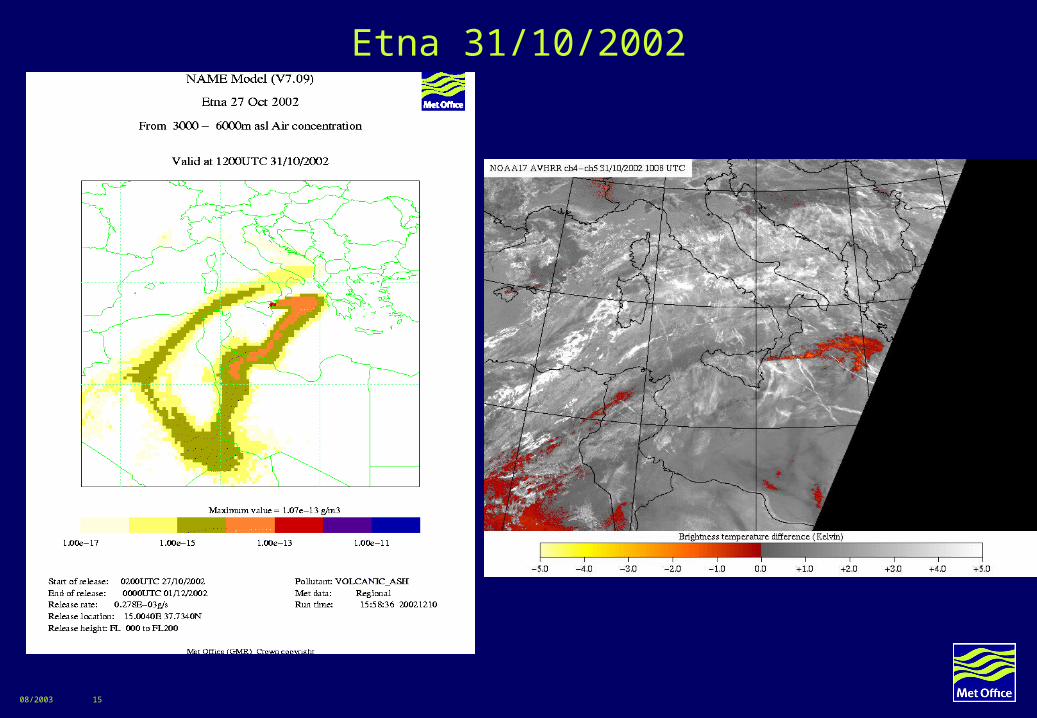
Use NAME to simulate first 10 days of emissions
Continuous release from surface to FL200
Compare concentrations (FL100 & FL200) with satellite imagery, particularly ch4-ch5
08/2003 12
Etna 28/10/2002
08/2003 13
Etna 29/10/2002
08/2003 14
Etna 30/10/2002
08/2003 15
Etna 31/10/2002
08/2003 16
Etna 29/10/2002
Coloured by height(yellow=low level, red = high level)
08/2003 17
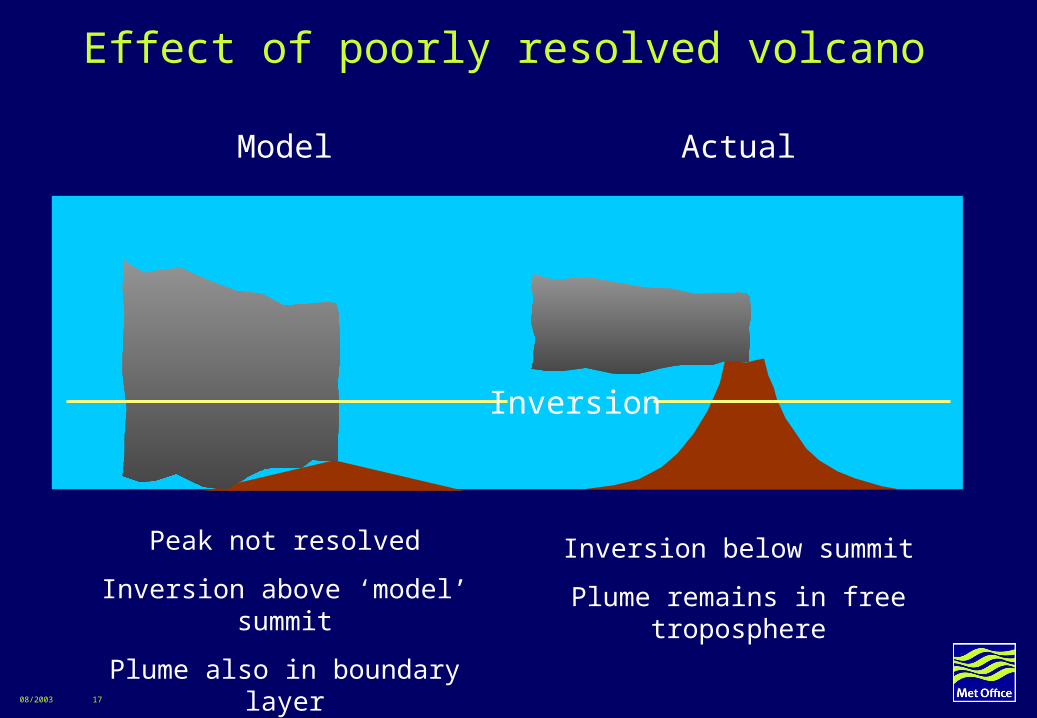
Effect of poorly resolved volcano
Inversion below summit
Plume remains in free troposphere
Peak not resolved
Inversion above ‘model’ summit
Plume also in boundary layer
Inversion
ActualModel
08/2003 18
Poorly resolved orography
Particular problem with isolated peaks
No simple solution as NWP data will not properly represent flow around/over peak
If use ‘model’ summit height column is ‘stretched’ - material spreads over twice the height, giving lower concentrations
Suggest using ‘elevated’ source
08/2003 19
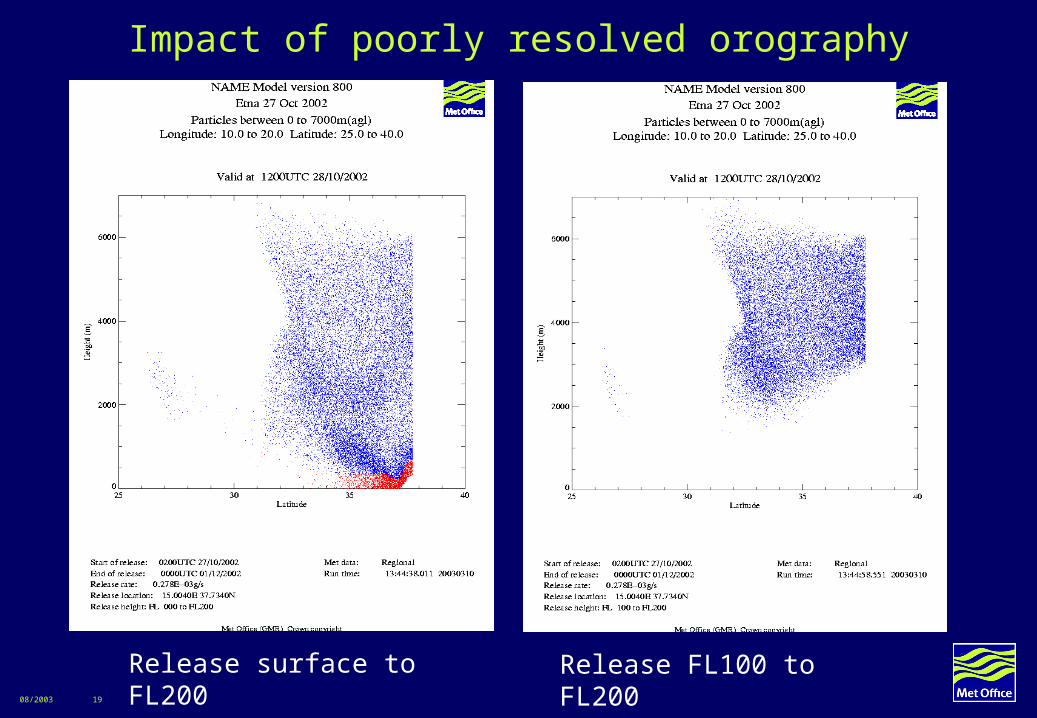
Release surface to FL200 Release FL100 to FL200
Impact of poorly resolved orography
08/2003 20
Future Work Volcanic ash detection
– SEVERI on MSG (including AVHRR ch4-ch5)
– 15 minute imagery
Automatic detection system (Helen Watkin’s talk)– Upgrade to MSG
– Operational implementation
Modelling– Need better definition of ‘Visual Ash Cloud’ - more appropriate would be
’concentrations hazardous to aviation’
– Include sulphur as well as ash
– Ensemble approach - multiple NAME runs on ECMWF EPS members (51)
08/2003 21
Summary
Volcanic ash detection system and NAME predictions give increased confidence in operational VAAC results
Etna case study demonstrates the value of these tools
Issues for future work include
– calibration of satellite imagery
– representation of orography / height of release
– definition of hazardous ash concentrations