Embed Size (px)
Citation preview

Visio Automation for Infrastructure Design and Management
David CuthbertsonSquare Mile Systems / AssetGen

A Few Questions• Anyone here attended previous Visio workshops?
• Which is easier and faster to complete?a. Updating a Visio drawing with changesb. Re‐drawing into Visio a drawing sent in Cad/PDF/JPEG/BMP
• What has to happen to have 6500 racks drawn with consistent format and detail by different engineers?

This Workshop Will Show• What can be reduced with Visio
workload ‐ skills dependentcost ‐ $26 or $20,000time ‐ 16 minutes or 25 days
• How to improve diagram quality and accuracy• All of which you can do later today ‐ yourself!!

Visio Automation Agenda
1. Understand Visio – out of the box2. Diagramming techniques
‐Making it simpler for all3. Linking Visio to data sources
‐ Reduce cut/paste, diagram refresh, consistency4. Automation for larger infrastructures
‐ Automated creation and updating

Diagrams Are Very Useful!

If A Picture Paints a Thousand Words
How do we paint a thousand pictures?
Easily?

Understanding IT Dependencies Isn’t Easy
Room
Power
Rack
System
Service
Remote Mgmt
LAN
SAN
User Data
Cabling
Support
Ownership
OS
ApplicationsVirtual MachinesSoftware
Security
Contracts DR Plan
Backup
Hardware Build
Licences Environment Change Impact
One Server ,Multiple Mappings and Diagrams
Commercial Physical Logical Business
440
I
CRITICAL
MAJOR
MINOR
USER
COMPACT
microsystems
440
I
CRITICAL
MAJOR
MINOR
USER
COMPACT
microsystems
UK_BIRM_UX01
Many 1,000s of documents are created by projects, operations and risk processes

Dependencies & DiagramsAssetGen Planner Birmingham Computer Room
Racks
Run Date: 02 June 2008
Birmingham | Call Centre - UK | Computer Room | 01-03
Front
1 2 3 4 5 6 7 8 17 18 19 20 21 22 2 3 249 10 1 1 12 13 14 1 5 161 2 3 4 5 6 7 8 17 18 19 20 21 22 2 3 249 10 1 1 12 13 14 1 5 16
PP01-03-01
UID
HPProLiantDL380 G5
COMPACT
1 2
1 2 3 4 5 6 7 8
POWERSUPPLYSUPPLY
POWER
SPAREONLINE
MIRROR
CAGERISERPCI
PROCPROC
LOCKINTER
TEMPOVER
FANS
PPM PPM
DIMMS
UID
HPProLiantDL380 G5
COMPACT
1 2
1 2 3 4 5 6 7 8
POWERSUPPLYSUPPLY
POWER
SPAREONLINE
MIRROR
CAGERISERPCI
PROCPROC
LOCKINTER
TEMPOVER
FANS
PPM PPM
DIMMS
4 40
I
CRIT ICA L
MA JO R
MINO R
USE R
CO M PAC T
mic r osy ste ms
4 40
I
CRIT ICA L
MA JO R
MINO R
USE R
CO M PAC T
mic r osy ste ms
UK_BIRM_UX01
PROLIANTPROLIANT
SERVERWIN0001
tsr 4554
PROLIANTPROLIANT
SERVERWIN0099
PROLIANTPROLIANT
SERVERWIN00078
Rear
AssetGen Planner Birmingham Computer Room
Run Date: 02 June 2008
AssetGen Planner Birmingham Computer Room
Run Date: 02 June 2008
AA
01
AB AC AD AE AF AG AH AI AJ AK AL AM AN AO AP AQ AR AS AT AU AV AW AX AY AZ
02
03
04
05
06
07
08
09
10
11
12
13
14
15
16
17
Earth Bar
01-01 01-02 01-03 01-04 01-05 01-06 01-07 01-08 01-09 01-10
02-01 02-02 02-03 02-04 02-05 02-06 02-07 02-08 02-09 02-10
PDU1 PDU2
03-01 03-02 03-03 03-04 03-05 03-06 03-07 03-08 03-09 03-10
I-Series A I-Series B
SAN-01 SAN-02
Claims Processing ExampleService assets have embedded links for further analysis or verification
Physical assets also have AssetGen
Connect links for more detail
Claims Module
Claims Processing
Payment Module
ACCOUNTSINS_LIVE
Accounts ModuleMember Module Policy Module
SVRUNX001 SVRWIN001
Accounts Payable
Accounts Receivable
CRM_DB PAYROLL
Policy Administration
CRM Sage Payroll
PayrollSales
Network Topology Example
SW-BHAM-CORE1 SW-BHAM-CORE2
SW-BHAM-01 SW-BHAM-05 SW-BHAM-02SW-BHAM-04SW-BHAM-06
UK_BIRM_UX01 UK_BIRM_UX02 UK_BIRM_UX09 UK_BIRM_UX04 UK_BIRM_UX05 UK_BIRM_UX03 UK_BIRM_UX06 UK_BIRM_UX07 UK_BIRM_UX08 UK_BIRM_UX10
Rack Floor Plan ITIL Service Map
Network Topology Build
Data Flows
Zones
RUN
RUN
SW-BHAM-CORE1
SW-BHAM-CORE1.Card3
STATUS
WS -X6748-GE-TX 4748
3738
353 6
2526
2 324
1 314
1 112
12
4 8 P O R T1 2119 107 85 63 41 2 24232 1 2 21 9 2017 1815 1613 14 363533 3431 3229 3027 2825 26 484745 4643 4441 423 9 4037 38
1 0/100/1 000GE MO D
F ABRIC ENABLEDRJ45
SW-BHAM-CORE1.Card4
STATUS
WS -X6748-GE-TX 4748
3738
353 6
2526
2 324
1 314
1 112
12
4 8 P O R T1 2119 107 85 63 41 2 24232 1 2 21 9 2017 1815 1613 14 363533 3431 3229 3027 2825 26 484745 4643 4441 423 9 4037 38
1 0/100/1 000GE MO D
F ABRIC ENABLEDRJ45
SW-BHAM-CORE1.Card5
SW-BHAM-CORE1.Card9
W S-X6K-SUP1A-2GE
SUPERVISOR 1
STA
TUS
SYST
EM
ACTI
VE
PWR
MG
MT
RESE
T
CONSOLE
DTE
/DC
E
SW ITCH LOAD
100%
1%
PORT 1
PCMCIA EJECT
PORT 2
LINK
LINK
SW-BHAM-CORE1.Card1
FAN STATUS ! HIGH SPEED MOVING BLADES ASR-9010-FAN
FAN STATUS ! HIGH SPEED MOVING BLADES ASR-9010-FAN
OPEN
ASR 9000 Series
text

© Square Mile Systems9
Diagrams Also Cover ProcessesProjects Deployment
PlanningDesignTeam
ChangeMgmt
Build Team
StdComponents
Request
Outline Design Doc
UpdateCapacity Plan
QA Check
Accept/Reject Release DetailedPlan Schedule Change
ConfirmContractors
BookContractor
Requestform
Yes
No
Forward bookingschedule
Allocateddates
Handover
Accept
Reject
Deploymentdesign
Change from reservedto allocated
Design Review

Information Gaps Cause Pain
Fixed Infrastructure(Cabling, Power, Cabinets, Rooms, Buildings)
Hardware InfrastructurePCs, Network, Servers, UPS, Storage, Other
Virtual InfrastructurePCs, Network, Servers, Storage, DBMS
ApplicationsPC, server, mainframe, SOA
ServicesEnd user, infrastructure, supplier
Business ProcessesDepartmental, Company
1. Buy things you don’t need2. Don’t buy things you do need3. Reverse engineer with every project4. Fault resolution takes longer5. Problems escalate with distractions6. Unnecessary site surveys7. Project timescales are not predictable8. Repeated “one off” audits9. Overload key individuals10. Less confidence in security controls11. Inability to optimise team processes12. Unplanned change disruption 13. Duplicate what can’t be found

11
1. Visio Basics• Visio history
– 1992 First released, 2000 acquired by Microsoft– Last non‐MS versions had auto‐discovery, equipment templates – all removed with
Visio 2003
• Versions– Visio 2016 Standard– Visio 2016 Professional– Visio Pro For Office 365– Visio Viewer (runs in IE browser)– Visio app for iOS– Visio online – web based collaboration

12
Which Version ‐ Standard or Professional?
• No thought required – Go for Professional!• Why?
– More extensive selection of shapes– Data linking (look for data tab)– Data graphics – saves typing and redrawing diagrams– Visio extras
• An hour saved in a year makes it worth it!

Visio Resources And Help
• Microsoft web site• Books• LinkedIn group – Visio Enthusiasts• Equipment manufacturer web sites
– Cisco, Commscope, Siemon– HP, Dell, IBM, others www.visiocafe.com www.shapesource.com
• 3rd Party stencils– netZoom, others www.altimatech.com
• Visioguy forum www.visguy.com

Templates, Stencils, Shapes
Templates
Stencils
Shape
Categories

Visio Concepts and terms
• Template• Stencil• Shape• Shape properties• Connector• Background• Layer
SW-BHAM-01
RTR-BHAM-01
PropertiesCisco 295010.6.2.32Live
Data Centre
Comms Room

16
Visio Basics ‐1• Creating new diagram from a template• Manipulating shapes on a page• Aligning and Distributing Shapes• Copy, Paste and Duplicate Shapes• Grouping and ungrouping shapes• Foreground and Background options• Zooming in and Out of the Page• Using the Drawing Toolbar to create basic shapes

17
Visio Basics ‐ 2
• Connectors• Static and dynamic glue• Adding, deleting and moving connector points • Using different stencils
– Stencil search• Shape behaviour ‐1d, 2d, drill down• Working with text
– Object text– Freeform text– Text block tool

Static glue
• Static glue is to a particular connection point
• The connection points used don’t move even if the shapes are moved
18

Dynamic glue
• Drag connector onto shape and wait until shape is highlighted in red
• If you move the shapes relative to each other the connection moves appropriately
19

Using Different Stencils (and searching)
• Use Shapes tab• Select via menus• Use Search
options• External stencil
sets– Suppliers, 3rd
party
20

Danger! ‐ Visio File Sizes
Two files Diagram 1 1995kBDiagram 2 12kB
Diagram 1 is 166 times the size of Diagram 2!
Some tips to reduce file sizes
21
22
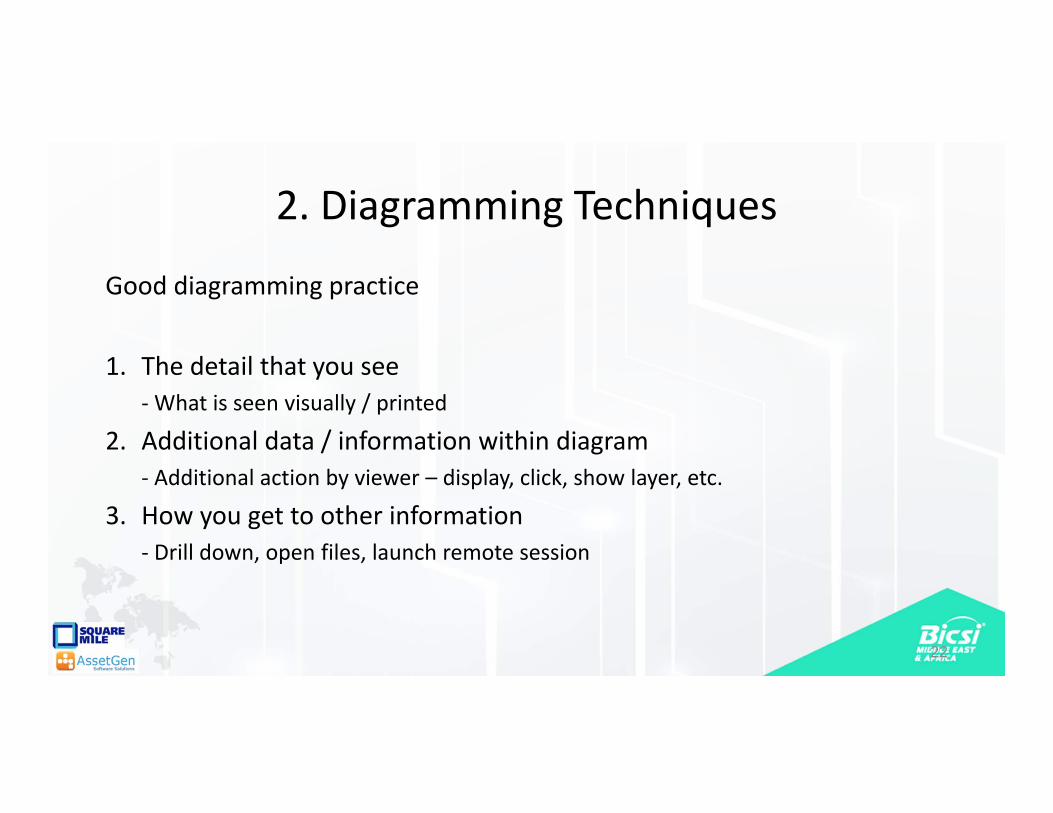
2. Diagramming Techniques
Good diagramming practice
1. The detail that you see‐What is seen visually / printed
2. Additional data / information within diagram‐ Additional action by viewer – display, click, show layer, etc.
3. How you get to other information‐ Drill down, open files, launch remote session

23
The Process of Creating a Diagram1.
8.
2.
3.
4.
5.
6.
7.
1. Which takes the most time?
2. Where can errors creep in?
Purpose
Gather data
Transfer data to diagram
Layout
Add extra detail
Save
Send / publish diagram
Define shapes

24
Diagram Process Examples1.
8.
2.
3.
4.
5.
6.
7.
Purpose
Gather data
Transfer data to diagram
Layout
Add extra detail
Save
Send / publish diagram
Define shapes
Rack Diagram R01
Select Rack R01Inventory
Create Shapes
Place/size to position in rack
Notes, etc.
Save as Rack R01
Store on serverIntranet/SharePoint
Match to Physical Shapes
Network DiagramOrlando LAN
Switches / Routerin Orlando
Create Shapesand connections
Move/size for readability
Notes, etc.
Save as Orlando LAN
Store on serverIntranet/SharePoint
Match to Logical Shapes
SW-BHAM-Trade01FAN
STATUS
C6509-E-FAN
1
2
3
4
5
6
7
8
9
WS-C6509-E
1
FANOK
OUTPUTFAIL
2
INPUTOK
SWITCH MUST BE IN OFF “O” POSITI ON TO INSTALL/REM OVE POWER SUPPLY. FASTENER M UST BE FULLYENGAGED PRIOR TO OPERATING POWER SUPPLY.
CISCO SYSTE MS, INC.
INPUT 2100-240V ~16A60/50 Hz
INPUT 1100-240V ~16A60/50 Hz
INSTALL
RUN
1
FANOK
OUTPUTFA IL
2
INPUTOK
SWITCH M UST BE IN OFF “O” POSITION TO INSTALL/REM OVE POWER SUPPLY. FASTENER M UST BE FULLYENGAGED PRIOR TO OPERATING POWER SUPPLY.
CISCO SYSTEMS, INC.
INPUT 2100-240V ~16A60/50 Hz
INPUT 1100-240V ~16A60/50 Hz
INSTALL
RUN
SW-BHAM-CORE1
SW-BHAM-CORE1.Card3
STATUS
WS-X6748-G E-TX4 7
4837
383 5
362 5
2 623
2413
1 411
1 21
2
4 8 P O R T12119 107 85 63 41 2 242321 2219 2017 1815 1613 14 363533 3431 3229 3027 2825 26 484745 4643 4441 4239 4037 38
10/10 0/100 0GE MOD
F AB RIC E NA B LEDRJ45
SW-BHAM-CORE1.Card4
STATUS
WS-X6748-G E-TX47
4837
3835
3625
2623
2413
1411
121
2
4 8 P O R T12119 107 85 63 41 2 242321 2219 2017 1815 1613 14 363533 3431 3229 3027 2825 26 484745 4643 4441 4239 4037 38
10/10 0/100 0GE MOD
F AB RIC E NA B LEDRJ45
SW-BHAM-CORE1.Card5
SW-BHAM-CORE1.Card9
WS-X6 K- SUP1A-2GE
SUPERVISOR 1
STA
TUS
SYS
TEM
ACTI
VE
PWR
MG
MT
RES
ET
CONSOLE
DTE/
DCE
SWIT CH L OAD
100 %
1 %
PORT 1
PCM CI A EJECT
PORT 2
LINK
LINK
SW-BHAM-CORE1.Card1
440
I
CRITICAL
MAJOR
MINOR
USER
COMPACT
microsystems
440
I
CRITICAL
MAJOR
MINOR
USER
COMPACT
microsystems
25
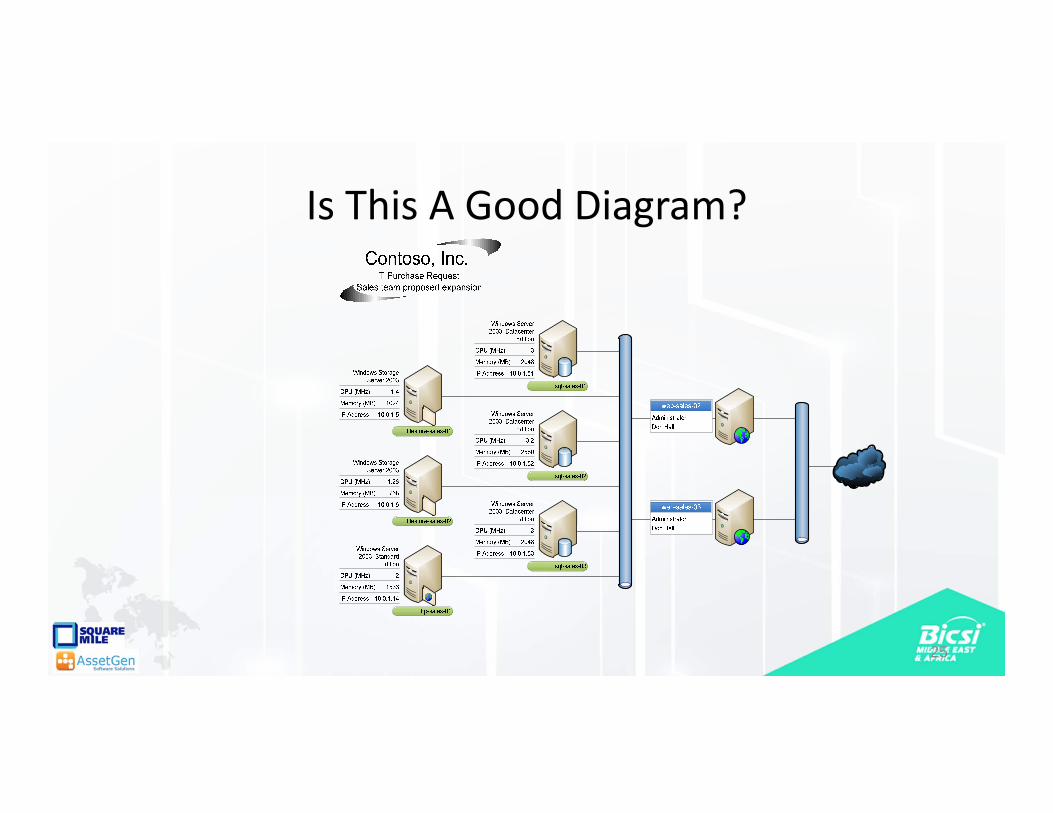
Is This A Good Diagram?

26
Does It Have These Characteristics?1. Title
2. Purpose
7. Symbols
8. Attributes
9. Connections
6. Instructions
3. Author
4. Version
5. Date
10. Grouping
11. Background / layers

Visio Examples
• Floor plans• Importing CAD / other formats• Layers • Data center floor plans• Backgrounds• Hyperlinking

3. Linking Visio To Data Sources
• Saves typing mistakes• Enables refresh of data• One diagram can serve multiple purposes
– Less to maintain
• Multiple views of one device– Less to maintain
• Enables use Of Data Graphics Feature

Understanding RealityTo understand infrastructureand manage change
We need multiple views• Rack schematics• Equipment configuration• Physical connectivity• Logical end point
connectivity• End device connectivity

Types Of Information / Documentation
1. Update project documentation with “as built” details2. Update asset/inventory list3. Update rack diagrams4. Update network patching records5. Update switch port usage and capacity6. Update floor plan rack capacity7. Update power usage spreadsheet(s)8. Update storage / backup system documentation9. Update systems architecture documentation10. Update DR lists and documents11. Update supplier maintenance records12. Update billing and charging data
What should be updated with a server or network change?
1 2 3 4 5 6 7 8 17 18 19 20 21 22 23 249 10 11 12 13 14 15 161 2 3 4 5 6 7 8 17 18 19 20 21 22 23 249 10 11 12 13 14 15 16
UID
HPProLi ant
DL380 G5
COMPACT
1 2
1 2 3 4 5 6 7 8
POWERS UPPLY SUPPLY
POWER
SPA REONLINE
MIRROR
CA GERIS ER
PCI
PRO C PROC
LOCKINTER
TEMPOV ER
FA NS
PPM
PPM
DIMMS
UID
HPProLi ant
DL380 G5
COMPACT
1 2
1 2 3 4 5 6 7 8
POWERS UPPLY SUPPLY
POWER
SPA REONLINE
MIRROR
CA GERIS ER
PCI
PRO C PROC
LOCKINTER
TEMPOV ER
FA NS
PPM
PPM
DIMMS
440
I
CRITICAL
MAJOR
MINOR
USER
CO MPACT
microsystems
440
I
CRITICAL
MAJOR
MINOR
USER
CO MPACT
microsystems
PROLIANTPROLIANT
PROLIANTPROLIANT
PROLIANTPROLIANT
The larger the environment – the more there is….www.assetgen.com

31
Multiple Device Instances in Diagrams
Floor Plan
Rack Position
Service view
Power Supply
Network Connections
BLADE_BIRM01
UK
_BIR
M01_B
LAD
E-01
UK
_BIR
M01_B
LAD
E-02
UK
_BIR
M01_B
LAD
E-03
UK
_BIR
M01_B
LAD
E-04
BLA
DE
-BIR
M01.B
LAD
E-S
W1
BLA
DE
-BIR
M01.B
LAD
E-S
W2
UK
_BIR
M01_B
LAD
E-05
UK
_BIR
M01_B
LAD
E-09
UK
_BIR
M01_B
LAD
E-10
UK
_BIR
M01_B
LAD
E-12
H/W Build

Reducing The Workload!
Excel Visio
Floor box list Floor plan
Cabinet list Equipment room floor plan
Patch panel list Backbone cabling diagram
Inventory Network diagram
Inventory Rack diagram
Inventory Server connectivity diagram

Using External Data Sources
1.
8.
2.
3.
4.
5.
6.
7.
NewPurpose
Gather data
Transfer data to diagram
Layout
Add extra detail
Save
Send / publish diagram
Define shapes
1.
8.
2.
3.
4.
5.
6.
7.
UpdatingPurpose
Gather data
Add / Delete shapeConnector, Data
Review Layout
Add extra detail
Save
Send / publish diagram
Check diagram for match
Time saving

Visio Data Graphics
• Standard feature 2007/10/13/16 Professional
• Enables use of embedded data– Display multiple text fields around a shape– Data bars to show capacity– Use icons for status differences– Change shape colour based on data value
SW-BHAM-09SW-BHAM-09
10.0.0.11
3745
Live
10.0.0.11
SwitchSW-BHAM-09

Limitations Of Visio / Data Source
• Good for quick diagrams• The data transfer and refresh is automated, but the filtering and selection is manual
• It doesn’t connect shapes together– Limits value in a network environment
• New devices are not added to diagrams

36
First Steps For Multiple Diagrams
• Control use of shapes / stencils• Follow best practices for diagram information• Save reference versions in common areas
– File locations– Web site– SharePoint
• Use a common source where possible for shape data– Databases preferred to spreadsheets– Create views to suit diagram information need

4. Automation For Larger Infrastructures
• Looking beyond a few spreadsheets• Minimise manual maintenance effort
– Scale and separation of roles demands it• Improving accuracy and consistency
– Software driven diagram production• Infrastructure document management
– Shared across teams, controlled access 37

Automating Documentation ‐ Example
• Manual method – draw a rack diagram 2 – 5 hours– Gather rack inventory data and positioning– Find Visio shapes for equipment– Draw the rack
• Automated method with software 10 seconds– Tick rack for cabinet drawing– Visio rack diagram produced
• 100 racks – 16 minutes or 25 days or $26 vs $20,000 ($100hr)• 6500 racks???

Automated Enterprise Drawing
• Should we draw and redraw diagrams in Visio or have a GUI that does this onto a database?– Yes for simple views (ie rack, path) DCIM/CMS approach– No for anything that requires layout or crosses technologies
• Physical – floor plans, blown fiber, cabling runs, OSP• Logical – LAN/SAN/VLAN/WAN/VLAN system
• If we are refreshing data, then we have to update existing shapes, adding/removing shapes and connectors.– Beyond Excel/Visio data linking

Time saving
Extending Visio Automation
1.
8.
2.
3.
4.
5.
6.
7.
NewPurpose
Gather data
Transfer data to diagram
Layout
Add extra detail
Save
Send / publish diagram
Define shapes
1.
8.
2.
3.
4.
5.
6.
7.
UpdatingPurpose
Gather data
Add / Delete shapeConnector, Data
Review Layout
Add extra detail
Save
Send / publish diagram
Check diagram for match

Simple Goals
• Draw 60 rack diagrams and save on a file server, in folders listed by room location
• Check and update 100 site network diagrams with changes in devices, connections and data
• Refresh an updated set of build documents covering racks, hardware, cabling, power within a data center transition project
• When – now, tonight, every Friday

Many Infrastructure Information Needs
Plan Build Operate Risk Dispose
Project and tasks Operations And Risk Control
ExamplesProject documentationEquipment listsVisio/CAD diagramsTest results
ExamplesAsset and Inventory managementBusiness / service dependenciesMonitoring of performance, statusRisk and Recovery
Ease and speed of creationEase of distributionFlexible to meet task needsLimited training
Ease of use by manyStructured for integration & reportingSupport for multiple processesWide scope – the big picture!
42

Infrastructure Documentation WorkflowProject/
Design teamsOperations
Auditteam

Infrastructure Documentation WorkflowProject/
Design teamsOperations
Auditteam
Could we get the project teams to
update operational Visio diagrams?
???????????1. Standards2. Skills3. Access

45
Diagram Automation Examples1.
8.
2.
3.
4.
5.
6.
7.
Purpose
Gather data
Transfer data to diagram
Layout
Add extra detail
Save
Send / publish diagram
Define shapes
Rack Diagram R01
Select Rack R01Inventory
Create Shapes
Place/size to position in rack
Notes, etc.
Save as Rack R01
Store on serverIntranet/SharePoint
Match to Physical Shapes
Network DiagramOrlando LAN
Switches / Routerin Orlando
Create Shapesand connections
Move/size for readability
Notes, etc.
Save as Orlando LAN
Store on serverIntranet/SharePoint
Match to Logical Shapes
SW-BHAM-Trade01FAN
STATUS
C6509-E-FAN
1
2
3
4
5
6
7
8
9
WS-C6509-E
1
FANOK
OUTPUTFAIL
2
INPUTOK
SWITCH MUST BE IN OFF “O” POSITI ON TO INSTALL/REM OVE POWER SUPPLY. FASTENER M UST BE FULLYENGAGED PRIOR TO OPERATING POWER SUPPLY.
CISCO SYSTE MS, INC.
INPUT 2100-240V ~16A60/50 Hz
INPUT 1100-240V ~16A60/50 Hz
INSTALL
RUN
1
FANOK
OUTPUTFA IL
2
INPUTOK
SWITCH M UST BE IN OFF “O” POSITION TO INSTALL/REM OVE POWER SUPPLY. FASTENER M UST BE FULLYENGAGED PRIOR TO OPERATING POWER SUPPLY.
CISCO SYSTEMS, INC.
INPUT 2100-240V ~16A60/50 Hz
INPUT 1100-240V ~16A60/50 Hz
INSTALL
RUN
SW-BHAM-CORE1
SW-BHAM-CORE1.Card3
STATUS
WS-X6748-G E-TX47
4837
3835
3625
2623
2413
1411
121
2
4 8 P O R T12119 107 85 63 41 2 242321 2219 2017 1815 1613 14 363533 3431 3229 3027 2825 26 484745 4643 4441 4239 4037 38
10/10 0/100 0GE MOD
F AB RIC E NA B LEDRJ45
SW-BHAM-CORE1.Card4
STATUS
WS-X6748-G E-TX47
4837
3835
3625
2623
2413
1411
121
2
4 8 P O R T12119 107 85 63 41 2 242321 2219 2017 1815 1613 14 363533 3431 3229 3027 2825 26 484745 4643 4441 4239 4037 38
10/10 0/100 0GE MOD
F AB RIC E NA B LEDRJ45
SW-BHAM-CORE1.Card5
SW-BHAM-CORE1.Card9
WS-X6 K- SUP1A-2GE
SUPERVISOR 1
STA
TUS
SYS
TEM
ACTI
VE
PWR
MG
MT
RES
ET
CONSOLE
DTE/
DCE
SWIT CH L OAD
100 %
1 %
PORT 1
PCM CI A EJECT
PORT 2
LINK
LINK
SW-BHAM-CORE1.Card1
440
I
CRITICAL
MAJOR
MINOR
USER
COMPACT
microsystems
440
I
CRITICAL
MAJOR
MINOR
USER
COMPACT
microsystems

Maintain ‐ Infrastructure Knowledge
46
Plan Build Operate Risk Dispose
Project and tasks Operations And Risk ControlEase and speed of creationEase of distributionFlexible to meet task needsLimited training
Ease of use by manyStructured for integration & reportingSupport for multiple processesWide scope – the big picture!
Record planning decisions in the operational systemProduce project docs for/from the operational system

Simplify Infrastructure Data Capture• Data capture focusses on delivering database
load files
• Visualization is either created automatically, or by combining data with existing backdrops - floor plans
• No need to check across multiple diagrams / documents for consistency and format
A faster, less complex and less costly audit, which doesn’t require high skill levels within the audit team as software creates/updates the visualization
Excel
Excel
Excel
Rack
Device
Cable
Excel
Building

Making Trusted Data A Reality
1. Establish policies, standards and ownership of data and diagrams.Make it simpler and easier for engineers and managers
2. Have project / operations use common terms & formatsSupply templates, naming system, labels, etc.
3. Reduce the numbers of documents / files to maintainConsolidate into centralised systems and make them easy to findLink / create / update Visio diagrams, reports, excel from databases
4. Use operational systems to support planning processes

This Workshop Has Shown
• What can be reduced with Visioworkload ‐ skills dependentcost ‐ $26 or $20,000time ‐ 16 minutes or 25 days
• How to improve diagram quality and accuracyAll of which you can do later today ‐ yourself!!

Visio Automation Tips and Techniques
• Lots of productivity features are unknown– Save yourself and others a lot of effort planning and managing infrastructure! – Learn more about Visio
• Linking to existing data sources has many benefits– Less errors, easier to refresh diagrams and update them– Use the data graphics feature to reduce diagram numbers
• For larger environments – Assess the value of database driven systems

Additional Materialswww.microsoft.com
www.assetgen.comEvaluation software Free “DCIM/CMS” evaluation versionWebinars Data center practices, Visio integration
www.squaremilesystems.comFree SMS Visio utilities Downloads and videosTraining/webinars/videos Onsite/remote Visio training, documentation methods, etc.