Embed Size (px)
Citation preview
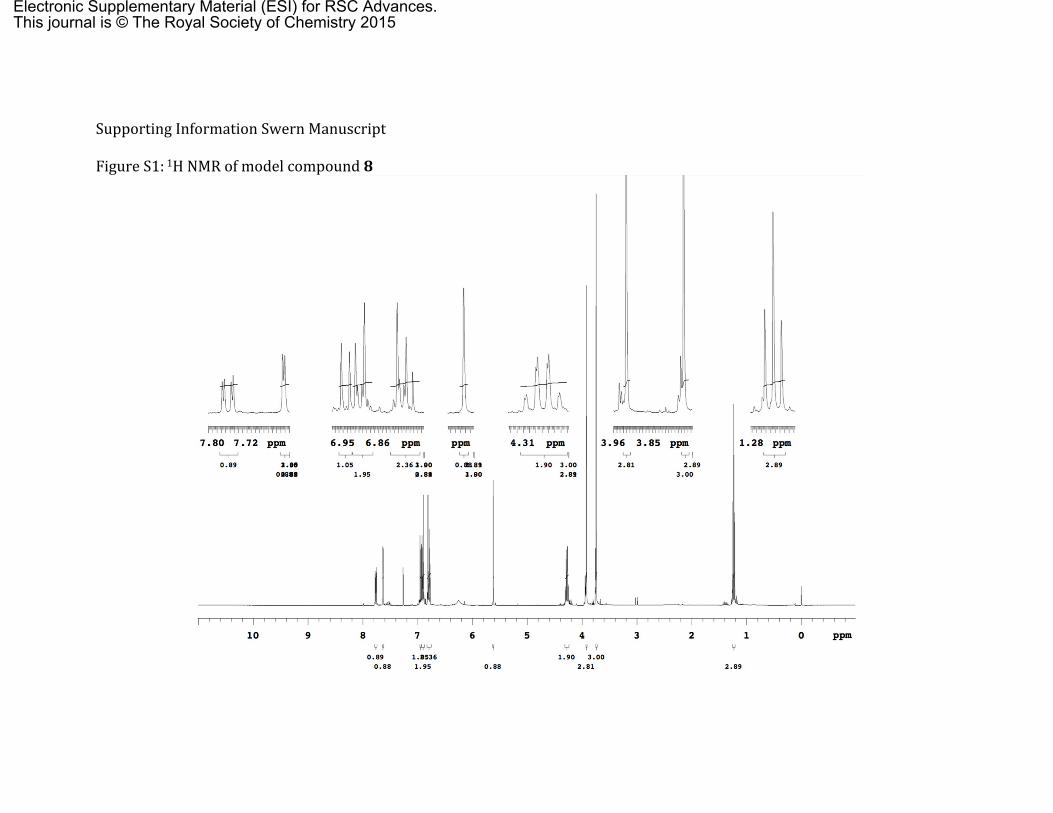
Supporting Information Swern Manuscript
Figure S1: 1H NMR of model compound 8
Electronic Supplementary Material (ESI) for RSC Advances.This journal is © The Royal Society of Chemistry 2015
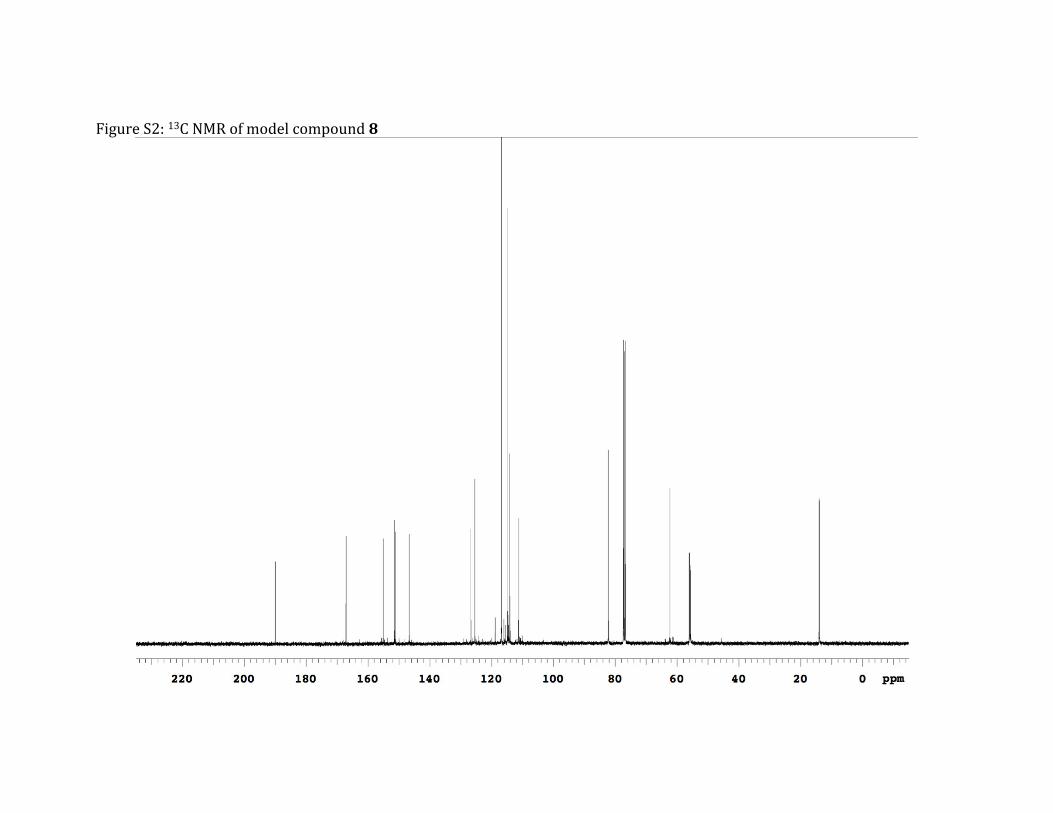
Figure S2: 13C NMR of model compound 8
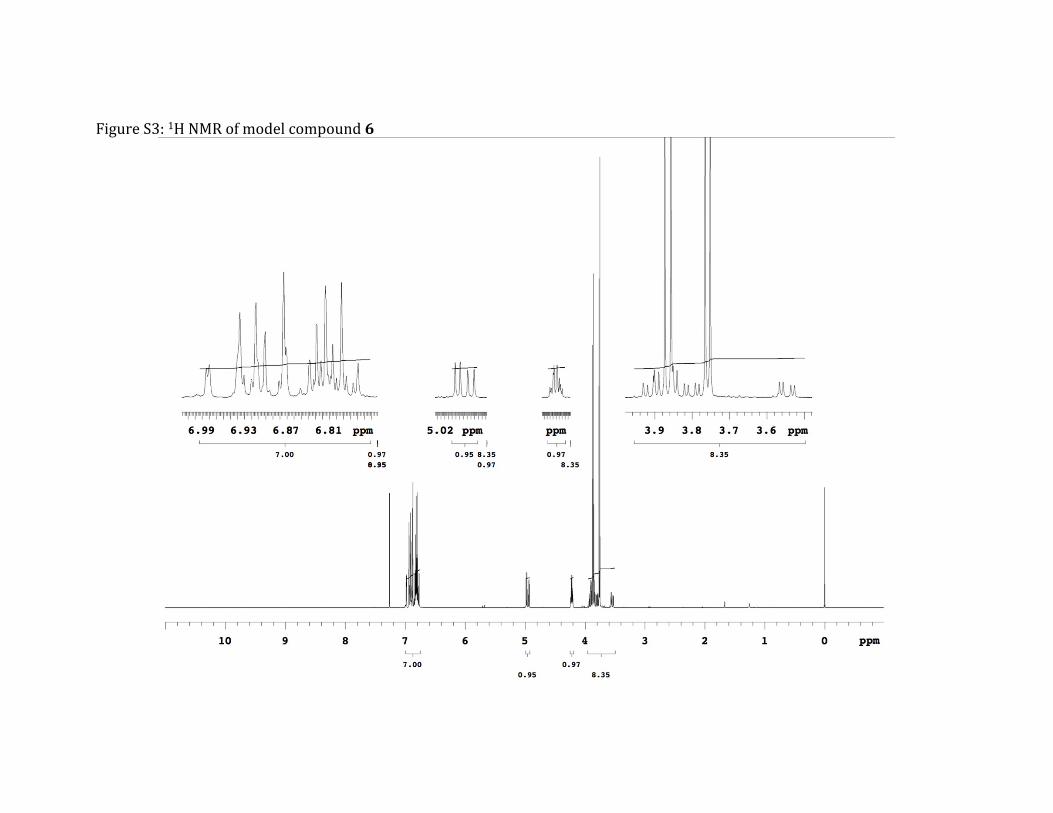
Figure S3: 1H NMR of model compound 6
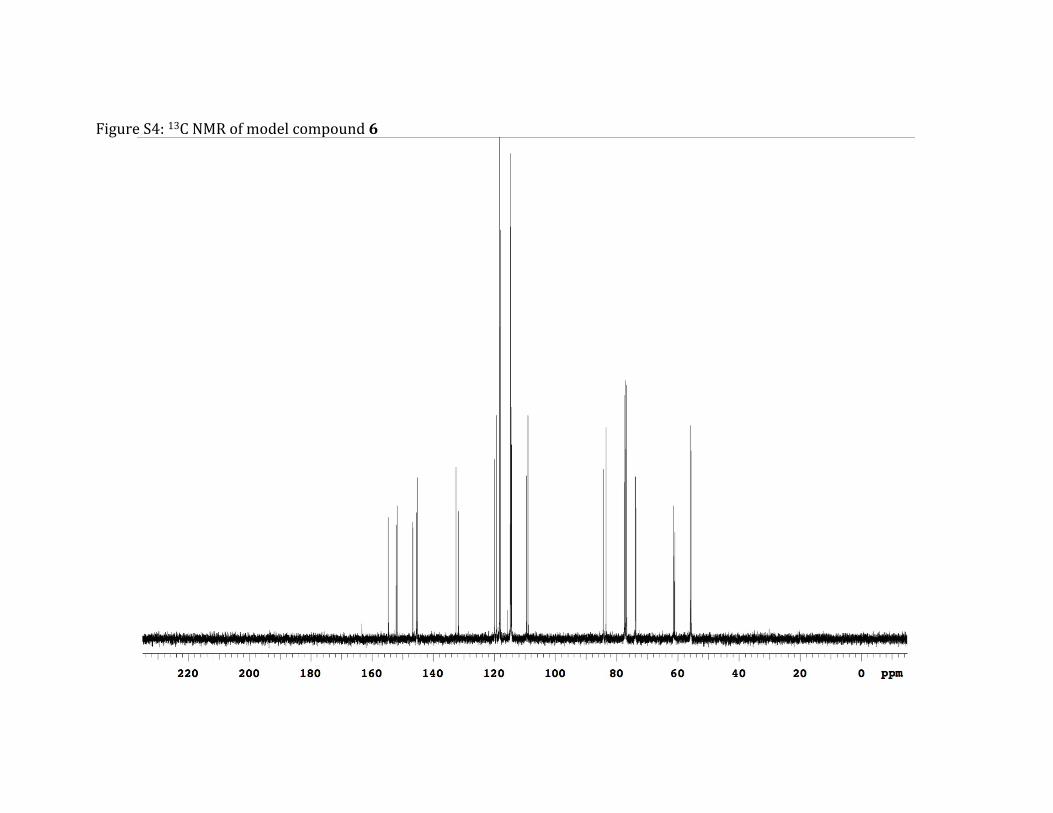
Figure S4: 13C NMR of model compound 6
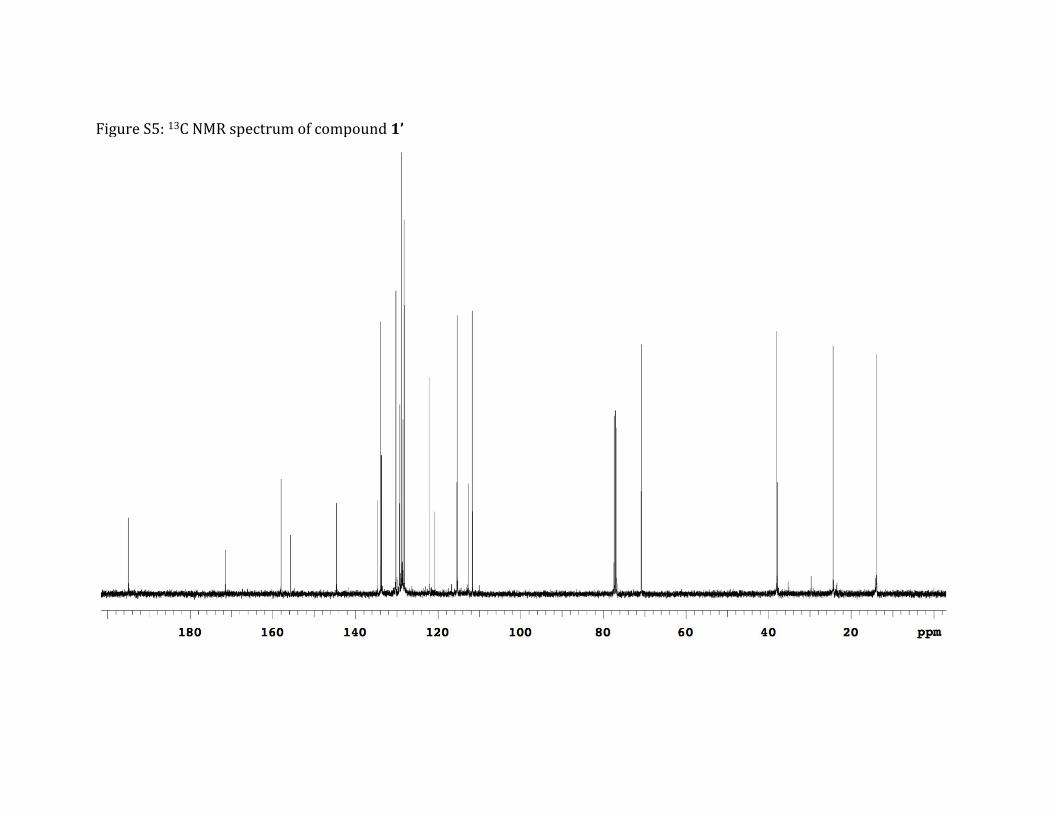
Figure S5: 13C NMR spectrum of compound 1’
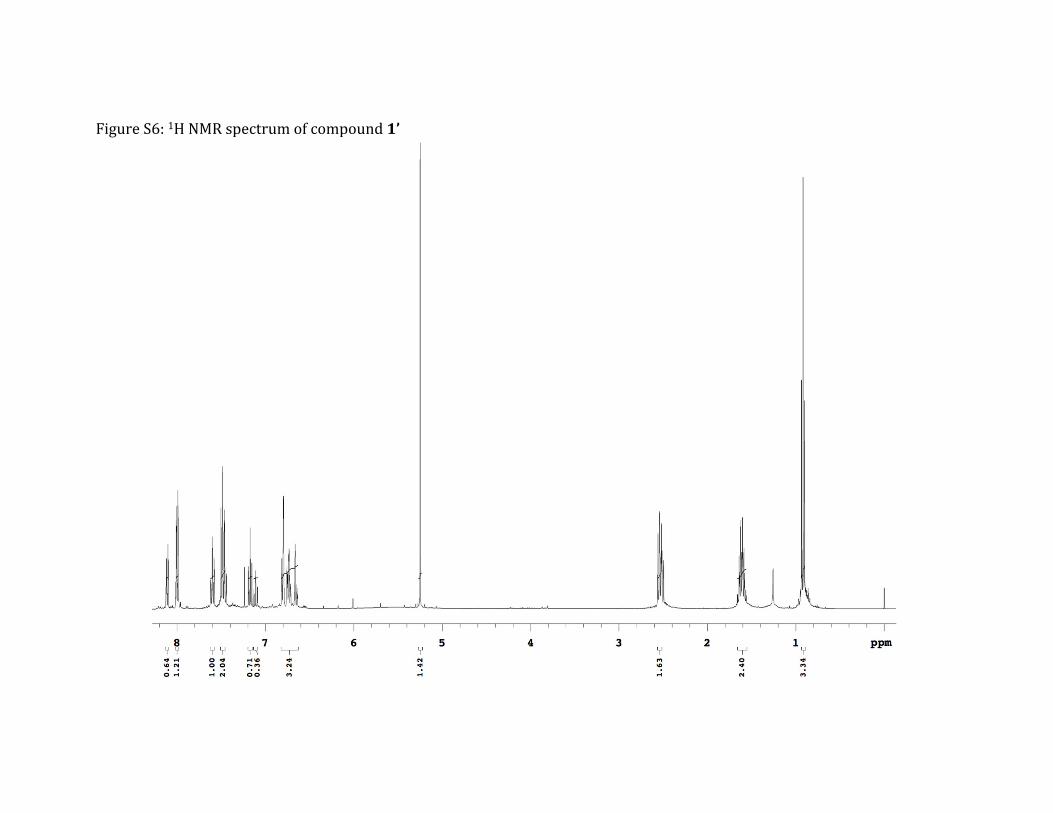
Figure S6: 1H NMR spectrum of compound 1’
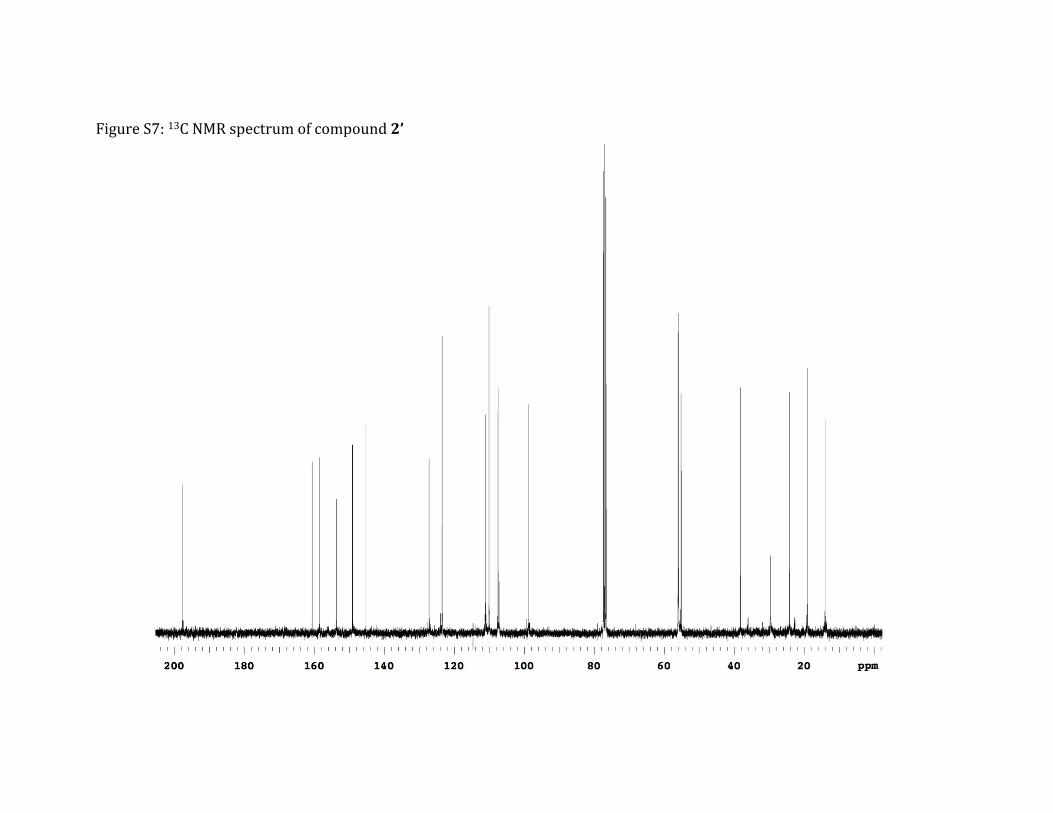
Figure S7: 13C NMR spectrum of compound 2’
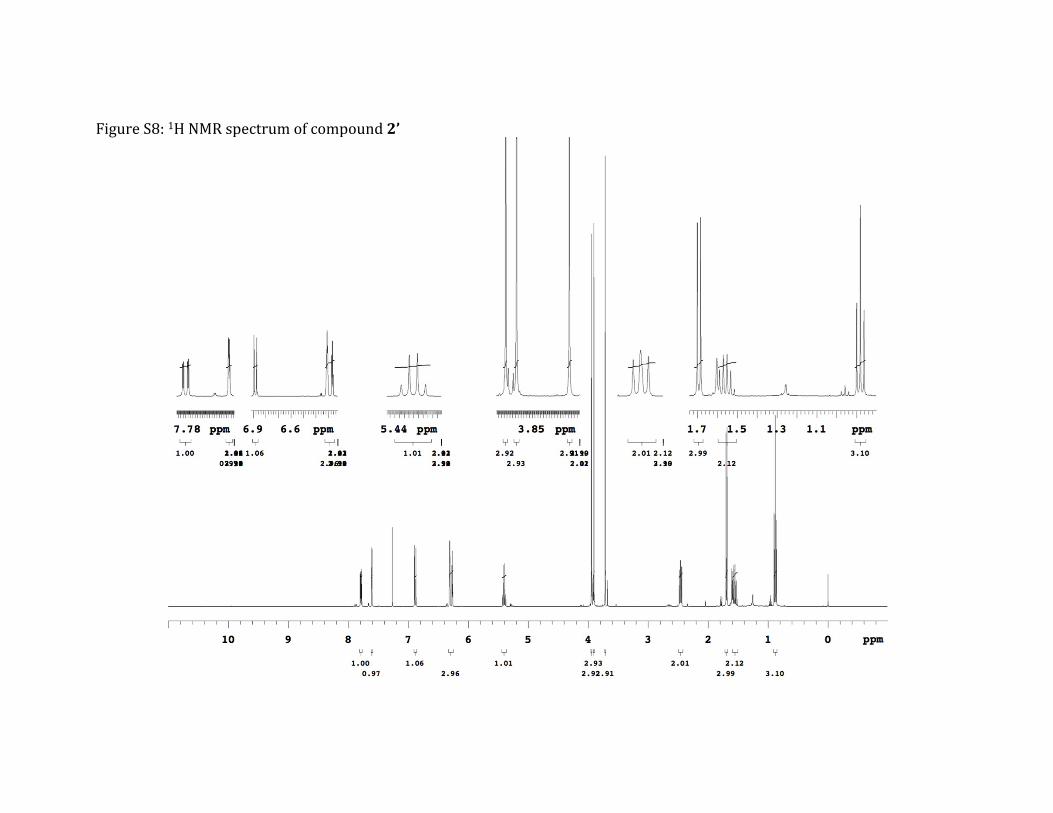
Figure S8: 1H NMR spectrum of compound 2’
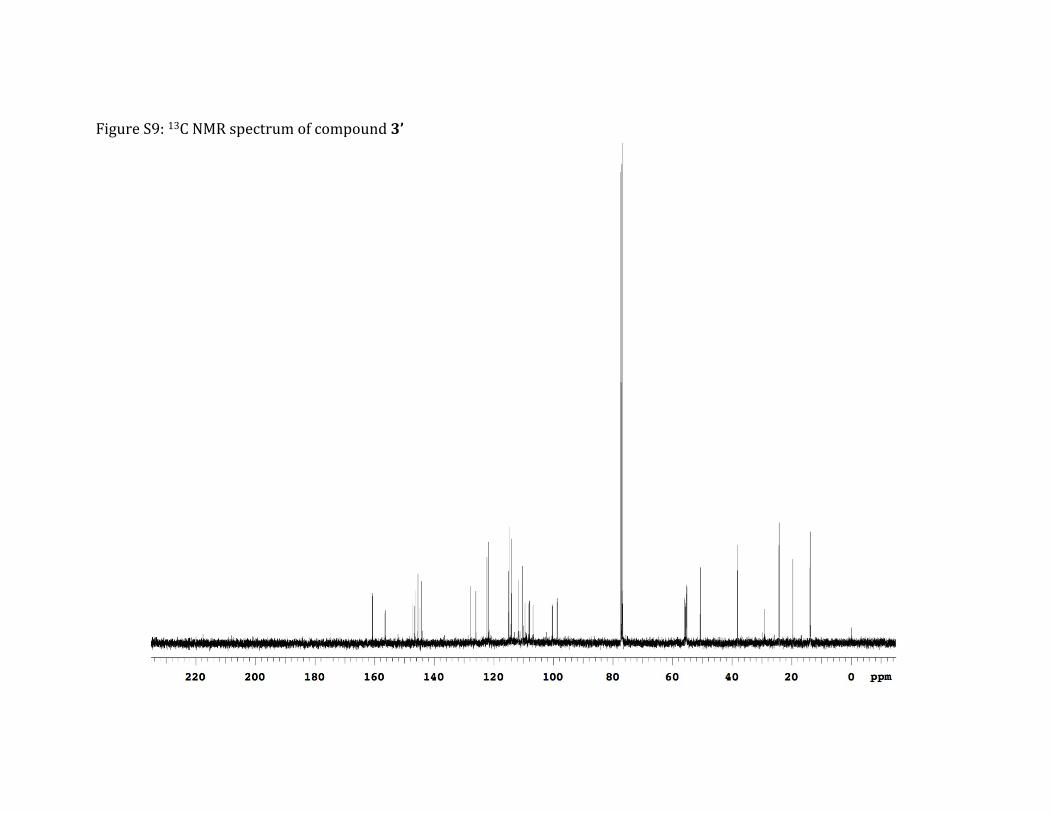
Figure S9: 13C NMR spectrum of compound 3’
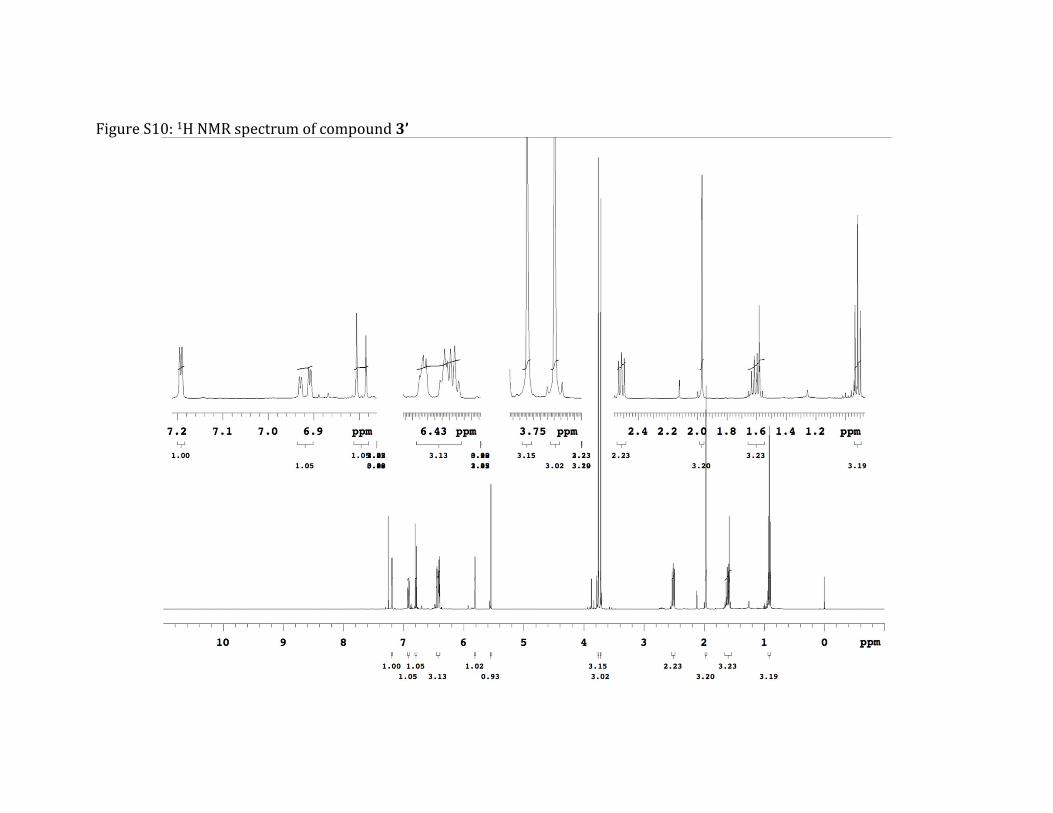
Figure S10: 1H NMR spectrum of compound 3’
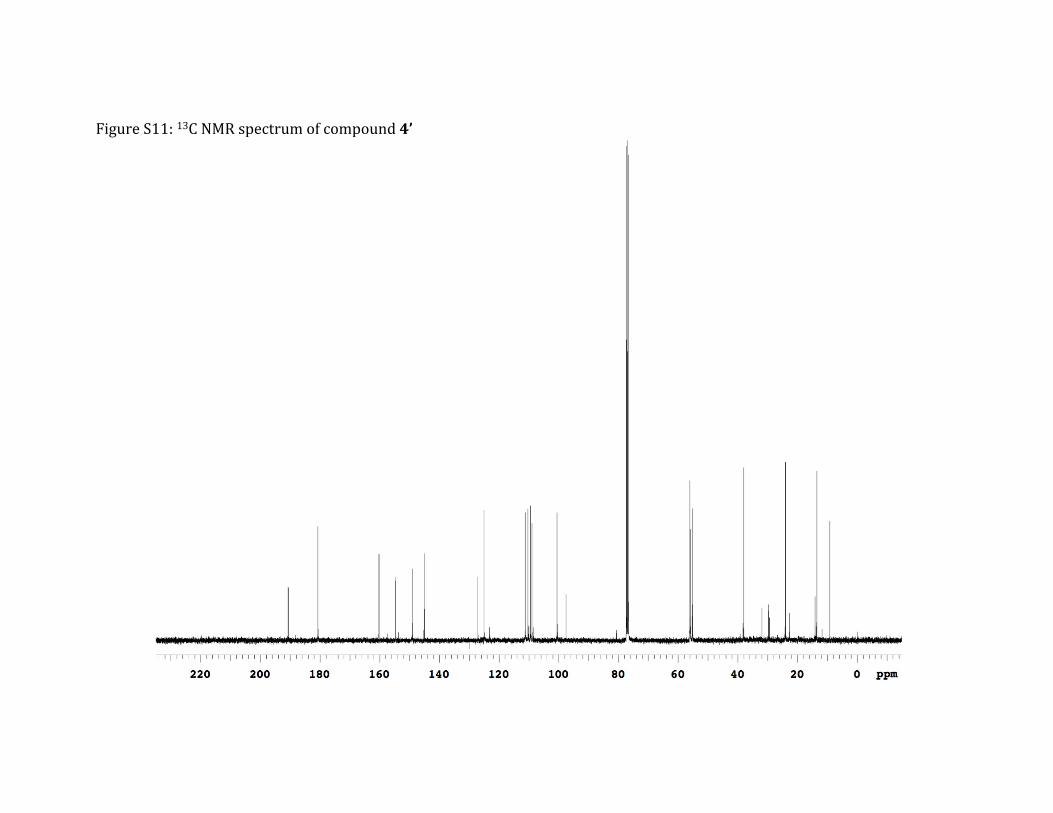
Figure S11: 13C NMR spectrum of compound 4’
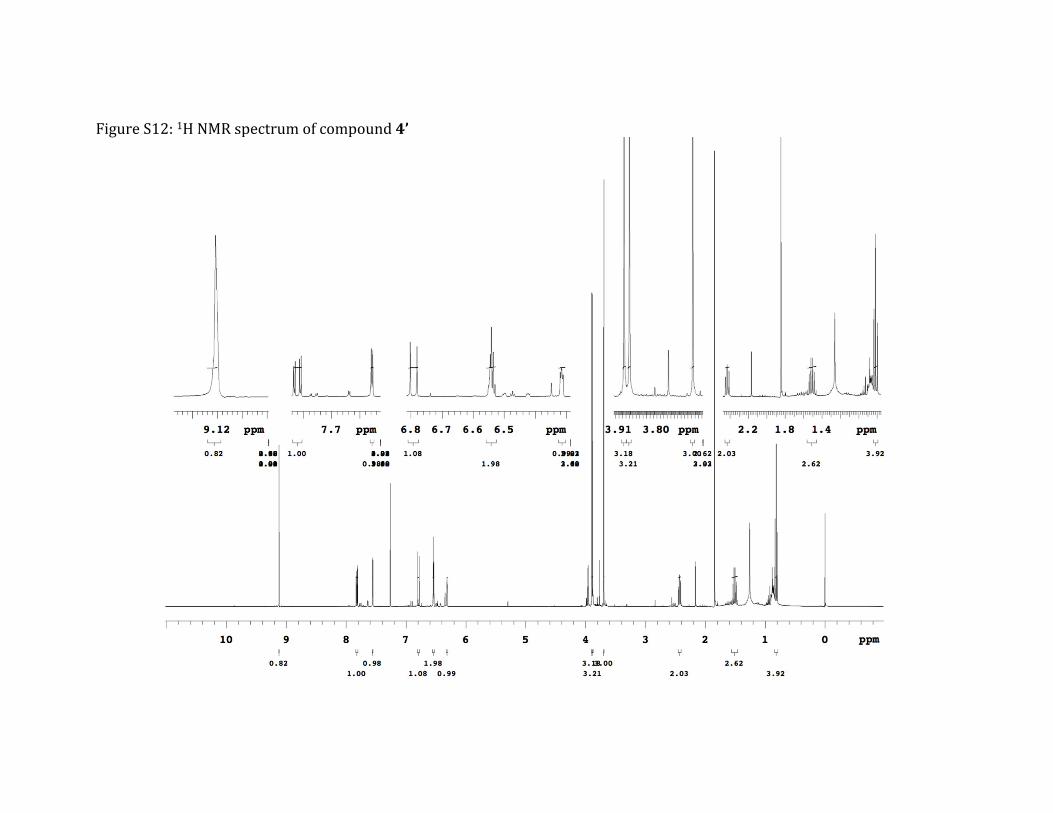
Figure S12: 1H NMR spectrum of compound 4’
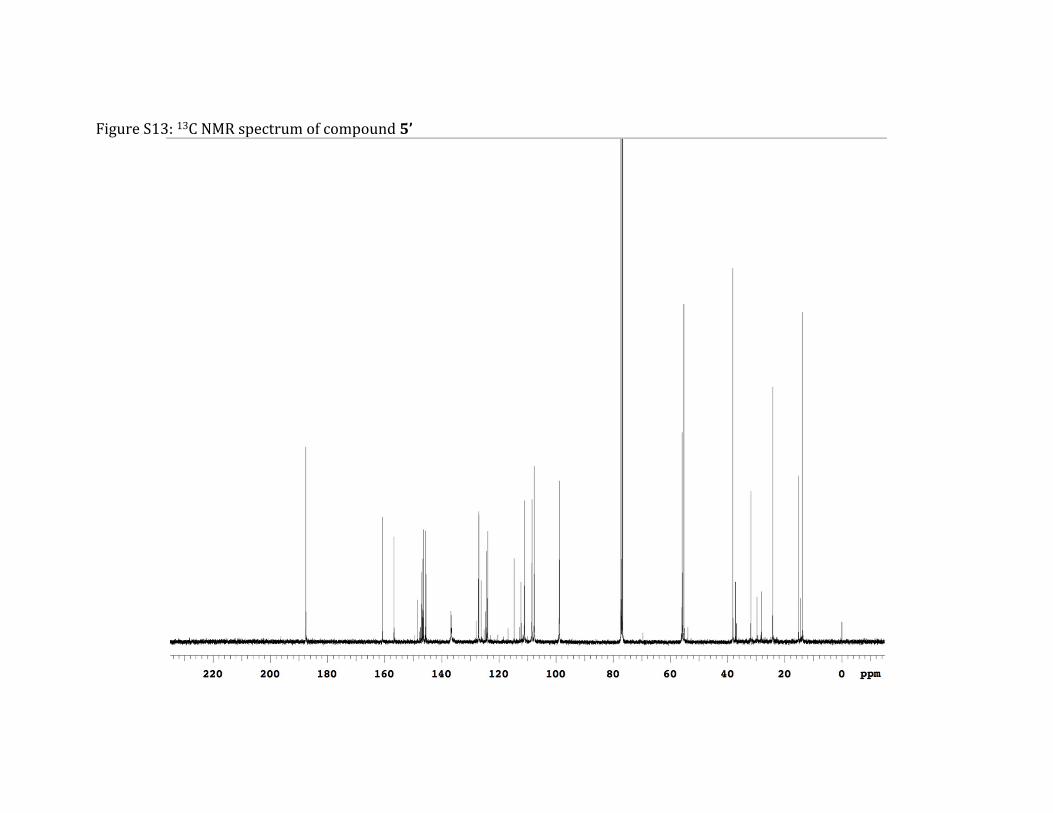
Figure S13: 13C NMR spectrum of compound 5’
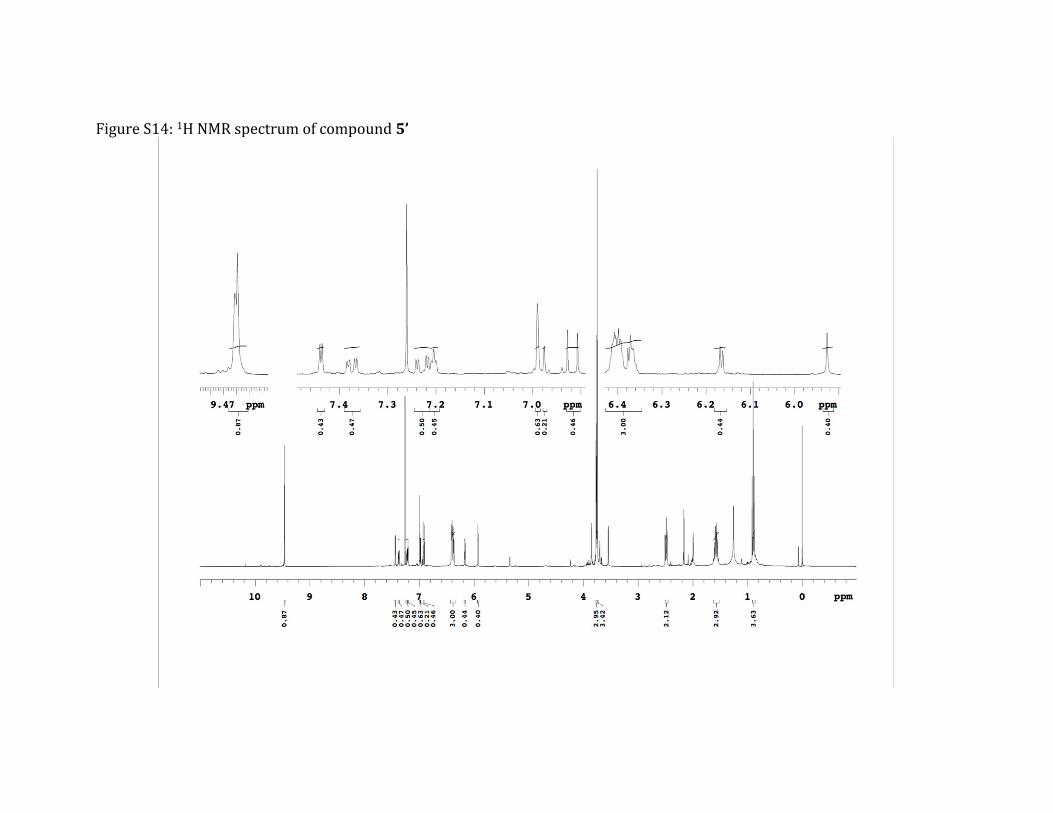
Figure S14: 1H NMR spectrum of compound 5’
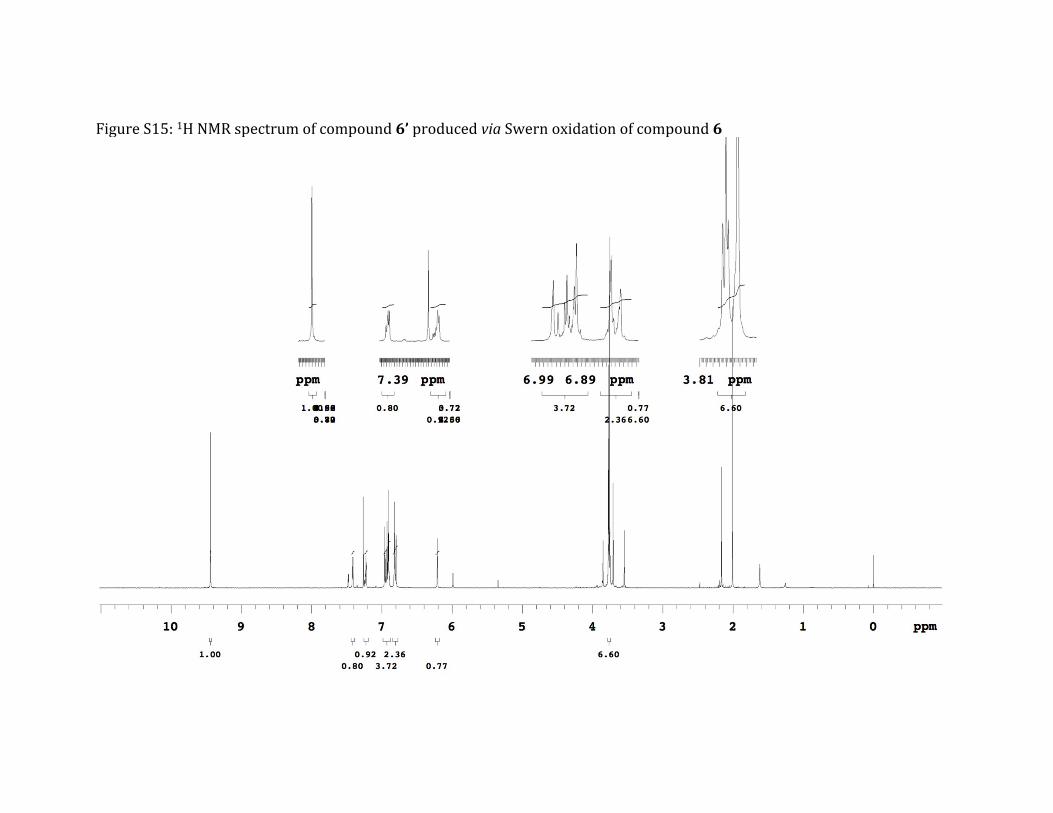
Figure S15: 1H NMR spectrum of compound 6’ produced via Swern oxidation of compound 6
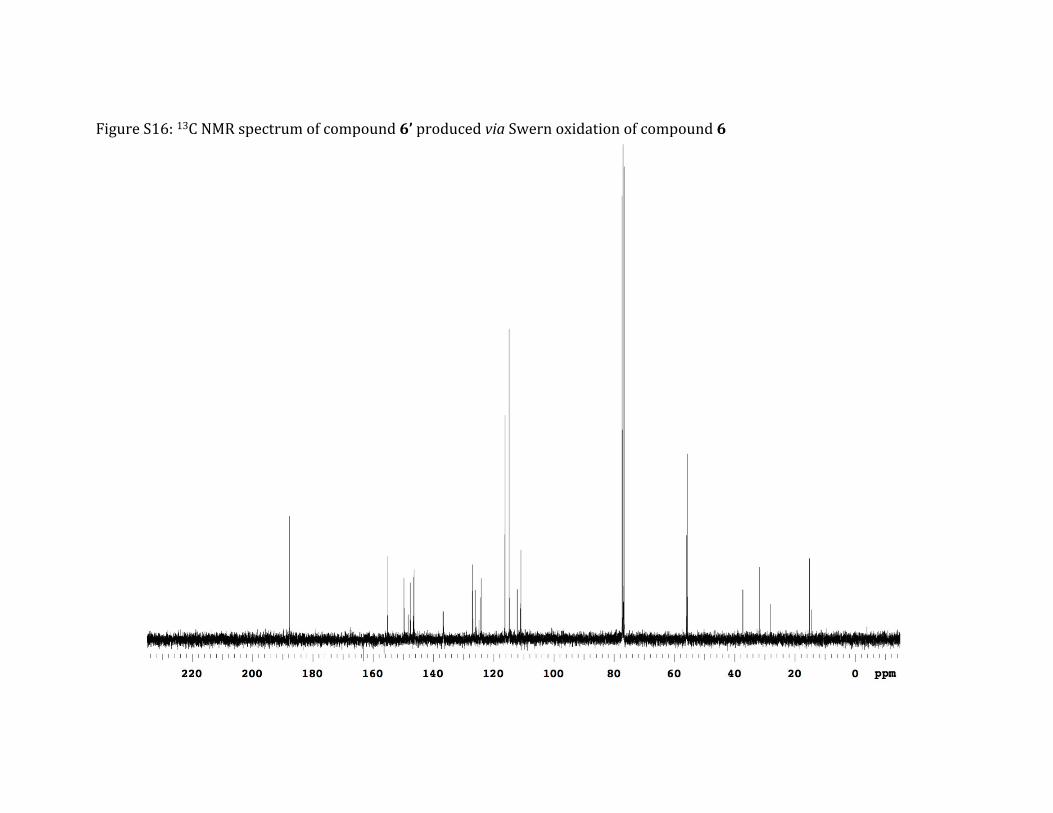
Figure S16: 13C NMR spectrum of compound 6’ produced via Swern oxidation of compound 6
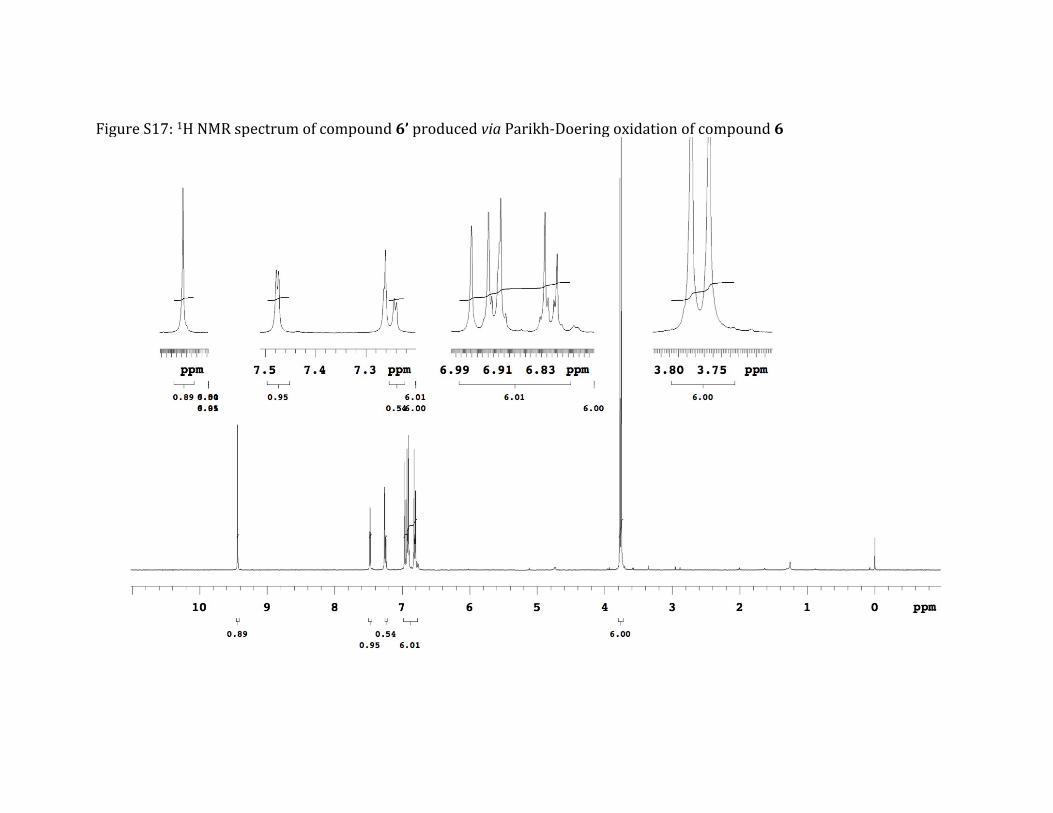
Figure S17: 1H NMR spectrum of compound 6’ produced via Parikh-Doering oxidation of compound 6
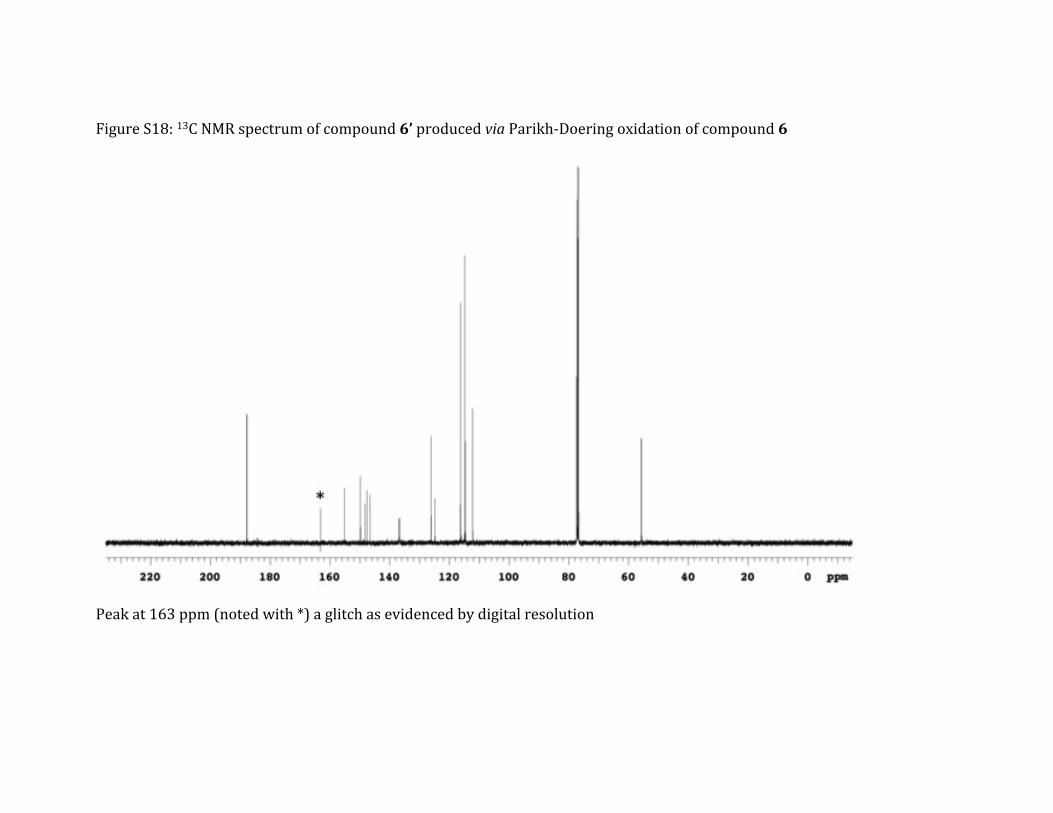
Figure S18: 13C NMR spectrum of compound 6’ produced via Parikh-Doering oxidation of compound 6
Peak at 163 ppm (noted with *) a glitch as evidenced by digital resolution
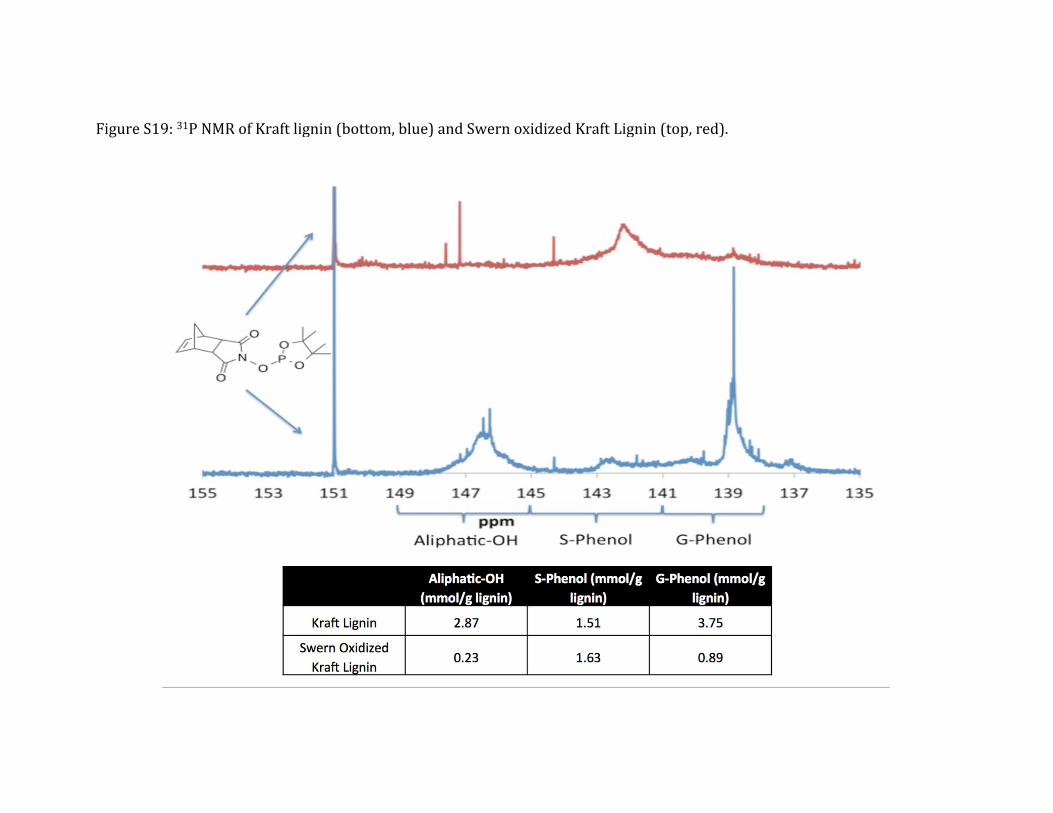
Figure S19: 31P NMR of Kraft lignin (bottom, blue) and Swern oxidized Kraft Lignin (top, red).
31P NMR measurements were performed on a Varian Inova 400 MHz Spectrometer. 2-Chloro-4,4,5,5-tetramethyl-1,3,2-dioxaphospholane was procured from Sigma Aldrich. PW90 and T1 values were measured for each sample prior to analysis. The observation pulse was 90o at 6.8 μs for Kraft lignin and 6.69 μs for Swern oxidized lignin. T1 was calibrated at 3.2 s for Kraft lignin and 4.233 s for Swern oxidized lignin. In all cases the delay was set to 5 times the measured T1 value and 1020 scans were recorded. Samples were prepared in a similar method to Ragauskas1 in which 20 mg of lignin was added to a vial. Then 100 microliters of a 0.1 N solution of N-Hydroxy-5-norbornene-2,3-dicarboxylic acid imide (internal standard), followed by 100 microliters of 0.01 N solution of chromium (III) acetylacetonate, were added. Lastly 50 microliters of phosphitylating reagent and 750 microliters of 1.6/1 v/v mixture of pyridine/CDCl3 were added. The resulting mixture was then capped and heated and sonicated until dissolved. All solutions were made in a 1.6/1 v/v mixture of pyridine/CDCl3. In the case of Swern oxidized lignin dissolution was nearly complete after two days (See Figure S20). Data was baseline corrected with a 4th order polynomial fit using ACD/NMR Processor Academic Edition software.
Figure S20: Dissolution of Swern oxidized Kraft Lignin (Indulin AT Lignin) for 31P NMR analysis.
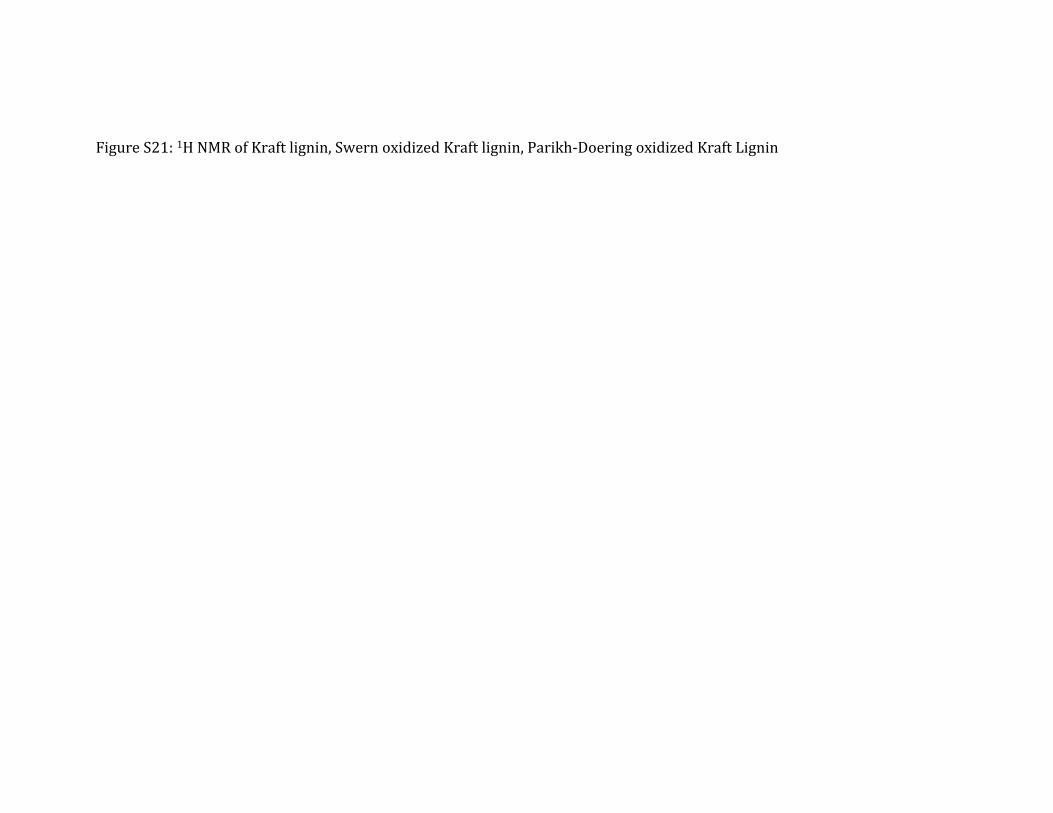
Figure S21: 1H NMR of Kraft lignin, Swern oxidized Kraft lignin, Parikh-Doering oxidized Kraft Lignin
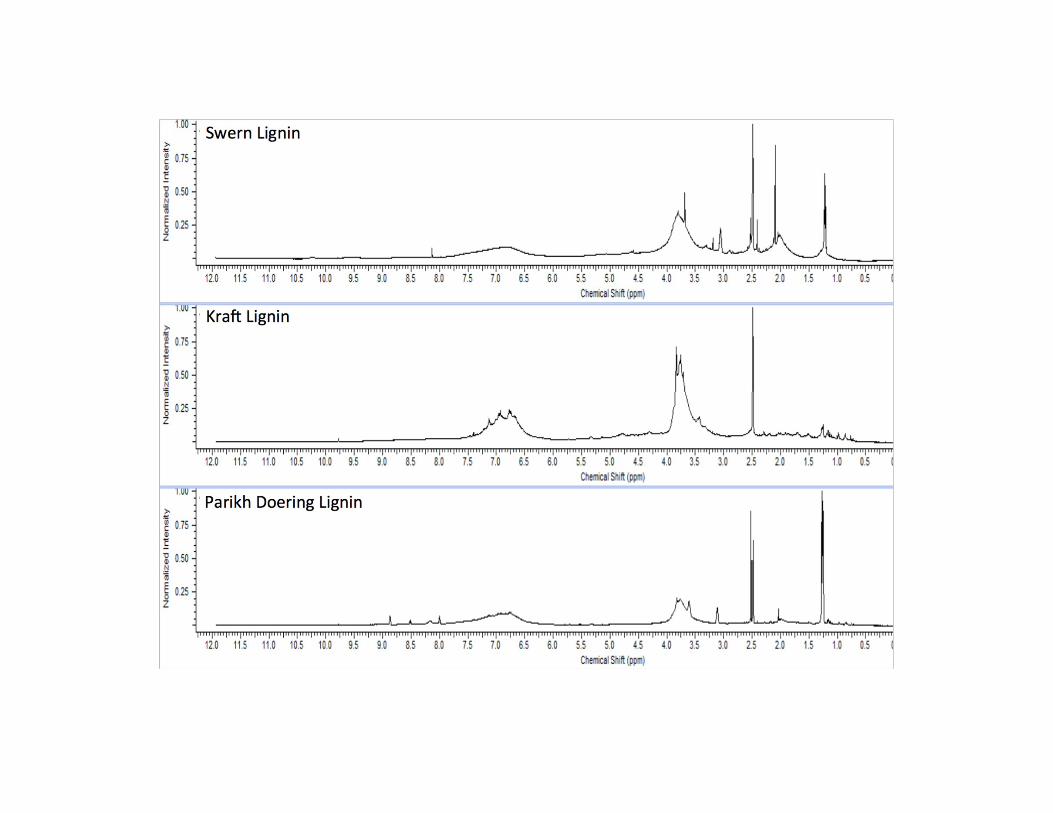
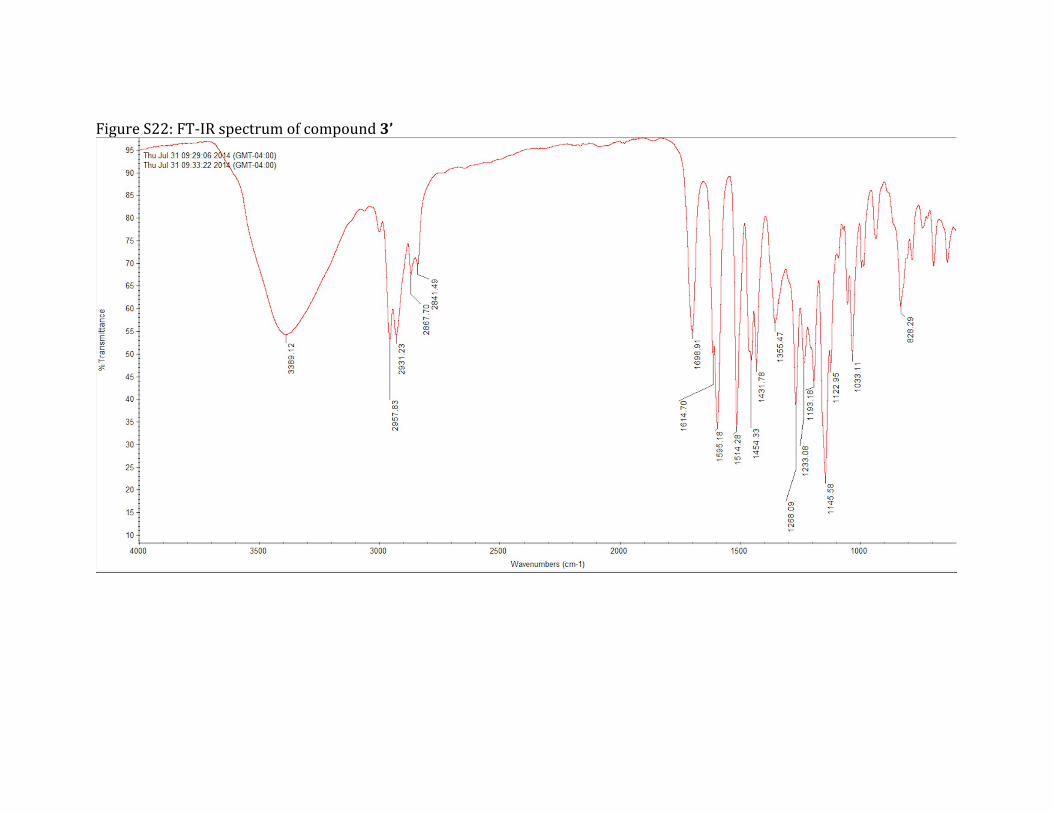
Figure S22: FT-IR spectrum of compound 3’
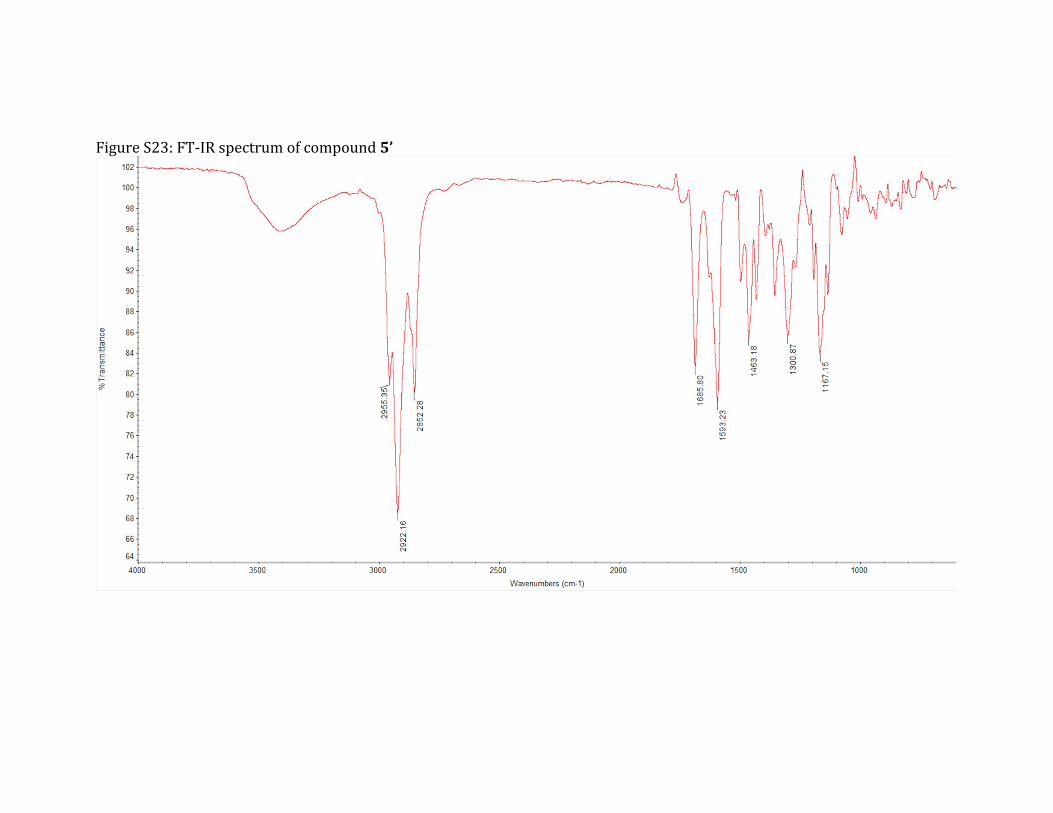
Figure S23: FT-IR spectrum of compound 5’
References:
1. Y. Pu, S. Cao and A. J. Ragauskas, Energy & Environmental Science, 2011, 4, 3154-3166.