Embed Size (px)
Citation preview
Global Journal of Agricultural Research
Vol.1, Issue 3, pp. 27-37, December 2013
Published by European Centre for Research Training and Development UK (www.ea-journals.org)
27
UNDER GROUND WATER QUALITY OF GANGA CANAL IN MEERUT DISTRICT
UTTAR PRADESH, INDIA
P. Kumar, Ashok Kumar, B.P. Dhyani, Pardeep Kumar*, S. Kumar, R. Kumar and Shiv
Kumar**
Department of Soil Science, Sardar Vallabhbhai Patel University of Agriculture and Technology,
Meerut (U.P) India
**KVK, Baghra, Muzaffarnagar
ABSTRACT: The present study is conducted to assess the underground water nearby the
Ganga canal, Meerut, Uttar Pradesh for drinking and irrigation purpose. Water samples were
analyzed for their chemical properties i.e. pH, total salt (electrical conductivity), Anions (Cl-,
CO3-, HCO3
-, SO4
- and NO3
- ) and Cations(Ca
++ and Mg
++, Na
+,K
+), TDS, water quality
indices, toxic element and heavy content of water samples pH varied 7.28 to 8.09 and electrical
conductivity 0.17 and 1.04 dSm-1
, potassium, sodium 9.5 and 2.4 mgL-1
, Ca++
and Mg++
content
ranged from 5.8 to 28.6 meqL-1
, Cl- content varied from 0.16 to 0.53 g L
-1, nitrate ranged 0.10 to
4.47 mgL-1
, sulphate varied from 0.12 to 2.77 mgL-1
. The carbonate and bicarbonate sample
varied from 1.0 to 6.0 and 6.00 to 22.0 meqL-1
. As sample varied 1.08 to 21.29 ppb. The TDS
value 115.0 mgL-1
. The Meerut district is safe for irrigation and drinking purpose on the basis of
most parameters.
KEYWORDS: Water quality assessment, TDS, SAR, RSC and Ganga canal
INTRODUCTION
Water is one of the most abundant components found in nature covering approximately three –
forth of surface of the earth (Beebi et al., 2004). Water is the elixir of life, a precious gift of
nature for mankind and millions of other species living on the earth. It is fast becoming a scare
commodity in most part of the world (Ushrani et. al., 2010). Water is essential requirement of
human and industrial development and also it is one of the most delicate parts of the environment
(Das and Acharya, 2003).
Ground water is the main source of drinking, irrigation and industrial purpose. During last two
decades the indiscriminate disposal of industrial wastes on mother earth slowly makes the
ground water susceptible pollution (Tank and Chandel, 2010). Ground water is an important
water supply source worldwide. It is the major source of water in both urban and rural area in
India. Arsenic, fluoride, and heavy metals occur as major constituents of ground water in all
categories of hydro- geological setting in India. The concentration of these minor constituents
including iron and nitrate is of concern as large amount of ground water is extraction by drilling
water – well both in rural and urban areas for drinking and irrigation purpose. The sixteen state
in India – Andhra Pradesh, Bihar, Delhi, Gujarat, Haryana, Jammu and Kashmir, Karnataka,
Kerala, Madhya Pradesh, Maharastra, Manipur, Orrisa, Punjab, Rajasthan, Tamilnadu, and Uttar
Pradesh have already identified endemic to flourosis. Marippan et al. (2006).
Global Journal of Agricultural Research
Vol.1, Issue 3, pp. 27-37, December 2013
Published by European Centre for Research Training and Development UK (www.ea-journals.org)
28
Groundwater crisis is not the result of natural factors it has been caused by human actions.
During the past two decades, the water level in several parts of the country has been falling
rapidly due to an increase in extraction. The number of wells drilled for irrigation of both food
and cash crops have rapidly and indiscriminately increased. India's rapidly rising population and
changing lifestyles has also increased the domestic need for water. The water requirement for the
industry also shows an overall increase.
Various workers in our country have carried out an extensive work on water quality for various
purposes. Subramani et al., (2005) have studied ground water quality and its suitability for
drinking and agriculture use in Chithar River Basin. Charu et al., (2008) have studied the
drinking water quality status in Bhopal and concluded that the water quality is good and are
within the range of standard value prescribed by various agencies. Raju (2007) has evaluated the
ground water quality in the upper Gunanaeru River basin, Cuddapah District, Andhra Pradesh,
South India.
MATERIALS AND METHODS
The study area falls in Meerut district of Western Uttar Pradesh. Ganga canal was considered as
base line and on the left hand side (LHS) of Ganga canal from Kaili to Jani was taken as the
study area. Each bridge on the canal between these two points (Kaili to Jani) was selected for
sampling location. Samples were taken from the distance of 1000, 2000, 3000, 4000, and 5000
meter away from canal.
Water samples were collected from six locations of Meerut district under different cropping
pattern. The water samples were analyzed by standard methods for pH, electrical conductivity,
Potassium, Sodium and Carbonate and Bicarbonate (Jackson, 1973), Calcium and Magnesium,
Nitrate, Sulphate (Tandon, 1993), Total dissolve salts (TDS), Sodium adsorption ratio (SAR)
and Residual Sodium carbonate (RSC) (Chopra and Kanwar, 1976). The concentration of
Arsenic was determined by atomic absorption spectrophotometer (GBC Avanta PM). All the
analysis of soil samples was carried out in the laboratory of Department of Soil Science,
SVPUA& Tech, Modipurm, Meerut (U.P), India.
RESULTS AND DISCUSSION
Suitability of ground water for domestic (Drinking) purpose
To study the chemical parameters or water quality the samples were collected from six selected
locations of left side of Ganga canal during Nov 2009 to Feb 2010. The chemical parameters for
the selected locations are presented in Table 1 to 18.
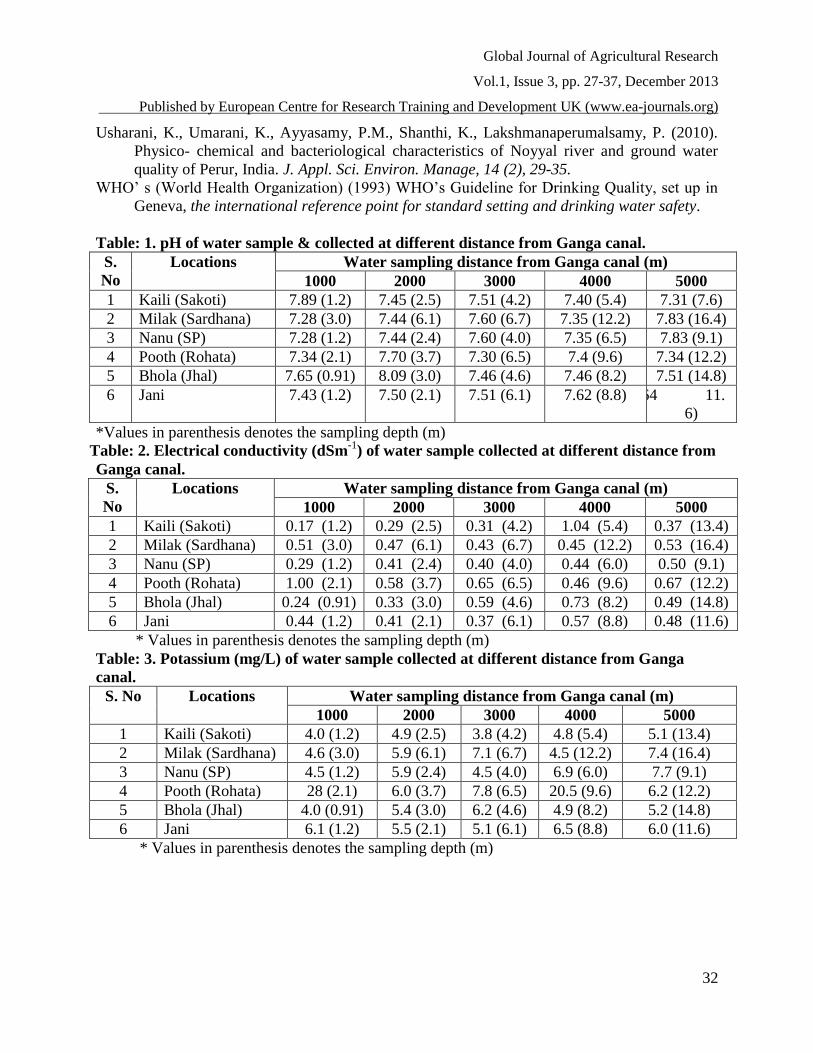
pH
The pH value of ground water ranged from 7.28 to 8.09 (Table-1). This shows that the ground
water of the study area is mainly alkaline in nature and on the basis of observed value all the
samples were within the permissible limit as prescribed by WHO.
Global Journal of Agricultural Research
Vol.1, Issue 3, pp. 27-37, December 2013
Published by European Centre for Research Training and Development UK (www.ea-journals.org)
29
Electrical conductivity
Electrical conductivity is useful tool to evaluate the purity of water. The minimum and maximum
electrical conductivity of water 0.17 and 1.04 dSm-1
and 1.2 to 5.4 m depth of water table were
recorded in Kaili Sakoti respectively (Table-2). The primary effect of high EC water on crop
productivity in the inability of the plant to compete with ion in solution for water on crop
productivity. The higher the EC, the less water is available to plants, even though the soil may be
appearing wet. Because plants can only transpire “pure water” usable plant water in the soil
solution decreases dramatically as EC increase suggested by Joshi et al., 2009.
Potassium
In the present study most of the water samples were found safe for drinking purpose as the
observed value of potassium lower than the permissible limit of 9.5 mgL-1
as prescribed by BIS.
Only two water sample collected from Pooth Rohata were unsuitable since their K content was
28 and 20.5 mgL-1
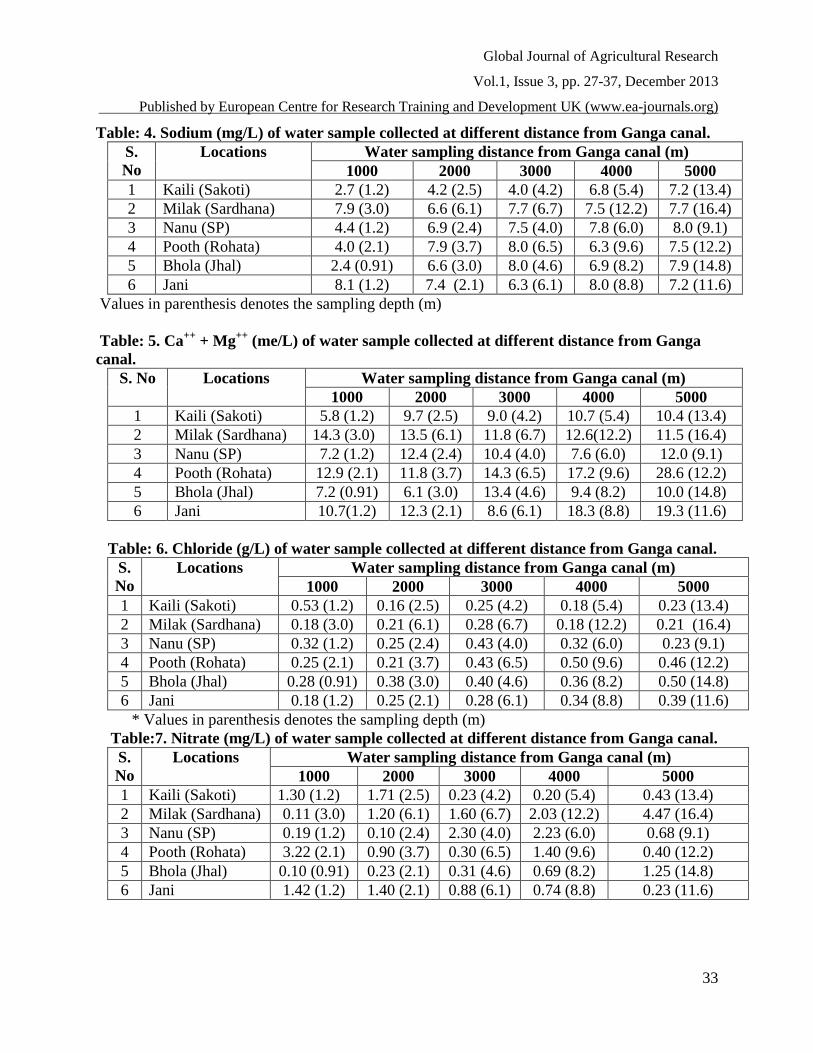
Sodium
Sodium content of the water samples ranged from 2.4 mgL-1
(Bhola Jhal) to 8.1 mgL-1
for (Jani)
location. All the water samples showed lower than the Na permissible limit (50ppm) in drinking
water prescribed by BIS (1983).
Calcium and Magnesium hardness
Ca++
and Mg++
are responsible for hardness occurring in natural waters. Hardness of the water is
objectionable from the view point of water use. The Ca++
and Mg++
value of the water samples
ranged from 5.8 to 28.6 meqL-1
at different depths of water samples. The lowest value of 5.8
meqL-1
was recorded in Kaili Sakoti where as the highest value of 28.6 meqL-1
from Pooth
Rohata.
Chloride
Chloride content of water samples in the present study ranged from 0.16 to 0.53 g L-1
Table-.
The maximum chloride 0.53 g L-1
was found in Kaili Sakoti location at 7.3 m depth while
minimum 0.16 g L-1
in same location at 2000 m depth. 1.0% samples exceeded the desirable limit
(500mg L-1
) as per WHO norms.
Nitrate
The nitrate concentration of ground water samples ranged from 0.10 to 4.47 mgL-1
(Table-7).
The lowest value of 0.10 mgL-1
was observed in the water sample collected from (Bhola Jhal)
and Nanu (SP) where as highest value of 4.47 mgL-1
was observed in Milak Sardhana. All the
samples were found within desirable limit of 45 mgL-1
as per WHO norms. The highest
concentration of nitrate in drinking water is toxic and causes methaemoglobinamia (Blue baby
disease) in Children and Gestic carcinomas (Comly 1945).
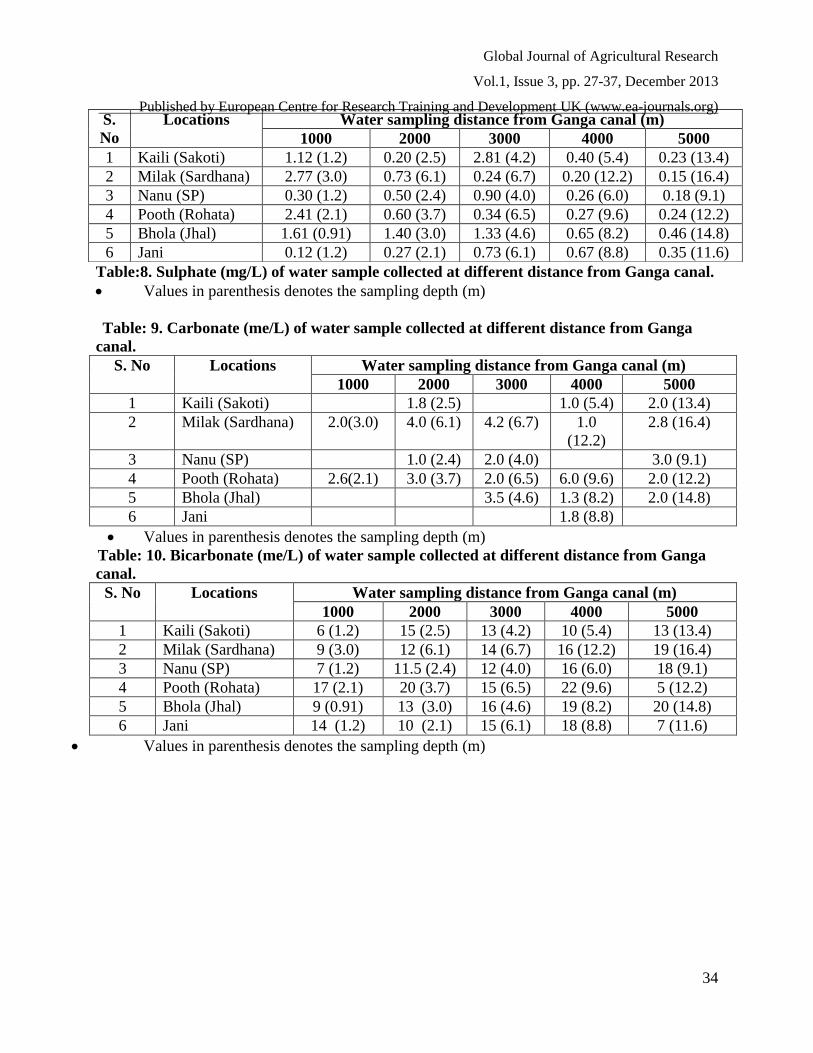
Sulphate
Sulphate extract of collected water samples varied from 0.12 to 2.77 mgL-1
(Table-8). All the
samples were in desirable limit of 500 mgL-1
as per WHO standard.
Global Journal of Agricultural Research
Vol.1, Issue 3, pp. 27-37, December 2013
Published by European Centre for Research Training and Development UK (www.ea-journals.org)
30
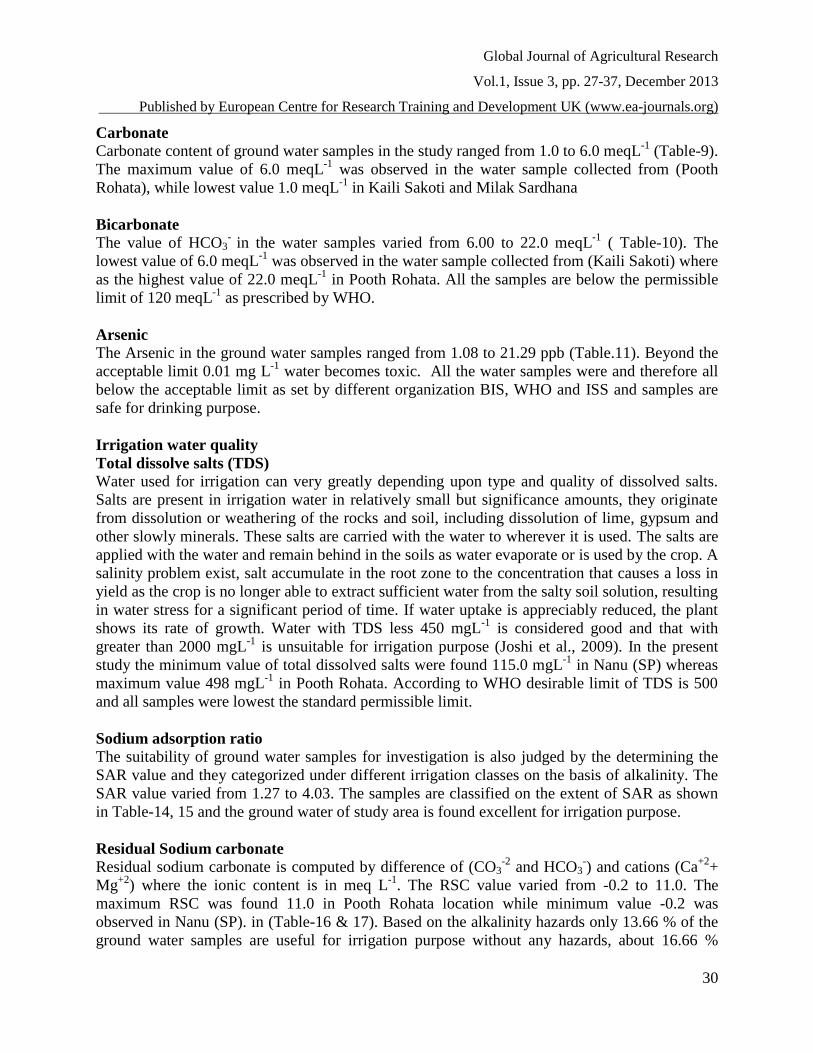
Carbonate
Carbonate content of ground water samples in the study ranged from 1.0 to 6.0 meqL-1
(Table-9).
The maximum value of 6.0 meqL-1
was observed in the water sample collected from (Pooth
Rohata), while lowest value 1.0 meqL-1
in Kaili Sakoti and Milak Sardhana
Bicarbonate
The value of HCO3-
in the water samples varied from 6.00 to 22.0 meqL-1
( Table-10). The
lowest value of 6.0 meqL-1
was observed in the water sample collected from (Kaili Sakoti) where
as the highest value of 22.0 meqL-1
in Pooth Rohata. All the samples are below the permissible
limit of 120 meqL-1
as prescribed by WHO.
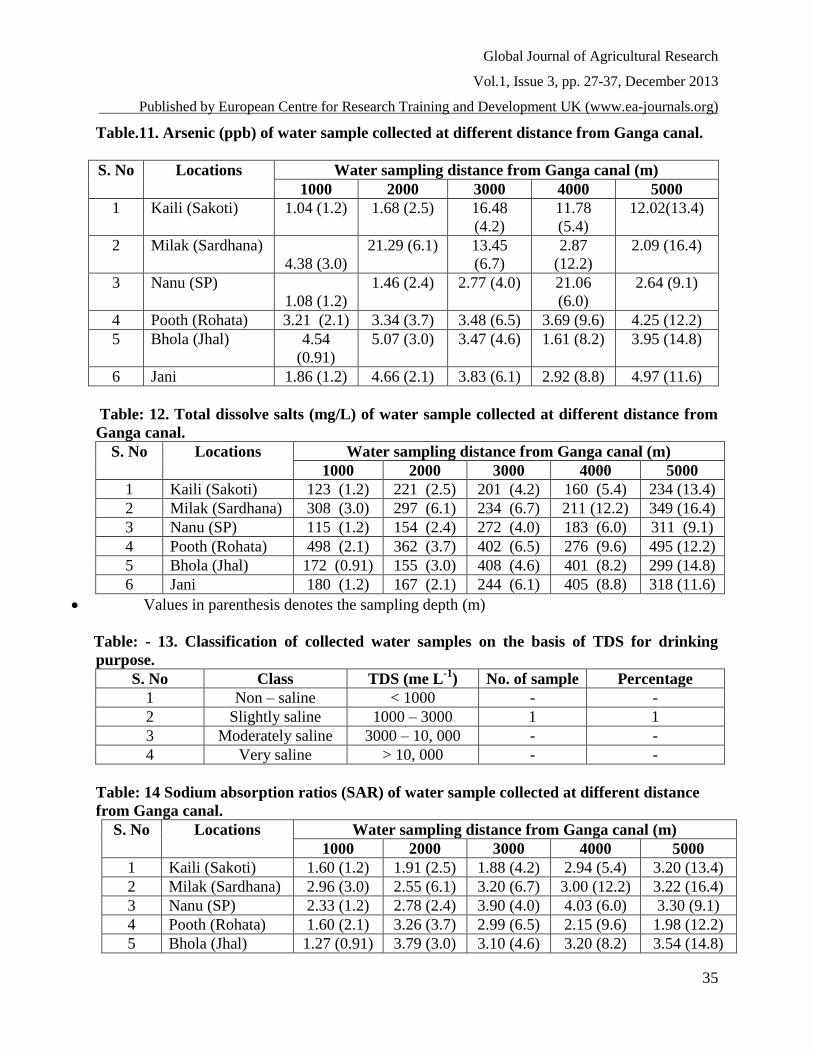
Arsenic
The Arsenic in the ground water samples ranged from 1.08 to 21.29 ppb (Table.11). Beyond the
acceptable limit 0.01 mg L-1
water becomes toxic. All the water samples were and therefore all
below the acceptable limit as set by different organization BIS, WHO and ISS and samples are
safe for drinking purpose.
Irrigation water quality
Total dissolve salts (TDS)
Water used for irrigation can very greatly depending upon type and quality of dissolved salts.
Salts are present in irrigation water in relatively small but significance amounts, they originate
from dissolution or weathering of the rocks and soil, including dissolution of lime, gypsum and
other slowly minerals. These salts are carried with the water to wherever it is used. The salts are
applied with the water and remain behind in the soils as water evaporate or is used by the crop. A
salinity problem exist, salt accumulate in the root zone to the concentration that causes a loss in
yield as the crop is no longer able to extract sufficient water from the salty soil solution, resulting
in water stress for a significant period of time. If water uptake is appreciably reduced, the plant
shows its rate of growth. Water with TDS less 450 mgL-1
is considered good and that with
greater than 2000 mgL-1
is unsuitable for irrigation purpose (Joshi et al., 2009). In the present
study the minimum value of total dissolved salts were found 115.0 mgL-1
in Nanu (SP) whereas
maximum value 498 mgL-1
in Pooth Rohata. According to WHO desirable limit of TDS is 500
and all samples were lowest the standard permissible limit.
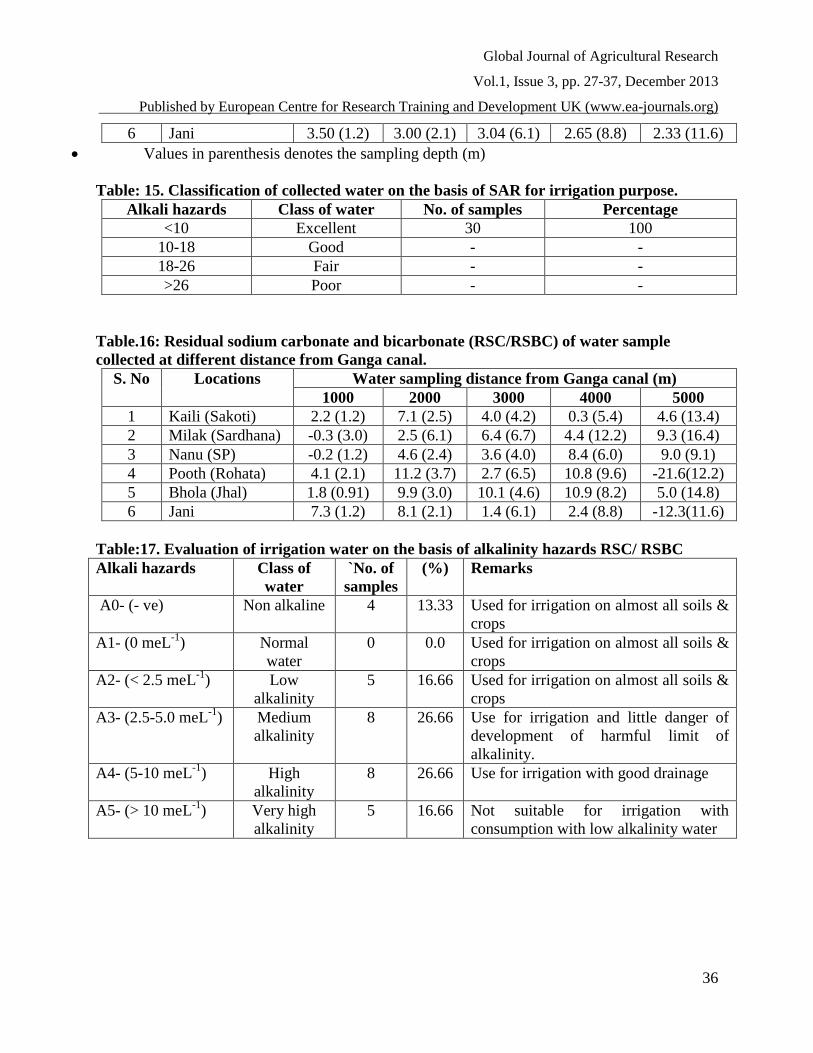
Sodium adsorption ratio
The suitability of ground water samples for investigation is also judged by the determining the
SAR value and they categorized under different irrigation classes on the basis of alkalinity. The
SAR value varied from 1.27 to 4.03. The samples are classified on the extent of SAR as shown
in Table-14, 15 and the ground water of study area is found excellent for irrigation purpose.
Residual Sodium carbonate
Residual sodium carbonate is computed by difference of (CO3-2
and HCO3-) and cations (Ca
+2+
Mg+2
) where the ionic content is in meq L-1
. The RSC value varied from -0.2 to 11.0. The
maximum RSC was found 11.0 in Pooth Rohata location while minimum value -0.2 was
observed in Nanu (SP). in (Table-16 & 17). Based on the alkalinity hazards only 13.66 % of the
ground water samples are useful for irrigation purpose without any hazards, about 16.66 %
Global Journal of Agricultural Research
Vol.1, Issue 3, pp. 27-37, December 2013
Published by European Centre for Research Training and Development UK (www.ea-journals.org)
31
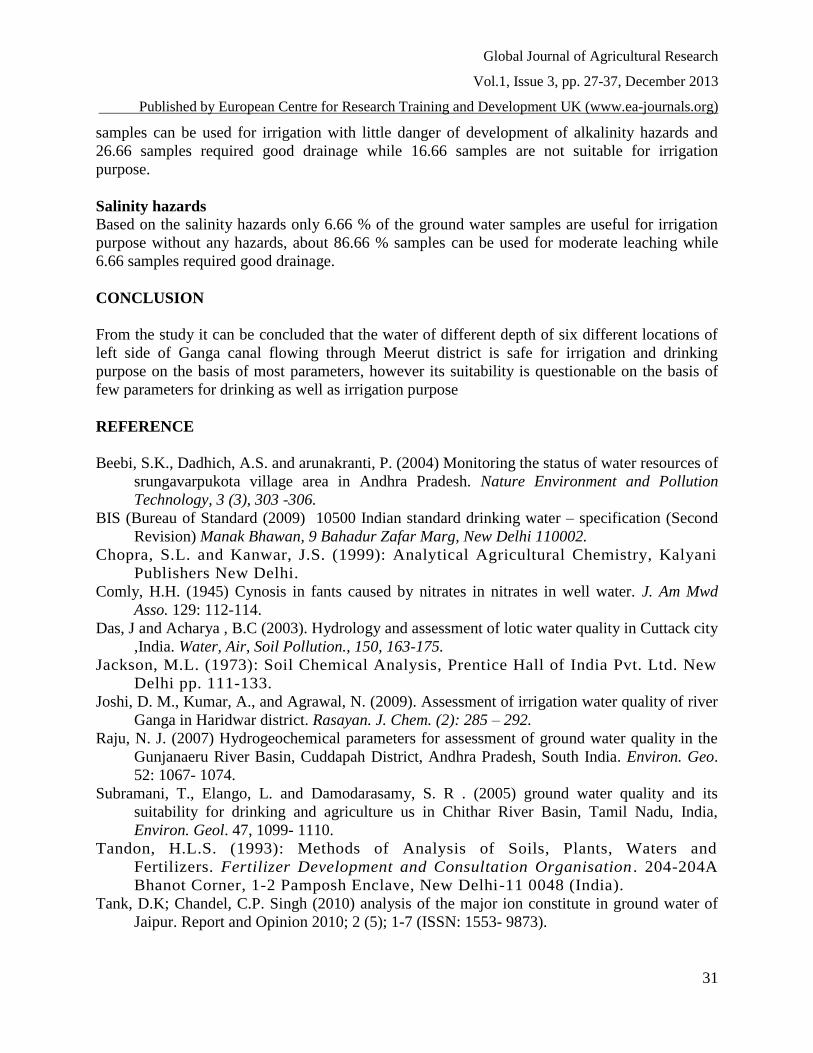
samples can be used for irrigation with little danger of development of alkalinity hazards and
26.66 samples required good drainage while 16.66 samples are not suitable for irrigation
purpose.
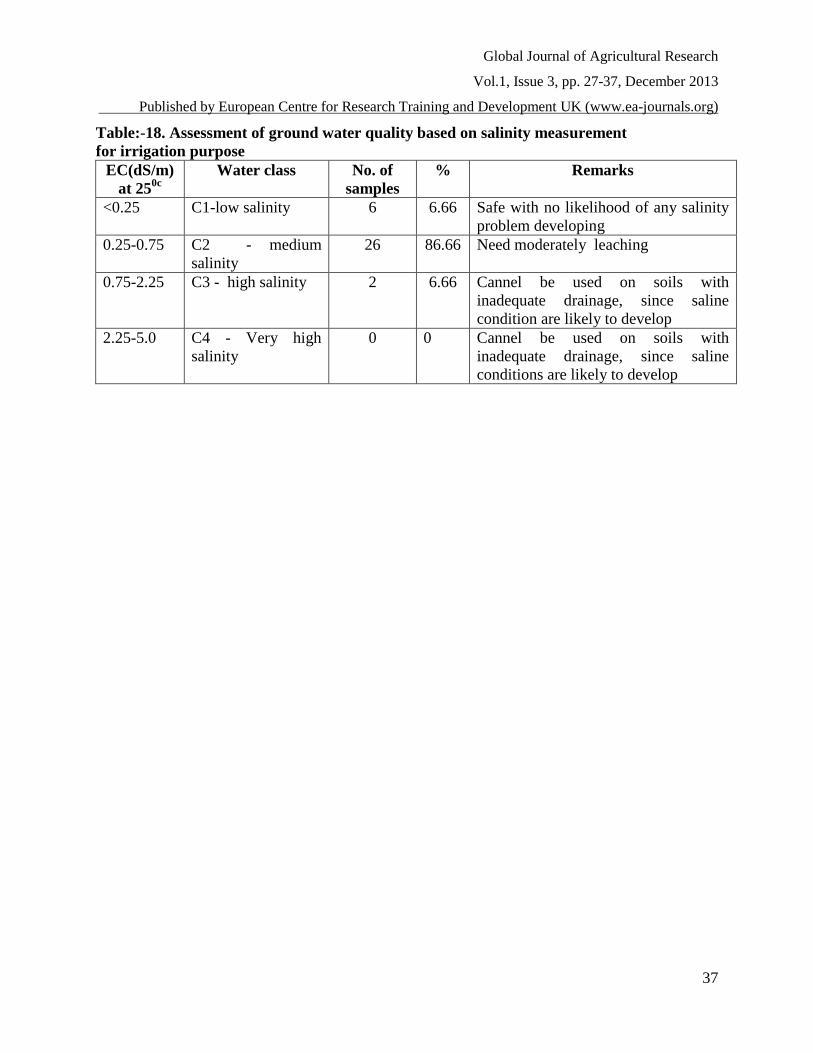
Salinity hazards
Based on the salinity hazards only 6.66 % of the ground water samples are useful for irrigation
purpose without any hazards, about 86.66 % samples can be used for moderate leaching while
6.66 samples required good drainage.
CONCLUSION
From the study it can be concluded that the water of different depth of six different locations of
left side of Ganga canal flowing through Meerut district is safe for irrigation and drinking
purpose on the basis of most parameters, however its suitability is questionable on the basis of
few parameters for drinking as well as irrigation purpose
REFERENCE
Beebi, S.K., Dadhich, A.S. and arunakranti, P. (2004) Monitoring the status of water resources of
srungavarpukota village area in Andhra Pradesh. Nature Environment and Pollution
Technology, 3 (3), 303 -306.
BIS (Bureau of Standard (2009) 10500 Indian standard drinking water – specification (Second
Revision) Manak Bhawan, 9 Bahadur Zafar Marg, New Delhi 110002.
Chopra, S.L. and Kanwar, J.S. (1999): Analytical Agricultural Chemistry, Kalyani
Publishers New Delhi.
Comly, H.H. (1945) Cynosis in fants caused by nitrates in nitrates in well water. J. Am Mwd
Asso. 129: 112-114.
Das, J and Acharya , B.C (2003). Hydrology and assessment of lotic water quality in Cuttack city
,India. Water, Air, Soil Pollution., 150, 163-175.
Jackson, M.L. (1973): Soil Chemical Analysis, Prentice Hall of India Pvt. Ltd. New
Delhi pp. 111-133.
Joshi, D. M., Kumar, A., and Agrawal, N. (2009). Assessment of irrigation water quality of river
Ganga in Haridwar district. Rasayan. J. Chem. (2): 285 – 292.
Raju, N. J. (2007) Hydrogeochemical parameters for assessment of ground water quality in the
Gunjanaeru River Basin, Cuddapah District, Andhra Pradesh, South India. Environ. Geo.
52: 1067- 1074.
Subramani, T., Elango, L. and Damodarasamy, S. R . (2005) ground water quality and its
suitability for drinking and agriculture us in Chithar River Basin, Tamil Nadu, India,
Environ. Geol. 47, 1099- 1110.
Tandon, H.L.S. (1993): Methods of Analysis of Soils, Plants, Waters and
Fertilizers. Fertilizer Development and Consultation Organisation . 204-204A
Bhanot Corner, 1-2 Pamposh Enclave, New Delhi-11 0048 (India).
Tank, D.K; Chandel, C.P. Singh (2010) analysis of the major ion constitute in ground water of
Jaipur. Report and Opinion 2010; 2 (5); 1-7 (ISSN: 1553- 9873).
Global Journal of Agricultural Research
Vol.1, Issue 3, pp. 27-37, December 2013
Published by European Centre for Research Training and Development UK (www.ea-journals.org)
32
Usharani, K., Umarani, K., Ayyasamy, P.M., Shanthi, K., Lakshmanaperumalsamy, P. (2010).
Physico- chemical and bacteriological characteristics of Noyyal river and ground water
quality of Perur, India. J. Appl. Sci. Environ. Manage, 14 (2), 29-35.
WHO’ s (World Health Organization) (1993) WHO’s Guideline for Drinking Quality, set up in
Geneva, the international reference point for standard setting and drinking water safety.
Table: 1. pH of water sample & collected at different distance from Ganga canal.
S.
No
Locations Water sampling distance from Ganga canal (m)
1000 2000 3000 4000 5000
1 Kaili (Sakoti) 7.89 (1.2) 7.45 (2.5) 7.51 (4.2) 7.40 (5.4) 7.31 (7.6)
2 Milak (Sardhana) 7.28 (3.0) 7.44 (6.1) 7.60 (6.7) 7.35 (12.2) 7.83 (16.4)
3 Nanu (SP) 7.28 (1.2) 7.44 (2.4) 7.60 (4.0) 7.35 (6.5) 7.83 (9.1)
4 Pooth (Rohata) 7.34 (2.1) 7.70 (3.7) 7.30 (6.5) 7.4 (9.6) 7.34 (12.2)
5 Bhola (Jhal) 7.65 (0.91) 8.09 (3.0) 7.46 (4.6) 7.46 (8.2) 7.51 (14.8)
6 Jani 7.43 (1.2) 7.50 (2.1) 7.51 (6.1) 7.62 (8.8) 7.64 11.
6)
*Values in parenthesis denotes the sampling depth (m)
Table: 2. Electrical conductivity (dSm-1
) of water sample collected at different distance from
Ganga canal.
S.
No
Locations Water sampling distance from Ganga canal (m)
1000 2000 3000 4000 5000
1 Kaili (Sakoti) 0.17 (1.2) 0.29 (2.5) 0.31 (4.2) 1.04 (5.4) 0.37 (13.4)
2 Milak (Sardhana) 0.51 (3.0) 0.47 (6.1) 0.43 (6.7) 0.45 (12.2) 0.53 (16.4)
3 Nanu (SP) 0.29 (1.2) 0.41 (2.4) 0.40 (4.0) 0.44 (6.0) 0.50 (9.1)
4 Pooth (Rohata) 1.00 (2.1) 0.58 (3.7) 0.65 (6.5) 0.46 (9.6) 0.67 (12.2)
5 Bhola (Jhal) 0.24 (0.91) 0.33 (3.0) 0.59 (4.6) 0.73 (8.2) 0.49 (14.8)
6 Jani 0.44 (1.2) 0.41 (2.1) 0.37 (6.1) 0.57 (8.8) 0.48 (11.6)
* Values in parenthesis denotes the sampling depth (m)
Table: 3. Potassium (mg/L) of water sample collected at different distance from Ganga
canal.
S. No Locations Water sampling distance from Ganga canal (m)
1000 2000 3000 4000 5000
1 Kaili (Sakoti) 4.0 (1.2) 4.9 (2.5) 3.8 (4.2) 4.8 (5.4) 5.1 (13.4)
2 Milak (Sardhana) 4.6 (3.0) 5.9 (6.1) 7.1 (6.7) 4.5 (12.2) 7.4 (16.4)
3 Nanu (SP) 4.5 (1.2) 5.9 (2.4) 4.5 (4.0) 6.9 (6.0) 7.7 (9.1)
4 Pooth (Rohata) 28 (2.1) 6.0 (3.7) 7.8 (6.5) 20.5 (9.6) 6.2 (12.2)
5 Bhola (Jhal) 4.0 (0.91) 5.4 (3.0) 6.2 (4.6) 4.9 (8.2) 5.2 (14.8)
6 Jani 6.1 (1.2) 5.5 (2.1) 5.1 (6.1) 6.5 (8.8) 6.0 (11.6)
* Values in parenthesis denotes the sampling depth (m)
Global Journal of Agricultural Research
Vol.1, Issue 3, pp. 27-37, December 2013
Published by European Centre for Research Training and Development UK (www.ea-journals.org)
33
Table: 4. Sodium (mg/L) of water sample collected at different distance from Ganga canal.
S.
No
Locations Water sampling distance from Ganga canal (m)
1000 2000 3000 4000 5000
1 Kaili (Sakoti) 2.7 (1.2) 4.2 (2.5) 4.0 (4.2) 6.8 (5.4) 7.2 (13.4)
2 Milak (Sardhana) 7.9 (3.0) 6.6 (6.1) 7.7 (6.7) 7.5 (12.2) 7.7 (16.4)
3 Nanu (SP) 4.4 (1.2) 6.9 (2.4) 7.5 (4.0) 7.8 (6.0) 8.0 (9.1)
4 Pooth (Rohata) 4.0 (2.1) 7.9 (3.7) 8.0 (6.5) 6.3 (9.6) 7.5 (12.2)
5 Bhola (Jhal) 2.4 (0.91) 6.6 (3.0) 8.0 (4.6) 6.9 (8.2) 7.9 (14.8)
6 Jani 8.1 (1.2) 7.4 (2.1) 6.3 (6.1) 8.0 (8.8) 7.2 (11.6)
Values in parenthesis denotes the sampling depth (m)
Table: 5. Ca++
+ Mg++
(me/L) of water sample collected at different distance from Ganga
canal.
S. No Locations Water sampling distance from Ganga canal (m)
1000 2000 3000 4000 5000
1 Kaili (Sakoti) 5.8 (1.2) 9.7 (2.5) 9.0 (4.2) 10.7 (5.4) 10.4 (13.4)
2 Milak (Sardhana) 14.3 (3.0) 13.5 (6.1) 11.8 (6.7) 12.6(12.2) 11.5 (16.4)
3 Nanu (SP) 7.2 (1.2) 12.4 (2.4) 10.4 (4.0) 7.6 (6.0) 12.0 (9.1)
4 Pooth (Rohata) 12.9 (2.1) 11.8 (3.7) 14.3 (6.5) 17.2 (9.6) 28.6 (12.2)
5 Bhola (Jhal) 7.2 (0.91) 6.1 (3.0) 13.4 (4.6) 9.4 (8.2) 10.0 (14.8)
6 Jani 10.7(1.2) 12.3 (2.1) 8.6 (6.1) 18.3 (8.8) 19.3 (11.6)
Table: 6. Chloride (g/L) of water sample collected at different distance from Ganga canal.
S.
No
Locations Water sampling distance from Ganga canal (m)
1000 2000 3000 4000 5000
1 Kaili (Sakoti) 0.53 (1.2) 0.16 (2.5) 0.25 (4.2) 0.18 (5.4) 0.23 (13.4)
2 Milak (Sardhana) 0.18 (3.0) 0.21 (6.1) 0.28 (6.7) 0.18 (12.2) 0.21 (16.4)
3 Nanu (SP) 0.32 (1.2) 0.25 (2.4) 0.43 (4.0) 0.32 (6.0) 0.23 (9.1)
4 Pooth (Rohata) 0.25 (2.1) 0.21 (3.7) 0.43 (6.5) 0.50 (9.6) 0.46 (12.2)
5 Bhola (Jhal) 0.28 (0.91) 0.38 (3.0) 0.40 (4.6) 0.36 (8.2) 0.50 (14.8)
6 Jani 0.18 (1.2) 0.25 (2.1) 0.28 (6.1) 0.34 (8.8) 0.39 (11.6)
* Values in parenthesis denotes the sampling depth (m)
Table:7. Nitrate (mg/L) of water sample collected at different distance from Ganga canal.
S.
No
Locations Water sampling distance from Ganga canal (m)
1000 2000 3000 4000 5000
1 Kaili (Sakoti) 1.30 (1.2) 1.71 (2.5) 0.23 (4.2) 0.20 (5.4) 0.43 (13.4)
2 Milak (Sardhana) 0.11 (3.0) 1.20 (6.1) 1.60 (6.7) 2.03 (12.2) 4.47 (16.4)
3 Nanu (SP) 0.19 (1.2) 0.10 (2.4) 2.30 (4.0) 2.23 (6.0) 0.68 (9.1)
4 Pooth (Rohata) 3.22 (2.1) 0.90 (3.7) 0.30 (6.5) 1.40 (9.6) 0.40 (12.2)
5 Bhola (Jhal) 0.10 (0.91) 0.23 (2.1) 0.31 (4.6) 0.69 (8.2) 1.25 (14.8)
6 Jani 1.42 (1.2) 1.40 (2.1) 0.88 (6.1) 0.74 (8.8) 0.23 (11.6)
Global Journal of Agricultural Research
Vol.1, Issue 3, pp. 27-37, December 2013
Published by European Centre for Research Training and Development UK (www.ea-journals.org)
34
Table:8. Sulphate (mg/L) of water sample collected at different distance from Ganga canal.
Values in parenthesis denotes the sampling depth (m)
T Table: 9. Carbonate (me/L) of water sample collected at different distance from Ganga
canal.
S. No Locations Water sampling distance from Ganga canal (m)
1000 2000 3000 4000 5000
1 Kaili (Sakoti) 1.8 (2.5) 1.0 (5.4) 2.0 (13.4)
2 Milak (Sardhana) 2.0(3.0) 4.0 (6.1) 4.2 (6.7) 1.0
(12.2)
2.8 (16.4)
3 Nanu (SP) 1.0 (2.4) 2.0 (4.0) 3.0 (9.1)
4 Pooth (Rohata) 2.6(2.1) 3.0 (3.7) 2.0 (6.5) 6.0 (9.6) 2.0 (12.2)
5 Bhola (Jhal) 3.5 (4.6) 1.3 (8.2) 2.0 (14.8)
6 Jani 1.8 (8.8)
Values in parenthesis denotes the sampling depth (m)
Table: 10. Bicarbonate (me/L) of water sample collected at different distance from Ganga
canal.
S. No Locations Water sampling distance from Ganga canal (m)
1000 2000 3000 4000 5000
1 Kaili (Sakoti) 6 (1.2) 15 (2.5) 13 (4.2) 10 (5.4) 13 (13.4)
2 Milak (Sardhana) 9 (3.0) 12 (6.1) 14 (6.7) 16 (12.2) 19 (16.4)
3 Nanu (SP) 7 (1.2) 11.5 (2.4) 12 (4.0) 16 (6.0) 18 (9.1)
4 Pooth (Rohata) 17 (2.1) 20 (3.7) 15 (6.5) 22 (9.6) 5 (12.2)
5 Bhola (Jhal) 9 (0.91) 13 (3.0) 16 (4.6) 19 (8.2) 20 (14.8)
6 Jani 14 (1.2) 10 (2.1) 15 (6.1) 18 (8.8) 7 (11.6)
Values in parenthesis denotes the sampling depth (m)
S.
No
Locations Water sampling distance from Ganga canal (m)
1000 2000 3000 4000 5000
1 Kaili (Sakoti) 1.12 (1.2) 0.20 (2.5) 2.81 (4.2) 0.40 (5.4) 0.23 (13.4)
2 Milak (Sardhana) 2.77 (3.0) 0.73 (6.1) 0.24 (6.7) 0.20 (12.2) 0.15 (16.4)
3 Nanu (SP) 0.30 (1.2) 0.50 (2.4) 0.90 (4.0) 0.26 (6.0) 0.18 (9.1)
4 Pooth (Rohata) 2.41 (2.1) 0.60 (3.7) 0.34 (6.5) 0.27 (9.6) 0.24 (12.2)
5 Bhola (Jhal) 1.61 (0.91) 1.40 (3.0) 1.33 (4.6) 0.65 (8.2) 0.46 (14.8)
6 Jani 0.12 (1.2) 0.27 (2.1) 0.73 (6.1) 0.67 (8.8) 0.35 (11.6)
Global Journal of Agricultural Research
Vol.1, Issue 3, pp. 27-37, December 2013
Published by European Centre for Research Training and Development UK (www.ea-journals.org)
35
Table.11. Arsenic (ppb) of water sample collected at different distance from Ganga canal.
S. No Locations Water sampling distance from Ganga canal (m)
1000 2000 3000 4000 5000
1 Kaili (Sakoti) 1.04 (1.2) 1.68 (2.5) 16.48
(4.2)
11.78
(5.4)
12.02(13.4)
2 Milak (Sardhana)
4.38 (3.0)
21.29 (6.1) 13.45
(6.7)
2.87
(12.2)
2.09 (16.4)
3 Nanu (SP)
1.08 (1.2)
1.46 (2.4) 2.77 (4.0) 21.06
(6.0)
2.64 (9.1)
4 Pooth (Rohata) 3.21 (2.1) 3.34 (3.7) 3.48 (6.5) 3.69 (9.6) 4.25 (12.2)
5 Bhola (Jhal) 4.54
(0.91)
5.07 (3.0) 3.47 (4.6) 1.61 (8.2) 3.95 (14.8)
6 Jani 1.86 (1.2) 4.66 (2.1) 3.83 (6.1) 2.92 (8.8) 4.97 (11.6)
Table: 12. Total dissolve salts (mg/L) of water sample collected at different distance from
Ganga canal.
S. No Locations Water sampling distance from Ganga canal (m)
1000 2000 3000 4000 5000
1 Kaili (Sakoti) 123 (1.2) 221 (2.5) 201 (4.2) 160 (5.4) 234 (13.4)
2 Milak (Sardhana) 308 (3.0) 297 (6.1) 234 (6.7) 211 (12.2) 349 (16.4)
3 Nanu (SP) 115 (1.2) 154 (2.4) 272 (4.0) 183 (6.0) 311 (9.1)
4 Pooth (Rohata) 498 (2.1) 362 (3.7) 402 (6.5) 276 (9.6) 495 (12.2)
5 Bhola (Jhal) 172 (0.91) 155 (3.0) 408 (4.6) 401 (8.2) 299 (14.8)
6 Jani 180 (1.2) 167 (2.1) 244 (6.1) 405 (8.8) 318 (11.6)
Values in parenthesis denotes the sampling depth (m)
Table: - 13. Classification of collected water samples on the basis of TDS for drinking
purpose.
S. No Class TDS (me L-1
) No. of sample Percentage
1 Non – saline < 1000 - -
2 Slightly saline 1000 – 3000 1 1
3 Moderately saline 3000 – 10, 000 - -
4 Very saline > 10, 000 - -
Table: 14 Sodium absorption ratios (SAR) of water sample collected at different distance
from Ganga canal.
S. No Locations Water sampling distance from Ganga canal (m)
1000 2000 3000 4000 5000
1 Kaili (Sakoti) 1.60 (1.2) 1.91 (2.5) 1.88 (4.2) 2.94 (5.4) 3.20 (13.4)
2 Milak (Sardhana) 2.96 (3.0) 2.55 (6.1) 3.20 (6.7) 3.00 (12.2) 3.22 (16.4)
3 Nanu (SP) 2.33 (1.2) 2.78 (2.4) 3.90 (4.0) 4.03 (6.0) 3.30 (9.1)
4 Pooth (Rohata) 1.60 (2.1) 3.26 (3.7) 2.99 (6.5) 2.15 (9.6) 1.98 (12.2)
5 Bhola (Jhal) 1.27 (0.91) 3.79 (3.0) 3.10 (4.6) 3.20 (8.2) 3.54 (14.8)
Global Journal of Agricultural Research
Vol.1, Issue 3, pp. 27-37, December 2013
Published by European Centre for Research Training and Development UK (www.ea-journals.org)
36
6 Jani 3.50 (1.2) 3.00 (2.1) 3.04 (6.1) 2.65 (8.8) 2.33 (11.6)
Values in parenthesis denotes the sampling depth (m)
Table: 15. Classification of collected water on the basis of SAR for irrigation purpose.
Alkali hazards Class of water No. of samples Percentage
<10 Excellent 30 100
10-18 Good - -
18-26 Fair - -
>26 Poor - -
Table.16: Residual sodium carbonate and bicarbonate (RSC/RSBC) of water sample
collected at different distance from Ganga canal.
S. No Locations Water sampling distance from Ganga canal (m)
1000 2000 3000 4000 5000
1 Kaili (Sakoti) 2.2 (1.2) 7.1 (2.5) 4.0 (4.2) 0.3 (5.4) 4.6 (13.4)
2 Milak (Sardhana) -0.3 (3.0) 2.5 (6.1) 6.4 (6.7) 4.4 (12.2) 9.3 (16.4)
3 Nanu (SP) -0.2 (1.2) 4.6 (2.4) 3.6 (4.0) 8.4 (6.0) 9.0 (9.1)
4 Pooth (Rohata) 4.1 (2.1) 11.2 (3.7) 2.7 (6.5) 10.8 (9.6) -21.6(12.2)
5 Bhola (Jhal) 1.8 (0.91) 9.9 (3.0) 10.1 (4.6) 10.9 (8.2) 5.0 (14.8)
6 Jani 7.3 (1.2) 8.1 (2.1) 1.4 (6.1) 2.4 (8.8) -12.3(11.6)
Table:17. Evaluation of irrigation water on the basis of alkalinity hazards RSC/ RSBC
Alkali hazards Class of
water
`No. of
samples
(%) Remarks
A0- (- ve) Non alkaline 4 13.33 Used for irrigation on almost all soils &
crops
A1- (0 meL-1
) Normal
water
0 0.0 Used for irrigation on almost all soils &
crops
A2- (< 2.5 meL-1
) Low
alkalinity
5 16.66 Used for irrigation on almost all soils &
crops
A3- (2.5-5.0 meL-1
) Medium
alkalinity
8 26.66 Use for irrigation and little danger of
development of harmful limit of
alkalinity.
A4- (5-10 meL-1
) High
alkalinity
8 26.66 Use for irrigation with good drainage
A5- (> 10 meL-1
) Very high
alkalinity
5 16.66 Not suitable for irrigation with
consumption with low alkalinity water
Global Journal of Agricultural Research
Vol.1, Issue 3, pp. 27-37, December 2013
Published by European Centre for Research Training and Development UK (www.ea-journals.org)
37
Table:-18. Assessment of ground water quality based on salinity measurement
for irrigation purpose
EC(dS/m)
at 250c
Water class No. of
samples
% Remarks
<0.25 C1-low salinity 6 6.66 Safe with no likelihood of any salinity
problem developing
0.25-0.75 C2 - medium
salinity
26 86.66 Need moderately leaching
0.75-2.25 C3 - high salinity 2 6.66 Cannel be used on soils with
inadequate drainage, since saline
condition are likely to develop
2.25-5.0 C4 - Very high
salinity
0 0 Cannel be used on soils with
inadequate drainage, since saline
conditions are likely to develop


![[XLS] 5... · Web viewNIRMAL SIDDIQUI MEERUT JAISWAL UPENDRA GANGA PATEL JAGANNATH JAUNPUR SHARAN JITENDRA MODI SIDDI RAVENDRA KHANAM ANANDPUR AZAMGARH GUJARAT DURGA AJMER GODARA](https://img.pdfslide.net/doc/110x75/5b0d2fcb7f8b9abc0a8d48a6/xls-5web-viewnirmal-siddiqui-meerut-jaiswal-upendra-ganga-patel-jagannath-jaunpur.jpg)