Embed Size (px)
Citation preview

1-1
Financial Analysts Awareness Program
Dr. Mounther Barakat
Securities and Commodities Authority

1-2
الماليين المحللين برنامج
العمري. بركات منذر د
والسلع المالية االوراق هيئة

1-3
Forecasting Example
Cash & sec. $ 20 Accts. pay. & accruals $ 100
Accounts rec. 240 Notes payable 100Inventories 240 Total CL $ 200
Total CA $ 500 L-T debt 100Common stock 500
Net fixed Retained assets 500 earnings 200
Total assets $1,000 Total claims $1,000
Balance sheet, in millions of dollars
1-4
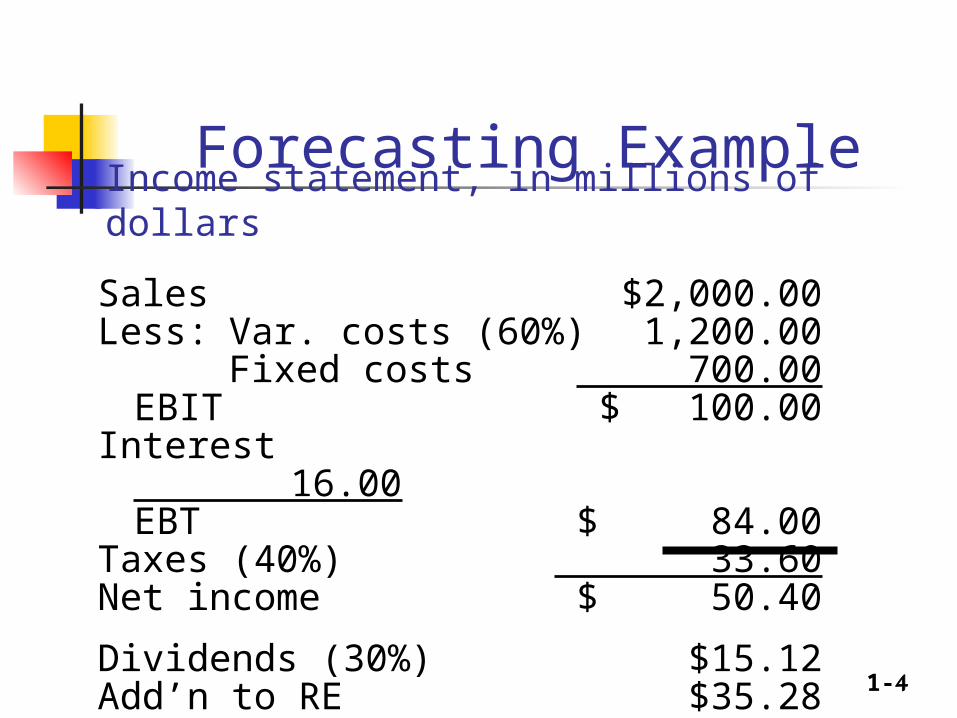
Sales $2,000.00Less: Var. costs (60%) 1,200.00
Fixed costs 700.00EBIT $ 100.00
Interest 16.00EBT $ 84.00
Taxes (40%) 33.60Net income $ 50.40
Dividends (30%) $15.12Add’n to RE $35.28
Income statement, in millions of dollars
Forecasting Example

1-5
Key assumptions Operating at full capacity in 2006. Each type of asset grows proportionally with sales. Payables and accruals grow proportionally with
sales. 2006 profit margin (2.52%) and payout (30%) will
be maintained. Sales are expected to increase by $500 million.
(%GS = 25%)

1-6
Determining additional funds needed AFN
AFN = (A*/S0)ΔS – (L*/S0) ΔS – M(S1)(RR)
= ($1,000/$2,000)($500)
– ($100/$2,000)($500)
– 0.0252($2,500)(0.7)
= $180.9 million.

1-7
How shall AFN be raised?
The payout ratio will remain at 30 percent (d = 30%; RR = 70%).
No new common stock will be issued. Any external funds needed will be raised as
debt, 50% notes payable and 50% L-T debt.
1-8
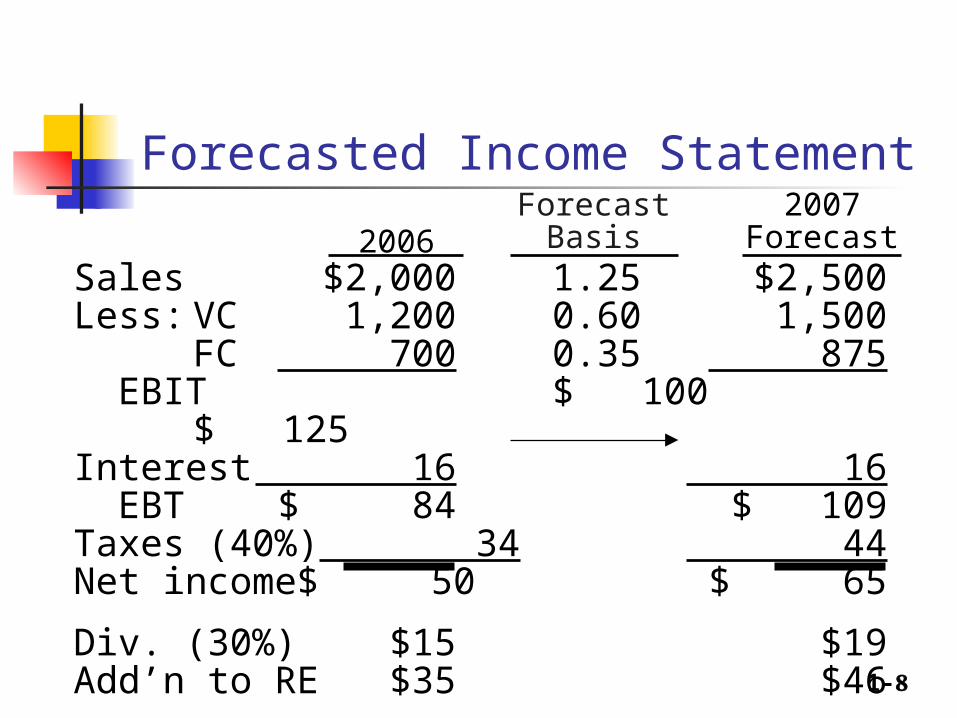
Forecasted Income Statement
Sales $2,000 1.25 $2,500Less: VC 1,200 0.60 1,500
FC 700 0.35 875 EBIT $ 100 $ 125Interest 16 16 EBT $ 84 $ 109Taxes (40%) 34 44Net income $ 50 $ 65
Div. (30%) $15 $19Add’n to RE $35 $46
ForecastBasis
2007Forecast2006

1-9
20071st Pass
Forecasted Balance Sheet (2007) - Assets
2006Forecast
Basis
Cash $ 20 0.01 $ 25Accts. rec. 240 0.12 300Inventories 240 0.12 300 Total CA $ 500 $ 625Net FA 500 0.25 625 Total assets $1,000 $1,250

1-10
20071st Pass2006
ForecastBasis
Forecasted Balance Sheet (2007) - Liabilities and Equity
AP/accruals $ 100 0.05 $ 125Notes payable 100 100 Total CL $ 200 $ 225L-T debt 100 100Common stk. 500 500Ret.earnings 200 +46* 246 Total claims $1,000 $1,071
* From income statement.

1-11
What is the additional financing needed (AFN)?
Required increase in assets = $ 250 Spontaneous increase in liab. = $ 25 Increase in retained earnings = $ 46 Total AFN = $ 179
The company must have the assets to generate forecasted sales. The balance sheet must balance, so we must raise $179 million externally.

1-12
How will the AFN be financed? Additional N/P
0.5 ($179) = $89.50 Additional L-T debt
0.5 ($179) = $89.50
But this financing will add to interest expense, which will lower NI and retained earnings. This will lower equity financing and increase debt financing, and so on. We will generally ignore financing feedbacks.

1-13
20072nd Pass
20071st Pass AFN
Forecasted Balance Sheet (2007) - Assets
Cash $ 25 - $ 25Accts. rec. 300 - 300Inventories 300 - 300 Total CA $ 625 $ 625Net FA 625 - 625 Total assets $1,250 $1,250

1-14
20072nd Pass
20071st Pass AFN
Forecasted Balance Sheet (2007) - Liabilities and Equity
AP/accruals $ 125 - $ 125Notes payable 100 +89.5 190 Total CL $ 225 $ 315L-T debt 100 +89.5 189Common stk. 500 - 500Ret.earnings 246 - 246 Total claims $1,071 $1,250
1-15
Advanced Forecasting Use of regressions for each item Use of iterations in finding interest income
and expense Forecasting with stock dividends, stock
repurchase, stock issuance, stock splits, ….

1-16
Analyzing PE and PB and its UsagesCase I
: فيحال التسعيرنمو %0النمو=عدموجود
علىشكلتوزرعاتنقدية كافةاألرباح %100التوزيع=تدفع) عدموجودها عدمه )وجودقيمةاقتصاديةمضافةأو اعتياديةأو غير ارباح =وجود %10العائدالمطلوب
منه أكبر أيانالعائدالمتحققيساويالعائدالمطلوبأوأيسوق أو احتكار سوقمنافسةأو
/معدلالعائدالمطلوب السعر = ربحيةالسهم

1-17
Analyzing PE and PB and its UsagesCase I
أحتكارمنافسة101010القيمةالدفترية %10%10%10العائدالمطلوب 123الربحالكلي 111الربحالعادي
عادي 012الربحالغير%30%20%10العائدالمتحقق
123التوزيع101010القيمةالدفترية السوقي 102030السعر
123القيمةالسوقيةالىالقيمةالدفتريةمضاعفالقيمةالدفترية ) 101010القيمةالسوقيةالىالربحية )مضاعفالربحية
عنوجودقيمةمضافةأمال بغضالنظر مضاعفالقيمةالدفتريةويبقىمضاعفالربحيةثابتا يتغير

1-18
Analyzing PE and PB and its UsagesCase II
: فيحال التسعيرنمو وجود
اآلخر نصفها علىشكلتوزيعاتنقديةويحجز نصفاألرباح يدفع 0.05النمو=لتمويلالنمو) قيمةاقتصاديةمضافة اعتيادية )عدموجود غير ارباح 0.5التوزيع=عدموجود
متوقع هو مما =أيانالعائدالمتحققيساويالعائدالمطلوبفقطوليسأكثر 0.1العائدالمطلوب لزيادةحجمالشركة =سوقمنافسةواستثمار 0.1العائدالمتحقق
) -معدلالنمو (/)معدلالعائدالمطلوب السعر = التوزيعات*)1+معدلالنمو

1-19
Analyzing PE and PB and its UsagesCase II
12345السنة1010.511.0311.5812.16القيمةالدفترية %10%10%10%10%10العائدالمطلوب 11.051.1031.1581.216الربحالكلي 11.051.1031.1581.216الربحالعادي
عادي 00000الربحالغير%10%10%10%10%10العائدالمتحقق
0.50.5250.5510.5790.608التوزيع10.511.0311.5812.1612.76القيمةالدفترية السوقي 10.511.0311.5812.1612.76السعر
11111القيمةالسوقيةالىالقيمةالدفتريةمضاعفالقيمةالدفترية ) 10.510.510.510.510.5القيمةالسوقيةالىالربحية )مضاعفالربحية
ثابتا ولكنهاستمر زادمضاعفالربحيةبسببالنمومنالمتوقع أكبر يوجدنمو ألنهال أنمضاعفالقيمةالدفتريةبقيثابتا فيالشركةإال بالرغممنالنمو
منالمتوقع أكبر يوجدنمو ألنهال أنمضاعفالربحيةبقيثابتا فيالشركةإال بالرغممنالنمو

1-20
Analyzing PE and PB and its UsagesCase III
: فيحال التسعيرنمو وجود
اآلخر نصفها علىشكلتوزيعاتنقديةويحجز نصفاألرباح يدفع 0.05النمو=لتمويلالنمو) اعتيادية )وجودقيمةاقتصاديةمضافة غير ارباح 0.5التوزيع=وجود
منالعائدالمطلوب =أيانالعائدالمتحققأكبر 0.1العائدالمطلوب لزيادةحجمالشركة =سوقمنافسةواستثمار 0.2العائدالمتحقق
) -معدلالنمو /)معدلالعائدالمطلوب االعتيادية غير السعر = القيمةالدفترية + األرباح

1-21
Analyzing PE and PB and its UsagesCase III
12345السنة101112.113.3114.64القيمةالدفترية %10%10%10%10%10العائدالمطلوب 22.22.422.6622.928الربحالكلي العادي 11.11.211.3311.464الربح
عادي 11.11.211.3311.464الربحالغير%20%20%20%20%20العائدالمتحقق
11.11.211.3311.464التوزيعالمحجوزة 11.11.211.3311.464األرباح
1112.113.3114.6416.11القيمةالدفترية السوقي 3134.137.5141.2645.39السعر
2.8182.8182.8182.8182.818القيمةالسوقيةالىالقيمةالدفتريةمضاعفالقيمةالدفترية ) 15.515.515.515.515.5القيمةالسوقيةالىالربحية )مضاعفالربحية
ثابتا ولكنهاستمر زادمضاعفالربحيةبسببالنمويبقىمضاعفالقيمةالدفتريةثابتا
أنمضاعفالربحيةبقيثابتا فيالشركةإال بالرغممنالنمو
1-22
Analyzing PE and PB and its UsagesCase IV
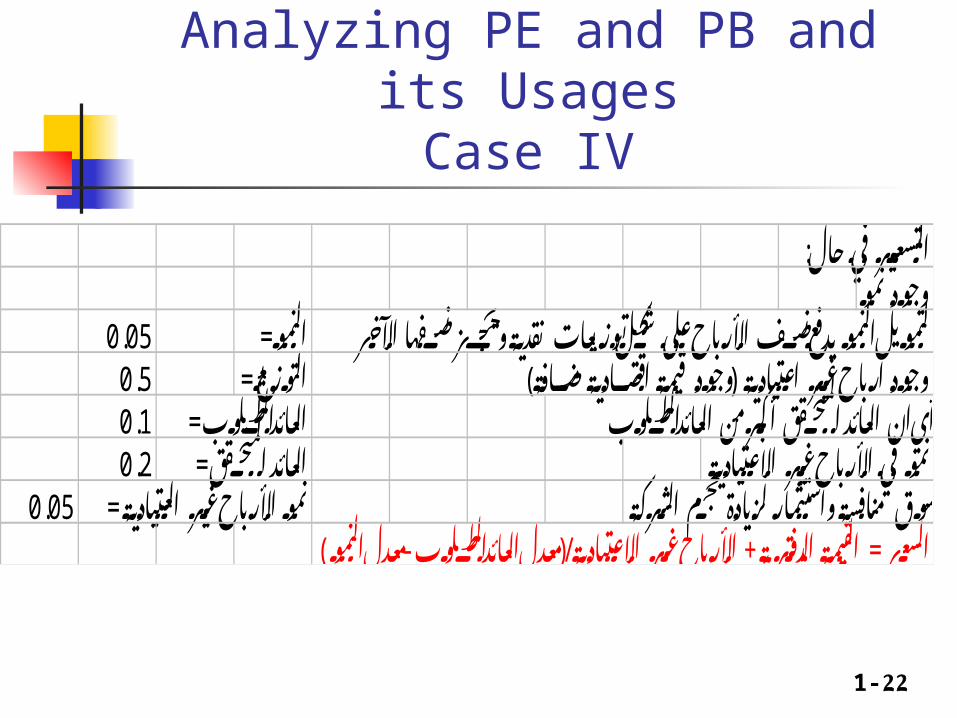
: فيحال التسعيرنمو وجود
اآلخر نصفها علىشكلتوزيعاتنقديةويحجز نصفاألرباح يدفع 0.05النمو=لتمويلالنمو) قيمةاقتصاديةمضافة اعتيادية )وجود غير ارباح 0.5التوزيع=وجود
منالعائدالمطلوب =أيانالعائدالمتحققأكبر 0.1العائدالمطلوب االعتيادية غير فياألرباح =نمو 0.2العائدالمتحقق
لزيادةحجمالشركة العتيادية = سوقمنافسةواستثمار غير األرباح 0.05نمو) -معدلالنمو /)معدلالعائدالمطلوب االعتيادية غير السعر = القيمةالدفترية + األرباح

1-23
Analyzing PE and PB and its UsagesCase IV
12345السنة101112.1613.515.06القيمةالدفترية %10%10%10%10%10العائدالمطلوب 22.312.683.1243.66الربحالكلي 11.11.2161.351.506الربحالعادي
عادي 11.2711.5381.8642.262الربحالغير%24%23%22%21%20العائدالمتحقق
11.1551.341.5621.83التوزيعالمحجوزة 11.1551.341.5621.83األرباح
1112.1613.515.0616.89القيمةالدفترية السوقي 3137.6844.4552.6362.57السعر
2.8183.13.2943.4953.705القيمةالسوقيةالىالقيمةالدفتريةمضاعفالقيمةالدفترية ) 15.516.3116.5916.8517.09القيمةالسوقيةالىالربحية )مضاعفالربحية
االعتيادية غير فياألرباح النمو وبزيادةمطردةمع زادمضاعفالربحيةبسببالنمواالعتيادية غير فياألرباح النمو وبزيادةمطردةمع زادمضاعفالقيمةالدفتريةبسببالنمو
االعتيادية غير فياالرباح النمو المضاعفينمع يزداد

1-24
Analyzing PE and PB and its UsagesConclusions
Reinvestment of free cash flow at rates of return in excess of capital costs creates growth in abnormal earnings, resulting in valuation multiple expansion.
The PE is a function of the prospective growth in future abnormal earnings.
Usages of PE in any other cases will result in mispricing and arbitrage opportunities.
This huge limitation should be considered among many other ones.
r
rningsAbnormalea
gr
grningsAbnormalea
ErE
P
)(
)1(*
11
11
0

1-25
Analyzing PE and PB and its UsagesConclusions
Which PE to use the historical average of the same firm’s PE’s, OR
The PE of similar firms, OR The PE of the industry How are PE’s used for companies that have
more than one division (weighted average?!)

1-26
Analyzing PE and PB and its UsagesConclusions
PE does take risk into account indirectly (i.e. through the used pricing model’s discount rate).
PE gives the dollar amount (Price) the investor is willing to pay for one dollar of continued earnings. PE is the reciprocal of the required rate of return.
Empirical studies show that the required rate of return (calculated using other return models like the market model or CAPM) is usually different from the one calculated by PE ratios.
Only sustainable earnings are used, transitory or non recurring earnings must be excluded.
1-27
Analyzing PE and PB and its UsagesRecommendations
Use PE ratios with maximum caution Know when it is used and what it means PB is also problematic some times, it is
used when there are abnormal returns regardless whether they grow or not.

1-28
Balance Sheet: Assets
CashA/RInventories
Total CAGross FALess: Dep.
Net FATotal Assets
20067,282
632,1601,287,3601,926,8021,202,950 263,160 939,7902,866,592
200557,600
351,200 715,2001,124,000
491,000 146,200 344,8001,468,800

1-29
Balance sheet: Liabilities and Equity
Accts payableNotes payableAccruals
Total CLLong-term debtCommon stockRetained earnings
Total EquityTotal L & E
2006524,160
636,808 489,6001,650,568
723,432460,000
32,592 492,5922,866,592
2005145,600200,000
136,000481,600323,432460,000
203,768 663,7681,468,800
1-30
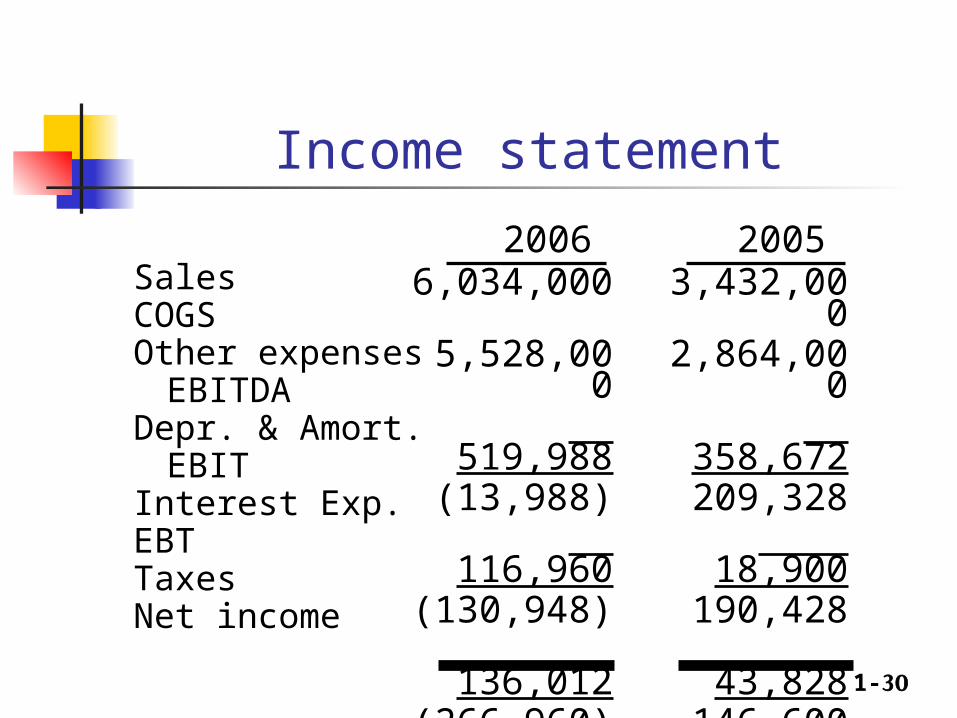
Income statement
SalesCOGSOther expenses
EBITDADepr. & Amort.
EBITInterest Exp.EBTTaxesNet income
20066,034,000
5,528,000 519,988
(13,988) 116,960(130,948) 136,012(266,960) (106,784) (160,176)
20053,432,0002,864,000 358,672
209,328 18,900
190,428 43,828
146,600 58,640
87,960

1-31
Other data
No. of sharesEPSDPSStock price
2006100,000
-DHS1.602DHS0.11DHS2.25
2005100,000DHS0.88DHS0.22DHS8.50
1-32
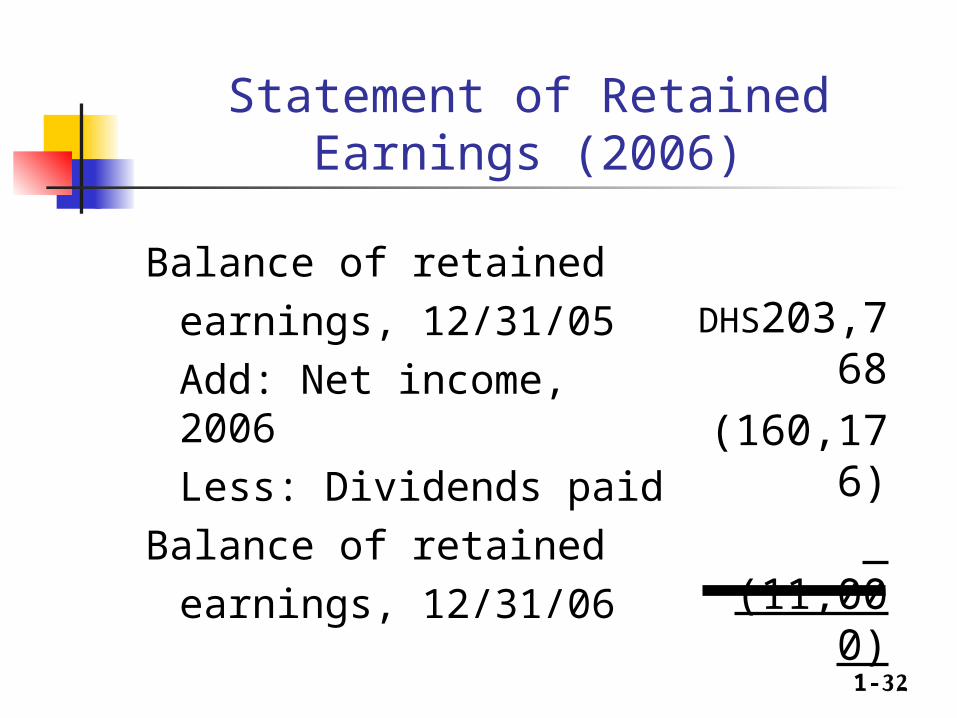
Statement of Retained Earnings (2006)
Balance of retained
earnings, 12/31/05
Add: Net income, 2006
Less: Dividends paid
Balance of retained
earnings, 12/31/06
DHS203,768
(160,176)
(11,00
0)
$32,592

1-33
Statement of Cash Flows (2006)
OPERATING ACTIVITIESNet income
Add (Sources of cash):DepreciationIncrease in A/PIncrease in accruals
Subtract (Uses of cash):Increase in A/RIncrease in inventories
Net cash provided by ops.
(160,176)
116,960378,560353,600
(280,960)(572,160)(164,176)

1-34
Statement of Cash Flows (2006)L-T INVESTING ACTIVITIES
Investment in fixed assets
FINANCING ACTIVITIESIncrease in notes payableIncrease in long-term debtPayment of cash dividendNet cash from financing
NET CHANGE IN CASH
Plus: Cash at beginning of yearCash at end of year
(711,950)
436,808400,000
(11,000)825,808
(50,318)
57,6007,282

1-35
Notes from the statement of CFs?
Net cash from operations = -$164,176, mainly because of negative NI.
The firm borrowed $825,808 to meet its cash requirements.
Even after borrowing, the cash account fell by $50,318.

1-36
Did the expansion create additional net operating after taxes (NOPAT)?
NOPAT = EBIT (1 – Tax rate)
NOPAT06 = -$130,948(1 – 0.4)
= -$130,948(0.6)= -$78,569
NOPAT05 = $114,257
1-37
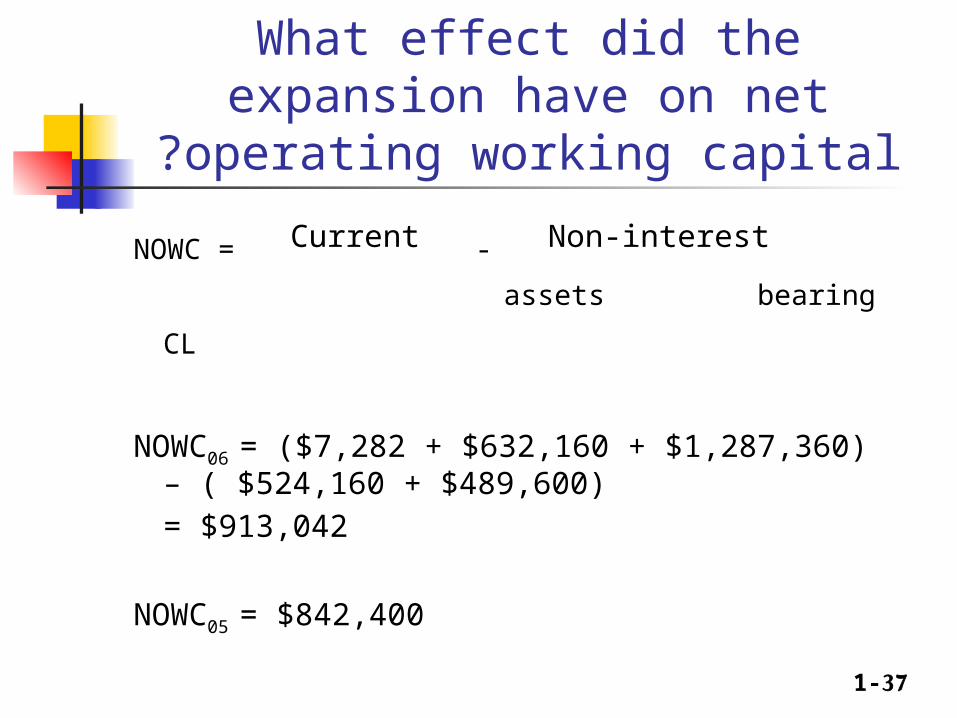
What effect did the expansion have on net operating working capital?
NOWC = Current - Non-interest
assets bearing CL
NOWC06 = ($7,282 + $632,160 + $1,287,360) – ( $524,160 + $489,600)
= $913,042
NOWC05 = $842,400
1-38
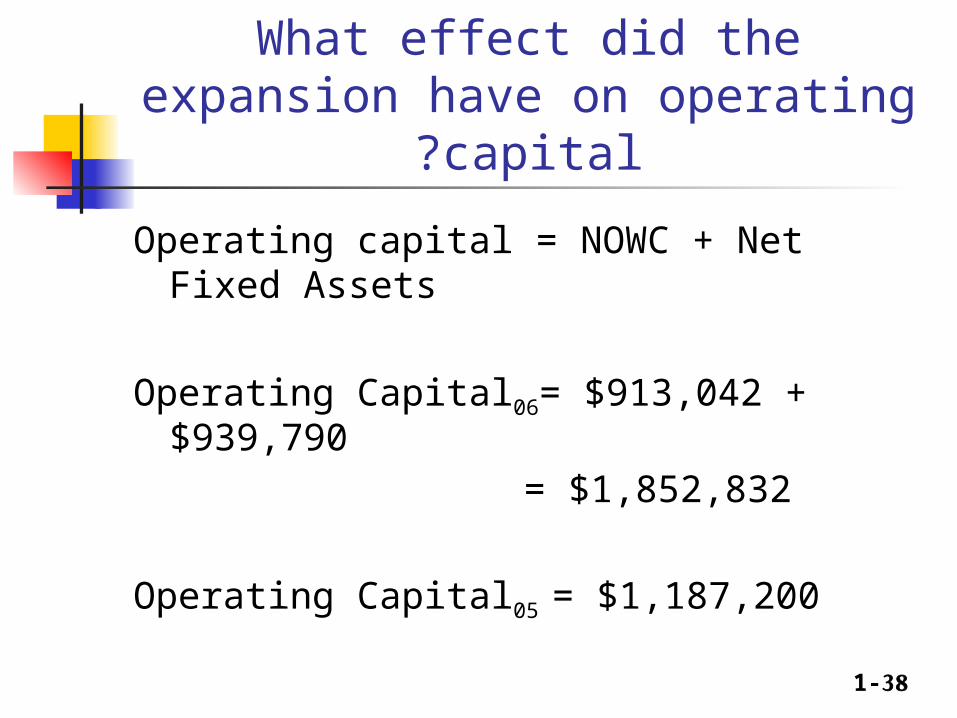
What effect did the expansion have on operating capital?
Operating capital = NOWC + Net Fixed Assets
Operating Capital06= $913,042 + $939,790
= $1,852,832
Operating Capital05 = $1,187,200

1-39
What is your assessment of the expansion’s effect on operations?
Sales
NOPAT
NOWC
Operating capital
Net Income
2006 $6,034,000
-$78,569$913,042
$1,852,832-$160,176
2005 $3,432,00
0$114,257$842,400$1,187,20
0$87,960

1-40
What effect did the expansion have on net cash flow and operating cash flow?
NCF06 = NI + Dep = ($160,176) + $116,960
= -$43,216
NCF05 = $87,960 + $18,900 = $106,860
OCF06 = NOPAT + Dep
= ($78,569) + $116,960
= $38,391
OCF05 = $114,257 + $18,900
= $133,157
1-41
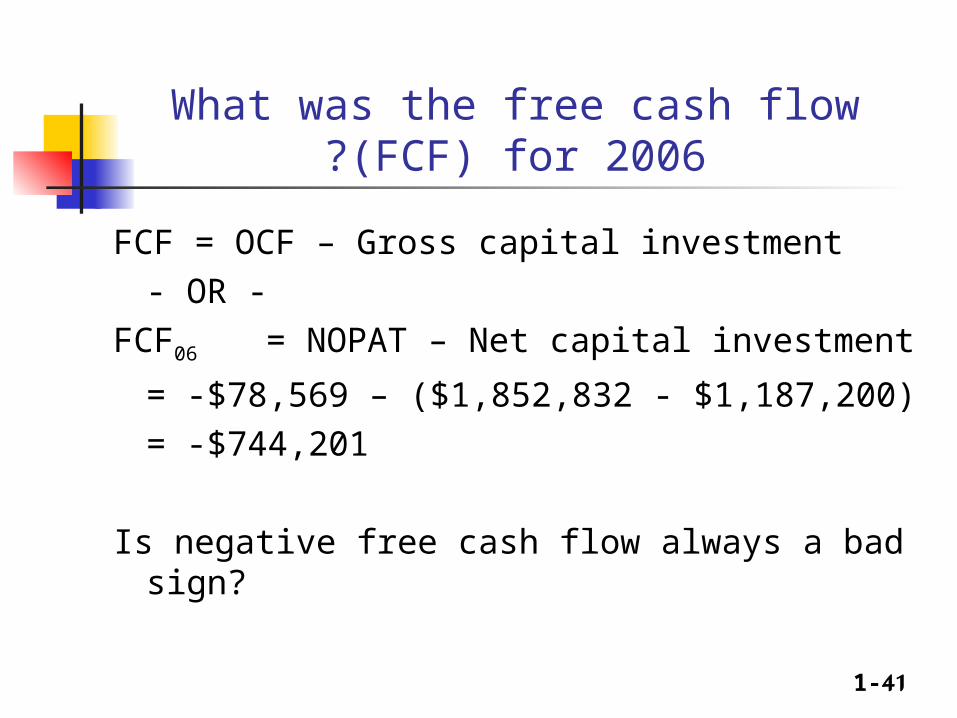
What was the free cash flow (FCF) for 2006?
FCF = OCF – Gross capital investment
- OR -
FCF06 = NOPAT – Net capital investment
= -$78,569 – ($1,852,832 - $1,187,200)
= -$744,201
Is negative free cash flow always a bad sign?

1-42
Economic Value Added (EVA)
EVA = After-tax __ After-tax
Operating Income Capital costs
= Funds Available __Cost of
to Investors Capital Used
= NOPAT – After-tax Cost of Capital

1-43
EVA Concepts
In order to generate positive EVA, a firm has to more than just cover operating costs. It must also provide a return to those who have provided the firm with capital.
EVA takes into account the total cost of capital, which includes the cost of equity.

1-44
What is the firm’s EVA? Assume the firm’s after-tax percentage cost of capital was 10% in 2005 and 13% in 2006.
EVA06 = NOPAT – (A-T cost of capital) (Capital)
= -$78,569 – (0.13)($1,852,832)
= -$78,569 - $240,868
= -$319,437
EVA05 = $114,257 – (0.10)($1,187,200)
= $114,257 - $118,720
= -$4,463

1-45
Did the expansion increase or decrease MVA?
MVA = Market value __ Equity capital of equity supplied
During the last year, the stock price has decreased 73%. As a consequence, the market value of equity has declined, and therefore MVA has declined, as well.

1-46
Pure Expectations HypothesisMaturity Yield1 year 6.0%2 years 6.2%3 years 6.4%4 years 6.5%5 years 6.5%
If PEH holds, what does the market expect will be the interest rate on one-year securities, one year from now? Three-year securities, two years from now?

1-47
Spot and forward rates
6.2% = (6.0% + x%) / 212.4% = 6.0% + x%6.4% = x%
PEH says that one-year securities will yield 6.4%, one year from now.

1-48
Spot and forward rates
6.5% = [2(6.2%) + 3(x%) / 5
32.5% = 12.4% + 3(x%)
6.7% = x%
PEH says that one-year securities will yield 6.7%, one year from now.

1-49
Returns
The rate of return on an investment can be calculated as follows:
(Amount received – Amount invested)
Return = ________________________
Amount invested
For example, if $1,000 is invested and $1,100 is returned after one year, the rate of return for this investment is:
($1,100 - $1,000) / $1,000 = 10%.

1-50
What is Risk?
Two types of investment risk Stand-alone risk Portfolio risk
Investment risk is related to the probability of earning a low or negative actual return.
The greater the chance of lower than expected or negative returns, the riskier the investment.

1-51
Probability distributions A listing of all possible outcomes, and the
probability of each occurrence. Can be shown graphically.
Expected Rate of Return
Rate ofReturn (%)100150-70
Firm X
Firm Y

1-52
The average and the standard deviation Average Standard Return Deviation
Small-company stocks 17.3% 33.2%Large-company stocks 12.7 20.2L-T corporate bonds 6.1 8.6L-T government bonds 5.7 9.4U.S. Treasury bills 3.9 3.2
.

1-53
Return comparisons
Economy Prob. T-Bill A B C M
Recession
0.1 8.0% -22.0%
28.0% 10.0% -13.0%
Below avg
0.2 8.0% -2.0% 14.7% -10.0%
1.0%
Average 0.4 8.0% 20.0% 0.0% 7.0% 15.0%
Above avg
0.2 8.0% 35.0% -10.0%
45.0% 29.0%
Boom 0.1 8.0% 50.0% -20.0%
30.0% 43.0%

1-54
T-Bills and their risk and return. T-bills will return the promised 8%,
regardless of the economy. No, T-bills do not provide a risk-free return,
as they are still exposed to inflation. Although, very little unexpected inflation is likely to occur over such a short period of time.
T-bills are also risky in terms of reinvestment rate risk.
T-bills are risk-free in the default sense of the word.

1-55
Asset and market returns.
A – Moves with the economy, and has a positive correlation. This is typical.
B – Is countercyclical with the economy, and has a negative correlation. This is unusual.

1-56
Calculating expected returns.
17.4% (0.1) (50%)
(0.2) (35%) (0.4) (20%)
(0.2) (-2%) (0.1) (-22.%) k
P k k
return of rate expected k
A^
n
1i
ii
^
^

1-57
Summary Calculating expected returns.Exp return
A 17.4%M 15.0%C 13.8%T-bill 8.0%B 1.7%
A has the highest expected return, and appears to be the best investment alternative, but is it really? Have we failed to account for risk?
1-58
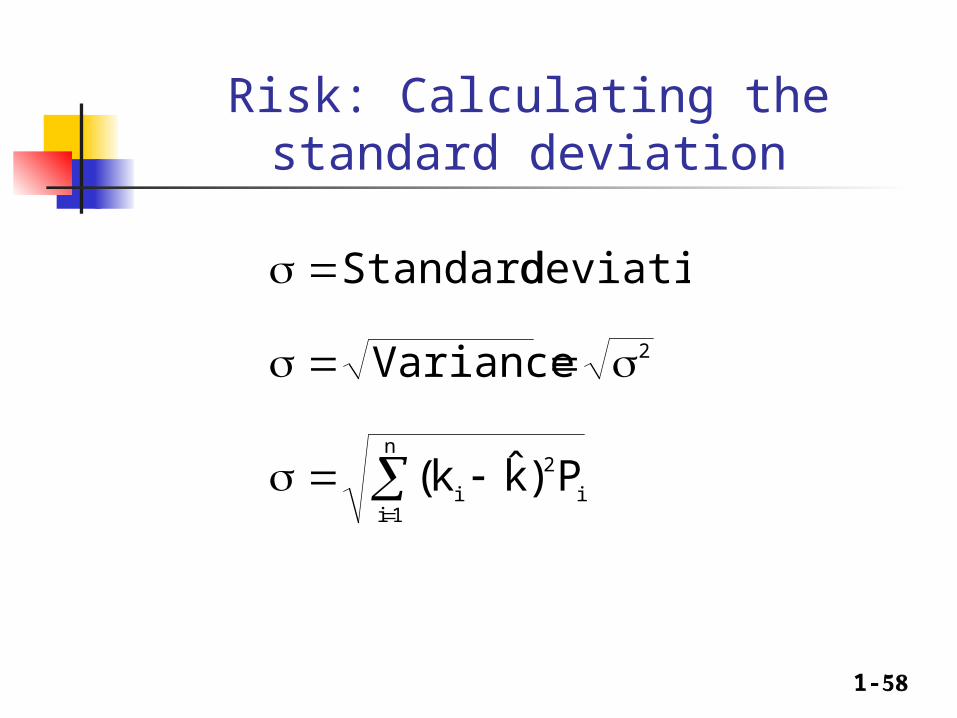
Risk: Calculating the standard deviation
deviation Standard
2Variance
i
2n
1ii P)k̂k(

1-59
Risk: Calculating the standard deviation
15.3%
18.8%
13.4%
0.0%2
%0.0
(0.1)8.0) - (8.0
(0.2)8.0) - (8.0 (0.4)8.0) - (8.0
(0.2)8.0) - (8.0 (0.1)8.0) - (8.0
P )k (k
M
C
B
A
21
2
22
22
billsT
n
1i
i2
^
i
1-60
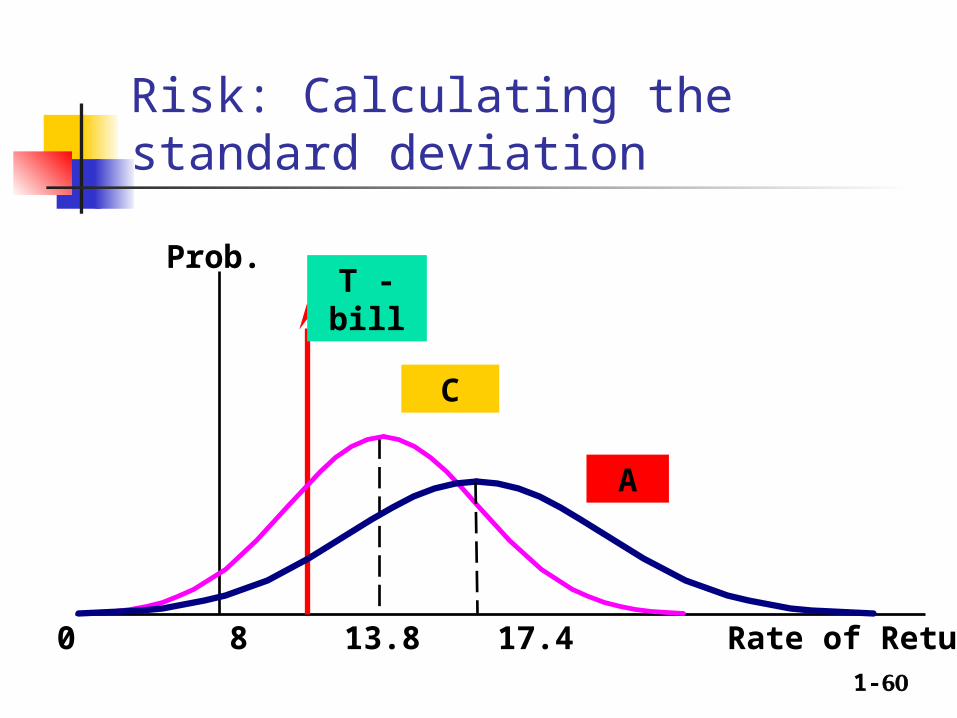
Risk: Calculating the standard deviation
C
Prob.T - bill
A
0 8 13.8 17.4 Rate of Return (%)

1-61
Standard Deviation as a Measure of Risk
Standard deviation (σi) measures total, or stand-alone, risk.
The larger σi is, the lower the probability that actual returns will be closer to expected returns.
Larger σi is associated with a wider probability distribution of returns.

1-62
Comparing Risk and Return
Security Expected return
Risk, σ
T-bills 8.0% 0.0%
A 17.4% 20.0%
B 1.7% 13.4%
C 13.8% 18.8%
M 15.0% 15.3%

1-63
Coefficient of Variation (CV)
A standardized measure of dispersion about the expected value, that shows the risk per unit of return.
^
k
Meandev Std
CV

1-64
Risk rankings, by coefficient of variation CV
T-bill 0.000A 1.149B 7.882C 1.362M 1.020
B has the highest degree of risk per unit of return.
A, despite having the highest standard deviation of returns, has a relatively average CV.

1-65
Investor attitude towards risk
Risk aversion – assumes investors dislike risk and require higher rates of return to encourage them to hold riskier securities.
Risk premium – the difference between the return on a risky asset and less risky asset, which serves as compensation for investors to hold riskier securities.

1-66
Illustrating diversification effects of a stock portfolio
# Stocks in Portfolio10 20 30 40 2,000+
Company-Specific Risk
Market Risk
20
0
Stand-Alone Risk, p
p (%)35
1-67
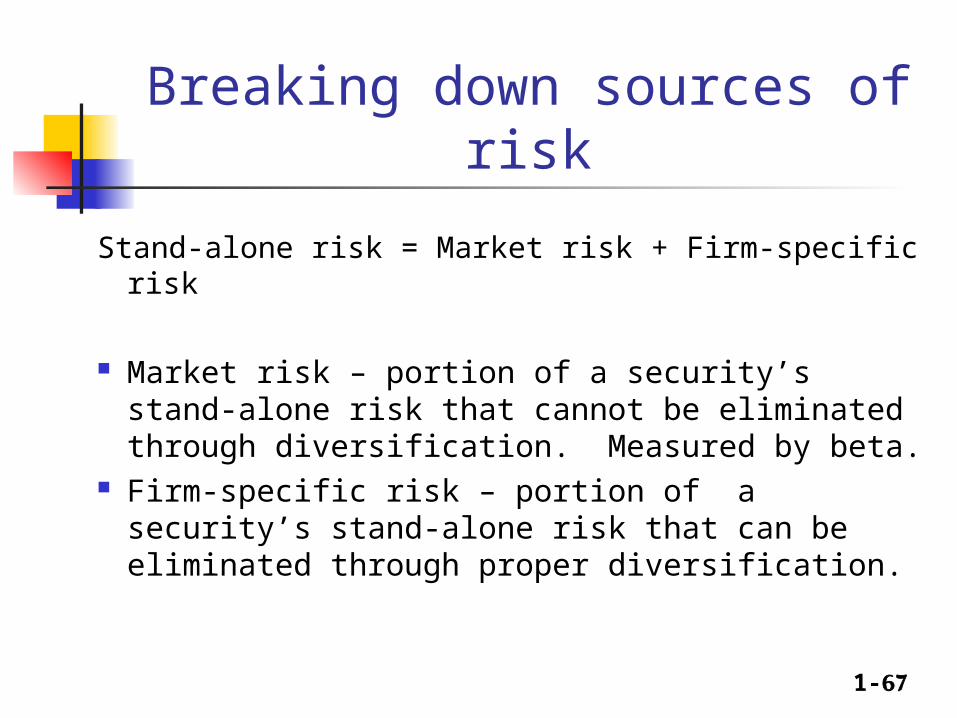
Breaking down sources of risk
Stand-alone risk = Market risk + Firm-specific risk
Market risk – portion of a security’s stand-alone risk that cannot be eliminated through diversification. Measured by beta.
Firm-specific risk – portion of a security’s stand-alone risk that can be eliminated through proper diversification.

1-68
Capital Asset Pricing Model
Model based upon concept that a stock’s required rate of return is equal to the risk-free rate of return plus a risk premium that reflects the riskiness of the stock after diversification.
Primary conclusion: The relevant riskiness of a stock is its contribution to the riskiness of a well-diversified portfolio.

1-69
Beta
Measures a stock’s market risk, and shows a stock’s volatility relative to the market.
Indicates how risky a stock is if the stock is held in a well-diversified portfolio.

1-70
Calculating betas
Run a regression of past returns of a security against past returns on the market.
The slope of the regression line (sometimes called the security’s characteristic line) is defined as the beta coefficient for the security.

1-71
Illustrating the calculation of beta
See Excel file

1-72
Comments on beta
If beta = 1.0, the security is just as risky as the average stock.
If beta > 1.0, the security is riskier than average. If beta < 1.0, the security is less risky than
average. Most stocks have betas in the range of 0.5 to 1.5.

1-73
Can the beta of a security be negative?
Yes, if the correlation between Stock i and the market is negative (i.e., ρi,m < 0).
If the correlation is negative, the regression line would slope downward, and the beta would be negative.
However, a negative beta is highly unlikely.

1-74
Beta coefficients
ki
_
kM
_
-20 0 20 40
40
20
-20
A: β = 1.30
T-bills: β = 0
B: β = -0.87

1-75
Comparing expected return and beta coefficients
Security Exp. Ret. Beta A 17.4% 1.30M 15.0 1.00C 13.8 0.89T-Bills 8.0 0.00B 1.7 -0.87
Riskier securities have higher returns, so the rank order is OK.

1-76
The Security Market Line (SML):
SML: ki = kRF + (kM – kRF) βi
Assume kRF = 8% and kM = 15%.
The market (or equity) risk premium is RPM
= kM – kRF = 15% – 8% = 7%.
1-77
What is the market risk premium?
Additional return over the risk-free rate needed to compensate investors for assuming an average amount of risk.
Its size depends on the perceived risk of the stock market and investors’ degree of risk aversion.
Varies from year to year, but most estimates suggest that it ranges between 4% and 8% per year.
1-78
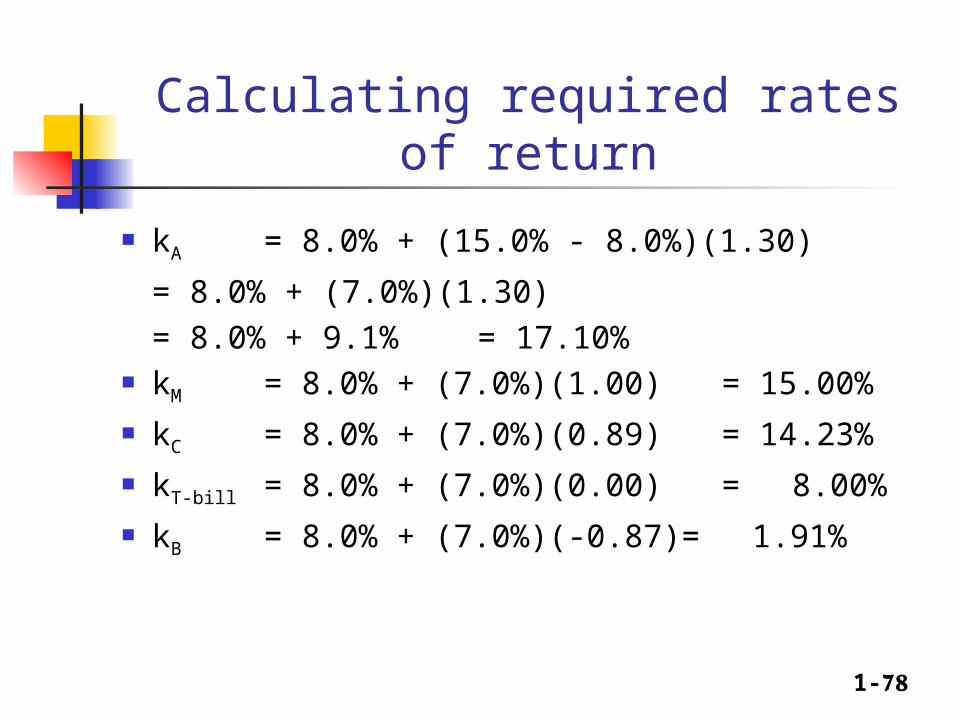
Calculating required rates of return
kA = 8.0% + (15.0% - 8.0%)(1.30)
= 8.0% + (7.0%)(1.30)
= 8.0% + 9.1% = 17.10% kM = 8.0% + (7.0%)(1.00) = 15.00%
kC = 8.0% + (7.0%)(0.89) = 14.23%
kT-bill = 8.0% + (7.0%)(0.00) = 8.00%
kB = 8.0% + (7.0%)(-0.87)= 1.91%

1-79
Expected vs. Required returns
k) k( Overvalued 1.9 1.7 GMC
k) k( uedFairly val 8.0 8.0 bills-T
k) k( Overvalued 14.2 13.8 VOIC
k) k( uedFairly val 15.0 15.0 PSE
k) k( alued Underv17.1% 17.4% PIIC
k k
^
^
^
^
^
^
1-80
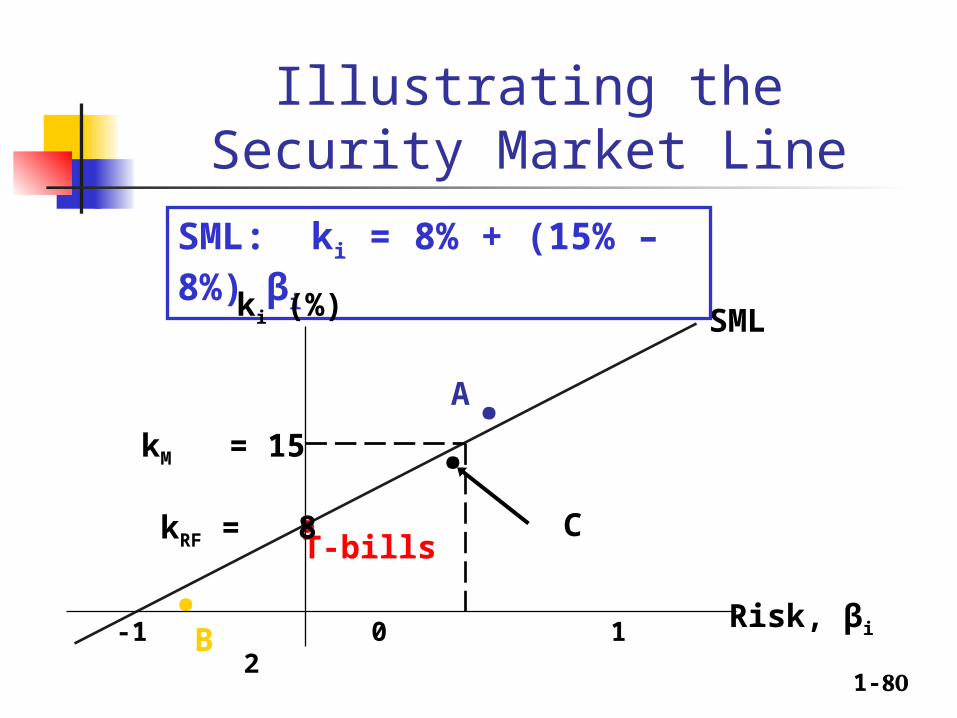
Illustrating the Security Market Line
..B
.A
T-bills
.C
SML
kM = 15
kRF = 8
-1 0 1 2
SML: ki = 8% + (15% – 8%) βi
ki (%)
Risk, βi