Embed Size (px)
Citation preview

1 1 Slide
Slide
© 2005 Thomson/South-Western© 2005 Thomson/South-Western
Chapter 13Chapter 13SimulationSimulation
Advantages and Disadvantages of Using Advantages and Disadvantages of Using SimulationSimulation
ModelingModeling Random Variables and Pseudo-Random Random Variables and Pseudo-Random
NumbersNumbers Time Increments Time Increments Simulation LanguagesSimulation Languages Validation and Statistical ConsiderationsValidation and Statistical Considerations ExamplesExamples

2 2 Slide
Slide
© 2005 Thomson/South-Western© 2005 Thomson/South-Western
SimulationSimulation
SimulationSimulation is one of the most frequently is one of the most frequently employed management science techniques. employed management science techniques.
It is typically used to model It is typically used to model random random processesprocesses that are too complex to be solved that are too complex to be solved by analytical methods.by analytical methods.

3 3 Slide
Slide
© 2005 Thomson/South-Western© 2005 Thomson/South-Western
Advantages of SimulationAdvantages of Simulation
Among the advantages of simulation is the Among the advantages of simulation is the ability to gain insightsability to gain insights into the model solution into the model solution which may be impossible to attain through which may be impossible to attain through other techniques. other techniques.
Also, once the simulation has been developed, Also, once the simulation has been developed, it provides a it provides a convenient experimental convenient experimental laboratorylaboratory to perform "what if" and sensitivity to perform "what if" and sensitivity analysis.analysis.

4 4 Slide
Slide
© 2005 Thomson/South-Western© 2005 Thomson/South-Western
Disadvantages of SimulationDisadvantages of Simulation
A large amount of time may be required to A large amount of time may be required to develop the simulation.develop the simulation.
There is no guarantee that the solution There is no guarantee that the solution obtained will actually be optimal. obtained will actually be optimal.
Simulation is, in effect, a Simulation is, in effect, a trial and error trial and error methodmethod of comparing different policy inputs. of comparing different policy inputs.
It does not determine if some input which was It does not determine if some input which was not considered could have provided a better not considered could have provided a better solution for the model.solution for the model.

5 5 Slide
Slide
© 2005 Thomson/South-Western© 2005 Thomson/South-Western
Simulation ModelingSimulation Modeling
One begins a simulation by developing a One begins a simulation by developing a mathematical statement of the problem. mathematical statement of the problem.
The model should be realistic yet solvable The model should be realistic yet solvable within the speed and storage constraints of within the speed and storage constraints of the computer system being used. the computer system being used.
Input values for the model as well as Input values for the model as well as probability estimates for the random probability estimates for the random variables must then be determined.variables must then be determined.
6 6 Slide
Slide
© 2005 Thomson/South-Western© 2005 Thomson/South-Western
Random VariablesRandom Variables
Random variable values are utilized in the model Random variable values are utilized in the model through a technique known as through a technique known as Monte Carlo Monte Carlo simulationsimulation. .
Each random variable is mapped to a set of Each random variable is mapped to a set of numbers so that each time one number in that numbers so that each time one number in that set is generated, the corresponding value of the set is generated, the corresponding value of the random variable is given as an input to the random variable is given as an input to the model. model.
The mapping is done in such a way that the The mapping is done in such a way that the likelihood that a particular number is chosen is likelihood that a particular number is chosen is the same as the probability that the the same as the probability that the corresponding value of the random variable corresponding value of the random variable occurs.occurs.
7 7 Slide
Slide
© 2005 Thomson/South-Western© 2005 Thomson/South-Western
Pseudo-Random NumbersPseudo-Random Numbers
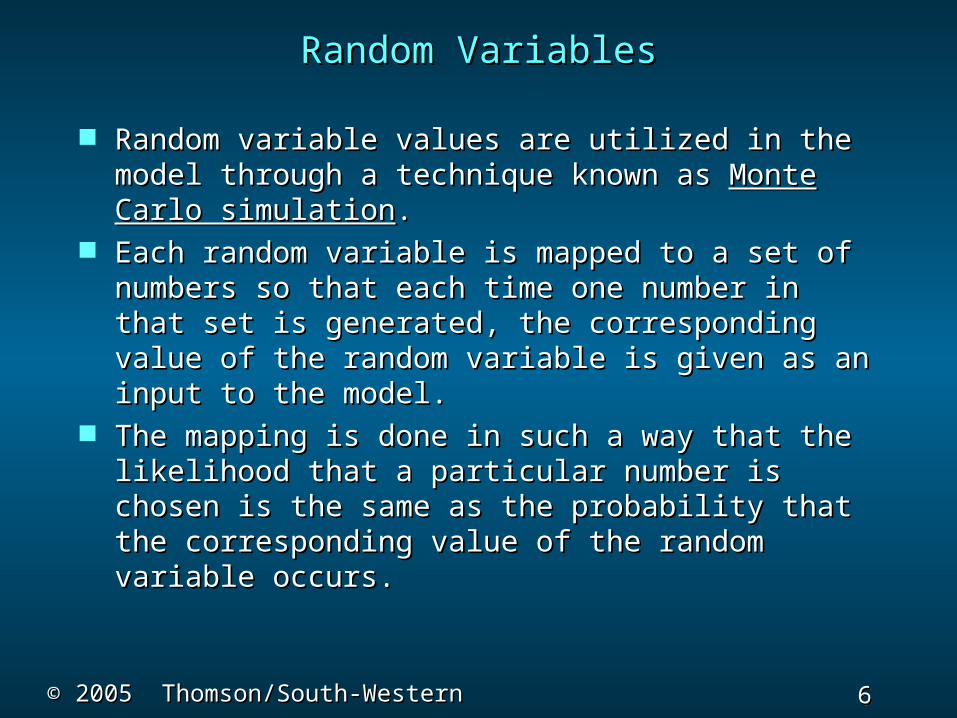
Because a computer program generates Because a computer program generates random numbers for the mapping according to random numbers for the mapping according to some formula, the numbers are not truly some formula, the numbers are not truly generated in a random fashion. generated in a random fashion.
However, using standard statistical tests, the However, using standard statistical tests, the numbers can be shown to appear to be drawn numbers can be shown to appear to be drawn from a random process. from a random process.
These numbers are called These numbers are called pseudo-random pseudo-random numbersnumbers. .

8 8 Slide
Slide
© 2005 Thomson/South-Western© 2005 Thomson/South-Western
Time IncrementsTime Increments
In a In a fixed-time simulation modelfixed-time simulation model, time , time periods are incremented by a fixed amount. periods are incremented by a fixed amount. For each time period a different set of data For each time period a different set of data from the input sequence is used to calculate from the input sequence is used to calculate the effects on the model.the effects on the model.
In a In a next-event simulation modelnext-event simulation model, time , time periods are not fixed but are determined by periods are not fixed but are determined by the data values from the input sequence.the data values from the input sequence.

9 9 Slide
Slide
© 2005 Thomson/South-Western© 2005 Thomson/South-Western
Simulation ProgramsSimulation Programs
The computer program that performs the The computer program that performs the simulation is called a simulation is called a simulatorsimulator. .
FlowchartsFlowcharts can be useful in writing such a can be useful in writing such a program. program.
While this program can be written in any While this program can be written in any general purpose language (e.g. BASIC, general purpose language (e.g. BASIC, FORTRAN, C++, etc.) special languages which FORTRAN, C++, etc.) special languages which reduce the amount of code which must be reduce the amount of code which must be written to perform the simulation have been written to perform the simulation have been developed. developed.
Special simulation languagesSpecial simulation languages include include SIMSCRIPT, SPSS, DYNAMO, and SLAM.SIMSCRIPT, SPSS, DYNAMO, and SLAM.

10 10 Slide
Slide
© 2005 Thomson/South-Western© 2005 Thomson/South-Western
Model Verification/ValidationModel Verification/Validation
Verification/validation of both the model and Verification/validation of both the model and the method used by the computer to carry out the method used by the computer to carry out the calculations is extremely important. the calculations is extremely important.
Models which do not reflect real world Models which do not reflect real world behavior cannot be expected to generate behavior cannot be expected to generate meaningful results. meaningful results.
Likewise, errors in programming can result in Likewise, errors in programming can result in nonsensical results. nonsensical results.

11 11 Slide
Slide
© 2005 Thomson/South-Western© 2005 Thomson/South-Western
Model Verification/ValidationModel Verification/Validation
Validation is generally done by having an Validation is generally done by having an expert review the model and the computer expert review the model and the computer code for errors.code for errors.
Ideally, the simulation should be run using Ideally, the simulation should be run using actual past data. actual past data.
Predictions from the simulation model should Predictions from the simulation model should be compared with historical results.be compared with historical results.

12 12 Slide
Slide
© 2005 Thomson/South-Western© 2005 Thomson/South-Western
Experimental DesignExperimental Design
Experimental designExperimental design is an important is an important consideration in the simulation process. consideration in the simulation process.
Issues such as the length of time of the Issues such as the length of time of the simulation and the treatment of initial data simulation and the treatment of initial data outputs from the model must be addressed outputs from the model must be addressed prior to collecting and analyzing output data. prior to collecting and analyzing output data.
Normally one is interested in results for the Normally one is interested in results for the steady state steady state (long run) operation of the system (long run) operation of the system being modeled.being modeled.
The initial data inputs to the simulation The initial data inputs to the simulation generally represent a generally represent a start-up periodstart-up period for the for the process and it may be important that the data process and it may be important that the data outputs for this start-up period be neglected outputs for this start-up period be neglected for predicting this long run behavior.for predicting this long run behavior.

13 13 Slide
Slide
© 2005 Thomson/South-Western© 2005 Thomson/South-Western
Experimental DesignExperimental Design
For each policy under consideration by the For each policy under consideration by the decision maker, the simulation is run by decision maker, the simulation is run by considering a long sequence of input data considering a long sequence of input data values (given by a pseudo-random number values (given by a pseudo-random number generator). generator).
Whenever possible, different policies should be Whenever possible, different policies should be compared by using the same sequence of compared by using the same sequence of input data.input data.

14 14 Slide
Slide
© 2005 Thomson/South-Western© 2005 Thomson/South-Western
The price change of shares of Dynogen, Inc.The price change of shares of Dynogen, Inc.has been observed over the past 50 trades. Thehas been observed over the past 50 trades. Thefrequency distribution is as follows:frequency distribution is as follows:
Price ChangePrice Change Number of TradesNumber of Trades -3/8 -3/8 4 4 -1/4 -1/4 2 2 -1/8 -1/8 8 8 0 200 20 +1/8 +1/8 10 10 +1/4 +1/4 3 3 +3/8 +3/8 2 2 +1/2 +1/2 1 1
Total = 50Total = 50
Example: Dynogen, Inc.Example: Dynogen, Inc.

15 15 Slide
Slide
© 2005 Thomson/South-Western© 2005 Thomson/South-Western
Example: Dynogen, Inc.Example: Dynogen, Inc.
Relative Frequency Distribution andRelative Frequency Distribution andRandom Number MappingRandom Number Mapping
Price ChangePrice Change Relative FrequencyRelative Frequency Random NumbersRandom Numbers -3/8 -3/8 .08 .08 00 - 07 00 - 07 -1/4 -1/4 .04 .04 08 - 11 08 - 11
-1/8 -1/8 .16 .16 12 - 27 12 - 27 0 0 .40 .40 28 - 67 28 - 67 +1/8 +1/8 .20 .20 68 - 87 68 - 87 +1/4 +1/4 .06 .06 88 - 93 88 - 93 +3/8 +3/8 .04 .04 94 - 97 94 - 97 +1/2 +1/2 .02 .02 98 - 99 98 - 99 Total 1.00Total 1.00

16 16 Slide
Slide
© 2005 Thomson/South-Western© 2005 Thomson/South-Western
Example: Dynogen, Inc.Example: Dynogen, Inc.
If the current price per share of If the current price per share of Dynogen isDynogen is
23, use random numbers to simulate the 23, use random numbers to simulate the price perprice per
share over the next 10 trades. share over the next 10 trades.
Use the following stream of random Use the following stream of random numbers:numbers:
21, 84, 07, 30, 94, 57, 57, 19, 84, 21, 84, 07, 30, 94, 57, 57, 19, 84, 8484
17 17 Slide
Slide
© 2005 Thomson/South-Western© 2005 Thomson/South-Western
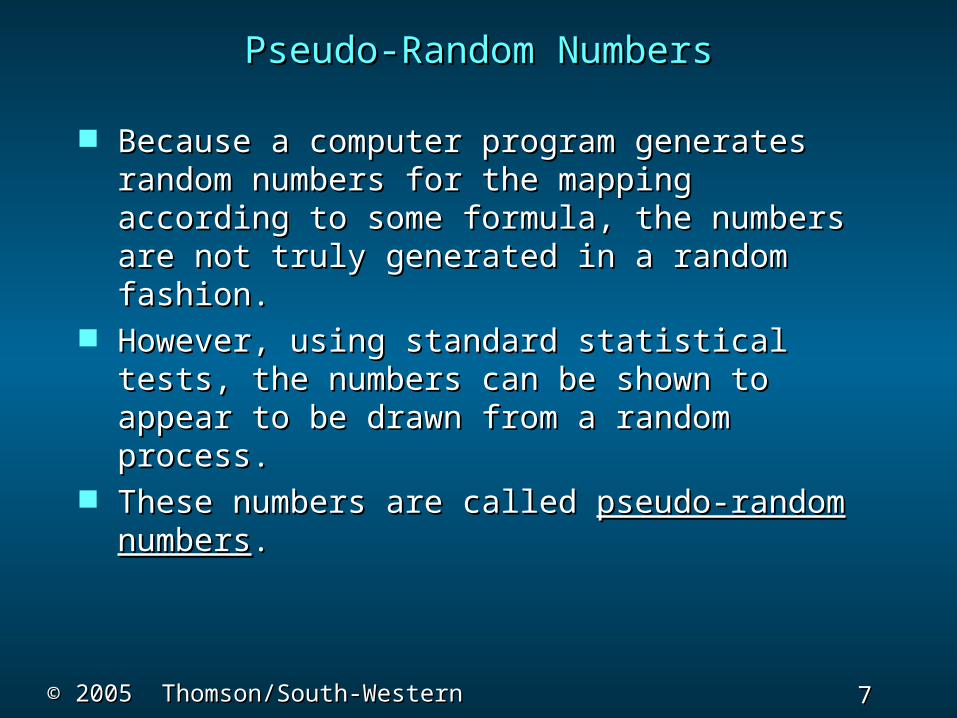
Example: Dynogen, Inc.Example: Dynogen, Inc.
Simulation WorksheetSimulation Worksheet
Trade Random Price StockTrade Random Price Stock
NumberNumber NumberNumber ChangeChange PricePrice 1 21 -1/8 22 1 21 -1/8 22 7/87/8 2 84 +1/8 232 84 +1/8 23 3 07 -3/8 22 3 07 -3/8 22 5/85/8 4 30 0 22 4 30 0 22 5/85/8 5 94 +3/8 235 94 +3/8 23 6 57 0 236 57 0 23 7 57 0 237 57 0 23 8 19 -1/8 22 8 19 -1/8 22 7/87/8 9 84 +1/8 239 84 +1/8 23 10 84 +1/8 23 10 84 +1/8 23 1/81/8

18 18 Slide
Slide
© 2005 Thomson/South-Western© 2005 Thomson/South-Western
Example: Dynogen, Inc.Example: Dynogen, Inc.
Spreadsheet for Stock Price SimulationSpreadsheet for Stock Price SimulationA B C D E F
1 Lower Upper Trade Price Stock2 Random Random Price Number Change Price3 Number Number Change 1 0.125 23.1254 0.00 0.08 -0.375 2 0.375 23.5005 0.08 0.12 -0.250 3 0.000 23.5006 0.12 0.28 -0.125 4 0.000 23.5007 0.28 0.68 0.000 5 0.000 23.5008 0.68 0.88 0.125 6 0.000 23.5009 0.88 0.94 0.250 7 0.125 23.625
10 0.94 0.98 0.375 8 0.125 23.75011 0.98 1.00 0.500 9 0.000 23.75012 10 0.125 23.875
A B C D E F1 Lower Upper Trade Price Stock2 Random Random Price Number Change Price3 Number Number Change 1 0.125 23.1254 0.00 0.08 -0.375 2 0.375 23.5005 0.08 0.12 -0.250 3 0.000 23.5006 0.12 0.28 -0.125 4 0.000 23.5007 0.28 0.68 0.000 5 0.000 23.5008 0.68 0.88 0.125 6 0.000 23.5009 0.88 0.94 0.250 7 0.125 23.625
10 0.94 0.98 0.375 8 0.125 23.75011 0.98 1.00 0.500 9 0.000 23.75012 10 0.125 23.875

19 19 Slide
Slide
© 2005 Thomson/South-Western© 2005 Thomson/South-Western
Example: Dynogen, Inc.Example: Dynogen, Inc.
Theoretical Results and Observed ResultsTheoretical Results and Observed Results
Based on the probability distribution, the Based on the probability distribution, the expected price change per trade can be calculated expected price change per trade can be calculated by: by:
(.08)(-3/8) + (.04)(-1/4) + (.16)(-1/8) + (.40)(0)(.08)(-3/8) + (.04)(-1/4) + (.16)(-1/8) + (.40)(0)
+ (.20)(1/8) + (.06)(1/4) + (.04)(3/8) + (.02)(1/2) + (.20)(1/8) + (.06)(1/4) + (.04)(3/8) + (.02)(1/2) = +.005= +.005
The expected price change for 10 trades is The expected price change for 10 trades is
(10)(.005) = .05. Hence, the expected stock price (10)(.005) = .05. Hence, the expected stock price
after 10 trades is 23 + .05 = 23.05. after 10 trades is 23 + .05 = 23.05.
Compare this ending price with the Compare this ending price with the
spreadsheet simulation and “manual” simulation spreadsheet simulation and “manual” simulation
results on the previous slides.results on the previous slides.

20 20 Slide
Slide
© 2005 Thomson/South-Western© 2005 Thomson/South-Western
Example: Mark Off’s ProcessExample: Mark Off’s Process
Mark Off is a specialist at repairing large Mark Off is a specialist at repairing large metal-metal-
cutting machines that use lasercutting machines that use laser
technology. His repairtechnology. His repair
territory consists of the citiesterritory consists of the cities
of Austin, San Antonio, andof Austin, San Antonio, and
Houston. His day-to-dayHouston. His day-to-day
repair assignment locationsrepair assignment locations
can be modeled as a Markovcan be modeled as a Markov
process. The transition matrix is shownprocess. The transition matrix is shown
on the next slide.on the next slide.

21 21 Slide
Slide
© 2005 Thomson/South-Western© 2005 Thomson/South-Western
Example: Mark Off’s ProcessExample: Mark Off’s Process
This Day’sThis Day’s Next Day's Next Day's LocationLocation
LocationLocation Austin San Antonio Austin San Antonio Houston Houston
Austin .60 .15 Austin .60 .15 .25 .25
San Antonio .20 .75 San Antonio .20 .75 .05 .05
Houston .15 .05 Houston .15 .05 .80 .80
22 22 Slide
Slide
© 2005 Thomson/South-Western© 2005 Thomson/South-Western
Example: Mark Off’s ProcessExample: Mark Off’s Process
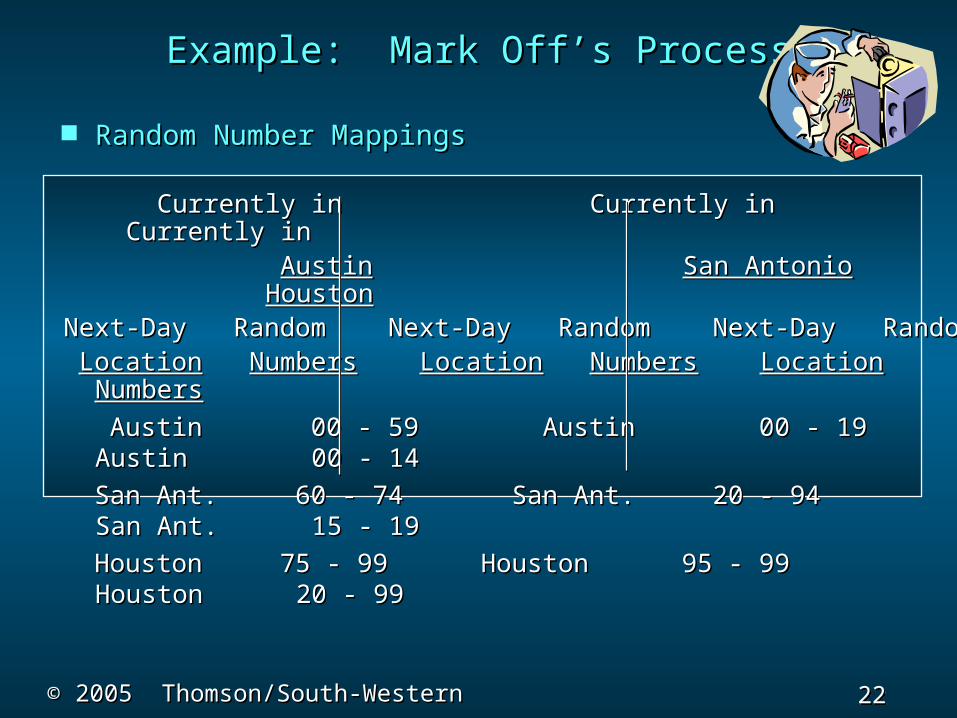
Random Number MappingsRandom Number Mappings
Currently in Currently in Currently inCurrently in Currently in Currently in AustinAustin San AntonioSan Antonio HoustonHoustonNext-Day Random Next-Day Random Next-Day Next-Day Random Next-Day Random Next-Day
RandomRandom LocationLocation NumbersNumbers LocationLocation NumbersNumbers LocationLocation
NumbersNumbers
Austin 00 - 59 Austin 00 - 19 Austin 00 Austin 00 - 59 Austin 00 - 19 Austin 00 - 14- 14
San Ant. 60 - 74 San Ant. 20 - 94 San Ant. 15 San Ant. 60 - 74 San Ant. 20 - 94 San Ant. 15 - 19- 19
Houston 75 - 99 Houston 95 - 99 Houston 20 Houston 75 - 99 Houston 95 - 99 Houston 20 - 99- 99

23 23 Slide
Slide
© 2005 Thomson/South-Western© 2005 Thomson/South-Western
Assume Mark is currently in Houston.Assume Mark is currently in Houston.
Simulate where Mark will be over the next 16 Simulate where Mark will be over the next 16 days.days.
What percentage of time will Mark be in each What percentage of time will Mark be in each of theof the
three cities? three cities?
Use the following random numbers:Use the following random numbers:
93, 63, 26, 16, 21, 26, 70, 55, 72, 89, 49, 64, 93, 63, 26, 16, 21, 26, 70, 55, 72, 89, 49, 64, 91, 02, 52, 6991, 02, 52, 69
Example: Mark Off’s ProcessExample: Mark Off’s Process

24 24 Slide
Slide
© 2005 Thomson/South-Western© 2005 Thomson/South-Western
Example: Mark Off’s ProcessExample: Mark Off’s Process
Simulation WorktableSimulation Worktable
Starting in HoustonStarting in Houston Random Day'sRandom Day's Random Day's Random Day's DayDay NumberNumber LocationLocation DayDay NumberNumber LocationLocation 1 93 Houston1 93 Houston 9 9 72 San Ant. 72 San Ant.
2 63 Houston2 63 Houston 10 10 89 89 San Ant. San Ant. 3 26 Houston3 26 Houston 11 11 49 49 San Ant. San Ant.
4 16 San Ant. 12 4 16 San Ant. 12 64 San Ant. 64 San Ant. 5 21 San Ant. 13 5 21 San Ant. 13 91 San Ant. 91 San Ant. 6 26 San Ant. 14 6 26 San Ant. 14 02 Austin 02 Austin 7 70 San Ant. 15 7 70 San Ant. 15 52 Austin 52 Austin 8 55 San Ant. 16 8 55 San Ant. 16 69 San Ant.69 San Ant.

25 25 Slide
Slide
© 2005 Thomson/South-Western© 2005 Thomson/South-Western
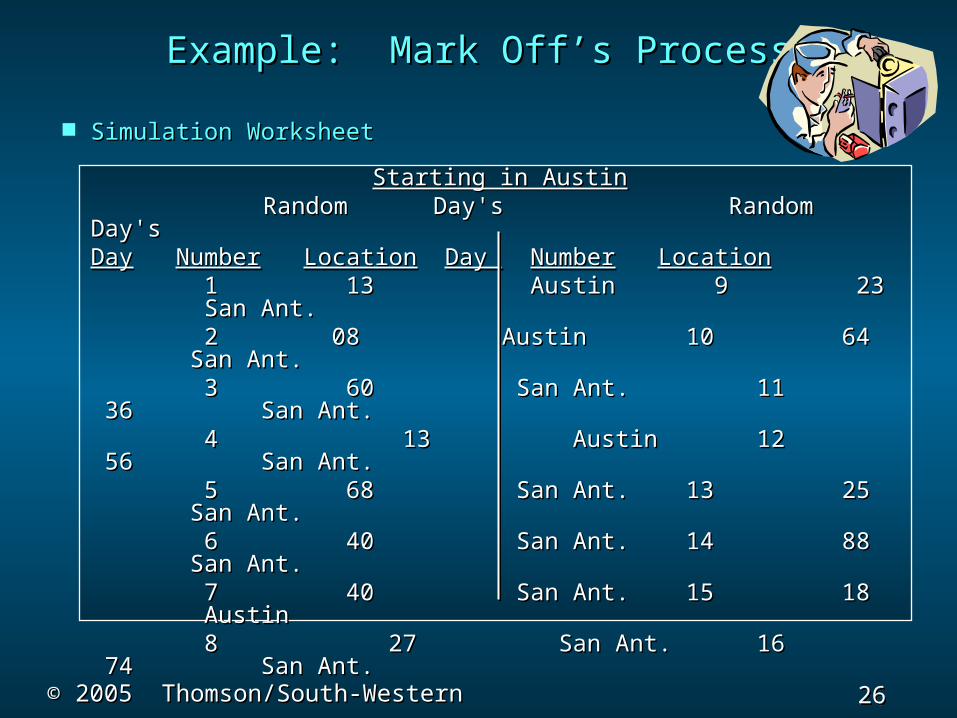
Repeat the simulation with Mark Repeat the simulation with Mark currentlycurrently
in Austin. Use the following random numbers:in Austin. Use the following random numbers:
13, 08, 60, 13, 68, 40, 40, 27, 23, 64, 36, 56, 13, 08, 60, 13, 68, 40, 40, 27, 23, 64, 36, 56, 25, 88, 18, 7425, 88, 18, 74
Compare the percentages with those Compare the percentages with those found with Mark starting in Houston.found with Mark starting in Houston.
Example: Mark Off’s ProcessExample: Mark Off’s Process
26 26 Slide
Slide
© 2005 Thomson/South-Western© 2005 Thomson/South-Western
Example: Mark Off’s ProcessExample: Mark Off’s Process
Simulation WorksheetSimulation Worksheet
Starting in AustinStarting in Austin Random Day's Random Day's Random Day's Random Day's
DayDay NumberNumber LocationLocation Day Day NumberNumber LocationLocation 1 13 Austin 1 13 Austin 9 23 San Ant. 9 23 San Ant. 22 08 Austin 08 Austin 10 10 64 San 64 San
Ant.Ant. 3 60 San Ant.3 60 San Ant. 11 36 San Ant. 11 36 San Ant. 4 4 13 Austin 13 Austin 12 56 San Ant. 12 56 San Ant. 5 68 San Ant.5 68 San Ant. 13 25 San Ant. 13 25 San Ant. 6 40 San Ant.6 40 San Ant. 14 88 San Ant. 14 88 San Ant. 7 40 San Ant.7 40 San Ant. 15 15 18 18
Austin Austin 8 8 27 San Ant. 27 San Ant. 16 74 San Ant. 16 74 San Ant.

27 27 Slide
Slide
© 2005 Thomson/South-Western© 2005 Thomson/South-Western
Example: Mark Off’s ProcessExample: Mark Off’s Process
Simulation SummarySimulation Summary
Starting in HoustonStarting in Houston
Austin = 2/16 = 12.50%Austin = 2/16 = 12.50%
San Antonio = 11/16 = 68.75% San Antonio = 11/16 = 68.75%
Houston = 3/16 = 18.75%Houston = 3/16 = 18.75%
Starting in AustinStarting in Austin
Austin = 4/16 = 25%Austin = 4/16 = 25%
San Antonio = 12/16 = 75%San Antonio = 12/16 = 75%
Houston = 0/16 = 0%Houston = 0/16 = 0%

28 28 Slide
Slide
© 2005 Thomson/South-Western© 2005 Thomson/South-Western
Example: Mark Off’s ProcessExample: Mark Off’s Process
Partial Spreadsheet w/Variable Look-up TablePartial Spreadsheet w/Variable Look-up TableA B C D E F G H I
123 LRN URN NDL LRN URN NDL LRN URN NDL6 0.00 0.60 Aus. 0.00 0.20 Aus. 0.00 0.15 Aus.7 0.60 0.75 S.A. 0.20 0.95 S.A. 0.15 0.20 S.A.8 0.75 1.00 Hou. 0.95 1.00 Hou. 0.20 1.00 Hou.9
Aus. S.A. Hou.Current Location
A B C D E F G H I123 LRN URN NDL LRN URN NDL LRN URN NDL6 0.00 0.60 Aus. 0.00 0.20 Aus. 0.00 0.15 Aus.7 0.60 0.75 S.A. 0.20 0.95 S.A. 0.15 0.20 S.A.8 0.75 1.00 Hou. 0.95 1.00 Hou. 0.20 1.00 Hou.9
Aus. S.A. Hou.Current Location
LRN = Lower Random Number URN = Upper Random NumberNDL = Next-Day Location
29 29 Slide
Slide
© 2005 Thomson/South-Western© 2005 Thomson/South-Western
Example: Mark Off’s ProcessExample: Mark Off’s Process
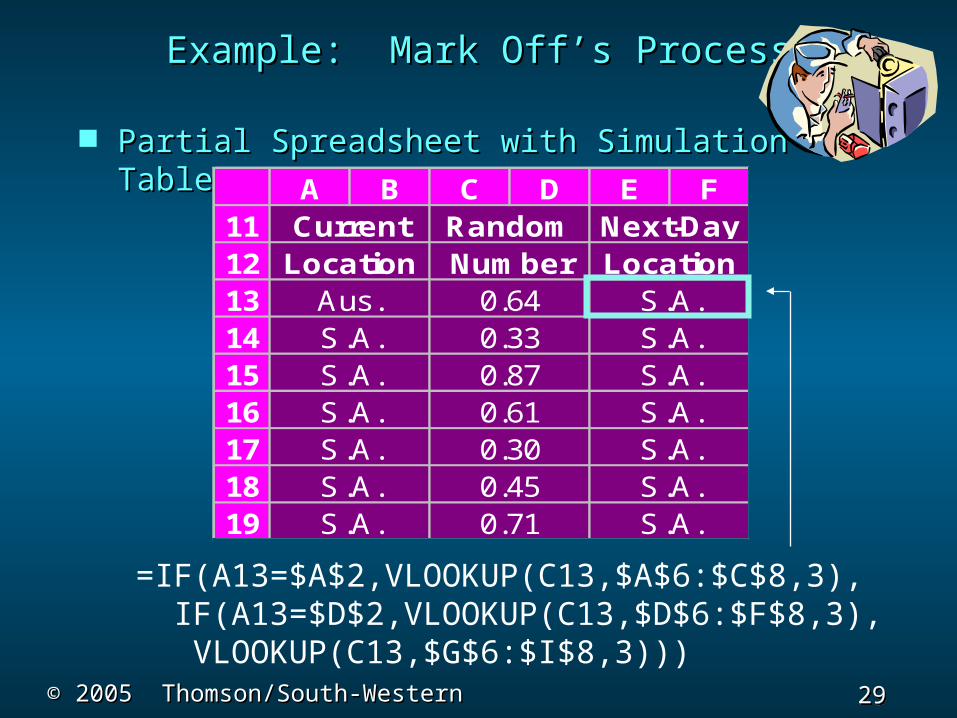
Partial Spreadsheet with Simulation TablePartial Spreadsheet with Simulation Table
=IF(A13=$A$2,VLOOKUP(C13,$A$6:$C$8,3), IF(A13=$D$2,VLOOKUP(C13,$D$6:$F$8,3),
VLOOKUP(C13,$G$6:$I$8,3)))
A B C D E F111213141516171819
Next-Day
S.A.
S.A.
S.A. 0.61 S.A.
Number
0.33
CurrentLocation
Random
S.A.0.45
S.A.
LocationAus. 0.64 S.A.
S.A. 0.87 S.A.
S.A.S.A.S.A.
0.30
0.71S.A.

30 30 Slide
Slide
© 2005 Thomson/South-Western© 2005 Thomson/South-Western
Example: Wayne International AirportExample: Wayne International Airport
Wayne International Airport primarily Wayne International Airport primarily servesserves
domestic air traffic. Occasionally, however, domestic air traffic. Occasionally, however,
a chartered plane from abroad will arrivea chartered plane from abroad will arrive
with passengers bound for Wayne's twowith passengers bound for Wayne's two
great amusement parks, Algorithmlandgreat amusement parks, Algorithmland
and Giffith's Cherry Preserve.and Giffith's Cherry Preserve.
Whenever an international planeWhenever an international plane
arrives at the airport the two customsarrives at the airport the two customs
inspectors on duty set up operations toinspectors on duty set up operations to
process the passengers.process the passengers.

31 31 Slide
Slide
© 2005 Thomson/South-Western© 2005 Thomson/South-Western
Example: Wayne International AirportExample: Wayne International Airport
Incoming passengers must first have Incoming passengers must first have theirtheir
passports and visas checked. This is handled passports and visas checked. This is handled byby
one inspector. The time required to checkone inspector. The time required to check
a passenger's passports and visas can bea passenger's passports and visas can be
described by the probability distributiondescribed by the probability distribution
on the next slide.on the next slide.

32 32 Slide
Slide
© 2005 Thomson/South-Western© 2005 Thomson/South-Western
Example: Wayne International AirportExample: Wayne International Airport
Time Required toTime Required to Check a Passenger'sCheck a Passenger's Passport and VisaPassport and Visa ProbabilityProbability
20 seconds 20 seconds .20.20
40 seconds 40 seconds .40.40
60 seconds 60 seconds .30.30
80 seconds 80 seconds .10.10

33 33 Slide
Slide
© 2005 Thomson/South-Western© 2005 Thomson/South-Western
After having their passports and visas After having their passports and visas checked,checked,
the passengers next proceed to the second the passengers next proceed to the second customscustoms
official who does baggage inspections. official who does baggage inspections. Passengers formPassengers form
a single waiting line with the official inspectinga single waiting line with the official inspecting
baggage on a first come, first served basis. The baggage on a first come, first served basis. The timetime
required for baggage inspection follows the required for baggage inspection follows the probabilityprobability
distribution shown on the next slide.distribution shown on the next slide.
Example: Wayne International AirportExample: Wayne International Airport

34 34 Slide
Slide
© 2005 Thomson/South-Western© 2005 Thomson/South-Western
Time Required ForTime Required For Baggage InspectionBaggage Inspection ProbabilityProbability
No Time No Time .25 .25 1 minute 1 minute .60 .60 2 minutes 2 minutes .10 .10 3 minutes 3 minutes .05 .05
Example: Wayne International AirportExample: Wayne International Airport

35 35 Slide
Slide
© 2005 Thomson/South-Western© 2005 Thomson/South-Western
Example: Wayne International AirportExample: Wayne International Airport
Random Number MappingRandom Number Mapping
Time Required toTime Required to Check a Passenger's RandomCheck a Passenger's Random Passport and VisaPassport and Visa ProbabilityProbability NumbersNumbers
20 seconds .20 00 - 20 seconds .20 00 - 1919
40 seconds .40 40 seconds .40 20 - 5920 - 59
60 seconds .30 60 seconds .30 60 - 8960 - 89
80 seconds .10 80 seconds .10 90 - 9990 - 99
36 36 Slide
Slide
© 2005 Thomson/South-Western© 2005 Thomson/South-Western
Example: Wayne International AirportExample: Wayne International Airport
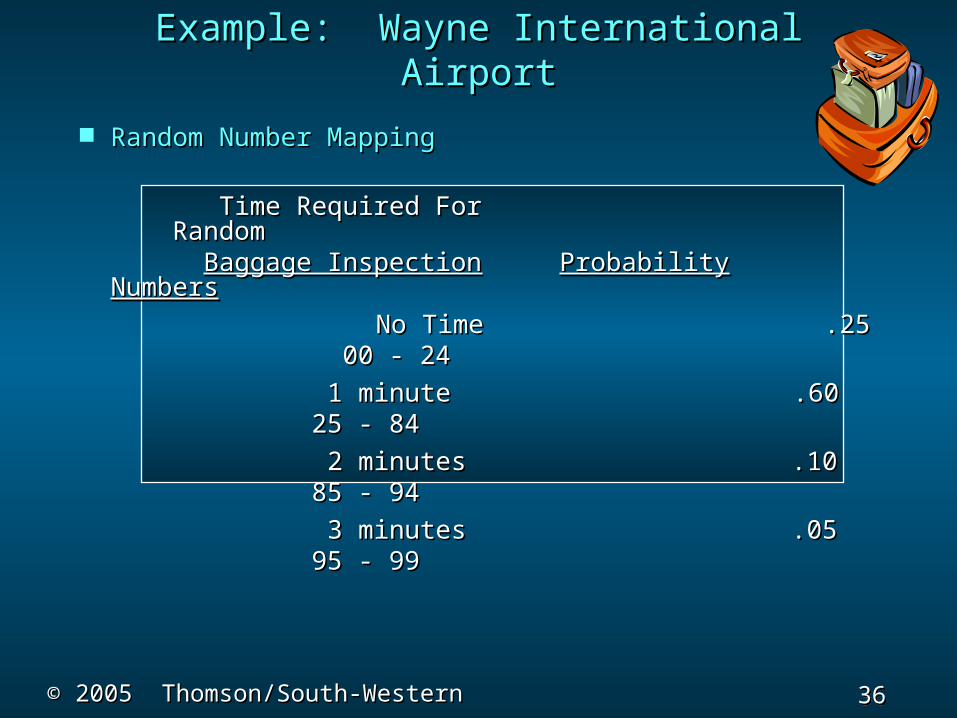
Random Number MappingRandom Number Mapping
Time Required For Time Required For RandomRandom Baggage InspectionBaggage Inspection ProbabilityProbability NumbersNumbers
No Time .25 00 - No Time .25 00 - 2424
1 minute 1 minute .60 25 .60 25 - 84- 84
2 minutes .10 85 - 2 minutes .10 85 - 9494
3 minutes .05 95 - 3 minutes .05 95 - 9999

37 37 Slide
Slide
© 2005 Thomson/South-Western© 2005 Thomson/South-Western
Example: Wayne International AirportExample: Wayne International Airport
Next-Event Simulation RecordsNext-Event Simulation Records
For each passenger the following For each passenger the following information must be recorded:information must be recorded:
• When his service begins at the passport When his service begins at the passport control inspectioncontrol inspection
• The length of time for this serviceThe length of time for this service
• When his service begins at the baggage When his service begins at the baggage inspectioninspection
• The length of time for this serviceThe length of time for this service

38 38 Slide
Slide
© 2005 Thomson/South-Western© 2005 Thomson/South-Western
Example: Wayne International AirportExample: Wayne International Airport
Time RelationshipsTime Relationships
Time a passenger begins serviceTime a passenger begins service
by the passport inspectorby the passport inspector
= (Time the previous passenger started = (Time the previous passenger started passport service) passport service)
+ (Time of previous passenger's passport + (Time of previous passenger's passport service)service)

39 39 Slide
Slide
© 2005 Thomson/South-Western© 2005 Thomson/South-Western
Example: Wayne International AirportExample: Wayne International Airport
Time RelationshipsTime Relationships
Time a passenger begins serviceTime a passenger begins service by the baggage inspectorby the baggage inspector
( If passenger does not wait in line for baggage ( If passenger does not wait in line for baggage inspection)inspection)
= (Time passenger completes service= (Time passenger completes service with the passport control inspector) with the passport control inspector)
(If the passenger does wait in line for baggage (If the passenger does wait in line for baggage inspection)inspection)
= (Time previous passenger completes= (Time previous passenger completes service with the baggage inspector)service with the baggage inspector)

40 40 Slide
Slide
© 2005 Thomson/South-Western© 2005 Thomson/South-Western
Example: Wayne International AirportExample: Wayne International Airport
Time RelationshipsTime Relationships
Time a customer completes serviceTime a customer completes service
at the baggage inspectorat the baggage inspector
= (Time customer begins service with baggage = (Time customer begins service with baggage inspector) + (Time required for baggage inspector) + (Time required for baggage inspection)inspection)

41 41 Slide
Slide
© 2005 Thomson/South-Western© 2005 Thomson/South-Western
A chartered plane from abroad lands atA chartered plane from abroad lands at
Wayne Airport with 80 passengers. Simulate theWayne Airport with 80 passengers. Simulate the
processing of the first 10 passengers through processing of the first 10 passengers through customs. customs.
Use the following random numbers:Use the following random numbers:
For passport control:For passport control:
93, 63, 26, 16, 21, 26, 70, 55, 72, 8993, 63, 26, 16, 21, 26, 70, 55, 72, 89
For baggage inspection:For baggage inspection:
13, 08, 60, 13, 68, 40, 40, 27, 23, 6413, 08, 60, 13, 68, 40, 40, 27, 23, 64
Example: Wayne International AirportExample: Wayne International Airport
42 42 Slide
Slide
© 2005 Thomson/South-Western© 2005 Thomson/South-Western
Example: Wayne International AirportExample: Wayne International Airport
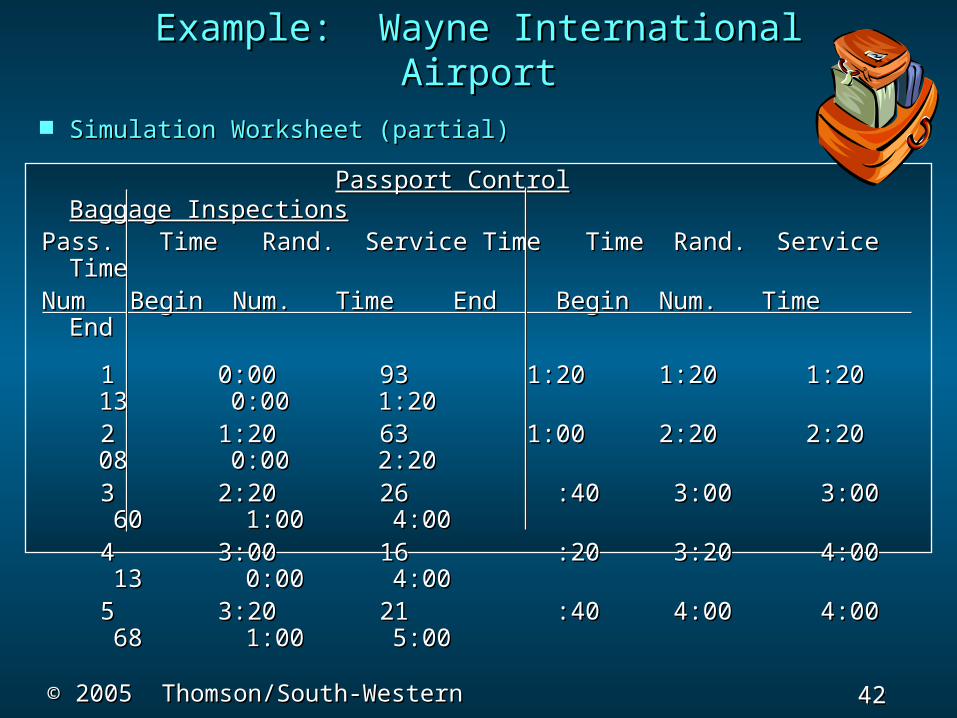
Simulation Worksheet (partial)Simulation Worksheet (partial)
Passport ControlPassport Control Baggage InspectionsBaggage InspectionsPass. Time Rand. Service Time Time Rand. Service Pass. Time Rand. Service Time Time Rand. Service
TimeTimeNum Begin Num. Time End Begin Num. Time EndNum Begin Num. Time End Begin Num. Time End
1 0:00 93 1:20 1:20 1:20 13 0:00 1 0:00 93 1:20 1:20 1:20 13 0:00 1:20 1:20
2 1:20 63 1:00 2:20 2:20 08 0:00 2 1:20 63 1:00 2:20 2:20 08 0:00 2:20 2:20
3 2:20 26 :40 3:00 3:00 60 1:00 3 2:20 26 :40 3:00 3:00 60 1:00 4:00 4:00
4 3:00 16 :20 3:20 4:00 13 0:00 4 3:00 16 :20 3:20 4:00 13 0:00 4:00 4:00
5 3:20 21 :40 4:00 4:00 68 1:00 5 3:20 21 :40 4:00 4:00 68 1:00 5:00 5:00

43 43 Slide
Slide
© 2005 Thomson/South-Western© 2005 Thomson/South-Western
Example: Wayne International AirportExample: Wayne International Airport
Simulation Worksheet (continued)Simulation Worksheet (continued)
Passport ControlPassport Control Baggage InspectionsBaggage InspectionsPass. Time Rand. Service Time Time Rand. Service TimePass. Time Rand. Service Time Time Rand. Service TimeNum Begin Num. Time End Begin Num. Time EndNum Begin Num. Time End Begin Num. Time End
6 4:00 26 :40 4:40 5:00 40 1:00 6 4:00 26 :40 4:40 5:00 40 1:00 6:00 6:00
7 4:40 70 1:00 5:40 6:00 40 1:00 7 4:40 70 1:00 5:40 6:00 40 1:00 7:00 7:00
8 5:40 55 :40 6:20 7:00 27 1:00 8 5:40 55 :40 6:20 7:00 27 1:00 8:00 8:00
9 6:20 72 1:00 7:20 8:00 23 0:00 9 6:20 72 1:00 7:20 8:00 23 0:00 8:00 8:00
10 7:20 89 1:00 8:20 8:20 64 1:00 10 7:20 89 1:00 8:20 8:20 64 1:00 9:20 9:20

44 44 Slide
Slide
© 2005 Thomson/South-Western© 2005 Thomson/South-Western
Example: Wayne International AirportExample: Wayne International Airport
ExplanationExplanation
For example, passenger 1 begins being For example, passenger 1 begins being served by the passport ontrol inspector served by the passport ontrol inspector immediately. His service time is 1:20 (80 immediately. His service time is 1:20 (80 seconds) at which time he goes immediately to seconds) at which time he goes immediately to the baggage inspector who waves him through the baggage inspector who waves him through without inspection. without inspection.
Passenger 2 begins service with passport Passenger 2 begins service with passport inspector 1:20 minutes (80 seconds) after inspector 1:20 minutes (80 seconds) after arriving there (as this is when passenger 1 is arriving there (as this is when passenger 1 is finished) and requires 1:00 minute (60 seconds) finished) and requires 1:00 minute (60 seconds) for passport inspection. He is waved through for passport inspection. He is waved through baggage inspection as well. baggage inspection as well.
This process continues in this manner.This process continues in this manner.

45 45 Slide
Slide
© 2005 Thomson/South-Western© 2005 Thomson/South-Western
Example: Wayne International AirportExample: Wayne International Airport
QuestionQuestion
How long will it take for the first 10 How long will it take for the first 10 passengers to clear customs?passengers to clear customs?
AnswerAnswer
Passenger 10 clears customs after 9 Passenger 10 clears customs after 9 minutes and 20 seconds.minutes and 20 seconds.

46 46 Slide
Slide
© 2005 Thomson/South-Western© 2005 Thomson/South-Western
Example: Wayne International AirportExample: Wayne International Airport
QuestionQuestion
What is the average length of time a What is the average length of time a customer waits before having his bags customer waits before having his bags inspected after he clears passport control? inspected after he clears passport control? How is this estimate biased?How is this estimate biased?
47 47 Slide
Slide
© 2005 Thomson/South-Western© 2005 Thomson/South-Western
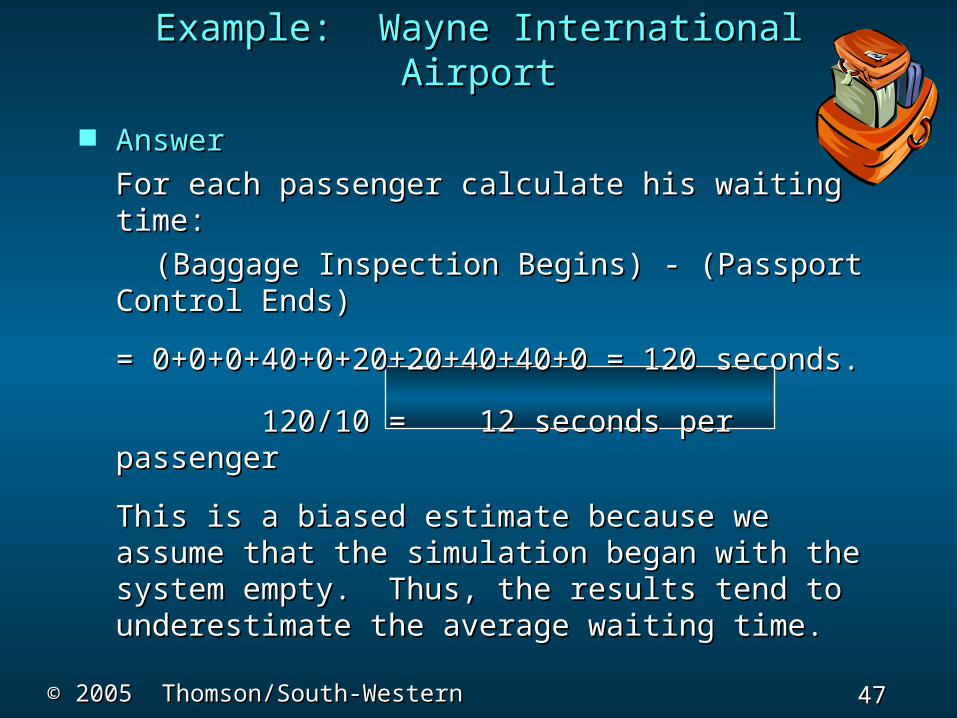
AnswerAnswer
For each passenger calculate his waiting For each passenger calculate his waiting time:time:
(Baggage Inspection Begins) - (Passport Control (Baggage Inspection Begins) - (Passport Control Ends) Ends)
= 0+0+0+40+0+20+20+40+40+0 = 120 = 0+0+0+40+0+20+20+40+40+0 = 120 seconds. seconds.
120/10 = 12 seconds per passenger 120/10 = 12 seconds per passenger
This is a biased estimate because we This is a biased estimate because we assume that the simulation began with the assume that the simulation began with the system empty. Thus, the results tend to system empty. Thus, the results tend to underestimate the average waiting time.underestimate the average waiting time.
Example: Wayne International AirportExample: Wayne International Airport
48 48 Slide
Slide
© 2005 Thomson/South-Western© 2005 Thomson/South-Western
End of Chapter 13End of Chapter 13