Embed Size (px)
Citation preview

1 1 Slide
Slide
© 2007 Thomson South-Western. All Rights Reserved© 2007 Thomson South-Western. All Rights Reserved
Chapter 8Chapter 8Interval EstimationInterval Estimation
Population Mean: Population Mean: Known Known Population Mean: Population Mean: Unknown Unknown Determining the Sample SizeDetermining the Sample Size Population ProportionPopulation Proportion

2 2 Slide
Slide
© 2007 Thomson South-Western. All Rights Reserved© 2007 Thomson South-Western. All Rights Reserved
A point estimator cannot be expected to provide theA point estimator cannot be expected to provide the exact value of the population parameter.exact value of the population parameter. A point estimator cannot be expected to provide theA point estimator cannot be expected to provide the exact value of the population parameter.exact value of the population parameter.
An An interval estimateinterval estimate can be computed by adding and can be computed by adding and subtracting a subtracting a margin of errormargin of error to the point estimate. to the point estimate.
An An interval estimateinterval estimate can be computed by adding and can be computed by adding and subtracting a subtracting a margin of errormargin of error to the point estimate. to the point estimate.
Point Estimate +/Point Estimate +/ Margin of Error Margin of Error
The purpose of an interval estimate is to provideThe purpose of an interval estimate is to provide information about how close the point estimate is toinformation about how close the point estimate is to the value of the parameter.the value of the parameter.
The purpose of an interval estimate is to provideThe purpose of an interval estimate is to provide information about how close the point estimate is toinformation about how close the point estimate is to the value of the parameter.the value of the parameter.
Margin of Error and the Interval EstimateMargin of Error and the Interval Estimate

3 3 Slide
Slide
© 2007 Thomson South-Western. All Rights Reserved© 2007 Thomson South-Western. All Rights Reserved
The general form of an interval estimate of aThe general form of an interval estimate of a population mean ispopulation mean is
The general form of an interval estimate of aThe general form of an interval estimate of a population mean ispopulation mean is
Margin of Errorx Margin of Errorx
Margin of Error and the Interval EstimateMargin of Error and the Interval Estimate

4 4 Slide
Slide
© 2007 Thomson South-Western. All Rights Reserved© 2007 Thomson South-Western. All Rights Reserved
Interval Estimation of a Population Mean:Interval Estimation of a Population Mean: Known Known
In order to develop an interval estimate of a In order to develop an interval estimate of a population mean, the margin of error must be population mean, the margin of error must be computed using either:computed using either:
• the population standard deviation the population standard deviation , or , or
• the sample standard deviation the sample standard deviation ss is rarely known exactly, but often a good is rarely known exactly, but often a good
estimate can be obtained based on historical estimate can be obtained based on historical data or other information.data or other information.
We refer to such cases as the We refer to such cases as the known known case. case.

5 5 Slide
Slide
© 2007 Thomson South-Western. All Rights Reserved© 2007 Thomson South-Western. All Rights Reserved
There is a 1 There is a 1 probability that the value of a probability that the value of asample mean will provide a margin of error of sample mean will provide a margin of error of or less.or less.
z x /2z x /2
/2/2 /2/21 - of all values1 - of all valuesxx
Sampling distribution of
Sampling distribution of xx
xx
z x /2z x /2z x /2z x /2
Interval Estimation of a Population Mean:Interval Estimation of a Population Mean: Known Known

6 6 Slide
Slide
© 2007 Thomson South-Western. All Rights Reserved© 2007 Thomson South-Western. All Rights Reserved
Interval Estimate ofInterval Estimate of
Interval Estimate of a Population Mean:Interval Estimate of a Population Mean: Known Known
x zn
/2x zn
/2
where: is the sample meanwhere: is the sample mean 1 -1 - is the confidence coefficient is the confidence coefficient zz/2 /2 is the is the zz value providing an area of value providing an area of /2 in the upper tail of the standard /2 in the upper tail of the standard
normal probability distributionnormal probability distribution is the population standard deviationis the population standard deviation nn is the sample size is the sample size
xx
Margin of Margin of errorerror
7 7 Slide
Slide
© 2007 Thomson South-Western. All Rights Reserved© 2007 Thomson South-Western. All Rights Reserved
Interval Estimation of a Population Mean:Interval Estimation of a Population Mean:ss Known Known
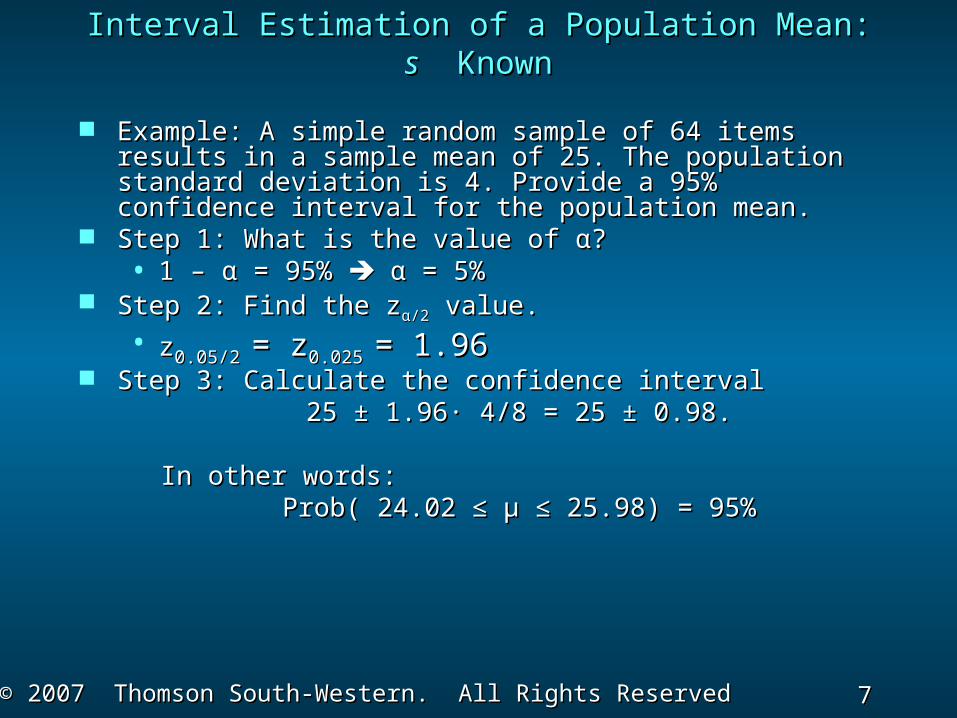
Example: A simple random sample of 64 items results in Example: A simple random sample of 64 items results in a sample mean of 25. The population standard deviation a sample mean of 25. The population standard deviation is 4. Provide a 95% confidence interval for the is 4. Provide a 95% confidence interval for the population mean.population mean.
Step 1: What is the value of Step 1: What is the value of α? α? • 1 – 1 – α = 95% α = 95% α = 5% α = 5%
Step 2: Find the zStep 2: Find the zαα/2/2 value. value.• zz0.05/2 0.05/2 = z= z0.025 0.025 = 1.96= 1.96
Step 3: Calculate the confidence intervalStep 3: Calculate the confidence interval 25 ± 1.96· 4/8 = 25 ± 0.98.25 ± 1.96· 4/8 = 25 ± 0.98.
In other words:In other words: Prob( 24.02 ≤ Prob( 24.02 ≤ μμ ≤ 25.98) = 95% ≤ 25.98) = 95%

8 8 Slide
Slide
© 2007 Thomson South-Western. All Rights Reserved© 2007 Thomson South-Western. All Rights Reserved
Interval Estimate of a Population Mean:Interval Estimate of a Population Mean: Known Known
Adequate Sample SizeAdequate Sample Size
In general, a sample size of In general, a sample size of nn = 30 is adequate. = 30 is adequate. In general, a sample size of In general, a sample size of nn = 30 is adequate. = 30 is adequate.
If the population distribution is highly skewed orIf the population distribution is highly skewed or contains outliers, a sample size of 50 or more iscontains outliers, a sample size of 50 or more is recommended.recommended.
If the population distribution is highly skewed orIf the population distribution is highly skewed or contains outliers, a sample size of 50 or more iscontains outliers, a sample size of 50 or more is recommended.recommended.

9 9 Slide
Slide
© 2007 Thomson South-Western. All Rights Reserved© 2007 Thomson South-Western. All Rights Reserved
Interval Estimate of a Population Mean:Interval Estimate of a Population Mean: Known Known
Adequate Sample Size (continued)Adequate Sample Size (continued)
If the population is believed to be at leastIf the population is believed to be at least approximately normal, a sample size of less than 15approximately normal, a sample size of less than 15 can be used.can be used.
If the population is believed to be at leastIf the population is believed to be at least approximately normal, a sample size of less than 15approximately normal, a sample size of less than 15 can be used.can be used.
If the population is not normally distributed but isIf the population is not normally distributed but is roughly symmetric, a sample size as small as 15 roughly symmetric, a sample size as small as 15 will suffice.will suffice.
If the population is not normally distributed but isIf the population is not normally distributed but is roughly symmetric, a sample size as small as 15 roughly symmetric, a sample size as small as 15 will suffice.will suffice.

10 10 Slide
Slide
© 2007 Thomson South-Western. All Rights Reserved© 2007 Thomson South-Western. All Rights Reserved
Interval Estimation of a Population Mean:Interval Estimation of a Population Mean: Unknown Unknown
If an estimate of the population standard deviation If an estimate of the population standard deviation cannot be developed prior to sampling, we use cannot be developed prior to sampling, we use the sample standard deviation the sample standard deviation ss to estimate to estimate . .
This is the This is the unknown unknown case. case. Main difference with the “Main difference with the “σσ known” known” casecase
The interval estimate for The interval estimate for is based on the is based on the tt distribution.distribution.

11 11 Slide
Slide
© 2007 Thomson South-Western. All Rights Reserved© 2007 Thomson South-Western. All Rights Reserved
tt Distribution Distribution
A specific A specific tt distribution depends on a parameter distribution depends on a parameter known as the known as the degrees of freedomdegrees of freedom.. A specific A specific tt distribution depends on a parameter distribution depends on a parameter known as the known as the degrees of freedomdegrees of freedom..
Degrees of freedom refer to the number of Degrees of freedom refer to the number of independent pieces of information that go into theindependent pieces of information that go into the computation of computation of ss..
Degrees of freedom refer to the number of Degrees of freedom refer to the number of independent pieces of information that go into theindependent pieces of information that go into the computation of computation of ss..
The more degrees of freedom The more degrees of freedom The less dispersion. The less dispersion. The more degrees of freedom The more degrees of freedom The less dispersion. The less dispersion.
The more degrees of freedom The more degrees of freedom The smaller the The smaller the difference between the difference between the tt and the standard normal and the standard normal distribution..distribution..
The more degrees of freedom The more degrees of freedom The smaller the The smaller the difference between the difference between the tt and the standard normal and the standard normal distribution..distribution..

12 12 Slide
Slide
© 2007 Thomson South-Western. All Rights Reserved© 2007 Thomson South-Western. All Rights Reserved
tt Distribution Distribution
StandardStandardnormalnormal
distributiondistribution
tt distributiondistribution(20 degrees(20 degreesof freedom)of freedom)
tt distributiondistribution(10 degrees(10 degrees
of of freedom)freedom)
00zz, , tt

13 13 Slide
Slide
© 2007 Thomson South-Western. All Rights Reserved© 2007 Thomson South-Western. All Rights Reserved
For more than 100 degrees of freedomFor more than 100 degrees of freedom, the standard, the standard normal normal zz value provides a good approximation to value provides a good approximation to the the tt value. value.
For more than 100 degrees of freedomFor more than 100 degrees of freedom, the standard, the standard normal normal zz value provides a good approximation to value provides a good approximation to the the tt value. value.
tt Distribution Distribution

14 14 Slide
Slide
© 2007 Thomson South-Western. All Rights Reserved© 2007 Thomson South-Western. All Rights Reserved
Interval EstimateInterval Estimate
x tsn
/2x tsn
/2
where: 1 -where: 1 - = the confidence coefficient = the confidence coefficient
tt/2 /2 == the the tt value providing an area of value providing an area of /2/2 in the upper tail of a in the upper tail of a t t distribution distribution with with nn - 1 - 1 degrees of freedom degrees of freedom ss = the sample standard deviation = the sample standard deviation
Interval Estimation of a Population Mean:Interval Estimation of a Population Mean: Unknown Unknown
Margin of Margin of errorerror

15 15 Slide
Slide
© 2007 Thomson South-Western. All Rights Reserved© 2007 Thomson South-Western. All Rights Reserved
Interval Estimation of a Population Mean:Interval Estimation of a Population Mean:ss Unknown Unknown
Example: A simple random sample of 64 items results in Example: A simple random sample of 64 items results in a sample mean of 25. The a sample mean of 25. The samplesample standard deviation is standard deviation is 4. Provide a 95% confidence interval for the population 4. Provide a 95% confidence interval for the population mean.mean.
Step 1: What is the value of Step 1: What is the value of α? α? • 1 – 1 – α = 95% α = 95% α = 5% α = 5%
Step 2: Find the tStep 2: Find the tαα/2/2 value. Use n-1 = 64 – 1 = 63 value. Use n-1 = 64 – 1 = 63 degrees of freedomdegrees of freedom
• tt0.05/2 0.05/2 = t= t0.025 0.025 = 1.998= 1.998 Step 3: Calculate the confidence intervalStep 3: Calculate the confidence interval
25 ± 1.998· 4/8 = 25 ± 0.999.25 ± 1.998· 4/8 = 25 ± 0.999.
In other words:In other words: Prob( 24.001 ≤ Prob( 24.001 ≤ μμ ≤ 25.999) = 95% ≤ 25.999) = 95%

16 16 Slide
Slide
© 2007 Thomson South-Western. All Rights Reserved© 2007 Thomson South-Western. All Rights Reserved
Summary of Interval Estimation Summary of Interval Estimation ProceduresProcedures
for a Population Meanfor a Population Mean
Can theCan thepopulation standardpopulation standard
deviation deviation be assumed be assumed known ?known ?
Use the sampleUse the samplestandard deviationstandard deviation
ss to estimate to estimate
UseUse
YesYes NoNo
/ 2
sx t
n / 2
sx t
nUseUse
/ 2x zn
/ 2x z
n
KnownKnownCaseCase
UnknownUnknownCaseCase

17 17 Slide
Slide
© 2007 Thomson South-Western. All Rights Reserved© 2007 Thomson South-Western. All Rights Reserved
Let Let EE = the desired margin of error. = the desired margin of error. Let Let EE = the desired margin of error. = the desired margin of error.
How can we find the sample size (n) needed to achieve How can we find the sample size (n) needed to achieve a specific margin of error (E)?a specific margin of error (E)? How can we find the sample size (n) needed to achieve How can we find the sample size (n) needed to achieve a specific margin of error (E)?a specific margin of error (E)?
Sample Size for an Interval EstimateSample Size for an Interval Estimateof a Population Meanof a Population Mean
E zn
/2E zn
/2 nz
E
( )/ 22 2
2n
z
E
( )/ 22 2
2Solve for Solve for nn
The above methodology can be used even if The above methodology can be used even if σ σ is not known. is not known. In this case, a planning value of In this case, a planning value of σ σ is neededis needed.. The above methodology can be used even if The above methodology can be used even if σ σ is not known. is not known. In this case, a planning value of In this case, a planning value of σ σ is neededis needed..

18 18 Slide
Slide
© 2007 Thomson South-Western. All Rights Reserved© 2007 Thomson South-Western. All Rights Reserved
The general form of an interval estimate of aThe general form of an interval estimate of a population proportion is population proportion is
The general form of an interval estimate of aThe general form of an interval estimate of a population proportion is population proportion is
Margin of Errorp Margin of Errorp
Interval EstimationInterval Estimationof a of a Population ProportionPopulation Proportion
Key for the computation of Key for the computation of Margin of Error:Margin of Error: The sampling distribution of The sampling distribution of Key for the computation of Key for the computation of Margin of Error:Margin of Error: The sampling distribution of The sampling distribution of pp
The sampling distribution ofThe sampling distribution of can be approximated can be approximated by a normal distribution whenever by a normal distribution whenever npnp >> 5 and 5 and nn(1 – (1 – pp) ) >> 5. 5.
The sampling distribution ofThe sampling distribution of can be approximated can be approximated by a normal distribution whenever by a normal distribution whenever npnp >> 5 and 5 and nn(1 – (1 – pp) ) >> 5. 5.
pp

19 19 Slide
Slide
© 2007 Thomson South-Western. All Rights Reserved© 2007 Thomson South-Western. All Rights Reserved
/2/2 /2/2
Interval EstimationInterval Estimationof a Population Proportionof a Population Proportion
Normal Approximation of Sampling Distribution Normal Approximation of Sampling Distribution of of
pp
Samplingdistribution of
Samplingdistribution of pp
(1 )p
p p
n
(1 )p
p p
n
pppp
/ 2 pz / 2 pz / 2 pz / 2 pz
1 - of all values1 - of all valuespp

20 20 Slide
Slide
© 2007 Thomson South-Western. All Rights Reserved© 2007 Thomson South-Western. All Rights Reserved
Interval EstimateInterval Estimate
Interval EstimationInterval Estimationof a Population Proportionof a Population Proportion
p zp pn
/
( )2
1p z
p pn
/
( )2
1
where: 1 -where: 1 - is the confidence coefficient is the confidence coefficient
zz/2 /2 is the is the zz value providing an area of value providing an area of
/2 in the upper tail of the standard/2 in the upper tail of the standard
normal probability distributionnormal probability distribution
is the sample proportionis the sample proportionpp
21 21 Slide
Slide
© 2007 Thomson South-Western. All Rights Reserved© 2007 Thomson South-Western. All Rights Reserved
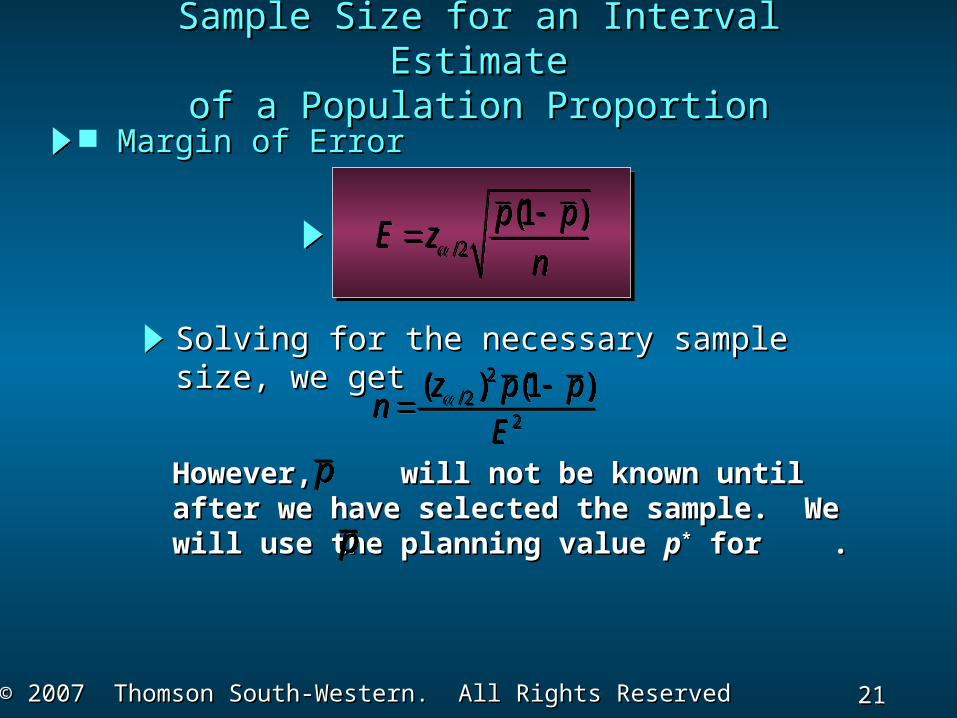
Solving for the necessary sample size, we Solving for the necessary sample size, we getget
Margin of ErrorMargin of Error
Sample Size for an Interval EstimateSample Size for an Interval Estimateof a Population Proportionof a Population Proportion
/ 2
(1 )p pE z
n
/ 2
(1 )p pE z
n
2/ 2
2
( ) (1 )z p pn
E
2
/ 22
( ) (1 )z p pn
E
ppHowever, will not be known until after However, will not be known until after we have selected the sample. We will we have selected the sample. We will use the planning value use the planning value pp** for . for .pp

22 22 Slide
Slide
© 2007 Thomson South-Western. All Rights Reserved© 2007 Thomson South-Western. All Rights Reserved
Sample Size for an Interval EstimateSample Size for an Interval Estimateof a Population Proportionof a Population Proportion
The planning value The planning value pp** can be chosen by: can be chosen by:
1. Using the sample proportion from a 1. Using the sample proportion from a previous sample of the same or similar previous sample of the same or similar units, orunits, or
2. Selecting a preliminary sample and 2. Selecting a preliminary sample and using the sample proportion from this using the sample proportion from this sample.sample.
2 * */ 2
2
( ) (1 )z p pn
E
2 * *
/ 22
( ) (1 )z p pn
E
Necessary Sample SizeNecessary Sample Size