Embed Size (px)
Citation preview
Draft Solar PEIS F-i December 2010
1 2 3 4 5 6 7 8 9 10 11 12
APPENDIX F: 13 14
SOLAR ENERGY TECHNOLOGY OVERVIEW 15 16
17

Draft Solar PEIS F-ii December 2010
1 2 3 4 5 6 7 8 9 10 11 12
This page intentionally left blank. 13 14
15
Draft Solar PEIS F-1 December 2010
APPENDIX F: 1 2
SOLAR ENERGY TECHNOLOGY OVERVIEW 3 4 5 F.1 INTRODUCTION 6 7 Solar energy technology can be defined broadly as those activities, applications, or 8 devices designed to harness energy from the sun to perform useful work. By that measure, 9 humans have been devising and applying solar energy technology for centuries, beginning with 10 the use of magnifying glasses and mirrors to concentrate the sun’s rays to start fires and light 11 ceremonial torches as early as the 7th century B.C. The first application of passive solar heating 12 was in Roman bathhouses of the 1st through the 4th centuries A.D. The first solar electric or 13 photovoltaic cell was produced in 1839, and the first solar water heater was manufactured in 14 1891. Photovoltaic technology was advanced in the United States in the 1950s, and the first 15 telecommunications satellite, Telstar 1, was powered by photovoltaic panels in 1962. The first 16 photovoltaic-powered residence was constructed in 1973; and a rapid expansion of solar energy 17 technologies that began in the early 1980s continues today.1 18 19 This overview focuses only on the use of solar energy to produce electric power for 20 utilities by using: 21 22
• Photovoltaics to convert the sun directly into electricity, and 23 24
• Concentrated solar power that creates steam to drive a conventional generator 25 to produce electricity. 26
27 Other uses of solar energy include direct sunlight to heat and light living and working 28 spaces and concentrated sunlight to heat water. 29 30 31 F.1.1 Scope of Overview 32 33 In recent years, technological advances, the rising costs of energy, as well as government 34 regulations and incentives for renewable energy technologies, have increased interest in 35 renewable energy technologies, including solar. This overview does not discuss all variations of 36 energy-producing solar technologies that exist or that could be built. Instead, the focus is on two 37 technology categories that are believed to hold the greatest potential for generating large 38
1 For more information on the history of solar technology development, see The History of Solar online at
http://www1.eere.energy.gov/solar/pdfs/solar_timeline.pdf. Accessed Jan. 1, 2009.
Draft Solar PEIS F-2 December 2010
amounts of electricity that can be delivered to the nation’s electric grid within the 20-year 1 planning horizon of the Solar programmatic environmental impact statement (PEIS).2 2 3
These solar electric categories are 4 5
1. Concentrating solar power (CSP) (or solar thermoelectric), and 6 7
2. Photovoltaic (PV) (or solar electric). 8 9 (See the text box for naming conventions for solar energy technologies.) 10 11 12
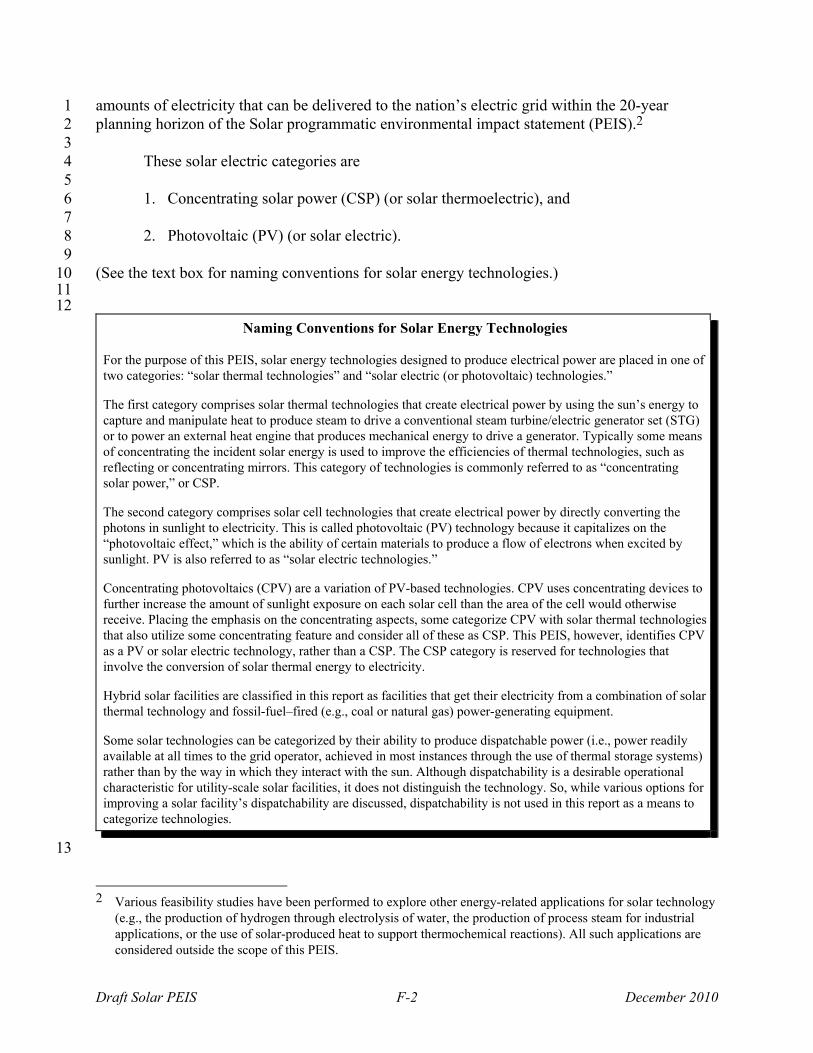
Naming Conventions for Solar Energy Technologies For the purpose of this PEIS, solar energy technologies designed to produce electrical power are placed in one of two categories: “solar thermal technologies” and “solar electric (or photovoltaic) technologies.” The first category comprises solar thermal technologies that create electrical power by using the sun’s energy to capture and manipulate heat to produce steam to drive a conventional steam turbine/electric generator set (STG) or to power an external heat engine that produces mechanical energy to drive a generator. Typically some means of concentrating the incident solar energy is used to improve the efficiencies of thermal technologies, such as reflecting or concentrating mirrors. This category of technologies is commonly referred to as “concentrating solar power,” or CSP. The second category comprises solar cell technologies that create electrical power by directly converting the photons in sunlight to electricity. This is called photovoltaic (PV) technology because it capitalizes on the “photovoltaic effect,” which is the ability of certain materials to produce a flow of electrons when excited by sunlight. PV is also referred to as “solar electric technologies.” Concentrating photovoltaics (CPV) are a variation of PV-based technologies. CPV uses concentrating devices to further increase the amount of sunlight exposure on each solar cell than the area of the cell would otherwise receive. Placing the emphasis on the concentrating aspects, some categorize CPV with solar thermal technologies that also utilize some concentrating feature and consider all of these as CSP. This PEIS, however, identifies CPV as a PV or solar electric technology, rather than a CSP. The CSP category is reserved for technologies that involve the conversion of solar thermal energy to electricity. Hybrid solar facilities are classified in this report as facilities that get their electricity from a combination of solar thermal technology and fossil-fuel–fired (e.g., coal or natural gas) power-generating equipment. Some solar technologies can be categorized by their ability to produce dispatchable power (i.e., power readily available at all times to the grid operator, achieved in most instances through the use of thermal storage systems) rather than by the way in which they interact with the sun. Although dispatchability is a desirable operational characteristic for utility-scale solar facilities, it does not distinguish the technology. So, while various options for improving a solar facility’s dispatchability are discussed, dispatchability is not used in this report as a means to categorize technologies.
13
2 Various feasibility studies have been performed to explore other energy-related applications for solar technology
(e.g., the production of hydrogen through electrolysis of water, the production of process steam for industrial applications, or the use of solar-produced heat to support thermochemical reactions). All such applications are considered outside the scope of this PEIS.
Draft Solar PEIS F-3 December 2010
Within the two major technology categories (CSP and PV), five broad categories are 1 reviewed in this overview: 2 3
• CSP technologies 4 Parabolic trough and compact linear Fresnel reflector (CLFR) 5 Solar power tower 6 Solar dish engine 7 8
• PV technologies 9 Flat-plate PV 10 Concentrating PV 11
12 The scale at which any solar energy technology is used to produce electricity can vary 13 greatly and depends on the intended end use of the power being produced. The scope of this 14 PEIS is limited to those technologies (listed above) that can produce utility-scale electrical power 15 on the order of 20 MWe3 for connection to the nation’s medium- and high-voltage electric 16 transmission and distribution grids. 17 18 Solar energy technologies that generate electricity used locally to satisfy relatively minor 19 power demands are known as distributed, isolated, or off-grid applications. Some small-capacity 20 installations are not connected to the electric grid, while others, primarily PV systems on 21 residences or commercial buildings in urban or suburban areas, have the ability to return 22 excess or unneeded electricity to the local electric distribution grid.4 All such applications are 23 characterized as having relatively low power-generating capacities (on the order of hundreds of 24 watts or kilowatts, up to a few megawatts, maximum), and although they can be very effective 25 and efficient in the individual applications for which they were designed, they are not included 26 in the scope of this PEIS. 27 28 One inherent limitation of solar energy technologies is that power can be produced only 29 when the sun is shining. Furthermore, the rate at which power is produced is directly related to 30 the intensity of the solar radiation (or insolation) reaching the solar collectors (see text box). 31 Consequently, during cloudy periods or at night, power production is severely reduced or stops 32 entirely. Depending on the location and the utility, this intermittency in power generation can 33 result in instability of the electricity grid to which the solar power facility is connected. Two 34 methods to address the lack of dispatchability and reliability inherent in solar power generation 35 are available for some CSP facilities: (1) incorporating thermal energy storage (TES), which 36
3 Arbitrarily, 20 MWe (net) is selected as the lower limit of utility-scale electrical power generated expressly for
delivery to the grid. Obviously, the capacity of any solar energy facility is dependent on many factors and changes over the course of a day, a season, or a year regardless of its technology, geographic location, or design. The nominal capacity of 20 MWe (net) is understood to mean the peak power-generating capacity of the facility, expressed in watts as Wp minus all auxiliary, internal (parasitic) loads. In this document, MWe is used synonymously with MW (i.e., no thermal power [MWt] is discussed).
4 The process of reverse power flow is known as net metering. Many states have adopted net metering policies that require utilities to purchase from or otherwise credit the customer for this reverse power. Net metering is available in 42 states and the District of Columbia. More details about state programs are available at http://apps3.eere.energy.gov/greenpower/resources/maps/netmetering_map.shtml. Accessed Jan. 5, 2009.
Draft Solar PEIS F-4 December 2010
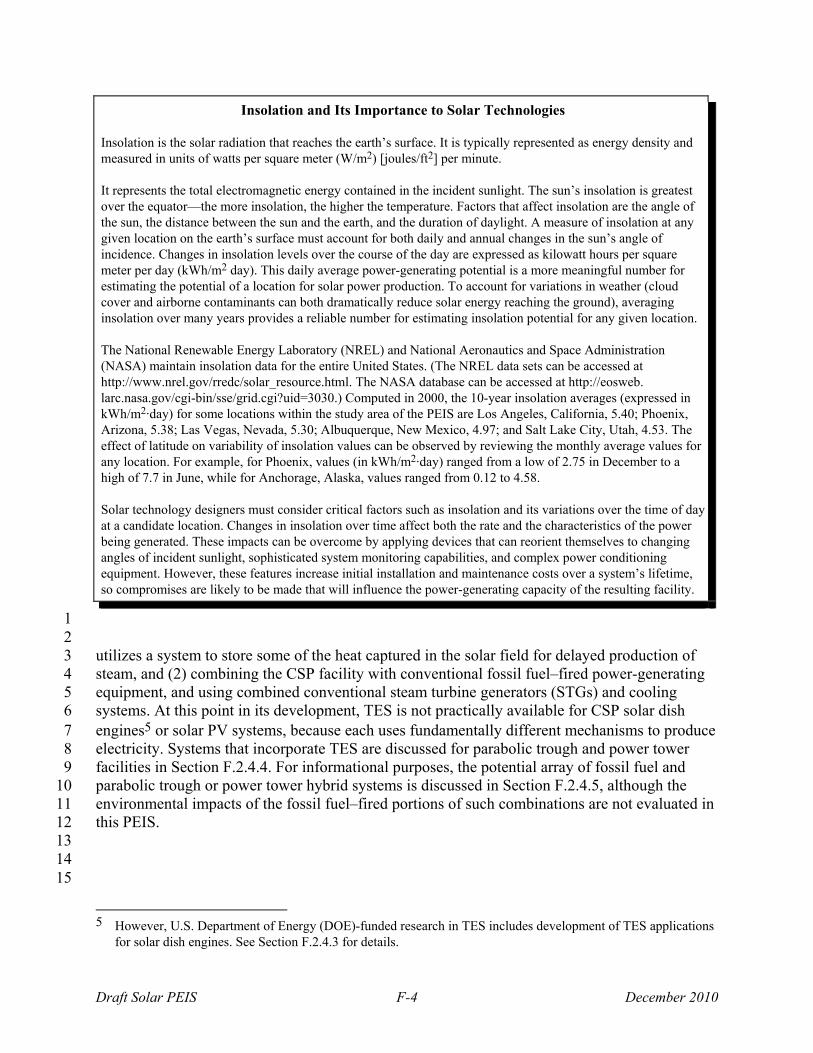
Insolation and Its Importance to Solar Technologies Insolation is the solar radiation that reaches the earth’s surface. It is typically represented as energy density and measured in units of watts per square meter (W/m2) [joules/ft2] per minute. It represents the total electromagnetic energy contained in the incident sunlight. The sun’s insolation is greatest over the equator—the more insolation, the higher the temperature. Factors that affect insolation are the angle of the sun, the distance between the sun and the earth, and the duration of daylight. A measure of insolation at any given location on the earth’s surface must account for both daily and annual changes in the sun’s angle of incidence. Changes in insolation levels over the course of the day are expressed as kilowatt hours per square meter per day (kWh/m2 day). This daily average power-generating potential is a more meaningful number for estimating the potential of a location for solar power production. To account for variations in weather (cloud cover and airborne contaminants can both dramatically reduce solar energy reaching the ground), averaging insolation over many years provides a reliable number for estimating insolation potential for any given location. The National Renewable Energy Laboratory (NREL) and National Aeronautics and Space Administration (NASA) maintain insolation data for the entire United States. (The NREL data sets can be accessed at http://www.nrel.gov/rredc/solar_resource.html. The NASA database can be accessed at http://eosweb. larc.nasa.gov/cgi-bin/sse/grid.cgi?uid=3030.) Computed in 2000, the 10-year insolation averages (expressed in kWh/m2·day) for some locations within the study area of the PEIS are Los Angeles, California, 5.40; Phoenix, Arizona, 5.38; Las Vegas, Nevada, 5.30; Albuquerque, New Mexico, 4.97; and Salt Lake City, Utah, 4.53. The effect of latitude on variability of insolation values can be observed by reviewing the monthly average values for any location. For example, for Phoenix, values (in kWh/m2·day) ranged from a low of 2.75 in December to a high of 7.7 in June, while for Anchorage, Alaska, values ranged from 0.12 to 4.58. Solar technology designers must consider critical factors such as insolation and its variations over the time of day at a candidate location. Changes in insolation over time affect both the rate and the characteristics of the power being generated. These impacts can be overcome by applying devices that can reorient themselves to changing angles of incident sunlight, sophisticated system monitoring capabilities, and complex power conditioning equipment. However, these features increase initial installation and maintenance costs over a system’s lifetime, so compromises are likely to be made that will influence the power-generating capacity of the resulting facility.
1 2 utilizes a system to store some of the heat captured in the solar field for delayed production of 3 steam, and (2) combining the CSP facility with conventional fossil fuel–fired power-generating 4 equipment, and using combined conventional steam turbine generators (STGs) and cooling 5 systems. At this point in its development, TES is not practically available for CSP solar dish 6 engines5 or solar PV systems, because each uses fundamentally different mechanisms to produce 7 electricity. Systems that incorporate TES are discussed for parabolic trough and power tower 8 facilities in Section F.2.4.4. For informational purposes, the potential array of fossil fuel and 9 parabolic trough or power tower hybrid systems is discussed in Section F.2.4.5, although the 10 environmental impacts of the fossil fuel–fired portions of such combinations are not evaluated in 11 this PEIS. 12 13 14
15
5 However, U.S. Department of Energy (DOE)-funded research in TES includes development of TES applications
for solar dish engines. See Section F.2.4.3 for details.
Draft Solar PEIS F-5 December 2010
F.1.2 Organization of Overview 1 2 Sections F.2 and F.3 provide brief descriptions of each of the five technology categories 3 addressed in this PEIS (parabolic trough [including CLFR], solar power tower, solar dish engine, 4 flat-plate PV, and concentrating PV), including 5 6
• How each technology produces electricity and the major components that a 7 facility would need to produce electricity at the utility scale; 8 9
• The current state of commercial solar technologies; and 10 11
• The environmental footprint of a utility-scale facility, identifying key resource 12 demands. 13
14 Some of the key resource demands are estimated by using parameters identified in 15 currently proposed solar energy facility documentation. Information pertaining to design 16 parameters for specific projects is meant to be representative of technologies with the greatest 17 potential to generate utility-scale solar energy over the next 20 years. The facilities described in 18 this appendix are in various stages of certification, and the parameters are subject to change. The 19 parameters included in this overview were initially drawn from project applications, and have 20 been revised to reflect data current as of February 2010. 21 22 Solar facilities also will need to connect to the electricity transmission grid. A discussion 23 of required activities for transmission line construction and associated considerations is provided 24 in Section F.4. 25 26 27 F.2 CONCENTRATING SOLAR POWER (CSP) TECHNOLOGIES AND FACILITIES 28 29 30 F.2.1 Basic Types of CSP Facilities 31 32 CSP has historically been called solar thermal electric or thermoelectric power since all 33 variations are designed to convert the sun’s energy to heat and then apply that heat in various 34 ways to produce electricity. CSP technologies are distinguished by three basic design 35 architectures for reflecting and concentrating solar energy: 36 37
1. Line-focus systems that concentrate solar energy along a line-shaped receiver, 38 typically an oil-filled pipe positioned at the focus of parabolically shaped 39 reflectors (parabolic trough systems) or along the focus of a parallel array of 40 nearly flat mirrors acting as concentrators (the CLFR); 41 42
2. Point-focus systems that concentrate solar energy to a point receiver by means 43 of flat-plate mirrors focusing reflected light on a receiver located at the top of 44 a centrally located tower (solar power tower systems); and 45 46
Draft Solar PEIS F-6 December 2010
3. Point-focus systems that use a parabolic-shaped reflector dish to focus the 1 sun’s energy on a point receiver/external heat engine/generator located at the 2 focal point of the dish (solar dish engine systems). 3
4 To produce heat, all CSP technologies utilize direct normal insolation (DNI) only. That 5 is, they use sunlight that directly strikes the reflecting/concentrating surface, rather than global 6 insolation, which includes sunlight that has been refracted or diffused by clouds, airborne dusts, 7 or the ground. Thus, for optimal performance, the reflective surfaces of CSP technologies must 8 track the sun so that they reflect its rays to a line or point focus over the course of the day, and 9 reflectors and/or concentrators must exhibit good optical characteristics.6 10 11 Parabolic trough and solar power tower CSP systems typically utilize a heat transfer 12 fluid (HTF) (usually synthetic oil in the case of parabolic trough facilities and molten salt in the 13 case of power tower facilities) to transfer the heat generated at the solar collectors to a heat 14 exchanger, where steam is produced to drive a conventional STG. The CLFR system dispenses 15 with the HTF, making steam directly at the solar field for delivery to the STG. The power block 16 of a solar thermal facility containing the STG and other related power-generating and power 17 management equipment is virtually identical in both form and function to the power block of 18 fossil fuel and nuclear power plants that also use steam to produce electricity. The solar dish 19 engine is unique among CSP technologies in that it uses the sun’s heat not to produce steam but 20 to expand a gas against a piston, generating mechanical energy that drives an electric generator 21 or alternator. Although all CSP systems rely on their ability to collect and concentrate the sun’s 22 energy and convert it to heat, point-focus systems such as solar power towers and solar dish 23 engines can attain greater degrees of concentration of the sun’s energy than can troughs. By 24 using different working fluids and power cycles, these systems generally operate at higher 25 temperatures and higher efficiencies than parabolic troughs. Nevertheless, among CSP 26 technologies, parabolic trough facilities have enjoyed the greatest degree of development and 27 utility-scale application to date. 28 29 One thermal electric technology does not involve production of steam; this technology 30 uses organic Rankine cycle (ORC) turbines coupled to conventional generators. Instead of 31 accepting steam from a remote source, ORC turbines use heat to boil an organic working fluid 32 contained in the reservoir of a closed system, allowing the resulting hot expanding vapors of the 33 working fluid to drive the turbine-generator set. In doing so, the working fluid loses sufficient 34 thermal energy to return to its liquid state and, after further cooling, is returned to its reservoir, 35
6 To ensure optimal year-round performance, reflecting surfaces must remain precisely perpendicular to the sun’s
DNI over the course of both the day (azimuth tracking) and the year (elevation tracking). Virtually every grid-connected utility-scale CSP facility can be expected to have at least single-axis, and more likely dual-axis, tracking capability. Either of two methods of dual-axis tracking can be used: (1) azimuth-elevation tracking, which rotates the dish in a plane parallel to the earth’s surface over the course of the day, and up and down to reflect the changing position of the sun in the sky with the seasons, and (2) polar tracking, which rotates the dish about an axis that is parallel to the earth’s rotational axis at a constant rate of 15º per hour, matching the earth’s rotation, and then simultaneously rotates the dish about the declination axis (perpendicular to the polar axis) at a rate of 0.0016º per hour (approximately ± 23.5º over the course of a year). Reorienting the reflecting surface by either tracking method is typically accomplished by means of electric motors or hydraulic actuators, either system being computer-controlled and preprogrammed against the facility’s specific location.
Draft Solar PEIS F-7 December 2010
allowing the process to repeat. ORC turbines enjoy many industrial applications, recovering 1 otherwise wasted heat and converting it to electrical power or mechanical energy. They offer a 2 number of advantages, including: the ability to produce power from relatively minor sources of 3 heat; minimal internal corrosion issues due to the absence of water; thermal efficiencies as high 4 as 85%; and extended mechanical life due to relatively slower rotational speeds compared to 5 conventional STGs. Perhaps most importantly for CSP applications in water-deprived locations, 6 ORC turbines require substantially less water than do conventional STGs. However, to date, 7 ORCs have been applied only in relatively low-power situations. 8 9 An option to increase the reliability of power production for parabolic trough and power 10 tower technologies is to use some form of energy storage. Many energy storage technologies 11 exist; examples include storage as chemical energy in storage batteries (a chemical or galvanic 12 battery) or as potential energy in compressed air (a pneumatic battery). However, these energy 13 storage options are impractical and/or inefficient for adaptation to CSP facilities. TES options are 14 technically feasible and efficient additions to parabolic trough and power tower CSP facilities. 15 TES has been demonstrated in power towers (see Section F.2.3 on Solar One and Solar Two) and 16 is currently being built into the Andasol 1 plant in Spain.7 TES is also a feature of the proposed 17 Ivanpah Solar Electric Generating System (ISEGS) power tower proposed for construction in 18 California (see Section F.2.3.2). Because solar dish engine systems do not produce steam, they 19 cannot be easily hybridized with TES, but unique adaptations are nevertheless currently being 20 studied. Adding TES capabilities allows a portion of the heat generated during periods of 21 greatest insolation to be diverted to storage for later use rather than being used immediately to 22 produce electricity.8 Simple sodium and potassium nitrate salts with high heat capacities have 23 been found to act as excellent heat storage media. While TES capability is technically feasible, 24 the unresolved issue is whether TES can be implemented cost effectively in a utility-scale CSP 25 facility. Details about TES applications to solar facilities are provided in Section F.2.4.3. 26 27 28 F.2.2 Parabolic Trough Technologies 29 30 As noted above, parabolic trough CSP systems are the furthest along toward commercial 31 application of any of the CSP technologies. There are numerous examples worldwide of 32 operating commercial, utility-scale parabolic trough systems as well as numerous facilities 33 proposed or in the design phase. A number of feasibility studies and component evaluation 34 testing initiatives have been completed, and component and system performance assessments 35 have been published on the basis of field experience. Although many engineering designs and 36 performance issues have been settled, many others are still in need of further study and 37 development, all for the purpose of improving the operability, reliability, and overall efficiency 38 of parabolic trough technologies. 39 40
41 7 See http://www.nrel.gov/csp/troughnet/pdfs/2007/martin_andasol_pictures_storage.pdf for details.
8 In many parts of the country (including the six-state study area of this PEIS), the daily peaks of electric demand occur in the early morning and early evening. In those circumstances, storage heat energy generated in the middle of the day when the sun’s energy is most intense effectively allows a CSP facility to produce its greatest amounts of power over periods that coincide with those anticipated power load peaks.
Draft Solar PEIS F-8 December 2010
F.2.2.1 Facility Components 1 2 3
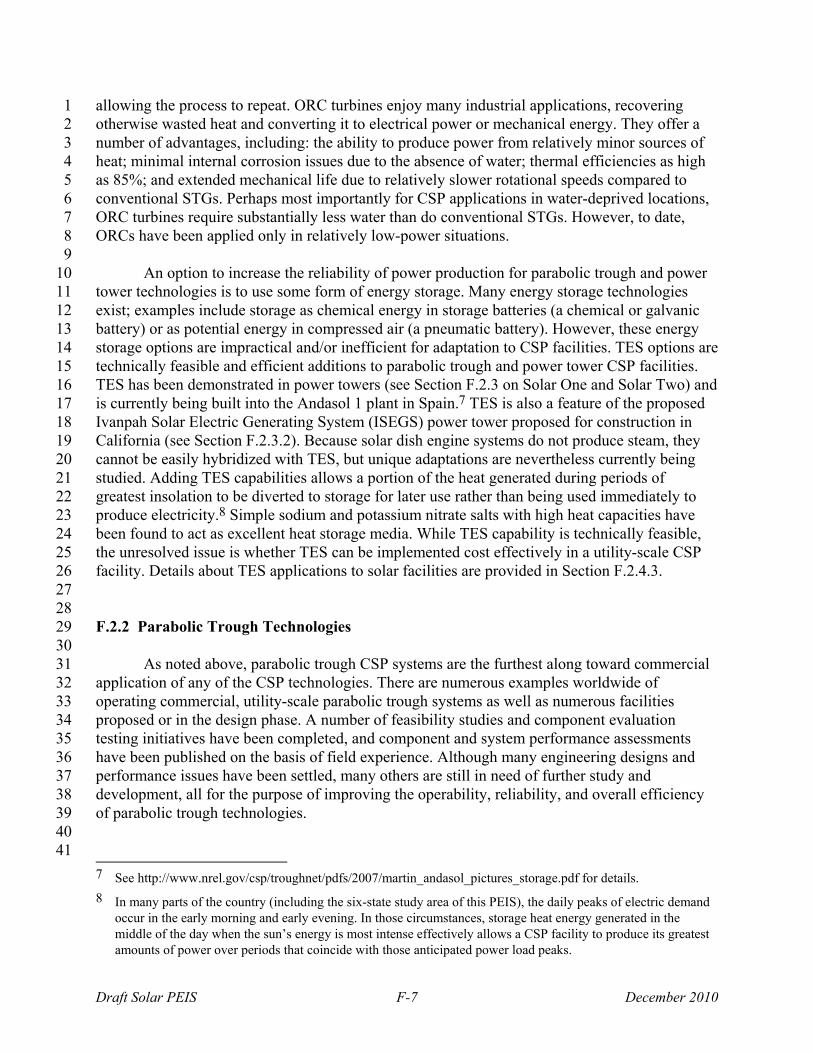
F.2.2.1.1 Solar Field (Collectors, Mirrors, and Receivers). The distinguishing feature 4 of parabolic trough systems is the solar field with its parabolically shaped collectors. Parabolic 5 troughs utilize only sunlight’s DNI or beam radiation; they do not use diffuse radiation. The 6 optimum size of the solar field is determined by the strength of the DNI incident on the facility’s 7 location and the collective optical and thermal 8 efficiencies of the collectors, mirrors, and receivers. 9 Major components in the solar field include: 10 11
• Parabolically shaped linear collectors; 12 13
• Single-axis tracking structures; and 14 15
• Mirrors that collect, reflect, and 16 concentrate the sun’s energy at the linear 17 receivers (absorber tubes) 18 (see Figure F.2.2-1). 19
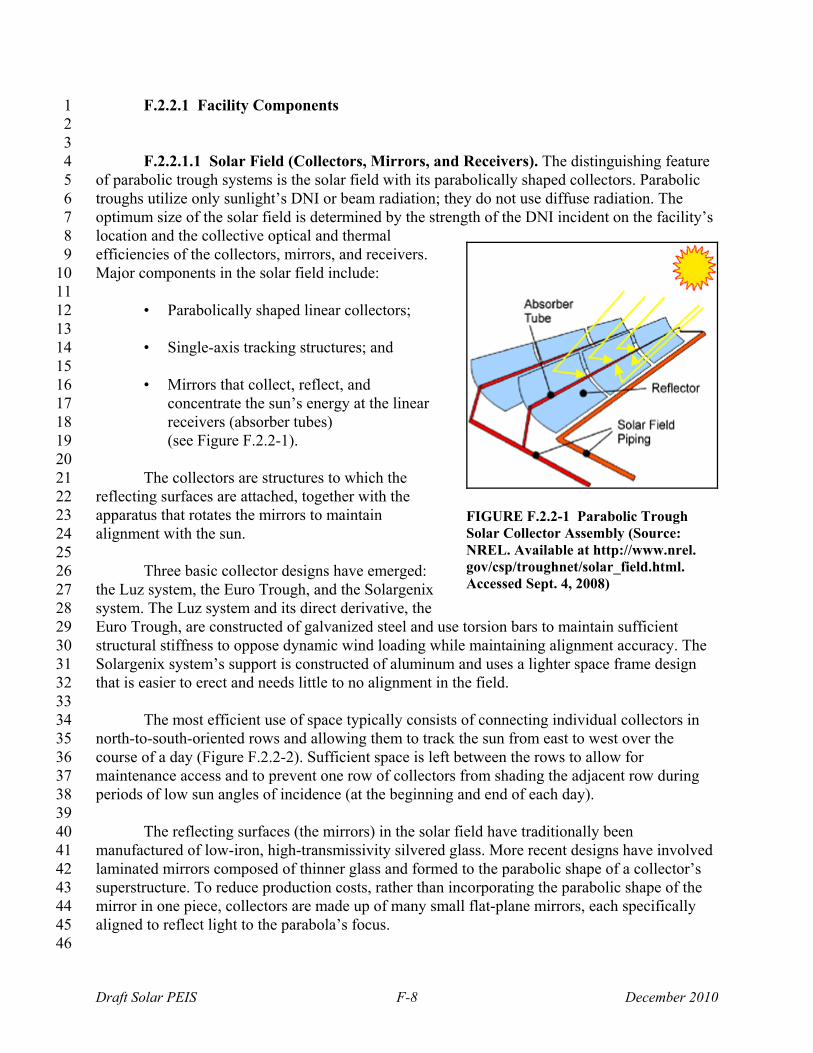
20 The collectors are structures to which the 21 reflecting surfaces are attached, together with the 22 apparatus that rotates the mirrors to maintain 23 alignment with the sun. 24 25 Three basic collector designs have emerged: 26 the Luz system, the Euro Trough, and the Solargenix 27 system. The Luz system and its direct derivative, the 28 Euro Trough, are constructed of galvanized steel and use torsion bars to maintain sufficient 29 structural stiffness to oppose dynamic wind loading while maintaining alignment accuracy. The 30 Solargenix system’s support is constructed of aluminum and uses a lighter space frame design 31 that is easier to erect and needs little to no alignment in the field. 32 33 The most efficient use of space typically consists of connecting individual collectors in 34 north-to-south-oriented rows and allowing them to track the sun from east to west over the 35 course of a day (Figure F.2.2-2). Sufficient space is left between the rows to allow for 36 maintenance access and to prevent one row of collectors from shading the adjacent row during 37 periods of low sun angles of incidence (at the beginning and end of each day). 38 39 The reflecting surfaces (the mirrors) in the solar field have traditionally been 40 manufactured of low-iron, high-transmissivity silvered glass. More recent designs have involved 41 laminated mirrors composed of thinner glass and formed to the parabolic shape of a collector’s 42 superstructure. To reduce production costs, rather than incorporating the parabolic shape of the 43 mirror in one piece, collectors are made up of many small flat-plane mirrors, each specifically 44 aligned to reflect light to the parabola’s focus. 45 46
FIGURE F.2.2-1 Parabolic Trough Solar Collector Assembly (Source: NREL. Available at http://www.nrel. gov/csp/troughnet/solar_field.html. Accessed Sept. 4, 2008)
Draft Solar PEIS F-9 December 2010
1
FIGURE F.2.2-2 Solar Field for the Florida Power and Light Parabolic Trough Facility 2 Known as SEGS VI, Kramer Junction, California (In addition to CSP, the facility also 3 includes a natural gas–fired turbine located in the facility’s power block; see background 4 right.) (Source: NREL. Available at http://www.nrel.gov/csp/troughnet/pdfs/32282.pdf. 5 Accessed June 16, 2008) 6
7 8 The receiver (also sometimes called the absorber or the heat collection element [HCE]) is 9 the tube positioned at the focus of each parabolic collector. A stainless steel tube containing the 10 HTF is encased in a glass tube, and the annular space is maintained in a vacuum. To improve its 11 thermal insulating properties, the steel tube is coated with “cermet,” a surface treatment 12 consisting of fine metal particles encased in a dielectric ceramic matrix that has a high 13 absorptivity to solar energy and a low emissivity for the infrared spectrum to reduce thermal 14 radiation losses from the receiver. The glass tube is typically constructed of low-iron glass and 15 coated with an antireflection coating to maximize sunlight transmissivity and minimize reflective 16 losses. The receivers of individual parabolic collectors are connected to receivers of adjacent 17 collectors by means of flexible bellows, accommodating the differential thermal expansion 18 between the glass envelopes and the steel tubes and allowing each collector and its receiver to 19 move independently of adjacent collectors and receivers to remain precisely aligned with the sun. 20 21 The balance of system components for the solar field includes the collector foundations, 22 tracking and alignment drive systems, and controllers. Given the latitudes at which utility-scale 23 parabolic trough systems are likely to be located, ground freezing is typically not a major 24 concern, so foundation designs are driven primarily by the weight and dynamic wind loading of 25 each panel and the structural properties of indigenous soils and subsoils. Parabolic trough 26
Draft Solar PEIS F-10 December 2010
systems use both electric motor and simple gear assemblies or hydraulics for tracking and 1 alignment. Future designs may utilize either system. An individual controller that can be 2 monitored remotely is integrated into a facility-wide supervisory control and data acquisition 3 (SCADA) system. This device controls the tracking and alignment of each collector and 4 monitors the condition of the vacuum and HTF levels in the receiver. However, it is likely that 5 there would be an operating crew present at future utility-scale facilities, especially those located 6 in remote locations. 7 8 9
F.2.2.1.2 Heat Transfer Fluids. All parabolic trough facilities designed and built in the 10 United States have used an HTF to absorb heat from the collectors in the solar field and transfer 11 it to a conventional steam heat exchanger.9 Ideal HTF properties for solar energy applications are 12 as follows: 13 14
• Thermal stability for extended periods of time at high temperatures (HTFs can 15 be heated in the solar field to temperatures >750°F [400°C]); 16 17
• Eutectic point (the temperature at which both constituents simultaneously 18 begin to solidify) is below the expected lowest ambient temperature at the 19 facility location [ideally below 32°F (0°C)]; 20 21
• Low vapor pressure (<1 atmosphere) and low viscosity at the maximum 22 working temperature;10 23 24
• High heat capacity (the amount of heat energy required to raise the 25 temperature of a specified volume by a specified interval, usually defined by 26 convention as 1 gram of material raised 1 Centigrade degree); 27 28
• Little or no potential for thermal decomposition over extended periods of time 29 (especially for organic HTFs); 30 31
• Compatibility with HTF containment and recirculation component materials; 32 and 33 34
• Relatively low cost. 35 36
9 Some research has been completed in Europe involving the direct production of steam by circulating a water/glycol mixture, rather than conventional synthetic oil HTF, through the HCEs (Valenzuela et al. 2004; Eck and Steinmann 2002; Zarza et al. 2002). Such a system would be less expensive to construct and simpler to operate since the steam heat exchanger is eliminated. However, although the system could be designed to produce superheated steam, providing even steam flow to the STG would be difficult during periods of fluctuating solar insolation (e.g., from passing clouds). No direct steam generation facilities are currently being studied or have been proposed for the United States; consequently, this option is not discussed further. However, a variation of the conventional parabolic trough system, the CLFR, does produce steam directly at the solar field. See Section F.2.2.2.1.
10 Low vapor pressure simplifies the design of storage and transfer equipment because it means that high temperature fluids are maintained at relatively low pressures. Because the fluid must circulate, low viscosity reduces the power required to accomplish that.
Draft Solar PEIS F-11 December 2010
The material that has been used exclusively to date is a formulation of synthetic organic 1 oils, sold commercially as Dowtherm A®, manufactured by Dow Chemical, or Therminol® VP1, 2 distributed by Solutia, Inc. Both products are mixtures of diphenyl oxide (≈ 73.5%) and biphenyl 3 (≈ 26.5%). Both formulations have been used successfully in CSP plants for many years. The 4 mixture is ideal for CSP applications in regions with high insolation. However, over time 5 (i.e., within the typical facility’s 30- to 40-year design basis lifetime), the material has been 6 shown to thermally decompose to produce hydrogen and other organic species such as benzene 7 and dibenzofuran (Moens and Blake 2008). The hydrogen that forms has also been shown to 8 permeate the stainless steel tube containing the HTF and move into the evacuated annular space 9 between the stainless steel tube and the glass outer tube, thus reducing the thermal efficiency of 10 the HCE. Consequently, it is necessary to either capture the hydrogen in special chemical 11 sponges placed in the annular space or provide for the venting of hydrogen from the HTF as it 12 is formed. Venting is typically selected as the simplest strategy for preserving the performance 13 of the HCE and the HTF over the long term. Experience suggests that the extent of thermal 14 decomposition of the HTF is minimal, and replacing the entire volume of HTF within the 15 operating lifetime of a facility is not expected to be necessary. 16 17 Although commercial formulations of synthetic oils have predominated as HTFs in 18 solar facilities, they have intrinsic drawbacks that could make them obsolete for application 19 in advanced CSP technologies. Advanced CSP designs that provide higher degrees of solar 20 concentration and function at higher operating temperatures may require alternative HTFs. 21 Substantial research is ongoing to identify those alternatives. Organic salts, compounds 22 composed of organic cations, and organic or inorganic anions that are liquids at expected 23 ambient temperatures are all being investigated. Imidazolium salts have received the most 24 attention (Moens et al. 2003). To date, research has established the effectiveness of imidazolium 25 salts to temperatures of 570°F (300°C); however, some salts exhibited corrosive actions on 26 system components. Mineral oils (paraffinic hydrocarbons) with operating temperature ranges 27 from 14°F to 570°F (–10°C to 300°C) and silicone oils with operating temperature ranges from 28 -40°F to 752°F (–40°C to 400°C) have also been investigated. Both have drawbacks: both can 29 be made to burn, and silicone oils are expensive to produce. The same general physical and 30 chemical properties desirable for HTFs also define excellent thermal storage media. 31 Consequently, mixtures of inorganic nitrate salts similar to those now being used for long-term 32 TES in some CSP facilities are also being considered as HTFs (Moens and Blake 2005). Current 33 research direction appears to suggest that future CSP facilities may use the same material for 34 both initial heat transfer from the solar field and long-term thermal storage. See Section F.2.4.3 35 for more details on thermal storage options. 36 37 Finally, although the choice of both HTF and TES media is based primarily on 38 performance, the selection also involves cost, safety, and environmental considerations. Large, 39 utility-scale CSP facilities with long-term TES capability can be expected to have substantial 40 quantities of HTF and/or TES material present in their respective systems (hundreds of 41
Draft Solar PEIS F-12 December 2010
thousands of gallons or more). Consequently, failures of those systems can lead to accidental 1 releases or fires.11 2 3 4
F.2.2.2 Utility-Scale Parabolic Trough Facilities 5 6 The parabolic trough is the CSP technology with the greatest amount of field experience. 7 Some of the first parabolic trough facilities in the world built to produce electricity are the Solar 8 Energy Generating Systems (SEGS) I through IX facilities installed in three locations in the 9 southern Mojave Desert in Southern California from 1985 through 1991.12 The plants have a 10 collective capacity of 354 MW and cover 1,600 acres (6.5 km2). The five SEGS plants 11 constructed at Kramer Junction, California, share some common central ancillary power 12 production, steam cooling, and power plant management facilities. All the SEGS plants utilize 13 Luz-style collectors and support Rankine cycle STGs.13 SEGS I has a 3-hour TES capability. 14 SEGS II through VII augment heat provided to the steam heat exchanger from the parabolic 15 troughs with heat produced in a natural gas-fired boiler, while SEGS VIII and IX maintain a 16 minimum temperature of HTF during plant downtime by means of a natural gas-fired heater 17 as a way to facilitate (and shorten) cold start-up. Details on the SEGS plants are provided in 18 Table F.2.2-1. The SEGS plants represent a relatively narrow range of Rankine cycle turbine 19 capacities, from 13.5 MWe (gross) in SEGS I to a maximum of 89 MWe (gross)14 in SEGS VIII 20 and IX. 21 22 The Nevada Solar One facility is a parabolic trough plant that has been in operation since 23 June 2007 (Acciona SA 2008). It is located about 40 mi southeast of Las Vegas and has a total 24 facility size of 400 acres (1.6 km2) (the solar fields encompass 300 acres [1.2 km2]). Solar One 25 has a maximum capacity of 75 MW and employs about 28 full-time workers during operations. 26 The construction period for the facility was about 16 months. The power produced at the facility 27 is delivered to the electric transmission grid and is sold to the Nevada Power Company and 28 Sierra Pacific Power Company through long-term power purchase agreements. 29 30 The simplest configuration for a parabolic trough facility is one in which energy captured 31 in the solar array is used only to produce electricity. It typically includes only the solar field and 32 a conventional STG, together with necessary ancillary support equipment for each. The Beacon 33 Solar Energy Project (BSEP), proposed to be constructed on approximately 2,012 acres 34 (8.14 km2) in eastern Kern County, California, represents such a “solar only” facility 35
11 Fires are possible not only because of the presence of fluids that burn, but also because the materials are
maintained at extreme temperatures and their contact with common combustible materials can result in spontaneous ignition of those materials.
12 Parabolic trough facilities constructed as early as the mid- to late-1970s were originally built to provide industrial process steam rather than electricity.
13 The Rankine cycle turbine is the type most commonly used in simple cycle thermoelectric plants that produce steam from the combustion of fossil fuels and is the likely choice for solar thermal applications.
14 The maximum net power outputs of SEGS VIII and IX were limited by Federal Energy Regulatory Commission (FERC) and Public Utility Regulatory Policy Act (PURPA) requirements.
Draft Solar PEIS F-13 December 2010
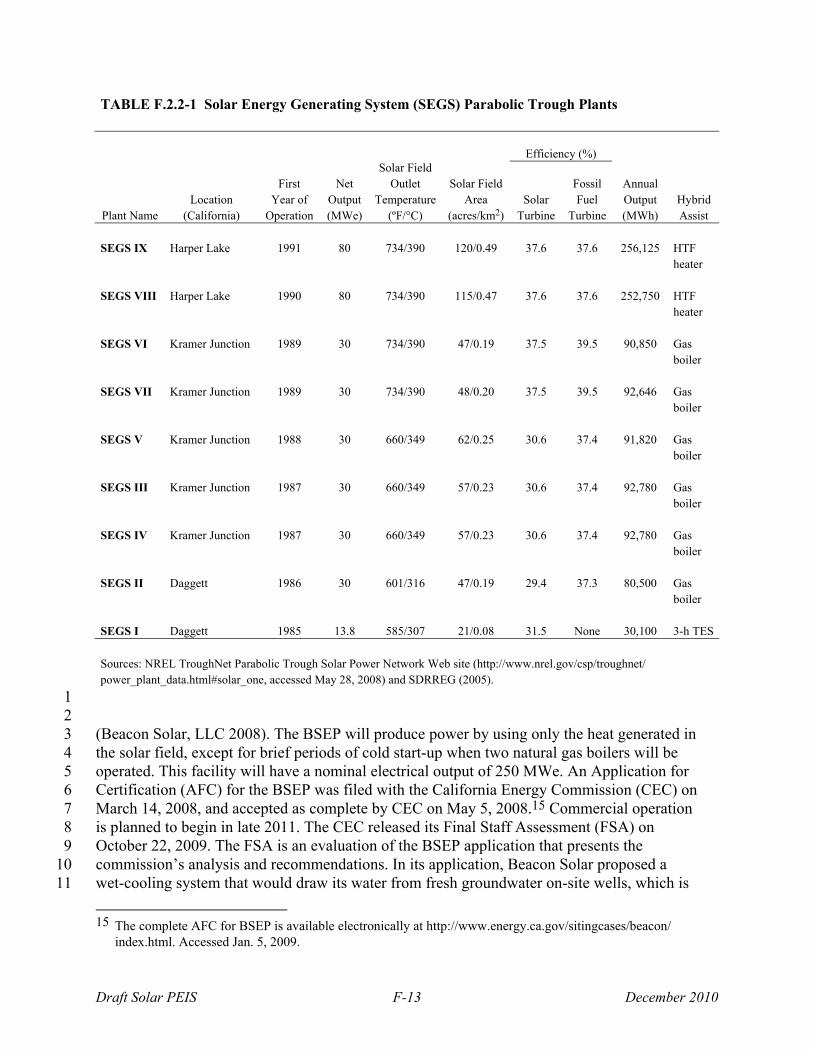
TABLE F.2.2-1 Solar Energy Generating System (SEGS) Parabolic Trough Plants
Solar Field
Outlet Temperature
(ºF/°C)
Efficiency (%)
Plant Name Location
(California)
First Year of
Operation
Net Output(MWe)
Solar Field Area
(acres/km2)Solar
Turbine
Fossil Fuel
Turbine
Annual Output (MWh)
Hybrid Assist
SEGS IX Harper Lake 1991 80 734/390 120/0.49 37.6 37.6 256,125 HTF
heater SEGS VIII Harper Lake 1990 80 734/390 115/0.47 37.6 37.6 252,750 HTF
heater SEGS VI Kramer Junction 1989 30 734/390 47/0.19 37.5 39.5 90,850 Gas
boiler SEGS VII Kramer Junction 1989 30 734/390 48/0.20 37.5 39.5 92,646 Gas
boiler SEGS V Kramer Junction 1988 30 660/349 62/0.25 30.6 37.4 91,820 Gas
boiler SEGS III Kramer Junction 1987 30 660/349 57/0.23 30.6 37.4 92,780 Gas
boiler SEGS IV Kramer Junction 1987 30 660/349 57/0.23 30.6 37.4 92,780 Gas
boiler SEGS II Daggett 1986 30 601/316 47/0.19 29.4 37.3 80,500 Gas
boiler SEGS I Daggett 1985 13.8 585/307 21/0.08 31.5 None 30,100 3-h TES
Sources: NREL TroughNet Parabolic Trough Solar Power Network Web site (http://www.nrel.gov/csp/troughnet/ power_plant_data.html#solar_one, accessed May 28, 2008) and SDRREG (2005).
1 2 (Beacon Solar, LLC 2008). The BSEP will produce power by using only the heat generated in 3 the solar field, except for brief periods of cold start-up when two natural gas boilers will be 4 operated. This facility will have a nominal electrical output of 250 MWe. An Application for 5 Certification (AFC) for the BSEP was filed with the California Energy Commission (CEC) on 6 March 14, 2008, and accepted as complete by CEC on May 5, 2008.15 Commercial operation 7 is planned to begin in late 2011. The CEC released its Final Staff Assessment (FSA) on 8 October 22, 2009. The FSA is an evaluation of the BSEP application that presents the 9 commission’s analysis and recommendations. In its application, Beacon Solar proposed a 10 wet-cooling system that would draw its water from fresh groundwater on-site wells, which is 11
15 The complete AFC for BSEP is available electronically at http://www.energy.ca.gov/sitingcases/beacon/
index.html. Accessed Jan. 5, 2009.
Draft Solar PEIS F-14 December 2010
inconsistent with the State Water Resources Control Board and CEC water policies. The CEC 1 is concerned with the water usage and its source and suggested alternatives for Beacon’s 2 consideration. Alternatives include a shift to dry cooling or a different water source that uses 3 degraded groundwater from off-site wells. Beacon Solar continued to support wet cooling, 4 but agreed to use degraded water for its cooling system. In a status conference call on 5 December 1, 2009, BSEP discussed its analysis of three different possible water use plans. 6 However, BSEP continued to propose use of approximately 200 ac-ft/yr (247,000 m3/yr) of fresh 7 groundwater for processes including mirror washing and emergency usage. On January 12, 2010, 8 CEC released a Proposed Conditions of Certification, which would allow 8 ac-ft/yr (9,870 m3/yr) 9 of on-site groundwater for potable water needs and 47 ac-ft/yr (58,000 m3/yr) for emergency 10 purposes. As of January 2010, the CEC had not approved the project’s water source for 11 construction and operations water needs, and the water source for BSEP remained unresolved 12 (CEC 2009a). 13 14 Future utility-scale CSP facilities may also be hybrids that combine CSP technologies 15 with conventional fossil fuel generation, including integrated solar combined-cycle (ISCC) 16 systems, or even with energy generation technologies that use other renewable fuels, such as 17 biomass. Section F.2.4.4 discusses the feasibilities of such hybrid systems and provides some 18 examples of recently proposed hybrid systems. The environmental impacts of the fossil fuel–19 fired portions of such combinations are not evaluated in this PEIS. 20 21 22
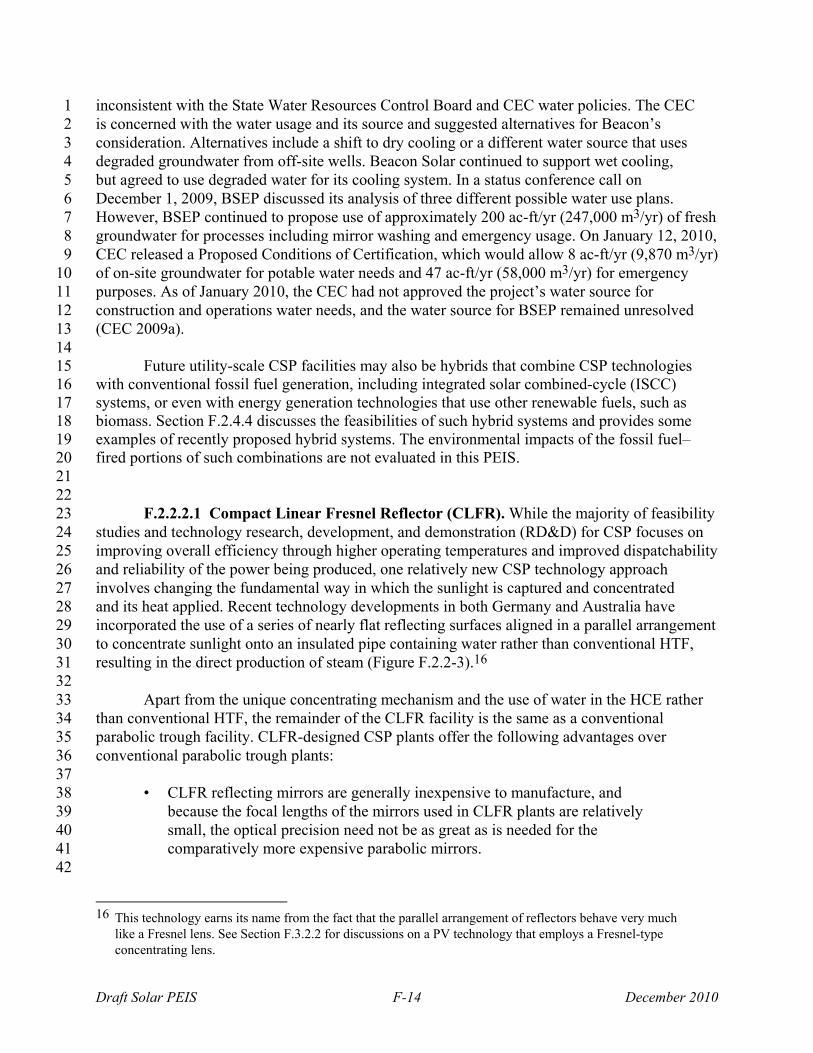
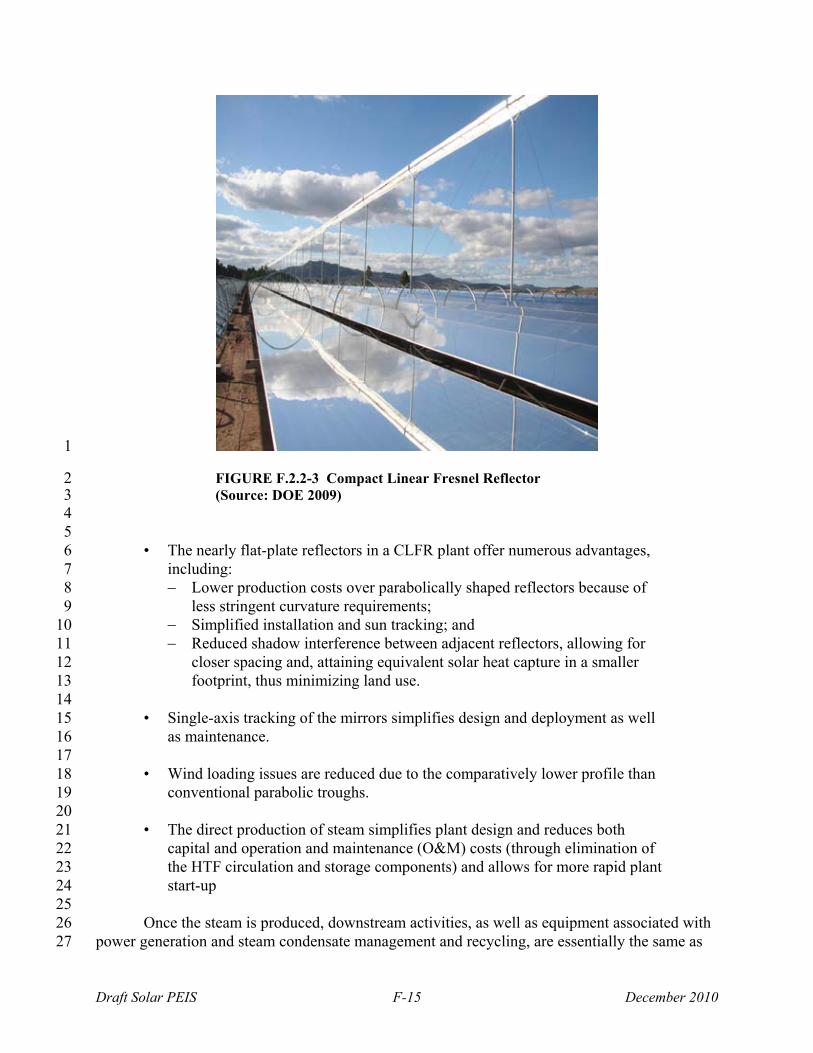
F.2.2.2.1 Compact Linear Fresnel Reflector (CLFR). While the majority of feasibility 23 studies and technology research, development, and demonstration (RD&D) for CSP focuses on 24 improving overall efficiency through higher operating temperatures and improved dispatchability 25 and reliability of the power being produced, one relatively new CSP technology approach 26 involves changing the fundamental way in which the sunlight is captured and concentrated 27 and its heat applied. Recent technology developments in both Germany and Australia have 28 incorporated the use of a series of nearly flat reflecting surfaces aligned in a parallel arrangement 29 to concentrate sunlight onto an insulated pipe containing water rather than conventional HTF, 30 resulting in the direct production of steam (Figure F.2.2-3).16 31 32 Apart from the unique concentrating mechanism and the use of water in the HCE rather 33 than conventional HTF, the remainder of the CLFR facility is the same as a conventional 34 parabolic trough facility. CLFR-designed CSP plants offer the following advantages over 35 conventional parabolic trough plants: 36 37
• CLFR reflecting mirrors are generally inexpensive to manufacture, and 38 because the focal lengths of the mirrors used in CLFR plants are relatively 39 small, the optical precision need not be as great as is needed for the 40 comparatively more expensive parabolic mirrors. 41 42
16 This technology earns its name from the fact that the parallel arrangement of reflectors behave very much
like a Fresnel lens. See Section F.3.2.2 for discussions on a PV technology that employs a Fresnel-type concentrating lens.
Draft Solar PEIS F-15 December 2010
1
FIGURE F.2.2-3 Compact Linear Fresnel Reflector 2 (Source: DOE 2009) 3
4 5
• The nearly flat-plate reflectors in a CLFR plant offer numerous advantages, 6 including: 7 Lower production costs over parabolically shaped reflectors because of 8
less stringent curvature requirements; 9 Simplified installation and sun tracking; and 10 Reduced shadow interference between adjacent reflectors, allowing for 11
closer spacing and, attaining equivalent solar heat capture in a smaller 12 footprint, thus minimizing land use. 13
14 • Single-axis tracking of the mirrors simplifies design and deployment as well 15
as maintenance. 16 17
• Wind loading issues are reduced due to the comparatively lower profile than 18 conventional parabolic troughs. 19 20
• The direct production of steam simplifies plant design and reduces both 21 capital and operation and maintenance (O&M) costs (through elimination of 22 the HTF circulation and storage components) and allows for more rapid plant 23 start-up 24
25 Once the steam is produced, downstream activities, as well as equipment associated with 26 power generation and steam condensate management and recycling, are essentially the same as 27
Draft Solar PEIS F-16 December 2010
for other parabolic trough facilities. Many aspects of CLFR technology are still under 1 development. If the anticipated reduced costs can offset the reductions in performance over a 2 trough collector and if CLFR facilities can operate at temperatures as high as 734°F (390°C), 3 as does a conventional trough plant, they are likely to find a potential market in utility-scale 4 power production. 5 6 No CLFR facilities were operating in the United States as of February 2010. Ausra CA II, 7 LLC (doing business as Carrizo Energy, LLC) recently submitted an AFC to the CEC (Carrizo 8 Energy, LLC 2007) for what would have been the first operating utility-scale CLFR facility–9 the Carrizo Energy Solar Farm (CESF), in San Luis Obispo County, California.17 The proposed 10 project was terminated in November 2009, but the application data is still assumed to be 11 generally representative of this category of CSP technology. 12 13 14
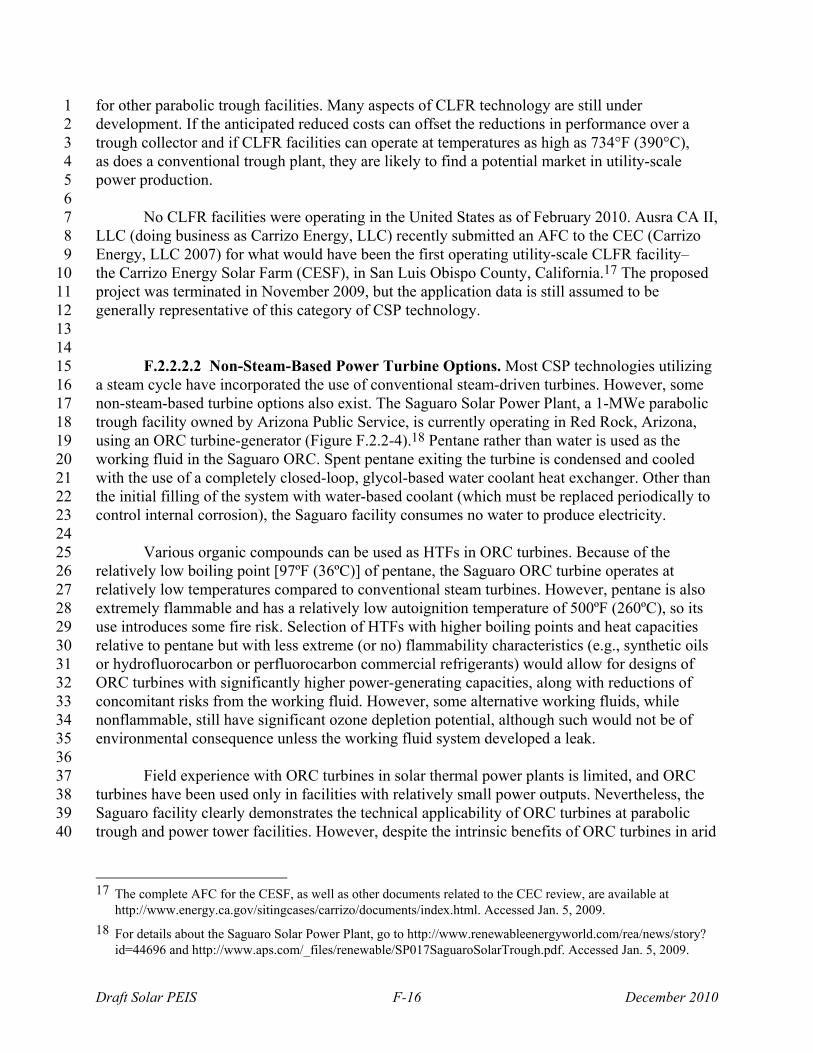
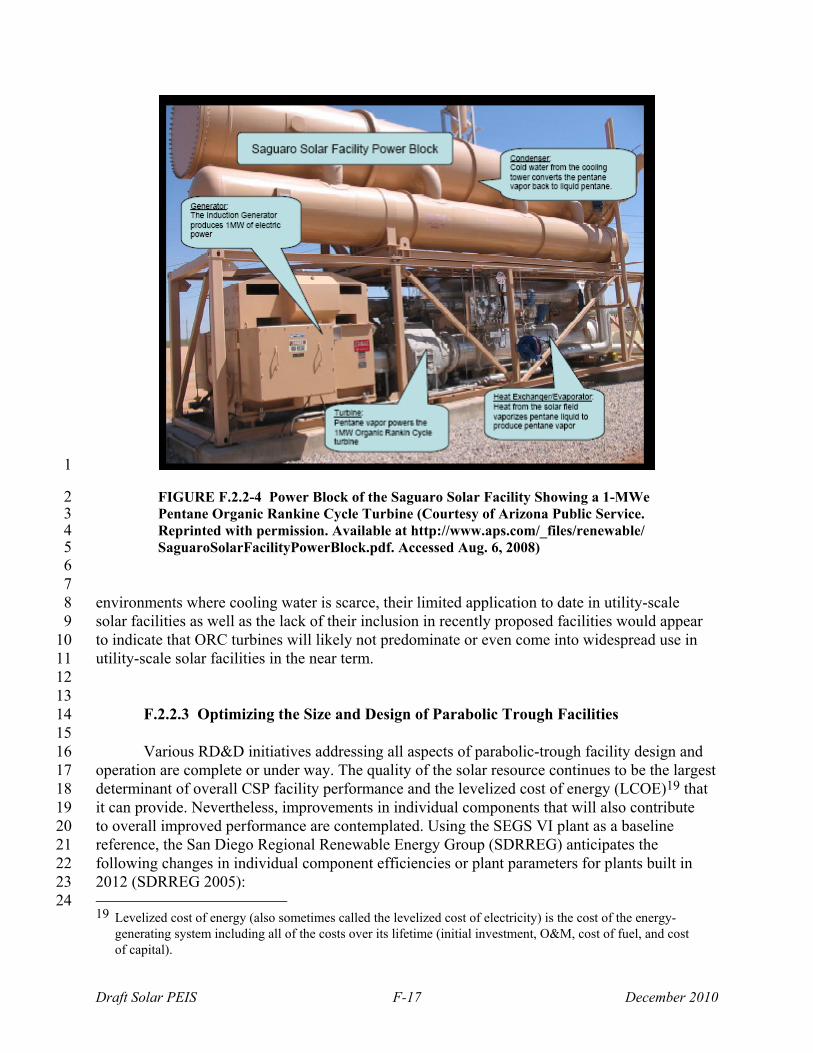
F.2.2.2.2 Non-Steam-Based Power Turbine Options. Most CSP technologies utilizing 15 a steam cycle have incorporated the use of conventional steam-driven turbines. However, some 16 non-steam-based turbine options also exist. The Saguaro Solar Power Plant, a 1-MWe parabolic 17 trough facility owned by Arizona Public Service, is currently operating in Red Rock, Arizona, 18 using an ORC turbine-generator (Figure F.2.2-4).18 Pentane rather than water is used as the 19 working fluid in the Saguaro ORC. Spent pentane exiting the turbine is condensed and cooled 20 with the use of a completely closed-loop, glycol-based water coolant heat exchanger. Other than 21 the initial filling of the system with water-based coolant (which must be replaced periodically to 22 control internal corrosion), the Saguaro facility consumes no water to produce electricity. 23 24 Various organic compounds can be used as HTFs in ORC turbines. Because of the 25 relatively low boiling point [97ºF (36ºC)] of pentane, the Saguaro ORC turbine operates at 26 relatively low temperatures compared to conventional steam turbines. However, pentane is also 27 extremely flammable and has a relatively low autoignition temperature of 500ºF (260ºC), so its 28 use introduces some fire risk. Selection of HTFs with higher boiling points and heat capacities 29 relative to pentane but with less extreme (or no) flammability characteristics (e.g., synthetic oils 30 or hydrofluorocarbon or perfluorocarbon commercial refrigerants) would allow for designs of 31 ORC turbines with significantly higher power-generating capacities, along with reductions of 32 concomitant risks from the working fluid. However, some alternative working fluids, while 33 nonflammable, still have significant ozone depletion potential, although such would not be of 34 environmental consequence unless the working fluid system developed a leak. 35 36 Field experience with ORC turbines in solar thermal power plants is limited, and ORC 37 turbines have been used only in facilities with relatively small power outputs. Nevertheless, the 38 Saguaro facility clearly demonstrates the technical applicability of ORC turbines at parabolic 39 trough and power tower facilities. However, despite the intrinsic benefits of ORC turbines in arid 40
17 The complete AFC for the CESF, as well as other documents related to the CEC review, are available at
http://www.energy.ca.gov/sitingcases/carrizo/documents/index.html. Accessed Jan. 5, 2009.
18 For details about the Saguaro Solar Power Plant, go to http://www.renewableenergyworld.com/rea/news/story? id=44696 and http://www.aps.com/_files/renewable/SP017SaguaroSolarTrough.pdf. Accessed Jan. 5, 2009.
Draft Solar PEIS F-17 December 2010
1
FIGURE F.2.2-4 Power Block of the Saguaro Solar Facility Showing a 1-MWe 2 Pentane Organic Rankine Cycle Turbine (Courtesy of Arizona Public Service. 3 Reprinted with permission. Available at http://www.aps.com/_files/renewable/ 4 SaguaroSolarFacilityPowerBlock.pdf. Accessed Aug. 6, 2008) 5
6 7 environments where cooling water is scarce, their limited application to date in utility-scale 8 solar facilities as well as the lack of their inclusion in recently proposed facilities would appear 9 to indicate that ORC turbines will likely not predominate or even come into widespread use in 10 utility-scale solar facilities in the near term. 11 12 13
F.2.2.3 Optimizing the Size and Design of Parabolic Trough Facilities 14 15 Various RD&D initiatives addressing all aspects of parabolic-trough facility design and 16 operation are complete or under way. The quality of the solar resource continues to be the largest 17 determinant of overall CSP facility performance and the levelized cost of energy (LCOE)19 that 18 it can provide. Nevertheless, improvements in individual components that will also contribute 19 to overall improved performance are contemplated. Using the SEGS VI plant as a baseline 20 reference, the San Diego Regional Renewable Energy Group (SDRREG) anticipates the 21 following changes in individual component efficiencies or plant parameters for plants built in 22 2012 (SDRREG 2005): 23
24 19 Levelized cost of energy (also sometimes called the levelized cost of electricity) is the cost of the energy-
generating system including all of the costs over its lifetime (initial investment, O&M, cost of fuel, and cost of capital).
Draft Solar PEIS F-18 December 2010
• Optical efficiency increase from 53.3% to 72%; 1 2
• Receiver thermal efficiency increase from 72.9% to 86.3%; 3 4
• Piping thermal efficiency increase from 96.1% to 97.0%; 5 6
• Storage thermal efficiency increase from 99.4% to 99.7%20; 7 8
• Power plant efficiency increase from 35% to 39.2%; 9 10
• Electric parasitic load increase from 82.7% to 92.9%; 11 12
• Power plant availability decrease from 98% to 94%; and 13 14
• Annual solar-to-electric efficiency increase from 10.6% to 17.1%. 15 16 Although data from the SEGS plants (see Section F.2.2.2) provide valuable field 17 experience for virtually all aspects of parabolic trough facility design and operation, they do not 18 define the ideal parabolic trough plant size and configuration.21 Many configurations and sizes 19 of parabolic trough facilities are possible. A study commissioned by the U.S. Department of 20 Energy’s (DOE’s) NREL explored the advantages, disadvantages, and probable configurations of 21 large-scale parabolic trough power plants in an effort to approximate the most preferred size and 22 configuration (Kelly 2006a). The study sought to identify the preferred plant size, that is, those 23 engineering dimensions and power-producing capacities that represent a favorable balance 24 among maximum capture of economies of scale, parasitic losses, and capital and operational 25 costs such that overall system efficiencies and economies are realized and the LCOE produced 26 is minimized. 27 28 Using utility- and industry-accepted models and parameters and published performance 29 characteristics of major components, Kelly (2006a) determined the preferred sizes for parabolic 30 trough facilities with and without TES. The major parameters evaluated in that study included 31 Rankine cycle STG frame sizes and performance characteristics,22 steam conditions, steam 32 feedwater system, solar field size and geometries, HTF pumping costs and pressure losses, 33 TES systems, steam cooling systems, and other parasitic losses associated with fluid transfers 34 (HTF, steam/condensate, cooling water [in wet recirculating systems—see Section F.2.4.2], and 35 molten salt [in TES systems—see Section F.2.4.3]), land acquisition and labor costs, as well as 36 capital and operational costs. Major conclusions of the study include the following: 37 38 20 Solar VI did not have thermal storage. Instead, the reference case is a hypothetical parabolic trough with 6-hour
TES using 2007-era technologies.
21 The ideal plant size and configuration is one that captures the maximum economies of scale for all components and aspects of plant operation while minimizing construction and operation/maintenance costs and parasitic losses (auxiliary loads that must be subtracted from the gross plant output).
22 STGs are available in discrete frame sizes, with the number of stages, turbine blade lengths, and inlet and outlet steam pressures dictating the power-production capacity of available variants within each frame size.
Draft Solar PEIS F-19 December 2010
• For parabolic trough plants using Therminol HTF with molten salt TES, a 1 capacity of 200 MWe is likely to be the upper limit for the most economic 2 plant. Multiple equipment items for the HTF and TES systems for larger 3 plants, as well as the Rankine cycle STGs approaching their maximum 4 efficiency of 38%, argue against any further increases in plant size. 5 6
• For parabolic trough plants using Therminol HTF without TES, the largest 7 economical plant size is 250 MWe. At this plant size, HTF system efficiencies 8 are maximized, and Rankine cycle STGs have attained their highest 9 efficiencies.23 10
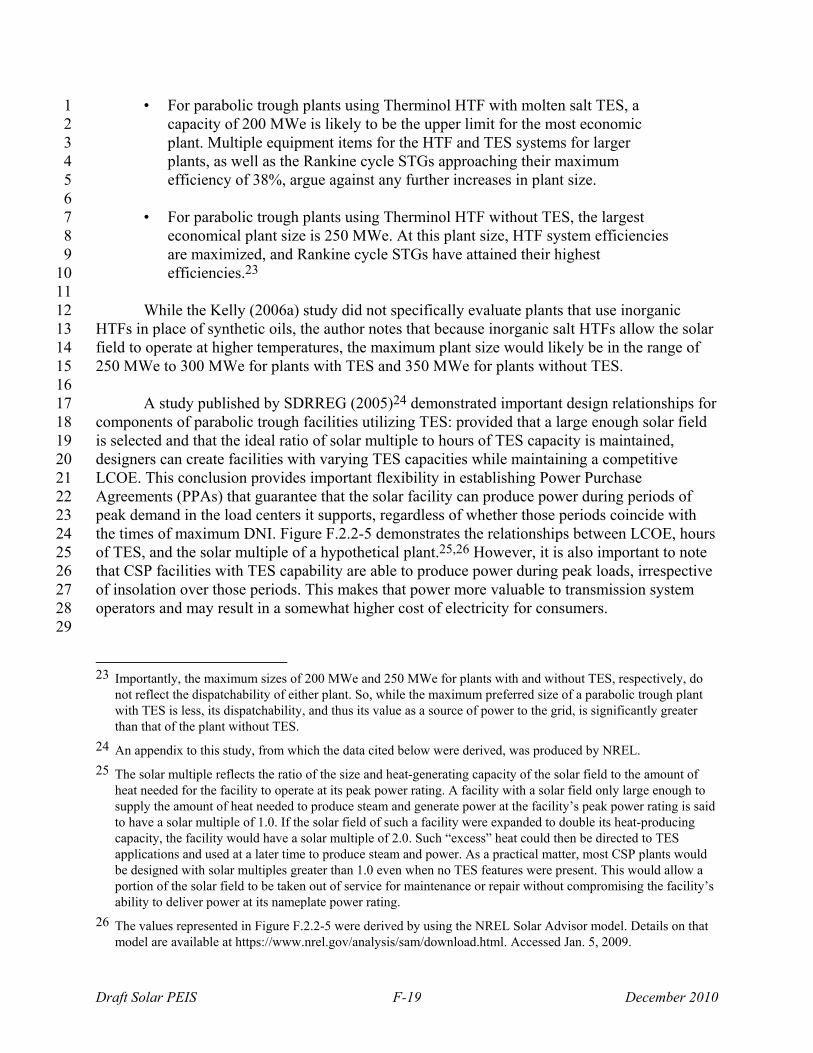
11 While the Kelly (2006a) study did not specifically evaluate plants that use inorganic 12 HTFs in place of synthetic oils, the author notes that because inorganic salt HTFs allow the solar 13 field to operate at higher temperatures, the maximum plant size would likely be in the range of 14 250 MWe to 300 MWe for plants with TES and 350 MWe for plants without TES. 15 16 A study published by SDRREG (2005)24 demonstrated important design relationships for 17 components of parabolic trough facilities utilizing TES: provided that a large enough solar field 18 is selected and that the ideal ratio of solar multiple to hours of TES capacity is maintained, 19 designers can create facilities with varying TES capacities while maintaining a competitive 20 LCOE. This conclusion provides important flexibility in establishing Power Purchase 21 Agreements (PPAs) that guarantee that the solar facility can produce power during periods of 22 peak demand in the load centers it supports, regardless of whether those periods coincide with 23 the times of maximum DNI. Figure F.2.2-5 demonstrates the relationships between LCOE, hours 24 of TES, and the solar multiple of a hypothetical plant.25,26 However, it is also important to note 25 that CSP facilities with TES capability are able to produce power during peak loads, irrespective 26 of insolation over those periods. This makes that power more valuable to transmission system 27 operators and may result in a somewhat higher cost of electricity for consumers. 28 29
23 Importantly, the maximum sizes of 200 MWe and 250 MWe for plants with and without TES, respectively, do
not reflect the dispatchability of either plant. So, while the maximum preferred size of a parabolic trough plant with TES is less, its dispatchability, and thus its value as a source of power to the grid, is significantly greater than that of the plant without TES.
24 An appendix to this study, from which the data cited below were derived, was produced by NREL.
25 The solar multiple reflects the ratio of the size and heat-generating capacity of the solar field to the amount of heat needed for the facility to operate at its peak power rating. A facility with a solar field only large enough to supply the amount of heat needed to produce steam and generate power at the facility’s peak power rating is said to have a solar multiple of 1.0. If the solar field of such a facility were expanded to double its heat-producing capacity, the facility would have a solar multiple of 2.0. Such “excess” heat could then be directed to TES applications and used at a later time to produce steam and power. As a practical matter, most CSP plants would be designed with solar multiples greater than 1.0 even when no TES features were present. This would allow a portion of the solar field to be taken out of service for maintenance or repair without compromising the facility’s ability to deliver power at its nameplate power rating.
26 The values represented in Figure F.2.2-5 were derived by using the NREL Solar Advisor model. Details on that model are available at https://www.nrel.gov/analysis/sam/download.html. Accessed Jan. 5, 2009.
Draft Solar PEIS F-20 December 2010
1
FIGURE F.2.2-5 Relationship between Solar Multiple and Levelized Cost of Energy for 2 Parabolic Trough Facilities with Various TES Capacities (Source: NREL, as cited in 3 SDRREG 2005) 4
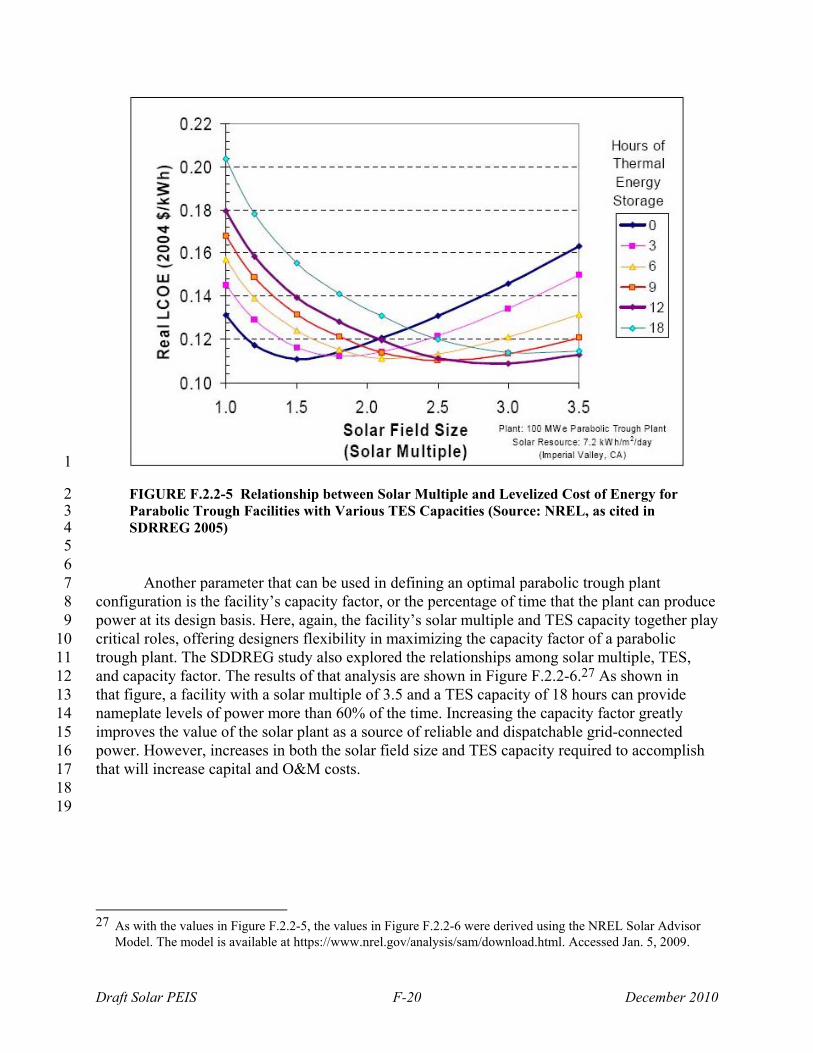
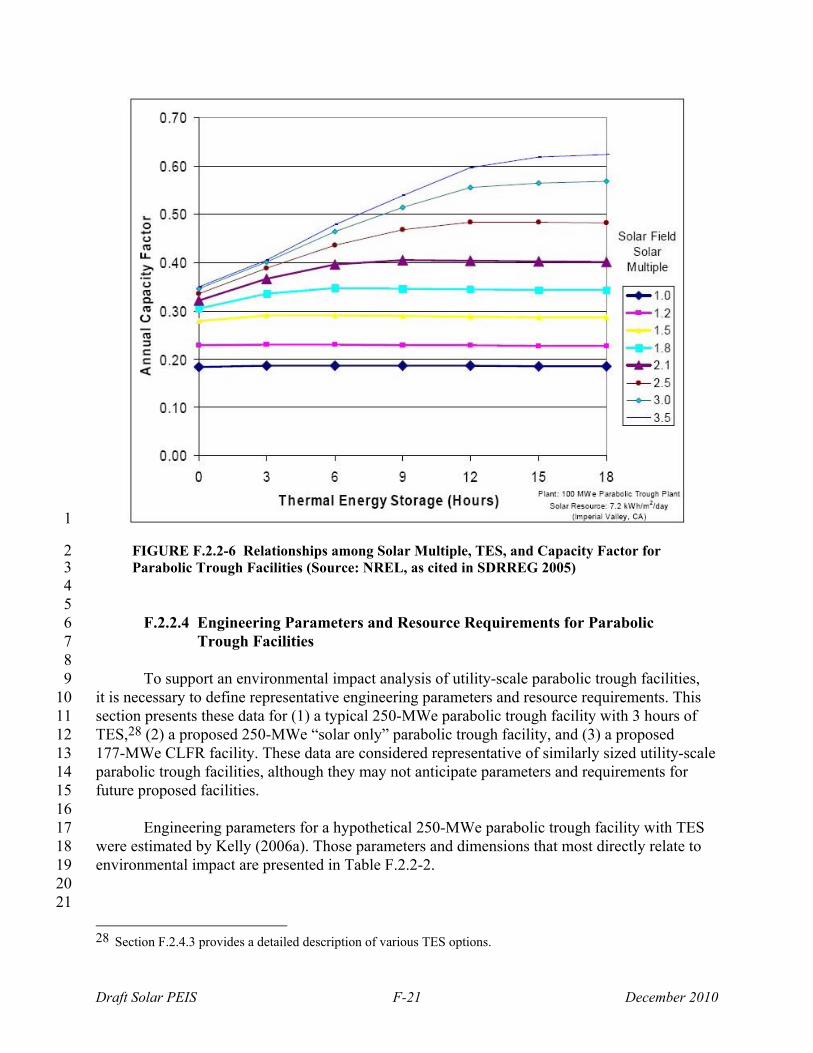
5 6 Another parameter that can be used in defining an optimal parabolic trough plant 7 configuration is the facility’s capacity factor, or the percentage of time that the plant can produce 8 power at its design basis. Here, again, the facility’s solar multiple and TES capacity together play 9 critical roles, offering designers flexibility in maximizing the capacity factor of a parabolic 10 trough plant. The SDDREG study also explored the relationships among solar multiple, TES, 11 and capacity factor. The results of that analysis are shown in Figure F.2.2-6.27 As shown in 12 that figure, a facility with a solar multiple of 3.5 and a TES capacity of 18 hours can provide 13 nameplate levels of power more than 60% of the time. Increasing the capacity factor greatly 14 improves the value of the solar plant as a source of reliable and dispatchable grid-connected 15 power. However, increases in both the solar field size and TES capacity required to accomplish 16 that will increase capital and O&M costs. 17 18 19
27 As with the values in Figure F.2.2-5, the values in Figure F.2.2-6 were derived using the NREL Solar Advisor
Model. The model is available at https://www.nrel.gov/analysis/sam/download.html. Accessed Jan. 5, 2009.
Draft Solar PEIS F-21 December 2010
1
FIGURE F.2.2-6 Relationships among Solar Multiple, TES, and Capacity Factor for 2 Parabolic Trough Facilities (Source: NREL, as cited in SDRREG 2005) 3
4 5
F.2.2.4 Engineering Parameters and Resource Requirements for Parabolic 6 Trough Facilities 7
8 To support an environmental impact analysis of utility-scale parabolic trough facilities, 9
it is necessary to define representative engineering parameters and resource requirements. This 10 section presents these data for (1) a typical 250-MWe parabolic trough facility with 3 hours of 11 TES,28 (2) a proposed 250-MWe “solar only” parabolic trough facility, and (3) a proposed 12 177-MWe CLFR facility. These data are considered representative of similarly sized utility-scale 13 parabolic trough facilities, although they may not anticipate parameters and requirements for 14 future proposed facilities. 15 16 Engineering parameters for a hypothetical 250-MWe parabolic trough facility with TES 17 were estimated by Kelly (2006a). Those parameters and dimensions that most directly relate to 18 environmental impact are presented in Table F.2.2-2. 19 20 21
28 Section F.2.4.3 provides a detailed description of various TES options.
Draft Solar PEIS F-22 December 2010
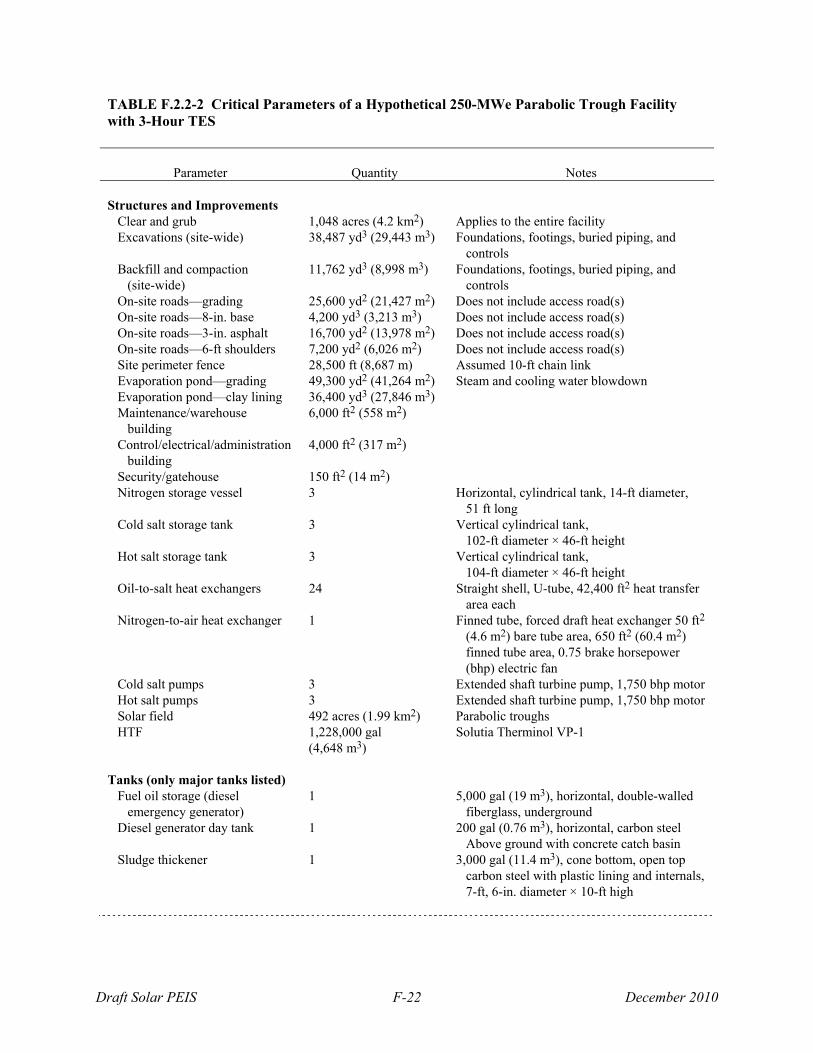
TABLE F.2.2-2 Critical Parameters of a Hypothetical 250-MWe Parabolic Trough Facility with 3-Hour TES
Parameter
Quantity
Notes
Structures and Improvements Clear and grub 1,048 acres (4.2 km2) Applies to the entire facility Excavations (site-wide) 38,487 yd3 (29,443 m3) Foundations, footings, buried piping, and
controls Backfill and compaction (site-wide)
11,762 yd3 (8,998 m3) Foundations, footings, buried piping, and controls
On-site roads—grading 25,600 yd2 (21,427 m2) Does not include access road(s) On-site roads—8-in. base 4,200 yd3 (3,213 m3) Does not include access road(s) On-site roads—3-in. asphalt 16,700 yd2 (13,978 m2) Does not include access road(s) On-site roads—6-ft shoulders 7,200 yd2 (6,026 m2) Does not include access road(s) Site perimeter fence 28,500 ft (8,687 m) Assumed 10-ft chain link Evaporation pond—grading 49,300 yd2 (41,264 m2) Steam and cooling water blowdown Evaporation pond—clay lining 36,400 yd3 (27,846 m3) Maintenance/warehouse building
6,000 ft2 (558 m2)
Control/electrical/administration building
4,000 ft2 (317 m2)
Security/gatehouse 150 ft2 (14 m2) Nitrogen storage vessel 3 Horizontal, cylindrical tank, 14-ft diameter,
51 ft long Cold salt storage tank 3 Vertical cylindrical tank,
102-ft diameter × 46-ft height Hot salt storage tank 3 Vertical cylindrical tank,
104-ft diameter × 46-ft height Oil-to-salt heat exchangers 24 Straight shell, U-tube, 42,400 ft2 heat transfer
area each Nitrogen-to-air heat exchanger 1 Finned tube, forced draft heat exchanger 50 ft2
(4.6 m2) bare tube area, 650 ft2 (60.4 m2) finned tube area, 0.75 brake horsepower (bhp) electric fan
Cold salt pumps 3 Extended shaft turbine pump, 1,750 bhp motor Hot salt pumps 3 Extended shaft turbine pump, 1,750 bhp motor Solar field 492 acres (1.99 km2) Parabolic troughs HTF 1,228,000 gal
(4,648 m3) Solutia Therminol VP-1
Tanks (only major tanks listed) Fuel oil storage (diesel emergency generator)
1 5,000 gal (19 m3), horizontal, double-walled fiberglass, underground
Diesel generator day tank 1 200 gal (0.76 m3), horizontal, carbon steel Above ground with concrete catch basin
Sludge thickener 1 3,000 gal (11.4 m3), cone bottom, open top carbon steel with plastic lining and internals, 7-ft, 6-in. diameter × 10-ft high
Draft Solar PEIS F-23 December 2010
TABLE F.2.2-2 (Cont.)
Parameter
Quantity
Notes
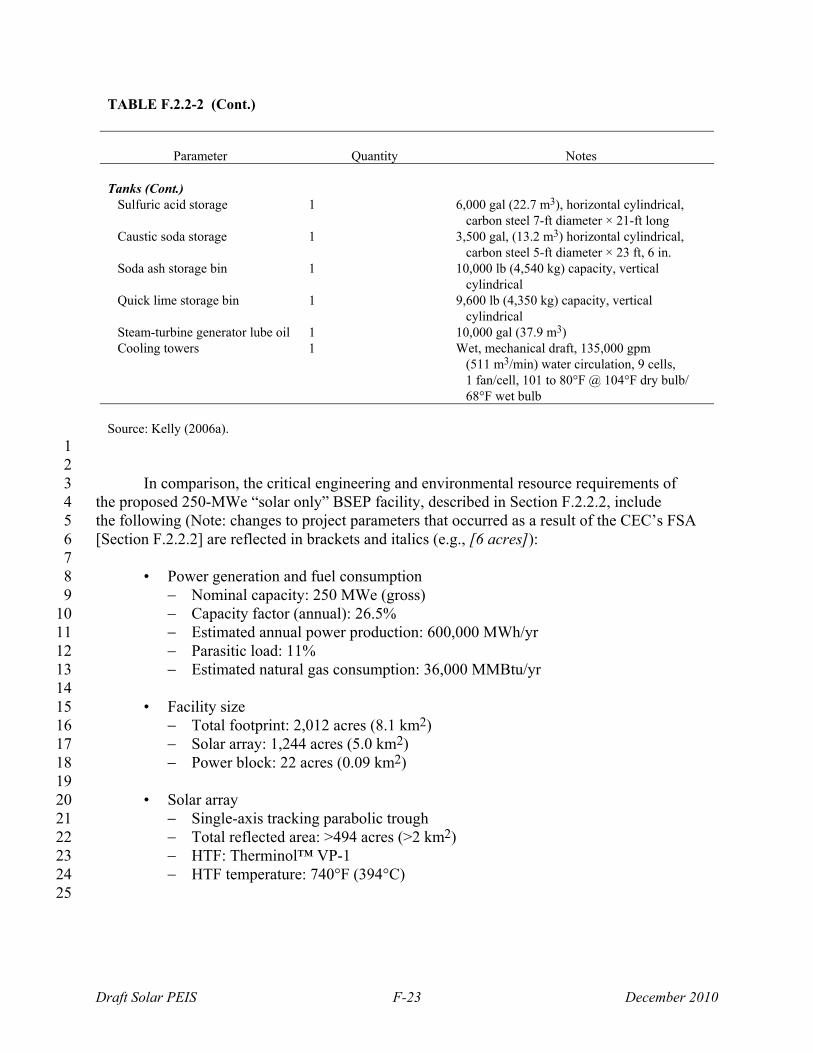
Tanks (Cont.) Sulfuric acid storage 1 6,000 gal (22.7 m3), horizontal cylindrical,
carbon steel 7-ft diameter × 21-ft long Caustic soda storage 1 3,500 gal, (13.2 m3) horizontal cylindrical,
carbon steel 5-ft diameter × 23 ft, 6 in. Soda ash storage bin 1 10,000 lb (4,540 kg) capacity, vertical
cylindrical Quick lime storage bin 1 9,600 lb (4,350 kg) capacity, vertical
cylindrical Steam-turbine generator lube oil 1 10,000 gal (37.9 m3) Cooling towers 1 Wet, mechanical draft, 135,000 gpm
(511 m3/min) water circulation, 9 cells, 1 fan/cell, 101 to 80°F @ 104°F dry bulb/ 68°F wet bulb
Source: Kelly (2006a).
1 2 In comparison, the critical engineering and environmental resource requirements of 3 the proposed 250-MWe “solar only” BSEP facility, described in Section F.2.2.2, include 4 the following (Note: changes to project parameters that occurred as a result of the CEC’s FSA 5 [Section F.2.2.2] are reflected in brackets and italics (e.g., [6 acres]): 6 7
• Power generation and fuel consumption 8 Nominal capacity: 250 MWe (gross) 9 Capacity factor (annual): 26.5% 10 Estimated annual power production: 600,000 MWh/yr 11 Parasitic load: 11% 12 Estimated natural gas consumption: 36,000 MMBtu/yr 13 14
• Facility size 15 Total footprint: 2,012 acres (8.1 km2) 16 Solar array: 1,244 acres (5.0 km2) 17 Power block: 22 acres (0.09 km2) 18 19
• Solar array 20 Single-axis tracking parabolic trough 21 Total reflected area: >494 acres (>2 km2) 22 HTF: Therminol™ VP-1 23 HTF temperature: 740°F (394°C) 24
25
Draft Solar PEIS F-24 December 2010
• Power block and ancillary equipment 1 STG and support equipment (1) 2 Water-cooled condenser (1) 3 Natural gas boilers (2) to aid in cold start-up and prevent freezing of HTF 4 Wet recirculating cooling with mechanical draft cooling tower 5 Emergency fire-water pump engine and diesel fuel tank 6 Diesel-fueled generator for emergency alternating current (AC) power 7 Batteries for emergency direct current (DC) power 8 Evaporation ponds (3), double-lined, 8.3 acres (0.03 km2) [2 acres 9
(0.01 km2)] each; 25 acres (0.1 km2) [6 acres (0.02 km2)] total 10 11
• Tanks 12 Raw water: 2,840,000 gal (10,751 m3) (vertical, field erected) 13 Treated water: 2,350,000 gal (8,896 m3) (vertical, field erected) 14 Demineralized water: 150,000 gal (568 m3) (vertical, field erected) 15 Sodium hydroxide (steam water treatment): 7,500 gal (28 m3) 16 Sulfuric acid (steam water treatment): 10,000 gal (38 m3) 17 Lubricating oil and diesel fuel: various sizes, largest <1,200 gal (4.5 m3) 18 19
• Transmission line: 230 kV, 3.5 mi (5.6 km) 20 21
• Water requirements and management 22 Source: off-site groundwater wells [on-site groundwater wells] 23 Consumption: average flow, 990 gpm (3.8 m3/min); peak flow, 4,054 gpm 24
(15.3 m3/min) [no update on this parameter was given in the 25 October 2009 FSA] 26
Zero-discharge evaporation ponds for cooling tower blowdown disposal 27 Estimated consumptive use: 1,600 ac-ft/yr (1.97 million m3/yr) 28
(1,388 ac-ft/yr [1.71 million m3/yr]) 29 Consumptive uses include wet, recirculating steam cycle cooling, 30
miscellaneous industrial processes, mirror washing, and potable and 31 sanitary uses 32
33 • Construction (includes natural gas connector pipeline and transmission line) 34
Project construction period: 25 months 35 Peak construction workforce: 836 36 Average construction workforce: 477 37
38 Critical engineering parameters and environmental resource demands for the proposed CLFR 39 CESF facility, described in Section F.2.2.2.1, include the following: 40 41
• Nominal capacity: 177 MWe (net); 230-kV interconnect voltage 42 43
• Anticipated construction period: 35 months 44 45
• Typical operating periods: 13 h/day, 4,765 h/yr 46 47
Draft Solar PEIS F-25 December 2010
• Overall plant size: 640 acres (2.6 km2); additional 380-acre (1.5-km2) 1 construction laydown area 2 3
• Buildings and major structures 4 Control/administration building: 3,000 ft2 (279 m2), 40 ft (12 m) high 5 STG building: 10,000 ft2 (930 m2), 60 ft (18.3 m) high 6 Air-cooled condensers (2): 55,000 ft2 (5,120 m2) footprint, 115 ft (35 m) 7
high 8 Water treatment facility: 300 ft2 (28 m2), 20 ft (6.1 m) high 9 Warehouse/shop building: 11,250 ft2 (1,046 m2), 20 ft (6.1 m) high 10 Fire water pump building: 1,000 ft2 (93 m2) by 15 ft (4.6 m) high 11 Blowdown tank (vertical) (29,000 gal [110 m3]): 12 ft (3.7 m) diameter by 12
25 ft (7.6 m) high 13 Condensate tank (horizontal) (20, 000 gal [76 m3]): 10 ft (3.0 m) diameter 14
by 26 ft (7.9 m) long by 20 ft (6.1 m) high 15 Raw fire water tank (vertical) (450,000 gal [1,703 m3]): 56 ft (17 m) 16
diameter by 28 ft (8.5 m) high 17 Service water tank (vertical) (150,000 gal [568 m3]): 36 ft (11 m) diameter 18
by 19 ft (5.9 m) high 19 Decimalized water tank (vertical) (40,000 gal [151 m3]): 17 ft (5.2 m) 20
diameter by 28 ft (8.5 m) high 21 22
• Solar field: 618 acres (2.5 km2) 23 195 CLFR “lines:” each 90 ft (27.4 m) wide by 1,268 ft (387 m) long by 24
5 ft (1.5 m) high and each consisting of 10 mirrors reflecting sunlight to a 25 linear Fresnel lens that focuses heat on a stationary steam tube 26
27 • Internal roadways: 7 mi (11 km) 28
29 • High perimeter fencing: 10 ft (3.0 m) 30
31 • Steam production: 2.52 million lb/h (1.14 million kg/h) at 720 psia (49.6 bar) 32
33 • Water demands (based on 4,765 h/yr of operation): 34
Average daily water consumption (for various maintenance processes and 35 steam cycles): 18,500 gal (70 m3) 36
Average annual water consumption: 21.8 ac-ft (26,890 m3), based on 37 average annual conditions of 95°F (35°C) at 100% load for 4,745 h/yr 38 with mirror washing 250 days/yr 39
All water supplied by on-site well 40 41 42 F.2.3 Solar Power Tower Technologies 43 44 Although power tower technology shares many characteristics with parabolic trough 45 technology, it has distinct differences. Parabolic reflectors of a parabolic trough facility act as 46 line concentrators, focusing the sun’s heat on a corresponding segment of an HTF-filled tube. All 47
Draft Solar PEIS F-26 December 2010
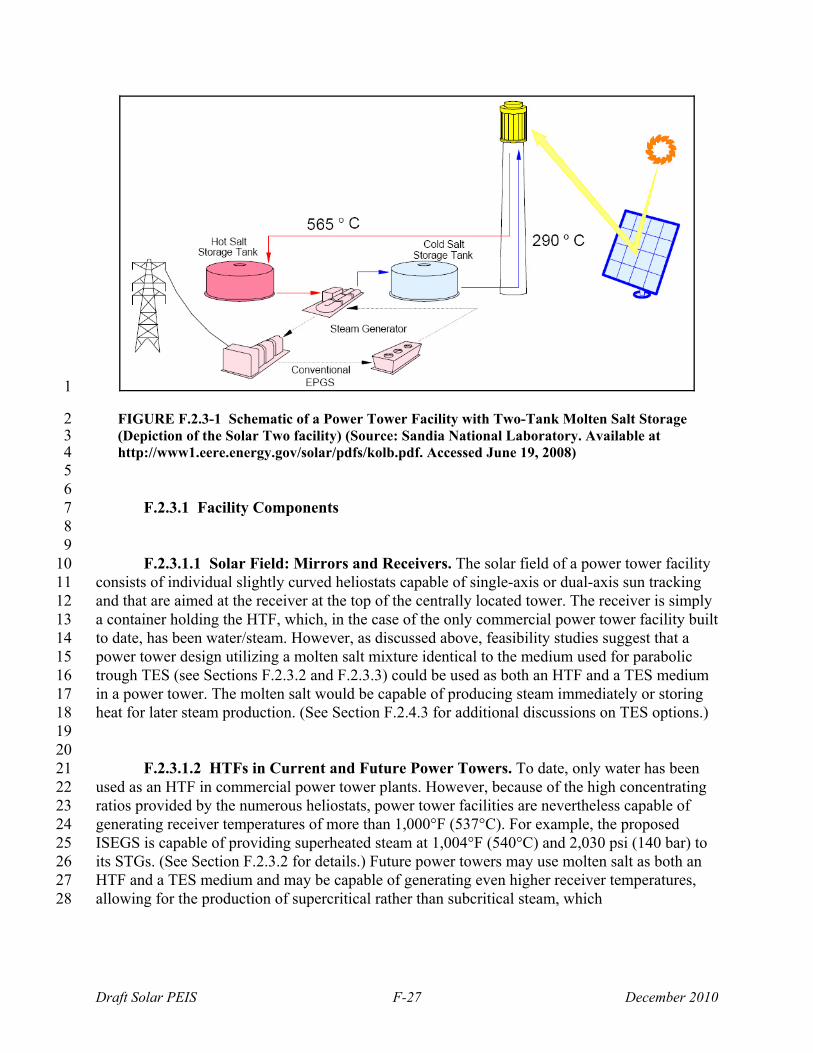
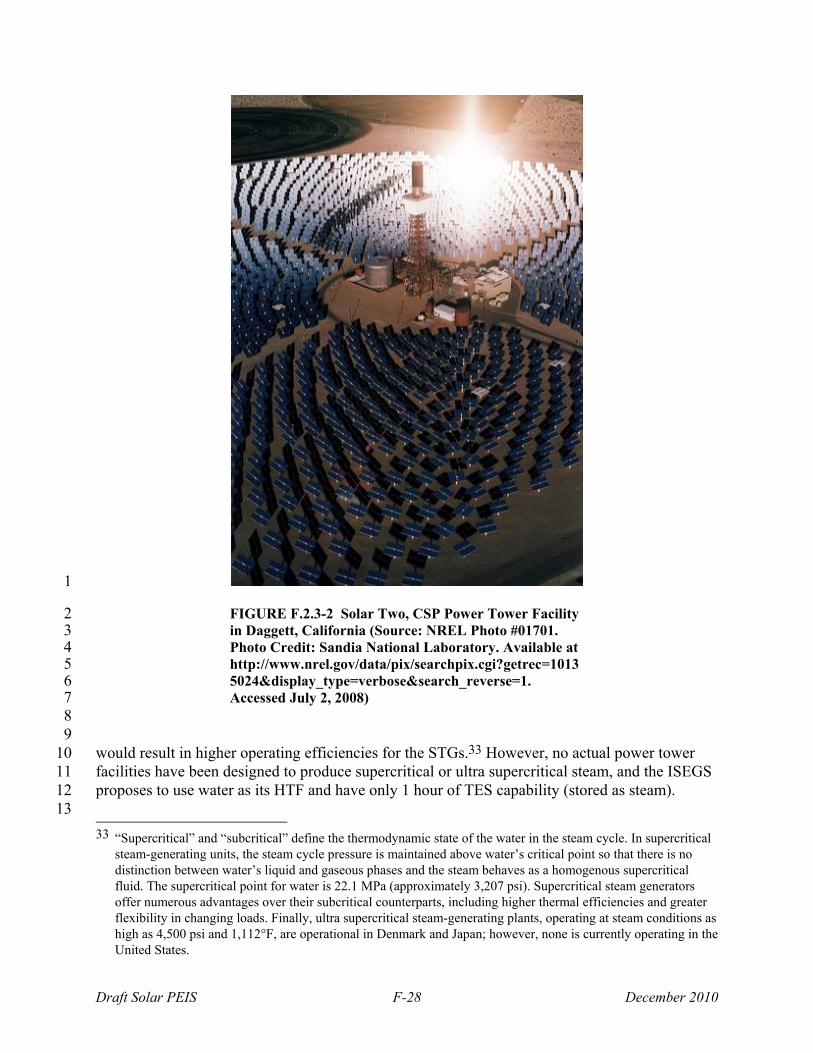
of the power tower’s nearly flat plate reflectors29 (known as heliostats) work collectively as 1 point concentrators, focusing the sun’s heat on a central point at the top of a centrally located 2 tower. Two large-scale research and demonstration facilities, the 10-MW Solar One facility near 3 Barstow, California, and Solar Two, a retrofit of Solar One that incorporated molten salt storage, 4 were operated in the United States from 1982 to 1997 and produced more than 38,000 MWh of 5 electricity. Both plants proved the viability of tower technology. Furthermore, Solar Two, which 6 at one point operated continuously at nameplate rating for 7 days, demonstrated the value of 7 molten salt TES when combined with power tower technology to greatly improve the 8 dispatchability of electricity from power towers. 9 10 Only one power tower facility with a power capacity of greater than 10 MW is currently 11 operational in the world: PS10 in the Solucar Solar Park in Spain. PS10 consists of a central 12 377-ft (115-m) tower and 624 heliostats that focus the sun’s radiation onto the uppermost part of 13 the tower. Each heliostat has a reflecting surface area of 1,291 ft2 (120 m2) for a total reflecting 14 surface area of 807,605 ft2 (75,000 m2). The facility has a nameplate rating of 11 MWe using 15 only the solar field to produce steam. That rating can be augmented by as much as 12% to 15% 16 with the introduction of a natural gas boiler to increase steam production. A companion plant, 17 PS20, which has twice the power capacity, was scheduled to be commissioned in 2008.30 18 19 The heliostats’ central point focus is a receiver positioned at the top of a tower that is at 20 the center of an array of heliostats.31 Depending on the number and positioning of the heliostats 21 and the insolation available, the heat transfer medium at the receiver can be heated to as high as 22 1,050°F (565.5°C) (see DOE 2009).32 Once the sun’s reflected and concentrated heat is 23 captured, the downstream activities of producing steam and subsequently using that steam in a 24 Rankine cycle STG are essentially identical to those activities in a parabolic trough facility. A 25 conceptual power tower facility with molten salt TES is shown in Figure F.2.3-1. An aerial 26 photograph of the Solar Two facility in Barstow, California, is shown in Figure F.2.3-2. 27 28 29
29 Heliostats have a slight curvature. The amount of curvature dictates the focal length of the reflector. For power
towers, the focal lengths of the reflectors (the distance from the reflector to the point at the top of the tower on which the heliostats are focused) is much greater (on the order of tens or even hundreds of feet) than the focal length of a typical parabolic trough facility, where the focus of the reflector is the HCE, which is only a few feet from the reflecting surface.
30 Details on PS10 and PS20 are available at http://www.abengoasolar.com/sites/solar/en/. Accessed Jan. 5, 2009.
31 Heliostats need not completely surround the tower; however, a recently proposed power tower facility incorporates such a 360° array—see Sections F.2.3.2 and F.2.3.3.
32 This temperature can be attained only in a power tower facility with molten salt TES. Power tower facilities that store heat as steam operate at lower temperatures. For example, the PS10 facility in Spain operates at a steam temperature of 450°F (232°C) (and a pressure of 500 pounds per square inch [psi]).
Draft Solar PEIS F-27 December 2010
1
FIGURE F.2.3-1 Schematic of a Power Tower Facility with Two-Tank Molten Salt Storage 2 (Depiction of the Solar Two facility) (Source: Sandia National Laboratory. Available at 3 http://www1.eere.energy.gov/solar/pdfs/kolb.pdf. Accessed June 19, 2008) 4
5 6
F.2.3.1 Facility Components 7 8 9
F.2.3.1.1 Solar Field: Mirrors and Receivers. The solar field of a power tower facility 10 consists of individual slightly curved heliostats capable of single-axis or dual-axis sun tracking 11 and that are aimed at the receiver at the top of the centrally located tower. The receiver is simply 12 a container holding the HTF, which, in the case of the only commercial power tower facility built 13 to date, has been water/steam. However, as discussed above, feasibility studies suggest that a 14 power tower design utilizing a molten salt mixture identical to the medium used for parabolic 15 trough TES (see Sections F.2.3.2 and F.2.3.3) could be used as both an HTF and a TES medium 16 in a power tower. The molten salt would be capable of producing steam immediately or storing 17 heat for later steam production. (See Section F.2.4.3 for additional discussions on TES options.) 18 19 20
F.2.3.1.2 HTFs in Current and Future Power Towers. To date, only water has been 21 used as an HTF in commercial power tower plants. However, because of the high concentrating 22 ratios provided by the numerous heliostats, power tower facilities are nevertheless capable of 23 generating receiver temperatures of more than 1,000°F (537°C). For example, the proposed 24 ISEGS is capable of providing superheated steam at 1,004°F (540°C) and 2,030 psi (140 bar) to 25 its STGs. (See Section F.2.3.2 for details.) Future power towers may use molten salt as both an 26 HTF and a TES medium and may be capable of generating even higher receiver temperatures, 27 allowing for the production of supercritical rather than subcritical steam, which 28
Draft Solar PEIS F-28 December 2010
1
FIGURE F.2.3-2 Solar Two, CSP Power Tower Facility 2 in Daggett, California (Source: NREL Photo #01701. 3 Photo Credit: Sandia National Laboratory. Available at 4 http://www.nrel.gov/data/pix/searchpix.cgi?getrec=10135 5024&display_type=verbose&search_reverse=1. 6 Accessed July 2, 2008) 7
8 9 would result in higher operating efficiencies for the STGs.33 However, no actual power tower 10 facilities have been designed to produce supercritical or ultra supercritical steam, and the ISEGS 11 proposes to use water as its HTF and have only 1 hour of TES capability (stored as steam). 12
13 33 “Supercritical” and “subcritical” define the thermodynamic state of the water in the steam cycle. In supercritical
steam-generating units, the steam cycle pressure is maintained above water’s critical point so that there is no distinction between water’s liquid and gaseous phases and the steam behaves as a homogenous supercritical fluid. The supercritical point for water is 22.1 MPa (approximately 3,207 psi). Supercritical steam generators offer numerous advantages over their subcritical counterparts, including higher thermal efficiencies and greater flexibility in changing loads. Finally, ultra supercritical steam-generating plants, operating at steam conditions as high as 4,500 psi and 1,112°F, are operational in Denmark and Japan; however, none is currently operating in the United States.

Draft Solar PEIS F-29 December 2010
The use of molten salt HTF would result in special design and operating demands. For 1 example, the circulation pumps would need to be constructed of materials compatible with the 2 salt and would need to be designed to withstand the expected higher operating temperatures. 3 Preventive maintenance to preempt corrosive deterioration of salt management systems, heat 4 tracing on all transfer piping to ensure that the salt’s temperature stays above its eutectic point, 5 and supplemental heating during down periods to shorten cold start-up periods might be 6 required, all of which would create an increased parasitic load for the facility. 7 8 9
F.2.3.2 Utility-Scale Power Tower Facilities 10 11 As noted above, the ISEGS is a proposed utility-scale power tower facility that, if 12 approved, will be located near the Ivanpah Dry Lake in San Bernardino County, California, on 13 land administered by the U.S. Department of the Interior (DOI) Bureau of Land Management 14 (BLM).34 An AFC (BrightSource Energy, Inc. 2007) for ISEGS was submitted to the CEC on 15 August 28, 2007, and deemed complete by the CEC on October 31, 2007.35 The FSA and Draft 16 Environmental Impact Statement (CEC 2009b) was published on November 4, 2009.36 Project 17 parameters were changed during the CEC’s evaluation of the AFC and are reflected in brackets 18 and italics (e.g., [270 MWe]) in the requirements listed below. Changes in design optimization 19 were made in response to data requests from CEC to the applicant and mostly include reduction 20 in the number of heliostats, increased heliostat surface area, movement of project boundaries, 21 and reduction in the number of power towers. On February 11, 2010, BrightSource submitted a 22 Biological Mitigation Proposal that would reduce impacts to biological and visual resources. 23 The mitigated ISEGS 3 configuration includes further reduction in the project footprint, number 24 of heliostats, and number of towers. It also results in a capacity reduction to ISGES 3 from a 25 nominal 200 MWe to 170 MWe (CEC 2010). 26 27 The ISEGS facility is proposed to be built in three phases. ISEGS 1 and ISEGS 2 will 28 each have a nominal rating of 100 MWe, while ISEGS 3 will be rated at 200 [170] MWe, for a 29 total facility capacity of 400 [370] MWe. Each phase will be capable of independent operation, 30 and each will be supported by a natural gas boiler that will shorten cold start-up times. Some 31 functions of facility operation will be centralized to support all three ISEGS phases while 32 minimizing the environmental footprint of the facility. 33 34
35
34 Project approved. Updated information will be included in the Final PEIS.
35 The complete AFC for the ISEGS, as well as documents related to the CEC review, are available at http://www.energy.ca.gov/sitingcases/ivanpah/documents/index.html. Accessed Jan. 5, 2009.
36 The complete FSA and Draft Environmental Impacts Statement are available at http://www.energy.ca.gov/2008publications/CEC-700-2008-013/FSA/. Accessed Nov. 20, 2009.
Draft Solar PEIS F-30 December 2010
F.2.3.3 Engineering Parameters and Resource Requirements for Power Tower 1 Facilities 2
3 To support an environmental impact analysis of utility-scale power tower facilities, it is 4 necessary to define representative engineering parameters and resource requirements. This 5 section presents these data for the proposed ISEGS facility described in Section F.2.3.2. These 6 data are considered to be representative of similarly sized utility-scale power tower facilities, 7 although they may not anticipate parameters and requirements for future proposed facilities. 8 9
Salient engineering parameters and environmental resource requirements for the ISEGS 10 facility include the following (Note: changes to project parameters that occurred during the 11 CEC’s evaluation of the AFC are reflected in brackets and italics): 12 13
• Power ratings 14 - ISEGS 1 and ISEGS 2: 100 MWe each [ISEGS 1: 120 MW; ISEGS 2: 15
125 MW] 16 ISEGS 3: 200 MWe [ISEGS 3: 125 MW] 17
18 • Land area 19
ISEGS 1 and ISEGS 2: 850 acres (3.4 km2) each [914 acres (3.7 km2) and 20 1,097 acres (3.7 km2), respectively] 21
ISEGS 3: 1,660 acres (6.7 km2) [1,227 acres (7.4 km2)] 22 Total facility (ISEGS 1, 2, and 3 plus shared facilities): 3,400 acres 23
(13.8 km2) [3,582 acres (16.5 km2)] 24 25
• Towers and heliostat arrays 26 Towers: three [one] each for ISEGS 1 and 2, four [one] for ISEGS 3 27 Tower heights: 312 ft (95 m) for ISEGS 1 and 2, 459 ft (140 m) for 28
ISEGS 3 [459 ft [140 m] for ISEGS 1, 2 and 3] 29 Heliostats (each): 7.2 ft (2.2 m) high, 10.5 ft (3.2 m) wide, 75.6-ft2 30
(7.04-m2) reflection surface area (an overall height of 12 ft [3.6 m]) 31 Heliostat arrays: 68,000 each for ISEGS 1 and ISEGS 2 [53,500 for 32
ISEGS 1, 60,000 for ISEGS 2], 136,000 [60,000] for ISEGS 3 33 34
• Air-cooled condensers for each steam cycle 35 36
• Natural gas boiler for each tower 37 Used to shorten cold start-up times and sustain power outputs during brief 38
cloudy/stormy periods 39 Heat-generating capacity no more than 5% of the heat supplied by the 40
heliostats 41 Operation no more than 4 h/day 42 Average boiler usage of less than 1 h/day 43
44 45
Draft Solar PEIS F-31 December 2010
• Water 1 Source: on-site well 2 Consumption (mirror washing, miscellaneous industrial processes, potable 3
use): <100 ac-ft/yr (123,350 m3/yr) total for all three plants 4 5
• Construction period: 48 months (all phases with some overlap) 6 7
• Employment 8 Construction: 959 total jobs (averaging 474 over entire construction 9
period) 10 Operation: 90 full-time employees 11
12 13 F.2.4 Common Systems and Hybrid Systems for Parabolic Trough and Power Tower 14
Facilities 15 16 17
F.2.4.1 Power Plant Systems 18 19 Although the mechanisms for producing steam are different for parabolic trough and 20 power tower facilities, the downstream power-generating activities of both technologies are 21 essentially identical. The power plant system, sometimes referred to as the power block, is 22 defined as that portion of the facility at which electrical power is generated. In typical parabolic 23 trough and power tower facilities that generate electricity from only solar energy, the power 24 block includes the (1) steam heat exchanger at which steam is produced, (2) STG that produces 25 electricity, and (3) electrical equipment contained in a substation where the electrical power 26 is converted to AC, transformed to the appropriate voltage, conditioned, and otherwise 27 synchronized for delivery to the bulk electrical grid to which the solar facility is connected. All 28 components of the power block from the steam condenser downstream are virtually identical in 29 form and function to the components composing the power blocks of a conventional fossil fuel 30 thermal power plant. 31 32 Superheated steam from the heat exchanger drives a Rankine cycle STG. Leaving 33 the STG, the spent steam is condensed in a standard condenser, and condensate is returned to 34 the heat exchanger via condensate and feedwater pumps after appropriate chemical treatment. 35 Heat absorbed by the steam condenser can be rejected by a variety of cooling systems 36 (see Section F.2.4.2). 37 38 The balance of plant for the power block typically includes a SCADA system to monitor 39 and control plant operations, the various pumps and piping systems by which HTF and steam 40 water are circulated, air compressors, the steam condenser, the chemical treatment equipment 41 used to condition the steam condensate before recycling, and the cooling system used to reject 42 heat from the steam condenser (including chemical treatment equipment when cooling water is 43 recirculated). Much of this equipment is likely to be housed in a central operations building. 44 Warehouse and shop buildings are also likely to be present. Also typically present are diesel-45 fueled emergency generators and/or storage batteries to provide power during power failures for 46
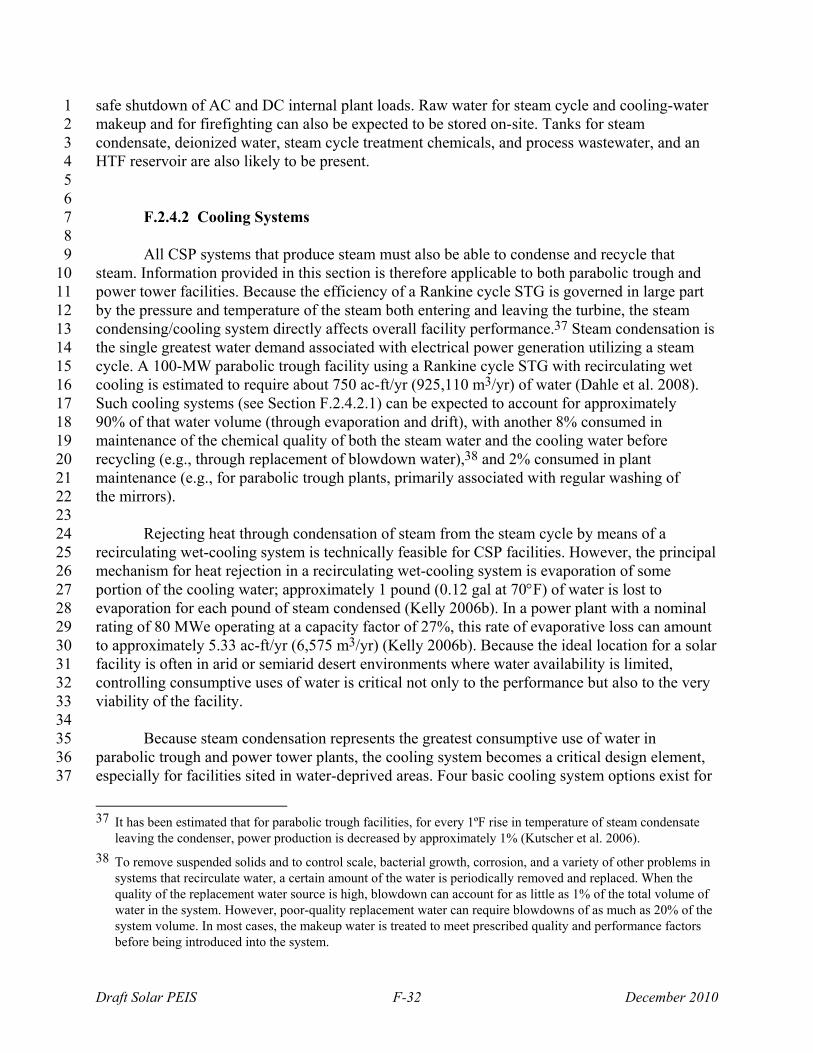
Draft Solar PEIS F-32 December 2010
safe shutdown of AC and DC internal plant loads. Raw water for steam cycle and cooling-water 1 makeup and for firefighting can also be expected to be stored on-site. Tanks for steam 2 condensate, deionized water, steam cycle treatment chemicals, and process wastewater, and an 3 HTF reservoir are also likely to be present. 4 5 6
F.2.4.2 Cooling Systems 7 8 All CSP systems that produce steam must also be able to condense and recycle that 9 steam. Information provided in this section is therefore applicable to both parabolic trough and 10 power tower facilities. Because the efficiency of a Rankine cycle STG is governed in large part 11 by the pressure and temperature of the steam both entering and leaving the turbine, the steam 12 condensing/cooling system directly affects overall facility performance.37 Steam condensation is 13 the single greatest water demand associated with electrical power generation utilizing a steam 14 cycle. A 100-MW parabolic trough facility using a Rankine cycle STG with recirculating wet 15 cooling is estimated to require about 750 ac-ft/yr (925,110 m3/yr) of water (Dahle et al. 2008). 16 Such cooling systems (see Section F.2.4.2.1) can be expected to account for approximately 17 90% of that water volume (through evaporation and drift), with another 8% consumed in 18 maintenance of the chemical quality of both the steam water and the cooling water before 19 recycling (e.g., through replacement of blowdown water),38 and 2% consumed in plant 20 maintenance (e.g., for parabolic trough plants, primarily associated with regular washing of 21 the mirrors). 22 23 Rejecting heat through condensation of steam from the steam cycle by means of a 24 recirculating wet-cooling system is technically feasible for CSP facilities. However, the principal 25 mechanism for heat rejection in a recirculating wet-cooling system is evaporation of some 26 portion of the cooling water; approximately 1 pound (0.12 gal at 70F) of water is lost to 27 evaporation for each pound of steam condensed (Kelly 2006b). In a power plant with a nominal 28 rating of 80 MWe operating at a capacity factor of 27%, this rate of evaporative loss can amount 29 to approximately 5.33 ac-ft/yr (6,575 m3/yr) (Kelly 2006b). Because the ideal location for a solar 30 facility is often in arid or semiarid desert environments where water availability is limited, 31 controlling consumptive uses of water is critical not only to the performance but also to the very 32 viability of the facility. 33 34 Because steam condensation represents the greatest consumptive use of water in 35 parabolic trough and power tower plants, the cooling system becomes a critical design element, 36 especially for facilities sited in water-deprived areas. Four basic cooling system options exist for 37
37 It has been estimated that for parabolic trough facilities, for every 1ºF rise in temperature of steam condensate
leaving the condenser, power production is decreased by approximately 1% (Kutscher et al. 2006).
38 To remove suspended solids and to control scale, bacterial growth, corrosion, and a variety of other problems in systems that recirculate water, a certain amount of the water is periodically removed and replaced. When the quality of the replacement water source is high, blowdown can account for as little as 1% of the total volume of water in the system. However, poor-quality replacement water can require blowdowns of as much as 20% of the system volume. In most cases, the makeup water is treated to meet prescribed quality and performance factors before being introduced into the system.
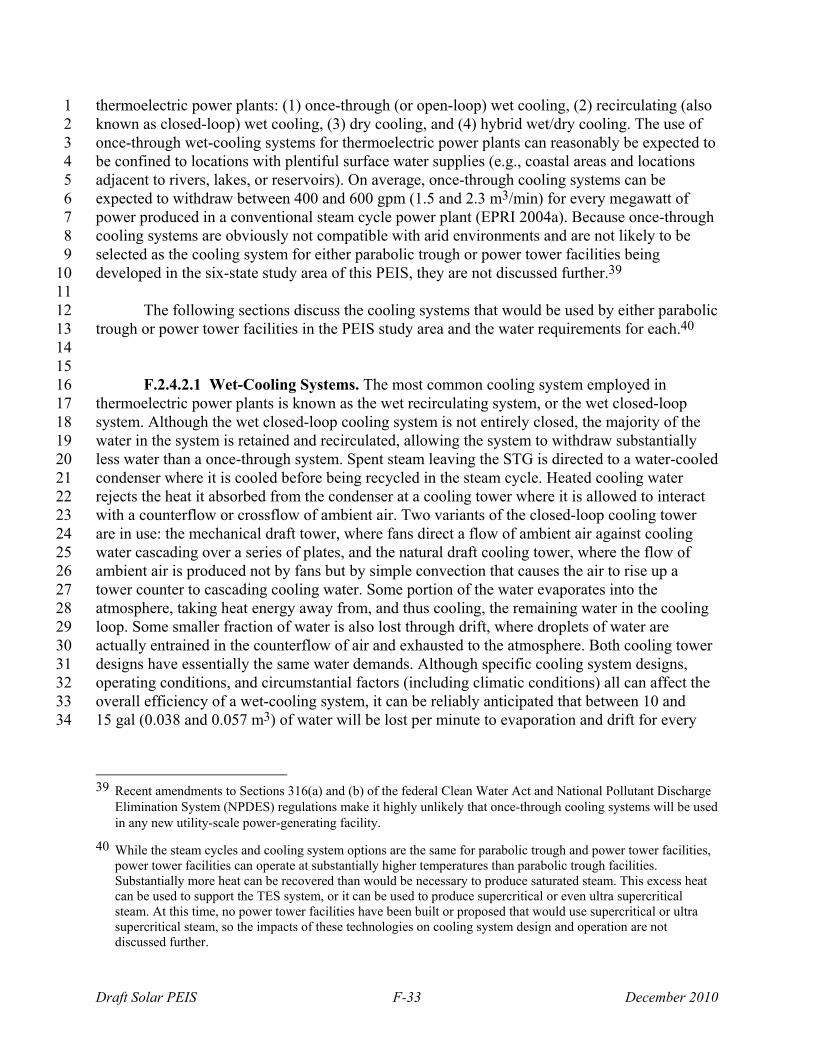
Draft Solar PEIS F-33 December 2010
thermoelectric power plants: (1) once-through (or open-loop) wet cooling, (2) recirculating (also 1 known as closed-loop) wet cooling, (3) dry cooling, and (4) hybrid wet/dry cooling. The use of 2 once-through wet-cooling systems for thermoelectric power plants can reasonably be expected to 3 be confined to locations with plentiful surface water supplies (e.g., coastal areas and locations 4 adjacent to rivers, lakes, or reservoirs). On average, once-through cooling systems can be 5 expected to withdraw between 400 and 600 gpm (1.5 and 2.3 m3/min) for every megawatt of 6 power produced in a conventional steam cycle power plant (EPRI 2004a). Because once-through 7 cooling systems are obviously not compatible with arid environments and are not likely to be 8 selected as the cooling system for either parabolic trough or power tower facilities being 9 developed in the six-state study area of this PEIS, they are not discussed further.39 10 11 The following sections discuss the cooling systems that would be used by either parabolic 12 trough or power tower facilities in the PEIS study area and the water requirements for each.40 13 14 15
F.2.4.2.1 Wet-Cooling Systems. The most common cooling system employed in 16 thermoelectric power plants is known as the wet recirculating system, or the wet closed-loop 17 system. Although the wet closed-loop cooling system is not entirely closed, the majority of the 18 water in the system is retained and recirculated, allowing the system to withdraw substantially 19 less water than a once-through system. Spent steam leaving the STG is directed to a water-cooled 20 condenser where it is cooled before being recycled in the steam cycle. Heated cooling water 21 rejects the heat it absorbed from the condenser at a cooling tower where it is allowed to interact 22 with a counterflow or crossflow of ambient air. Two variants of the closed-loop cooling tower 23 are in use: the mechanical draft tower, where fans direct a flow of ambient air against cooling 24 water cascading over a series of plates, and the natural draft cooling tower, where the flow of 25 ambient air is produced not by fans but by simple convection that causes the air to rise up a 26 tower counter to cascading cooling water. Some portion of the water evaporates into the 27 atmosphere, taking heat energy away from, and thus cooling, the remaining water in the cooling 28 loop. Some smaller fraction of water is also lost through drift, where droplets of water are 29 actually entrained in the counterflow of air and exhausted to the atmosphere. Both cooling tower 30 designs have essentially the same water demands. Although specific cooling system designs, 31 operating conditions, and circumstantial factors (including climatic conditions) all can affect the 32 overall efficiency of a wet-cooling system, it can be reliably anticipated that between 10 and 33 15 gal (0.038 and 0.057 m3) of water will be lost per minute to evaporation and drift for every 34
39 Recent amendments to Sections 316(a) and (b) of the federal Clean Water Act and National Pollutant Discharge
Elimination System (NPDES) regulations make it highly unlikely that once-through cooling systems will be used in any new utility-scale power-generating facility.
40 While the steam cycles and cooling system options are the same for parabolic trough and power tower facilities, power tower facilities can operate at substantially higher temperatures than parabolic trough facilities. Substantially more heat can be recovered than would be necessary to produce saturated steam. This excess heat can be used to support the TES system, or it can be used to produce supercritical or even ultra supercritical steam. At this time, no power tower facilities have been built or proposed that would use supercritical or ultra supercritical steam, so the impacts of these technologies on cooling system design and operation are not discussed further.
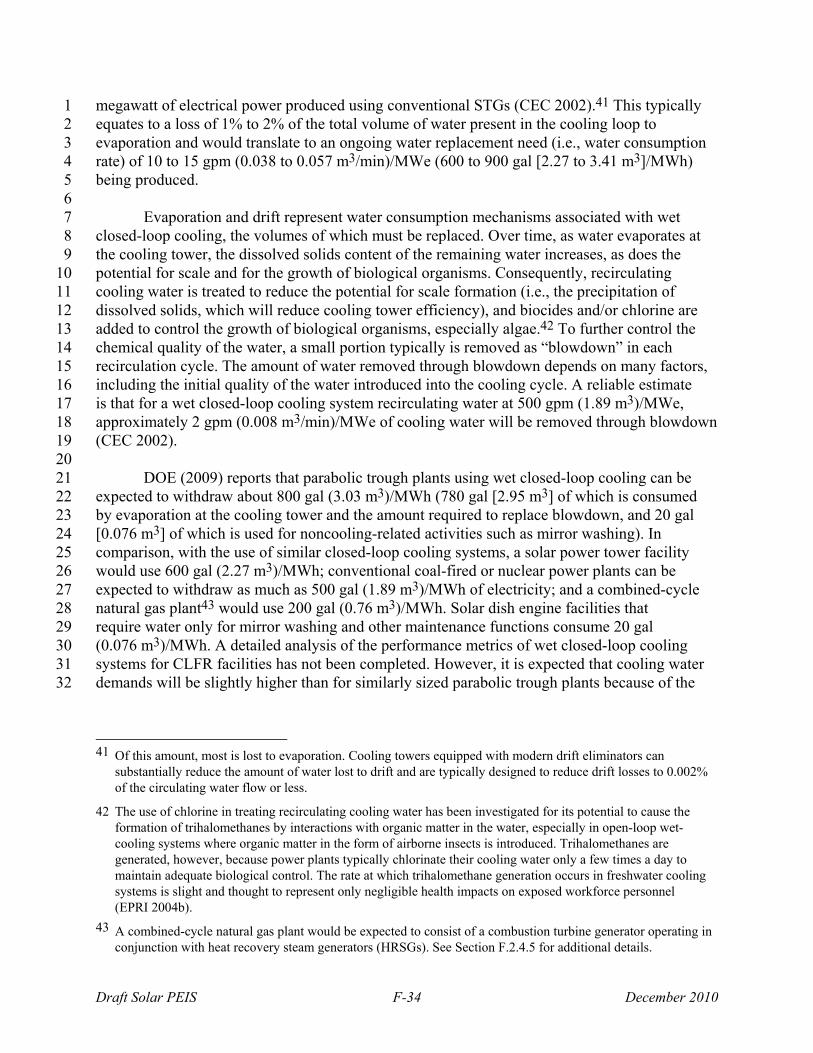
Draft Solar PEIS F-34 December 2010
megawatt of electrical power produced using conventional STGs (CEC 2002).41 This typically 1 equates to a loss of 1% to 2% of the total volume of water present in the cooling loop to 2 evaporation and would translate to an ongoing water replacement need (i.e., water consumption 3 rate) of 10 to 15 gpm (0.038 to 0.057 m3/min)/MWe (600 to 900 gal [2.27 to 3.41 m3]/MWh) 4 being produced. 5 6
Evaporation and drift represent water consumption mechanisms associated with wet 7 closed-loop cooling, the volumes of which must be replaced. Over time, as water evaporates at 8 the cooling tower, the dissolved solids content of the remaining water increases, as does the 9 potential for scale and for the growth of biological organisms. Consequently, recirculating 10 cooling water is treated to reduce the potential for scale formation (i.e., the precipitation of 11 dissolved solids, which will reduce cooling tower efficiency), and biocides and/or chlorine are 12 added to control the growth of biological organisms, especially algae.42 To further control the 13 chemical quality of the water, a small portion typically is removed as “blowdown” in each 14 recirculation cycle. The amount of water removed through blowdown depends on many factors, 15 including the initial quality of the water introduced into the cooling cycle. A reliable estimate 16 is that for a wet closed-loop cooling system recirculating water at 500 gpm (1.89 m3)/MWe, 17 approximately 2 gpm (0.008 m3/min)/MWe of cooling water will be removed through blowdown 18 (CEC 2002). 19 20 DOE (2009) reports that parabolic trough plants using wet closed-loop cooling can be 21 expected to withdraw about 800 gal (3.03 m3)/MWh (780 gal [2.95 m3] of which is consumed 22 by evaporation at the cooling tower and the amount required to replace blowdown, and 20 gal 23 [0.076 m3] of which is used for noncooling-related activities such as mirror washing). In 24 comparison, with the use of similar closed-loop cooling systems, a solar power tower facility 25 would use 600 gal (2.27 m3)/MWh; conventional coal-fired or nuclear power plants can be 26 expected to withdraw as much as 500 gal (1.89 m3)/MWh of electricity; and a combined-cycle 27 natural gas plant43 would use 200 gal (0.76 m3)/MWh. Solar dish engine facilities that 28 require water only for mirror washing and other maintenance functions consume 20 gal 29 (0.076 m3)/MWh. A detailed analysis of the performance metrics of wet closed-loop cooling 30 systems for CLFR facilities has not been completed. However, it is expected that cooling water 31 demands will be slightly higher than for similarly sized parabolic trough plants because of the 32
41 Of this amount, most is lost to evaporation. Cooling towers equipped with modern drift eliminators can
substantially reduce the amount of water lost to drift and are typically designed to reduce drift losses to 0.002% of the circulating water flow or less.
42 The use of chlorine in treating recirculating cooling water has been investigated for its potential to cause the formation of trihalomethanes by interactions with organic matter in the water, especially in open-loop wet-cooling systems where organic matter in the form of airborne insects is introduced. Trihalomethanes are generated, however, because power plants typically chlorinate their cooling water only a few times a day to maintain adequate biological control. The rate at which trihalomethane generation occurs in freshwater cooling systems is slight and thought to represent only negligible health impacts on exposed workforce personnel (EPRI 2004b).
43 A combined-cycle natural gas plant would be expected to consist of a combustion turbine generator operating in conjunction with heat recovery steam generators (HRSGs). See Section F.2.4.5 for additional details.

Draft Solar PEIS F-35 December 2010
CLFR’s expected lower operating temperatures and lower thermal efficiencies (i.e., greater 1 amounts of heat rejected per MWe produced).44 2 3 4
F.2.4.2.2 Dry-Cooling Systems. Dry-cooling (or air cooling) systems can be either 5 direct or indirect in their design. Direct dry-cooling systems function by directing a flow of 6 ambient air across condenser tubes through which the spent steam from the STG is circulated. 7 Indirect dry-cooling systems introduce a closed cooling-water loop that accepts heat from the 8 spent steam in a closed condenser and then ultimately rejects that heat to the atmosphere in an 9 air-cooled condenser (i.e., radiator). With dry-cooling systems, overall water consumption is 10 reduced by as much as 90% over conventional wet-cooling systems because both evaporation 11 and drift at the wet closed-loop cooling tower are eliminated. However, plant-wide consumptive 12 uses of water are not completely eliminated with conversion to dry cooling of steam. Other 13 ongoing uses include replacing steam cycle blowdown, general plant maintenance activities 14 (including regular washing of solar collectors), and potable consumption. Collectively, however, 15 these other consumptive uses would be equal to no more than 10% to 15% of the consumptive 16 uses in wet-cooling systems and can be expected to average 80 gal (0.30 m3)/MWh of electricity 17 produced (depending on local conditions and cooling system design). EPRI (2004a) estimates 18 that a 350-MW coal-fired plant would realize a water savings of approximately 6,400 ac-ft/yr 19 (~2 billion gal/yr) (7.9 million m3/yr) in switching from wet closed-loop cooling to dry cooling. 20 Likewise, a 500-MW natural gas combined-cycle plant would realize savings of 2,800 ac-ft/yr 21 (~ 900 million gal/yr) (3.5 million m3/yr). 22 23 Although dry-cooling systems require considerably less water than do wet-cooling 24 systems, they have shortcomings. For example, capital costs are higher, as are auxiliary power 25 loads (parasitic power losses). Because dry-cooling system efficiencies increase with increasing 26 temperature differentials between the materials being cooled and the cooling agent, dry-cooling 27 systems operating in desert environments where the ambient air temperature is generally high 28 can be expected to have lower cooling efficiencies than wet-cooling systems operating at the 29 same locations.45 Such lower system efficiencies are expected to be most apparent on the 30 hottest days when electrical demand is highest and the plant can be expected to be operating 31 at capacity (DOE 2009). Such lower cooling system efficiencies ultimately translate to a net 32 power loss.46 (See Section F.2.4.2.4 for additional discussion on performance penalties from 33 dry-cooling systems.) 34 35 36
44 Although all the water consumption values cited in this paragraph are believed to be generally representative, it
is important to note that water consumption from wet open-loop cooling systems is location dependent, with the overall performance of the cooling system influenced by many factors, especially including, climatic conditions of average ambient air temperatures and relative humidities.
45 Wet-cooling system efficiencies are also dependent on the temperature differentials (between incoming cooling water and counterflowing ambient air), albeit to a much lesser degree.
46 This power reduction reflects not only the lower thermal efficiencies of the cooling system, but also the higher parasitic load of fans used in dry, air-cooled systems compared to fan loads of wet recirculating systems of equivalent capacity.
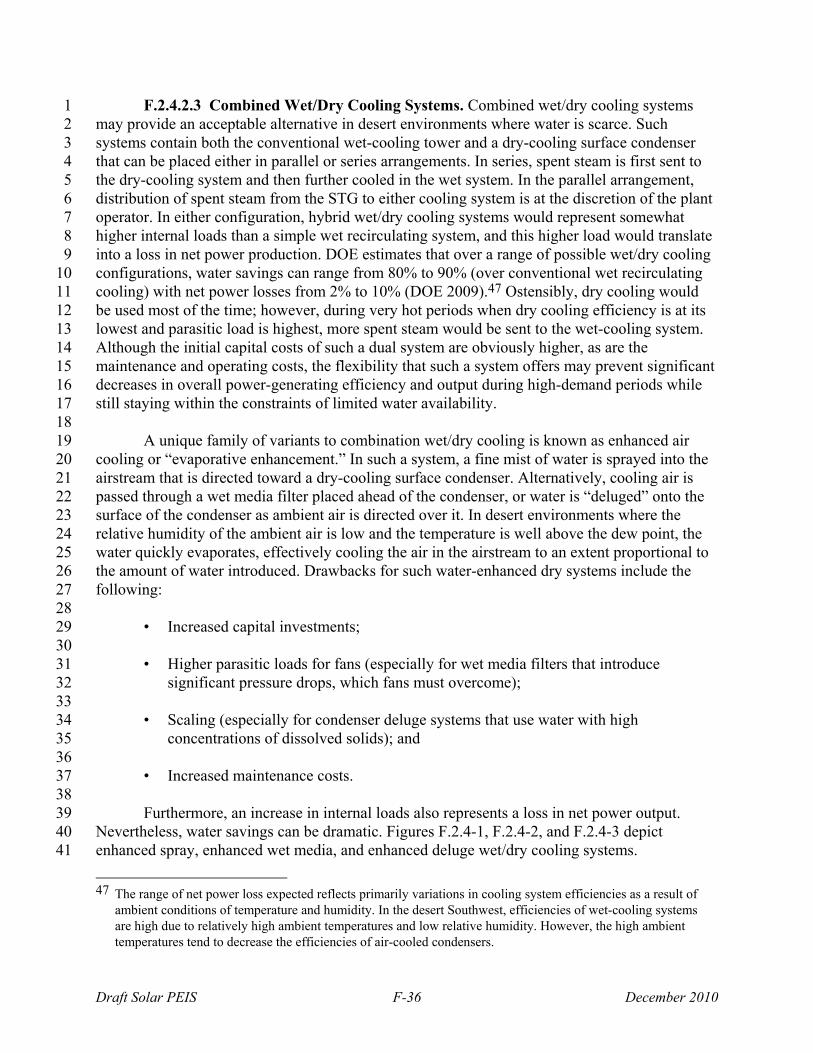
Draft Solar PEIS F-36 December 2010
F.2.4.2.3 Combined Wet/Dry Cooling Systems. Combined wet/dry cooling systems 1 may provide an acceptable alternative in desert environments where water is scarce. Such 2 systems contain both the conventional wet-cooling tower and a dry-cooling surface condenser 3 that can be placed either in parallel or series arrangements. In series, spent steam is first sent to 4 the dry-cooling system and then further cooled in the wet system. In the parallel arrangement, 5 distribution of spent steam from the STG to either cooling system is at the discretion of the plant 6 operator. In either configuration, hybrid wet/dry cooling systems would represent somewhat 7 higher internal loads than a simple wet recirculating system, and this higher load would translate 8 into a loss in net power production. DOE estimates that over a range of possible wet/dry cooling 9 configurations, water savings can range from 80% to 90% (over conventional wet recirculating 10 cooling) with net power losses from 2% to 10% (DOE 2009).47 Ostensibly, dry cooling would 11 be used most of the time; however, during very hot periods when dry cooling efficiency is at its 12 lowest and parasitic load is highest, more spent steam would be sent to the wet-cooling system. 13 Although the initial capital costs of such a dual system are obviously higher, as are the 14 maintenance and operating costs, the flexibility that such a system offers may prevent significant 15 decreases in overall power-generating efficiency and output during high-demand periods while 16 still staying within the constraints of limited water availability. 17 18 A unique family of variants to combination wet/dry cooling is known as enhanced air 19 cooling or “evaporative enhancement.” In such a system, a fine mist of water is sprayed into the 20 airstream that is directed toward a dry-cooling surface condenser. Alternatively, cooling air is 21 passed through a wet media filter placed ahead of the condenser, or water is “deluged” onto the 22 surface of the condenser as ambient air is directed over it. In desert environments where the 23 relative humidity of the ambient air is low and the temperature is well above the dew point, the 24 water quickly evaporates, effectively cooling the air in the airstream to an extent proportional to 25 the amount of water introduced. Drawbacks for such water-enhanced dry systems include the 26 following: 27 28
• Increased capital investments; 29 30
• Higher parasitic loads for fans (especially for wet media filters that introduce 31 significant pressure drops, which fans must overcome); 32 33
• Scaling (especially for condenser deluge systems that use water with high 34 concentrations of dissolved solids); and 35 36
• Increased maintenance costs. 37 38 Furthermore, an increase in internal loads also represents a loss in net power output. 39 Nevertheless, water savings can be dramatic. Figures F.2.4-1, F.2.4-2, and F.2.4-3 depict 40 enhanced spray, enhanced wet media, and enhanced deluge wet/dry cooling systems. 41
47 The range of net power loss expected reflects primarily variations in cooling system efficiencies as a result of
ambient conditions of temperature and humidity. In the desert Southwest, efficiencies of wet-cooling systems are high due to relatively high ambient temperatures and low relative humidity. However, the high ambient temperatures tend to decrease the efficiencies of air-cooled condensers.
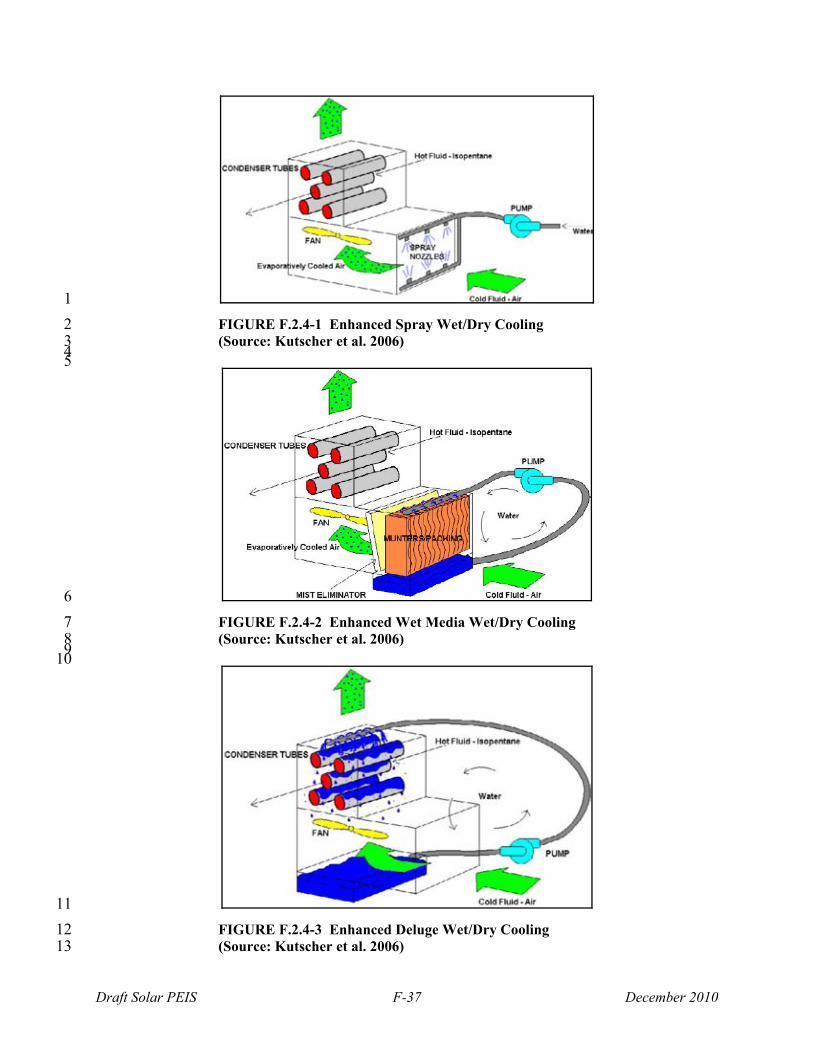
Draft Solar PEIS F-37 December 2010
1
FIGURE F.2.4-1 Enhanced Spray Wet/Dry Cooling 2 (Source: Kutscher et al. 2006) 3
4 5
6
FIGURE F.2.4-2 Enhanced Wet Media Wet/Dry Cooling 7 (Source: Kutscher et al. 2006) 8
9 10
11
FIGURE F.2.4-3 Enhanced Deluge Wet/Dry Cooling 12 (Source: Kutscher et al. 2006) 13
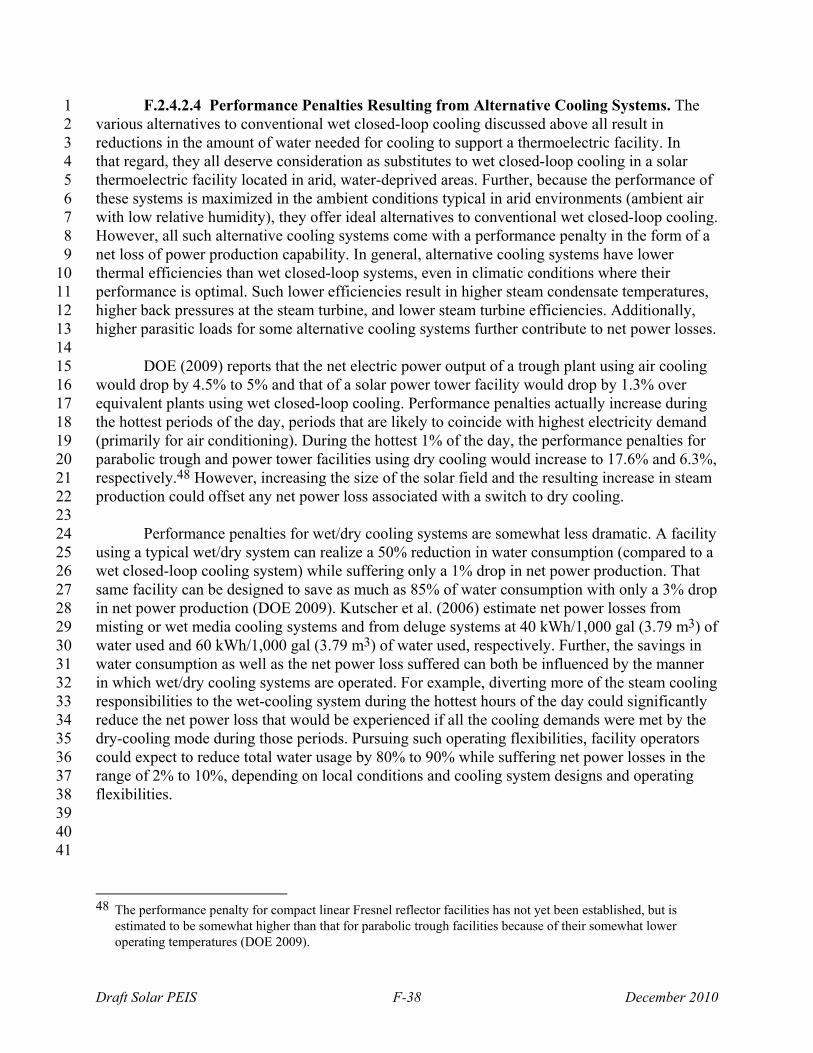
Draft Solar PEIS F-38 December 2010
F.2.4.2.4 Performance Penalties Resulting from Alternative Cooling Systems. The 1 various alternatives to conventional wet closed-loop cooling discussed above all result in 2 reductions in the amount of water needed for cooling to support a thermoelectric facility. In 3 that regard, they all deserve consideration as substitutes to wet closed-loop cooling in a solar 4 thermoelectric facility located in arid, water-deprived areas. Further, because the performance of 5 these systems is maximized in the ambient conditions typical in arid environments (ambient air 6 with low relative humidity), they offer ideal alternatives to conventional wet closed-loop cooling. 7 However, all such alternative cooling systems come with a performance penalty in the form of a 8 net loss of power production capability. In general, alternative cooling systems have lower 9 thermal efficiencies than wet closed-loop systems, even in climatic conditions where their 10 performance is optimal. Such lower efficiencies result in higher steam condensate temperatures, 11 higher back pressures at the steam turbine, and lower steam turbine efficiencies. Additionally, 12 higher parasitic loads for some alternative cooling systems further contribute to net power losses. 13 14 DOE (2009) reports that the net electric power output of a trough plant using air cooling 15 would drop by 4.5% to 5% and that of a solar power tower facility would drop by 1.3% over 16 equivalent plants using wet closed-loop cooling. Performance penalties actually increase during 17 the hottest periods of the day, periods that are likely to coincide with highest electricity demand 18 (primarily for air conditioning). During the hottest 1% of the day, the performance penalties for 19 parabolic trough and power tower facilities using dry cooling would increase to 17.6% and 6.3%, 20 respectively.48 However, increasing the size of the solar field and the resulting increase in steam 21 production could offset any net power loss associated with a switch to dry cooling. 22 23 Performance penalties for wet/dry cooling systems are somewhat less dramatic. A facility 24 using a typical wet/dry system can realize a 50% reduction in water consumption (compared to a 25 wet closed-loop cooling system) while suffering only a 1% drop in net power production. That 26 same facility can be designed to save as much as 85% of water consumption with only a 3% drop 27 in net power production (DOE 2009). Kutscher et al. (2006) estimate net power losses from 28 misting or wet media cooling systems and from deluge systems at 40 kWh/1,000 gal (3.79 m3) of 29 water used and 60 kWh/1,000 gal (3.79 m3) of water used, respectively. Further, the savings in 30 water consumption as well as the net power loss suffered can both be influenced by the manner 31 in which wet/dry cooling systems are operated. For example, diverting more of the steam cooling 32 responsibilities to the wet-cooling system during the hottest hours of the day could significantly 33 reduce the net power loss that would be experienced if all the cooling demands were met by the 34 dry-cooling mode during those periods. Pursuing such operating flexibilities, facility operators 35 could expect to reduce total water usage by 80% to 90% while suffering net power losses in the 36 range of 2% to 10%, depending on local conditions and cooling system designs and operating 37 flexibilities. 38 39 40
41
48 The performance penalty for compact linear Fresnel reflector facilities has not yet been established, but is
estimated to be somewhat higher than that for parabolic trough facilities because of their somewhat lower operating temperatures (DOE 2009).
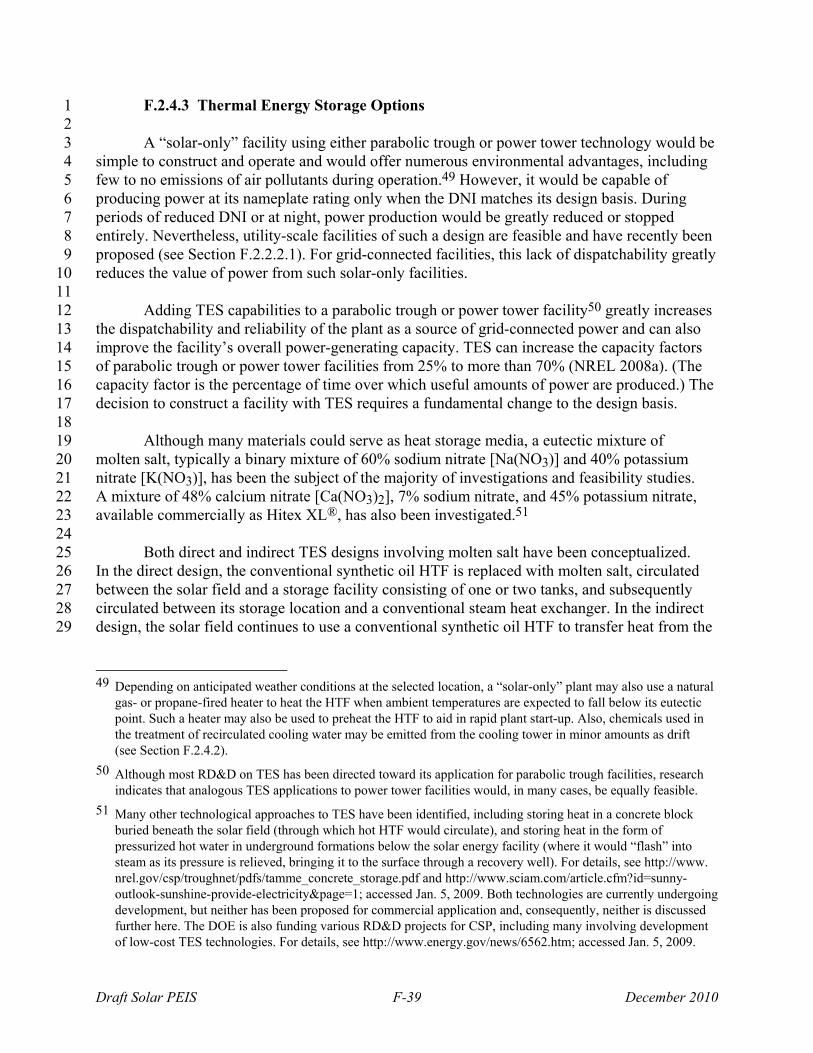
Draft Solar PEIS F-39 December 2010
F.2.4.3 Thermal Energy Storage Options 1 2 A “solar-only” facility using either parabolic trough or power tower technology would be 3 simple to construct and operate and would offer numerous environmental advantages, including 4 few to no emissions of air pollutants during operation.49 However, it would be capable of 5 producing power at its nameplate rating only when the DNI matches its design basis. During 6 periods of reduced DNI or at night, power production would be greatly reduced or stopped 7 entirely. Nevertheless, utility-scale facilities of such a design are feasible and have recently been 8 proposed (see Section F.2.2.2.1). For grid-connected facilities, this lack of dispatchability greatly 9 reduces the value of power from such solar-only facilities. 10 11 Adding TES capabilities to a parabolic trough or power tower facility50 greatly increases 12 the dispatchability and reliability of the plant as a source of grid-connected power and can also 13 improve the facility’s overall power-generating capacity. TES can increase the capacity factors 14 of parabolic trough or power tower facilities from 25% to more than 70% (NREL 2008a). (The 15 capacity factor is the percentage of time over which useful amounts of power are produced.) The 16 decision to construct a facility with TES requires a fundamental change to the design basis. 17 18 Although many materials could serve as heat storage media, a eutectic mixture of 19 molten salt, typically a binary mixture of 60% sodium nitrate [Na(NO3)] and 40% potassium 20 nitrate [K(NO3)], has been the subject of the majority of investigations and feasibility studies. 21 A mixture of 48% calcium nitrate [Ca(NO3)2], 7% sodium nitrate, and 45% potassium nitrate, 22 available commercially as Hitex XL®, has also been investigated.51 23 24 Both direct and indirect TES designs involving molten salt have been conceptualized. 25 In the direct design, the conventional synthetic oil HTF is replaced with molten salt, circulated 26 between the solar field and a storage facility consisting of one or two tanks, and subsequently 27 circulated between its storage location and a conventional steam heat exchanger. In the indirect 28 design, the solar field continues to use a conventional synthetic oil HTF to transfer heat from the 29
49 Depending on anticipated weather conditions at the selected location, a “solar-only” plant may also use a natural
gas- or propane-fired heater to heat the HTF when ambient temperatures are expected to fall below its eutectic point. Such a heater may also be used to preheat the HTF to aid in rapid plant start-up. Also, chemicals used in the treatment of recirculated cooling water may be emitted from the cooling tower in minor amounts as drift (see Section F.2.4.2).
50 Although most RD&D on TES has been directed toward its application for parabolic trough facilities, research indicates that analogous TES applications to power tower facilities would, in many cases, be equally feasible.
51 Many other technological approaches to TES have been identified, including storing heat in a concrete block buried beneath the solar field (through which hot HTF would circulate), and storing heat in the form of pressurized hot water in underground formations below the solar energy facility (where it would “flash” into steam as its pressure is relieved, bringing it to the surface through a recovery well). For details, see http://www. nrel.gov/csp/troughnet/pdfs/tamme_concrete_storage.pdf and http://www.sciam.com/article.cfm?id=sunny-outlook-sunshine-provide-electricity&page=1; accessed Jan. 5, 2009. Both technologies are currently undergoing development, but neither has been proposed for commercial application and, consequently, neither is discussed further here. The DOE is also funding various RD&D projects for CSP, including many involving development of low-cost TES technologies. For details, see http://www.energy.gov/news/6562.htm; accessed Jan. 5, 2009.
Draft Solar PEIS F-40 December 2010
solar field to molten salt in storage.52 During those periods when DNI is reduced or has stopped 1 entirely, the molten salt is used to produce steam that is directed to the STG for uninterrupted 2 power production. 3 4 The primary advantage provided by TES is the ability to produce power (in many cases, 5 at or near the facility’s nameplate rating) during periods of less-than-ideal insolation, including 6 during nighttime hours. Since many electricity load peaks occur in early morning or early 7 evening hours, adding this ability to a facility greatly enhances its value as a source of utility-8 scale power. A second equally important advantage can also be realized when molten salt 9 replaces conventional HTF: the facility can operate at a higher temperature range (842°–932°F 10 [450°–500°C]) than the typical operating temperature of a plant using synthetic oil HTF (740°F 11 [393°C]). This, in turn, allows the Rankine cycle STG to improve in efficiency from 37.6 to 12 40%, thus increasing the overall power-generating capacity of the facility with virtually no 13 change to the footprint of the solar field and minimal changes to the overall facility footprint. 14 15 Adding TES capability greatly affects the configuration and size of the solar field. 16 Without a TES element, a facility would be expected to have a solar field only large enough to 17 supply the amount of heat needed to produce steam and generate power (under anticipated peak 18 insolation and meteorological conditions) at the facility’s peak power rating.53 Such a facility is 19 said to have a solar multiple of 1.0 (see also Section F.2.2.3). Facilities with TES capability must 20 be able to generate more heat than would be required to meet nameplate ratings, with the extra 21 heat being that which is stored in the TES. Such facilities will invariably have larger solar fields 22 with solar multiples proportional to the amount of heat expected to be delivered to the TES, 23 generally a factor of how many hours the facility would be capable of delivering power at 24 nameplate rating without concurrent insolation. 25 26 Practical limitations exist as to the length of time heat can be stored in molten salt 27 systems. At the current stage of technology development, most feasibility studies identify 6-hour 28 storage (i.e., sufficient to provide full-load power for as long as 6 hours) as the practical upper 29 limit. The molten salt can be stored in one tank (also known as a thermocline) or in two tanks 30 (a hot tank and a cold tank). Each storage configuration is supported by its own unique 31 configuration for circulating the molten salt between its storage location and the STG and for 32 replacing the heat lost in steam generation with heat recovered from the solar field. 33 34 Figure F.2.4-5 (below, in Section F.2.4.4) provides an example schematic of a parabolic 35 trough–TES system. It has been estimated that a parabolic trough facility with 6 hours of molten 36 salt storage, operating at a nominal salt temperature of 842°F (450°C) and using a two-tank 37 storage configuration, can reduce the LCOE as much as 14.2% (and more than 20% when using 38 a thermocline storage configuration) compared to a state-of-the-art conventional parabolic trough 39
52 Although replacing the synthetic oil HTF with molten salt without also adding storage capacity for molten salt is
technically feasible, early studies concluded that using molten salt as an HTF without also including the ability for its use as a long-term TES medium was not economical (Kearney et al. 2004).
53 As a practical matter, solar fields in commercial utility-scale solar-only facilities can be expected to be somewhat larger than what would be required to meet nameplate power expectations, allowing some of the field to be isolated and shut down for maintenance and repair without compromising the facility’s power capacity.
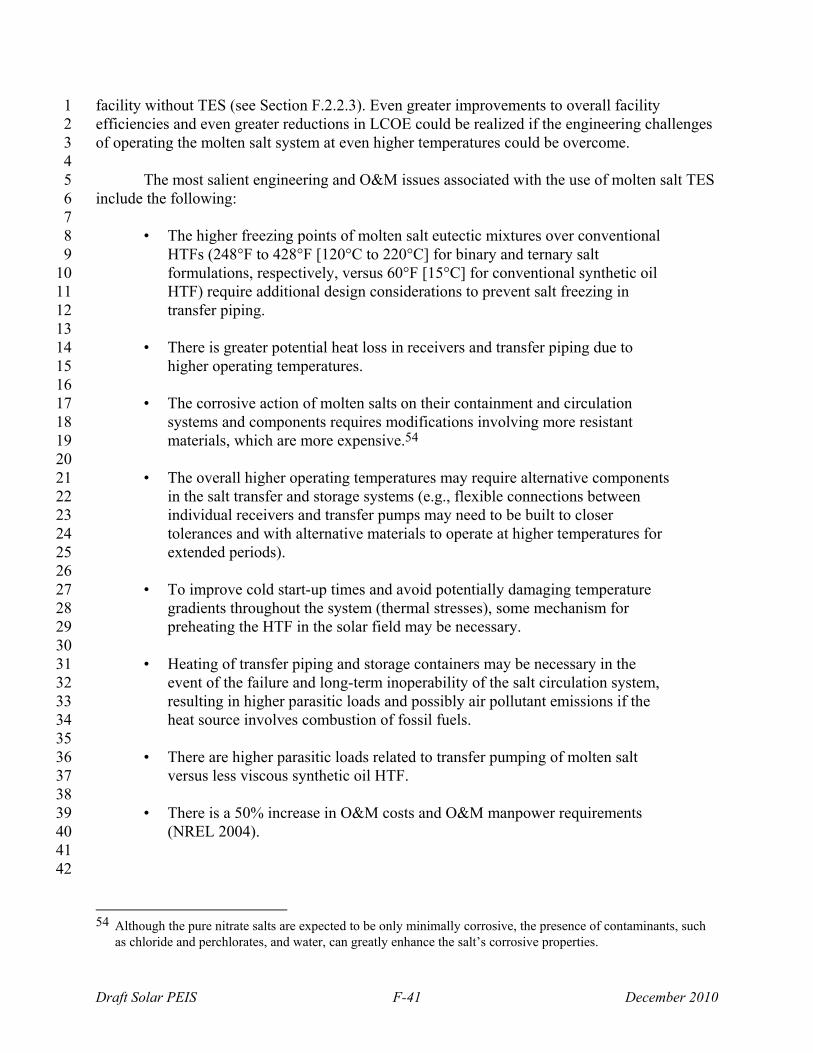
Draft Solar PEIS F-41 December 2010
facility without TES (see Section F.2.2.3). Even greater improvements to overall facility 1 efficiencies and even greater reductions in LCOE could be realized if the engineering challenges 2 of operating the molten salt system at even higher temperatures could be overcome. 3 4 The most salient engineering and O&M issues associated with the use of molten salt TES 5 include the following: 6 7
• The higher freezing points of molten salt eutectic mixtures over conventional 8 HTFs (248°F to 428°F [120°C to 220°C] for binary and ternary salt 9 formulations, respectively, versus 60°F [15°C] for conventional synthetic oil 10 HTF) require additional design considerations to prevent salt freezing in 11 transfer piping. 12
13 • There is greater potential heat loss in receivers and transfer piping due to 14
higher operating temperatures. 15 16
• The corrosive action of molten salts on their containment and circulation 17 systems and components requires modifications involving more resistant 18 materials, which are more expensive.54 19
20 • The overall higher operating temperatures may require alternative components 21
in the salt transfer and storage systems (e.g., flexible connections between 22 individual receivers and transfer pumps may need to be built to closer 23 tolerances and with alternative materials to operate at higher temperatures for 24 extended periods). 25
26 • To improve cold start-up times and avoid potentially damaging temperature 27
gradients throughout the system (thermal stresses), some mechanism for 28 preheating the HTF in the solar field may be necessary. 29
30 • Heating of transfer piping and storage containers may be necessary in the 31
event of the failure and long-term inoperability of the salt circulation system, 32 resulting in higher parasitic loads and possibly air pollutant emissions if the 33 heat source involves combustion of fossil fuels. 34
35 • There are higher parasitic loads related to transfer pumping of molten salt 36
versus less viscous synthetic oil HTF. 37 38
• There is a 50% increase in O&M costs and O&M manpower requirements 39 (NREL 2004). 40
41 42
54 Although the pure nitrate salts are expected to be only minimally corrosive, the presence of contaminants, such
as chloride and perchlorates, and water, can greatly enhance the salt’s corrosive properties.
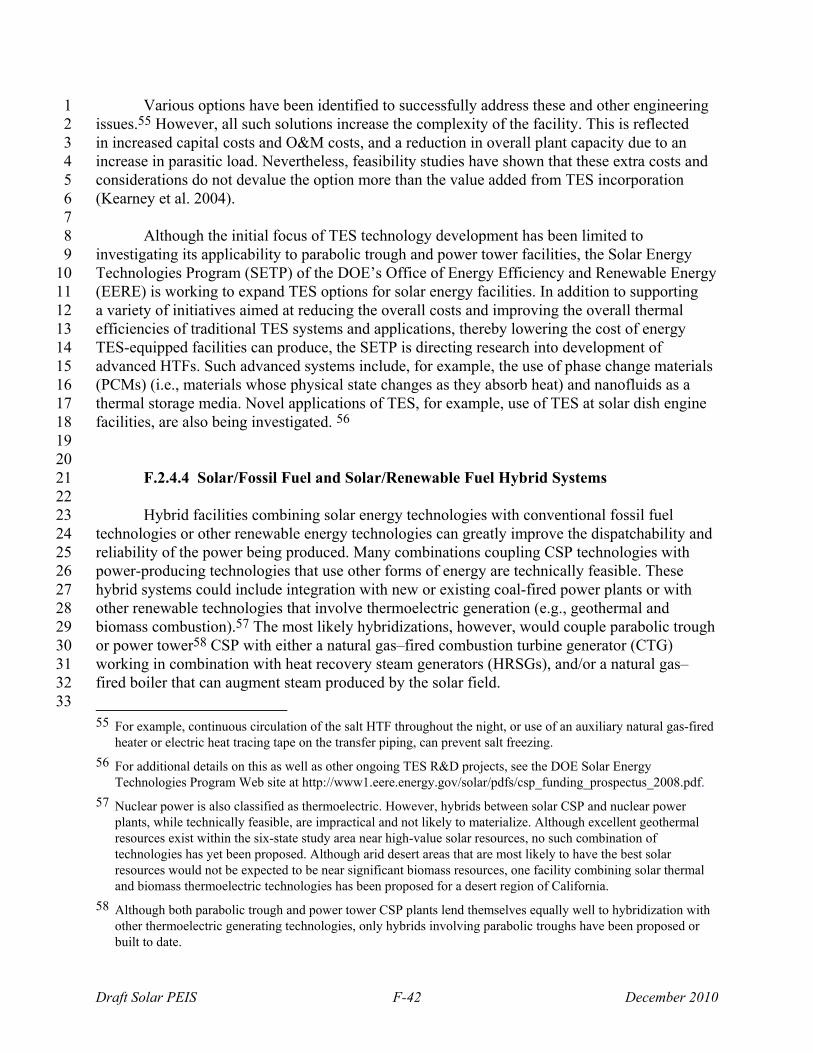
Draft Solar PEIS F-42 December 2010
Various options have been identified to successfully address these and other engineering 1 issues.55 However, all such solutions increase the complexity of the facility. This is reflected 2 in increased capital costs and O&M costs, and a reduction in overall plant capacity due to an 3 increase in parasitic load. Nevertheless, feasibility studies have shown that these extra costs and 4 considerations do not devalue the option more than the value added from TES incorporation 5 (Kearney et al. 2004). 6 7 Although the initial focus of TES technology development has been limited to 8 investigating its applicability to parabolic trough and power tower facilities, the Solar Energy 9 Technologies Program (SETP) of the DOE’s Office of Energy Efficiency and Renewable Energy 10 (EERE) is working to expand TES options for solar energy facilities. In addition to supporting 11 a variety of initiatives aimed at reducing the overall costs and improving the overall thermal 12 efficiencies of traditional TES systems and applications, thereby lowering the cost of energy 13 TES-equipped facilities can produce, the SETP is directing research into development of 14 advanced HTFs. Such advanced systems include, for example, the use of phase change materials 15 (PCMs) (i.e., materials whose physical state changes as they absorb heat) and nanofluids as a 16 thermal storage media. Novel applications of TES, for example, use of TES at solar dish engine 17 facilities, are also being investigated. 56 18 19 20
F.2.4.4 Solar/Fossil Fuel and Solar/Renewable Fuel Hybrid Systems 21 22
Hybrid facilities combining solar energy technologies with conventional fossil fuel 23 technologies or other renewable energy technologies can greatly improve the dispatchability and 24 reliability of the power being produced. Many combinations coupling CSP technologies with 25 power-producing technologies that use other forms of energy are technically feasible. These 26 hybrid systems could include integration with new or existing coal-fired power plants or with 27 other renewable technologies that involve thermoelectric generation (e.g., geothermal and 28 biomass combustion).57 The most likely hybridizations, however, would couple parabolic trough 29 or power tower58 CSP with either a natural gas–fired combustion turbine generator (CTG) 30 working in combination with heat recovery steam generators (HRSGs), and/or a natural gas–31 fired boiler that can augment steam produced by the solar field. 32
33 55 For example, continuous circulation of the salt HTF throughout the night, or use of an auxiliary natural gas-fired
heater or electric heat tracing tape on the transfer piping, can prevent salt freezing.
56 For additional details on this as well as other ongoing TES R&D projects, see the DOE Solar Energy Technologies Program Web site at http://www1.eere.energy.gov/solar/pdfs/csp_funding_prospectus_2008.pdf.
57 Nuclear power is also classified as thermoelectric. However, hybrids between solar CSP and nuclear power plants, while technically feasible, are impractical and not likely to materialize. Although excellent geothermal resources exist within the six-state study area near high-value solar resources, no such combination of technologies has yet been proposed. Although arid desert areas that are most likely to have the best solar resources would not be expected to be near significant biomass resources, one facility combining solar thermal and biomass thermoelectric technologies has been proposed for a desert region of California.
58 Although both parabolic trough and power tower CSP plants lend themselves equally well to hybridization with other thermoelectric generating technologies, only hybrids involving parabolic troughs have been proposed or built to date.

Draft Solar PEIS F-43 December 2010
Combustion turbines do not produce steam but instead drive a turbine with high-1 temperature, high-pressure gases generated through the combustion of fossil fuels, typically 2 natural gas. Consequently, their use does not increase steam condensate cooling water demand. 3 However, CTGs do use water to cool the inlet combustion air that has been compressed to high 4 pressure before being introduced into the combustion zone of the turbine.59 When the exhaust 5 gas leaving the turbine is exhausted directly to the atmosphere, the CTG, known as a simple- or 6 single-cycle CTG, operates at an efficiency of about 35% to 38%. Because the gases exhausted 7 from a CTG still possess a considerable amount of heat energy, CTGs are often used in 8 conjunction with HRSGs that can use latent heat in the exhausted gases to produce additional 9 steam. By comparison, Rankine cycle turbines can operate at overall efficiencies as high as 10 40%. Brayton cycle turbines equipped with HRSGs can reach efficiencies as high as 80%.60 11 Combined-cycle power plants involve the simultaneous but independent operation of both 12 Rankine cycle and Brayton cycle turbines (coupled, in most instances, with HRSGs).61 13 14 Conceptually, many combinations of steam-generating technologies can be combined 15 with parabolic trough or power tower technologies and CTGs to result in ISCC facilities.62 In 16 such configurations, the solar field would be capable of producing steam and/or providing some 17 heat energy to the bottoming cycle of the fossil fuel combined-cycle plant STGs. Figures F.2.4-4 18 and F.2.4-5 demonstrate two of the most likely hybridizations: a parabolic trough plant combined 19 with a natural gas-fired boiler, both feeding an STG, and an ISCC facility hybridizing a parabolic 20 trough solar plant with a natural gas-fired CTG and HRSG, respectively. 21 22 While solar dish engines can be operated in parallel with any thermoelectric generating 23 technology, the advantages of such combinations are minimal since very little of each technology 24 can utilize shared equipment. Such hybrids, therefore, would represent nothing more than 25 collocation of two fundamentally different technologies that actually create a complex facility 26 with respect to O&M because of their disparate natures. The dish engine itself does have a 27 hybridization option, however, in that it can be modified to run on conventional fuels, essentially 28
59 A CTG’s performance relies on mass flow of inlet air. High ambient temperatures, combined with additional
heating of inlet air due to compression, reduce the density (and thus mass flow) of turbine inlet air. Spraying water into the inlet air stream, which allows evaporative cooling to take place, restores the mass air flow and avoids loss of turbine performance. Cooling inlet air by introducing a fine spray of water is known as “fogging” and can represent the third-largest consumptive use of water in a combined-cycle power plant. Typically, as much as 125 to 160 gal (0.47 to 0.61 m3) of water is used for every megawatt-hour of power produced by the CTG, operating at design conditions (Maulbetsch and DiFilippo 2006).
60 The efficiencies being measured here are the conversion of heat energy to electricity.
61 Brayton cycle turbines working in conjunction with HRSGs are also combined-cycle plants. Combined-cycle plants can also function as cogeneration (Co-Gen) plants in which a fraction of the steam produced is used for industrial processes rather than power generation. Co-Gen plants are considered outside the scope of this PEIS.
62 A combined-cycle power plant is one that uses two or more different thermodynamic cycles to produce power. Most commonly, a conventional STG operating on the principles of a Rankine thermodynamic cycle is operated simultaneously with a CTG that operates in accordance with a Brayton thermodynamic cycle. Also, CTGs operating alone are sometimes referred to as simple cycle, but when working in conjunction with HRSGs that use the heat contained in the CTG’s exhaust to produce steam, the system is also sometimes referred to as a combined cycle.
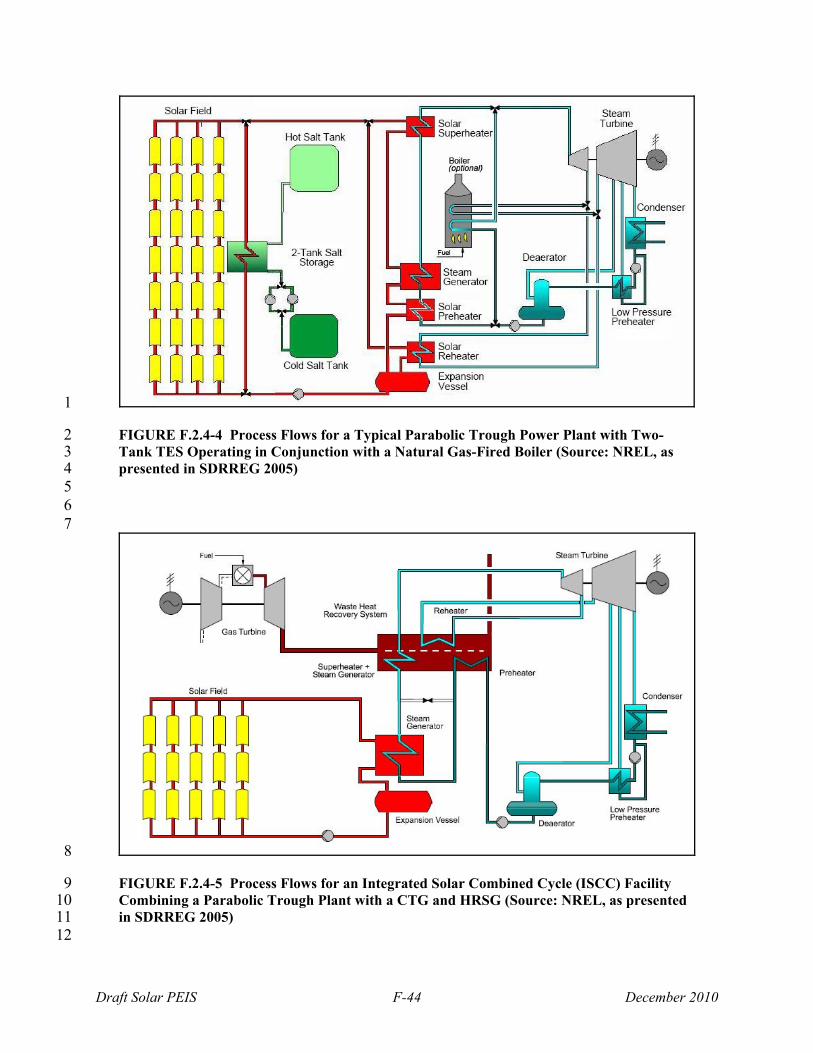
Draft Solar PEIS F-44 December 2010
1
FIGURE F.2.4-4 Process Flows for a Typical Parabolic Trough Power Plant with Two-2 Tank TES Operating in Conjunction with a Natural Gas-Fired Boiler (Source: NREL, as 3 presented in SDRREG 2005) 4
5 6 7
8
FIGURE F.2.4-5 Process Flows for an Integrated Solar Combined Cycle (ISCC) Facility 9 Combining a Parabolic Trough Plant with a CTG and HRSG (Source: NREL, as presented 10 in SDRREG 2005) 11
12
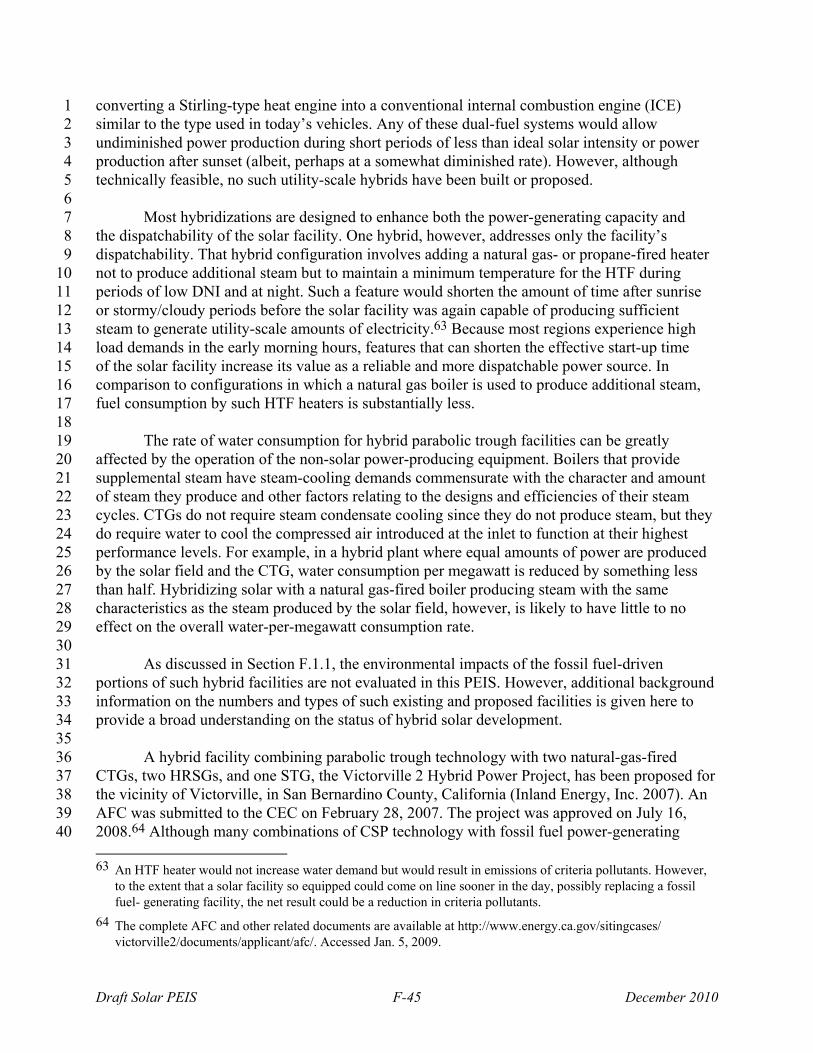
Draft Solar PEIS F-45 December 2010
converting a Stirling-type heat engine into a conventional internal combustion engine (ICE) 1 similar to the type used in today’s vehicles. Any of these dual-fuel systems would allow 2 undiminished power production during short periods of less than ideal solar intensity or power 3 production after sunset (albeit, perhaps at a somewhat diminished rate). However, although 4 technically feasible, no such utility-scale hybrids have been built or proposed. 5 6 Most hybridizations are designed to enhance both the power-generating capacity and 7 the dispatchability of the solar facility. One hybrid, however, addresses only the facility’s 8 dispatchability. That hybrid configuration involves adding a natural gas- or propane-fired heater 9 not to produce additional steam but to maintain a minimum temperature for the HTF during 10 periods of low DNI and at night. Such a feature would shorten the amount of time after sunrise 11 or stormy/cloudy periods before the solar facility was again capable of producing sufficient 12 steam to generate utility-scale amounts of electricity.63 Because most regions experience high 13 load demands in the early morning hours, features that can shorten the effective start-up time 14 of the solar facility increase its value as a reliable and more dispatchable power source. In 15 comparison to configurations in which a natural gas boiler is used to produce additional steam, 16 fuel consumption by such HTF heaters is substantially less. 17 18 The rate of water consumption for hybrid parabolic trough facilities can be greatly 19 affected by the operation of the non-solar power-producing equipment. Boilers that provide 20 supplemental steam have steam-cooling demands commensurate with the character and amount 21 of steam they produce and other factors relating to the designs and efficiencies of their steam 22 cycles. CTGs do not require steam condensate cooling since they do not produce steam, but they 23 do require water to cool the compressed air introduced at the inlet to function at their highest 24 performance levels. For example, in a hybrid plant where equal amounts of power are produced 25 by the solar field and the CTG, water consumption per megawatt is reduced by something less 26 than half. Hybridizing solar with a natural gas-fired boiler producing steam with the same 27 characteristics as the steam produced by the solar field, however, is likely to have little to no 28 effect on the overall water-per-megawatt consumption rate. 29 30 As discussed in Section F.1.1, the environmental impacts of the fossil fuel-driven 31 portions of such hybrid facilities are not evaluated in this PEIS. However, additional background 32 information on the numbers and types of such existing and proposed facilities is given here to 33 provide a broad understanding on the status of hybrid solar development. 34 35 A hybrid facility combining parabolic trough technology with two natural-gas-fired 36 CTGs, two HRSGs, and one STG, the Victorville 2 Hybrid Power Project, has been proposed for 37 the vicinity of Victorville, in San Bernardino County, California (Inland Energy, Inc. 2007). An 38 AFC was submitted to the CEC on February 28, 2007. The project was approved on July 16, 39 2008.64 Although many combinations of CSP technology with fossil fuel power-generating 40 63 An HTF heater would not increase water demand but would result in emissions of criteria pollutants. However,
to the extent that a solar facility so equipped could come on line sooner in the day, possibly replacing a fossil fuel- generating facility, the net result could be a reduction in criteria pollutants.
64 The complete AFC and other related documents are available at http://www.energy.ca.gov/sitingcases/ victorville2/documents/applicant/afc/. Accessed Jan. 5, 2009.
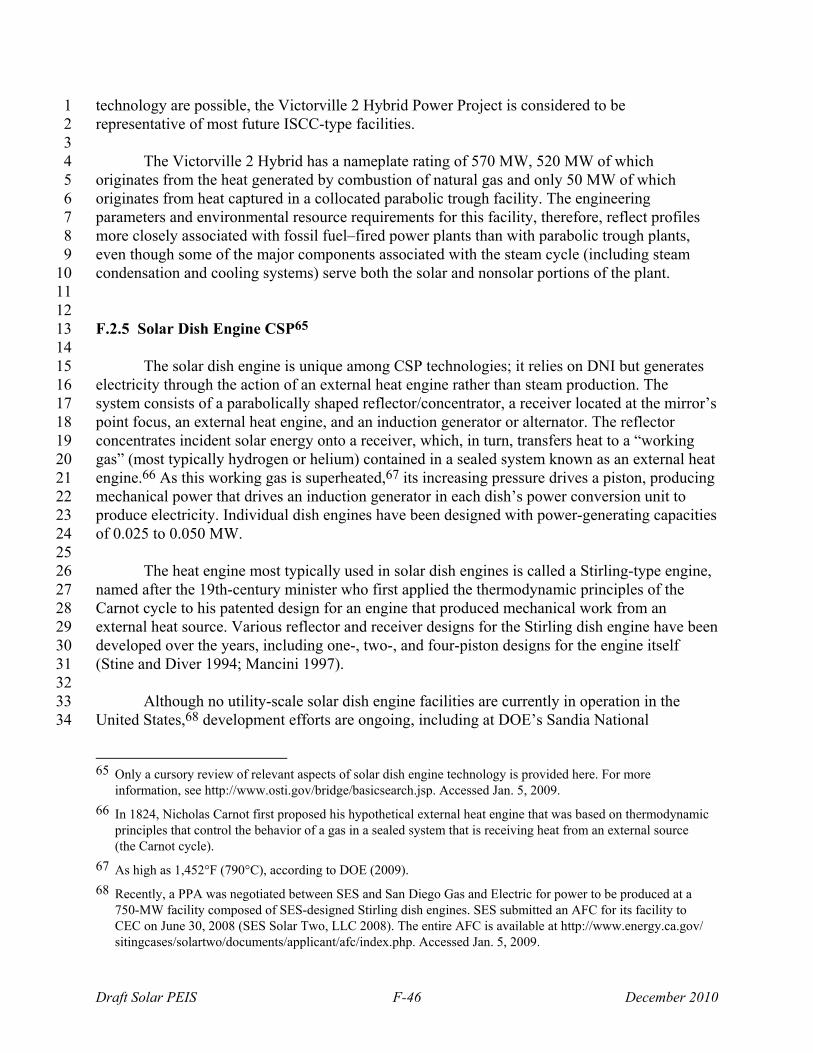
Draft Solar PEIS F-46 December 2010
technology are possible, the Victorville 2 Hybrid Power Project is considered to be 1 representative of most future ISCC-type facilities. 2 3 The Victorville 2 Hybrid has a nameplate rating of 570 MW, 520 MW of which 4 originates from the heat generated by combustion of natural gas and only 50 MW of which 5 originates from heat captured in a collocated parabolic trough facility. The engineering 6 parameters and environmental resource requirements for this facility, therefore, reflect profiles 7 more closely associated with fossil fuel–fired power plants than with parabolic trough plants, 8 even though some of the major components associated with the steam cycle (including steam 9 condensation and cooling systems) serve both the solar and nonsolar portions of the plant. 10 11 12 F.2.5 Solar Dish Engine CSP65 13 14 The solar dish engine is unique among CSP technologies; it relies on DNI but generates 15 electricity through the action of an external heat engine rather than steam production. The 16 system consists of a parabolically shaped reflector/concentrator, a receiver located at the mirror’s 17 point focus, an external heat engine, and an induction generator or alternator. The reflector 18 concentrates incident solar energy onto a receiver, which, in turn, transfers heat to a “working 19 gas” (most typically hydrogen or helium) contained in a sealed system known as an external heat 20 engine.66 As this working gas is superheated,67 its increasing pressure drives a piston, producing 21 mechanical power that drives an induction generator in each dish’s power conversion unit to 22 produce electricity. Individual dish engines have been designed with power-generating capacities 23 of 0.025 to 0.050 MW. 24 25 The heat engine most typically used in solar dish engines is called a Stirling-type engine, 26 named after the 19th-century minister who first applied the thermodynamic principles of the 27 Carnot cycle to his patented design for an engine that produced mechanical work from an 28 external heat source. Various reflector and receiver designs for the Stirling dish engine have been 29 developed over the years, including one-, two-, and four-piston designs for the engine itself 30 (Stine and Diver 1994; Mancini 1997). 31 32 Although no utility-scale solar dish engine facilities are currently in operation in the 33 United States,68 development efforts are ongoing, including at DOE’s Sandia National 34
65 Only a cursory review of relevant aspects of solar dish engine technology is provided here. For more
information, see http://www.osti.gov/bridge/basicsearch.jsp. Accessed Jan. 5, 2009.
66 In 1824, Nicholas Carnot first proposed his hypothetical external heat engine that was based on thermodynamic principles that control the behavior of a gas in a sealed system that is receiving heat from an external source (the Carnot cycle).
67 As high as 1,452°F (790°C), according to DOE (2009).
68 Recently, a PPA was negotiated between SES and San Diego Gas and Electric for power to be produced at a 750-MW facility composed of SES-designed Stirling dish engines. SES submitted an AFC for its facility to CEC on June 30, 2008 (SES Solar Two, LLC 2008). The entire AFC is available at http://www.energy.ca.gov/ sitingcases/solartwo/documents/applicant/afc/index.php. Accessed Jan. 5, 2009.

Draft Solar PEIS F-47 December 2010
Laboratories, in which a solar dish engine designed by Stirling Energy Systems (SES) 1 recently attained the highest overall sunlight to electricity conversion efficiency of 31.25%.69 2 Figure F.2.5-1 shows SES Stirling dish engines undergoing development and testing in 3 Albuquerque, New Mexico. Figure F.2.5-2 shows the major components of the SES dish 4 engine assembly. 5 6 7
F.2.5.1 Dish Engine Facility Components 8 9 10
F.2.5.1.1 Concentrators/Reflectors.70 Early versions of the reflector used in solar dish 11 engines were fabricated with conventional silver-backed glass mirrors. Now, reflectors are 12 typically constructed of glass or plastic onto which aluminum or silver has been applied to either 13 14 15
16
FIGURE F.2.5-1 Stirling Dish Engines at the Stirling Energy Systems Test Facility in 17 Albuquerque, New Mexico (Credit: Randy Montoya. Source: Sandia National Laboratory. 18 Available at http://www.sandia.gov/news/resources/releases/2008/solargrid.html. Accessed 19 April 16, 2008) 20
69 For information on research involving solar dish engine research, see http://www.nrel.gov/csp/troughnet/pdfs/
2007/liden_ses_dish_stirling.pdf. Accessed Jan. 5, 2009.
70 In this overview, the term “reflector” means a device that reflects (i.e., redirects) but does not concentrate incident sunlight. Conversely, a “concentrator” may comprise a number of reflecting devices that each, depending on orientation, reflect incident sunlight to a common point or line, thus causing a concentration or increase in solar insolation intensity at that point or along that line.
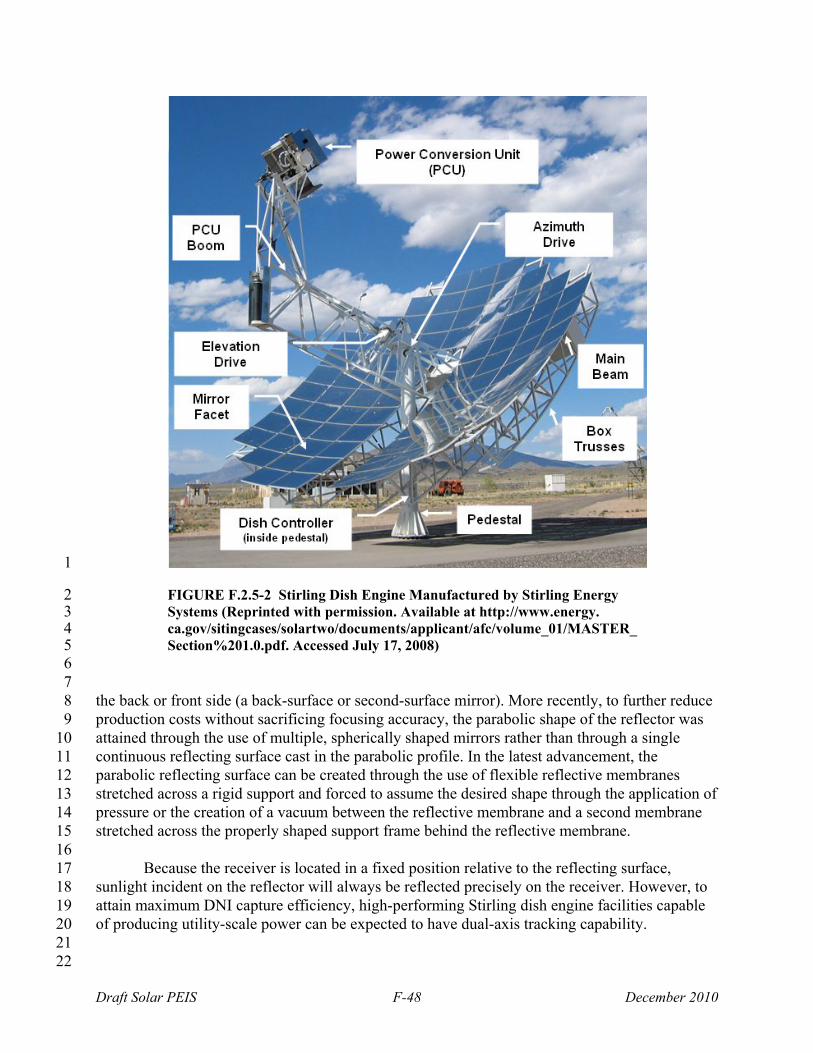
Draft Solar PEIS F-48 December 2010
1
FIGURE F.2.5-2 Stirling Dish Engine Manufactured by Stirling Energy 2 Systems (Reprinted with permission. Available at http://www.energy. 3 ca.gov/sitingcases/solartwo/documents/applicant/afc/volume_01/MASTER_ 4 Section%201.0.pdf. Accessed July 17, 2008) 5
6 7 the back or front side (a back-surface or second-surface mirror). More recently, to further reduce 8 production costs without sacrificing focusing accuracy, the parabolic shape of the reflector was 9 attained through the use of multiple, spherically shaped mirrors rather than through a single 10 continuous reflecting surface cast in the parabolic profile. In the latest advancement, the 11 parabolic reflecting surface can be created through the use of flexible reflective membranes 12 stretched across a rigid support and forced to assume the desired shape through the application of 13 pressure or the creation of a vacuum between the reflective membrane and a second membrane 14 stretched across the properly shaped support frame behind the reflective membrane. 15 16 Because the receiver is located in a fixed position relative to the reflecting surface, 17 sunlight incident on the reflector will always be reflected precisely on the receiver. However, to 18 attain maximum DNI capture efficiency, high-performing Stirling dish engine facilities capable 19 of producing utility-scale power can be expected to have dual-axis tracking capability. 20 21
22
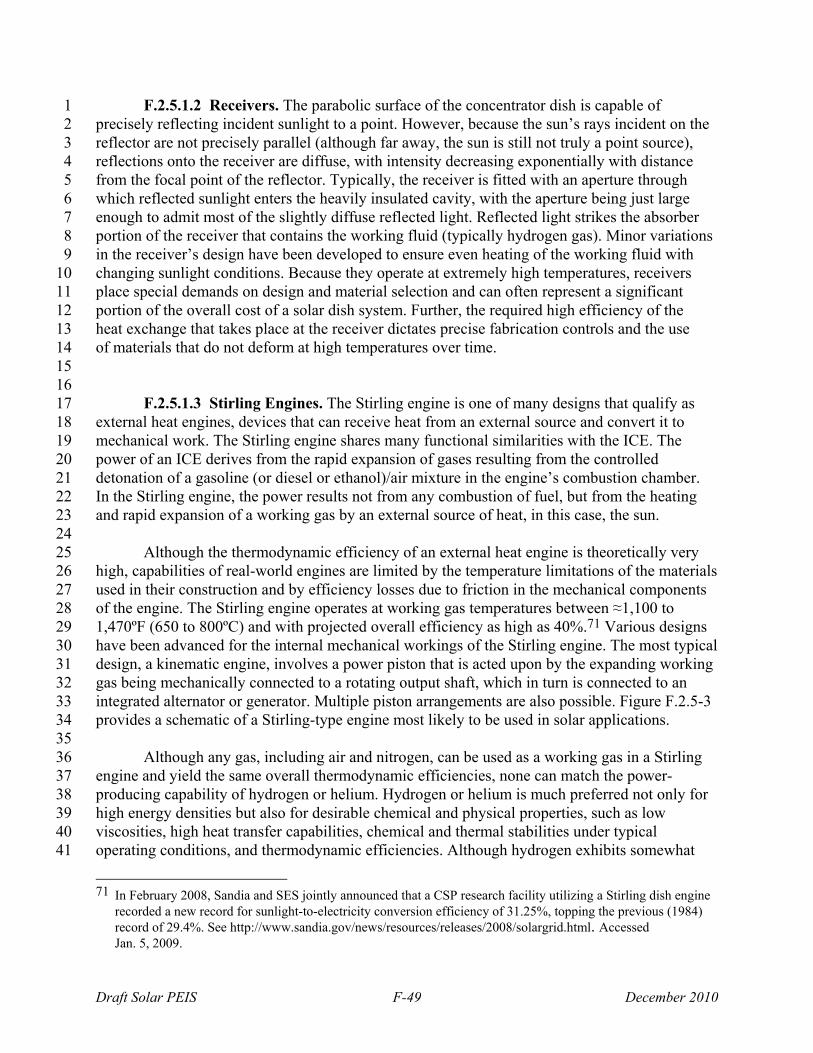
Draft Solar PEIS F-49 December 2010
F.2.5.1.2 Receivers. The parabolic surface of the concentrator dish is capable of 1 precisely reflecting incident sunlight to a point. However, because the sun’s rays incident on the 2 reflector are not precisely parallel (although far away, the sun is still not truly a point source), 3 reflections onto the receiver are diffuse, with intensity decreasing exponentially with distance 4 from the focal point of the reflector. Typically, the receiver is fitted with an aperture through 5 which reflected sunlight enters the heavily insulated cavity, with the aperture being just large 6 enough to admit most of the slightly diffuse reflected light. Reflected light strikes the absorber 7 portion of the receiver that contains the working fluid (typically hydrogen gas). Minor variations 8 in the receiver’s design have been developed to ensure even heating of the working fluid with 9 changing sunlight conditions. Because they operate at extremely high temperatures, receivers 10 place special demands on design and material selection and can often represent a significant 11 portion of the overall cost of a solar dish system. Further, the required high efficiency of the 12 heat exchange that takes place at the receiver dictates precise fabrication controls and the use 13 of materials that do not deform at high temperatures over time. 14 15 16 F.2.5.1.3 Stirling Engines. The Stirling engine is one of many designs that qualify as 17 external heat engines, devices that can receive heat from an external source and convert it to 18 mechanical work. The Stirling engine shares many functional similarities with the ICE. The 19 power of an ICE derives from the rapid expansion of gases resulting from the controlled 20 detonation of a gasoline (or diesel or ethanol)/air mixture in the engine’s combustion chamber. 21 In the Stirling engine, the power results not from any combustion of fuel, but from the heating 22 and rapid expansion of a working gas by an external source of heat, in this case, the sun. 23 24 Although the thermodynamic efficiency of an external heat engine is theoretically very 25 high, capabilities of real-world engines are limited by the temperature limitations of the materials 26 used in their construction and by efficiency losses due to friction in the mechanical components 27 of the engine. The Stirling engine operates at working gas temperatures between ≈1,100 to 28 1,470ºF (650 to 800ºC) and with projected overall efficiency as high as 40%.71 Various designs 29 have been advanced for the internal mechanical workings of the Stirling engine. The most typical 30 design, a kinematic engine, involves a power piston that is acted upon by the expanding working 31 gas being mechanically connected to a rotating output shaft, which in turn is connected to an 32 integrated alternator or generator. Multiple piston arrangements are also possible. Figure F.2.5-3 33 provides a schematic of a Stirling-type engine most likely to be used in solar applications. 34 35 Although any gas, including air and nitrogen, can be used as a working gas in a Stirling 36 engine and yield the same overall thermodynamic efficiencies, none can match the power-37 producing capability of hydrogen or helium. Hydrogen or helium is much preferred not only for 38 high energy densities but also for desirable chemical and physical properties, such as low 39 viscosities, high heat transfer capabilities, chemical and thermal stabilities under typical 40 operating conditions, and thermodynamic efficiencies. Although hydrogen exhibits somewhat 41
71 In February 2008, Sandia and SES jointly announced that a CSP research facility utilizing a Stirling dish engine
recorded a new record for sunlight-to-electricity conversion efficiency of 31.25%, topping the previous (1984) record of 29.4%. See http://www.sandia.gov/news/resources/releases/2008/solargrid.html. Accessed Jan. 5, 2009.
Draft Solar PEIS F-50 December 2010
1
FIGURE F.2.5-3 Schematic of a Stirling-Type External Heat Engine 2 (Courtesy of Stirling Energy Systems. Available at http://www.nrel. 3 gov/csp/troughnet/pdfs/2007/liden_ses_dish_stirling.pdf. Accessed 4 July 18, 2008) 5
6 7 better thermodynamic properties and results in overall better engine efficiencies, it creates more 8 material incompatibility issues than does helium and introduces an additional safety hazard 9 because of its flammable and explosive properties. More critical for hydrogen is its permeability 10 through common metallic components and gasket materials, especially at the relatively high 11 pressures (720 to 2,900 psi) (5 to 20 MPa) at which dish engines operate to maximize their 12 power outputs. Operating experience to date suggests that hydrogen is likely to leak from its 13 expansion chamber at a rate of less than 200 ft3/yr (5.7 m3/yr) (SES Solar Two, LLC 2008).72 14
72 However, the amount of hydrogen working gas in an individual dish engine is quite small, and the engine is not
considered to represent a significant fire or explosion hazard, nor would leakage of hydrogen from a Stirling engine constitute a significant fire or explosion hazard. In commercial applications, to ensure continuous operability, the engine would be supported externally by a compressed gas cylinder of hydrogen (most probably a 195-ft3 [5.5-m3] “k” cylinder) to replace any hydrogen that leaks from the receiver body.
Draft Solar PEIS F-51 December 2010
However, permeability problems in future versions of the Stirling engine can be overcome by 1 replacing components made of common steels with more expensive stainless steels, aluminum, 2 or ceramics. Over the long term, hydrogen exhibits additional incompatibilities with engine 3 components, causing metal embrittlement and ultimately component failure. 4 5 Although temperature extremes maximize the efficiency with which the working gas 6 can convert heat energy into mechanical work, uncontrolled heat on the moving parts of the 7 engine can result in premature wear, degradation of the lubricating oil, or wholesale failure. 8 Consequently, high-efficiency Stirling engines are often also equipped with cooling devices. 9 Typically, these consist of either a fan directing a flow of ambient air across critical engine 10 components or the use of a circulating glycol-based, closed-loop coolant/external radiator 11 system functionally identical to the cooling system used in an automobile. 12 13 Although waste engine heat must be managed, no Stirling dish engine hybrid designs 14 have been advanced that would couple these engines with conventional fossil fuel-driven 15 thermoelectric power-generating equipment. Likewise, no feasibility studies have explored 16 harvesting the rejected heat from a Stirling engine to support cogeneration of process steam or 17 as the first step in a coincident thermal storage system. 18 19 As with any mechanical device, Stirling engines are subject to wear and must receive 20 regular maintenance and occasional refurbishment. The typical design basis for Stirling engines 21 employed in solar dish systems includes a 20-year lifetime (40,000–60,000 hours of operation 22 for engines operating at latitudes and areas ideal for solar technologies) before major 23 refurbishment. Moving parts are subject to frictional wear similar to that which occurs in 24 conventional ICEs. Lubricating oils must be changed periodically, although at somewhat greater 25 intervals than oils in ICEs. Unless leakage occurs, the working gas is unchanged over time and 26 needs neither servicing nor replacement over the expected useful life of the engine. 27 28 Unlike other CSP plants that produce steam to support a centrally located STG, each 29 individual Stirling dish engine supports its own power conversion unit, which consists of an 30 induction generator. The induction generator is fundamentally different from the synchronous 31 generators typically found in STGs and CTGs. However, the induction generator is ideally suited 32 for Stirling dish engine application because, unlike synchronous generators, the induction 33 generator can produce power over a wide range of rotational speeds of its central shaft. 34 35 To date, no hybrid facilities have been proposed that would combine solar dish engines 36 with other types of power-generating technologies in an effort to improve the dispatchability of 37 the dish engine’s power. Combining the solar dish engine with any technology utilizing a steam 38 cycle would be impractical and offer very little advantage since the mechanisms by which such 39 steam-based technologies produce electricity have little in common with the solar dish engine’s 40 power-generating technology. DOE is funding preliminary studies to investigate the feasibility of 41 recovering heat from an operating Stirling-type dish engine for storage in a TES system by using 42 thermally stable phase-changing salts.73 As with all solar technologies, electrochemical energy 43 73 For additional details on this as well as other ongoing TES R&D projects, see the DOE Solar Energy
Technologies Program Web site at http://www1.eere.energy.gov/solar/pdfs/csp_funding_prospectus_2008.pdf.
Draft Solar PEIS F-52 December 2010
storage through the use of deep cycle batteries is technically available for dish engine facilities; 1 however, no practical applications of battery storage at dish engine facilities currently exist. 2 3 4
F.2.5.2 Utility-Scale Dish Engine Facilities 5 6 Various solar dish systems have been built around the world with a combination of heat 7 engine and concentrator designs from various manufacturers. As noted above, no utility-scale 8 solar dish engine facility is operational in the United States; however, there is a proposal to 9 build the Imperial Valley Solar Project (formerly named SES Solar Two), in Imperial County, 10 California, on both BLM-administered and privately owned land.74 An AFC was submitted to 11 the CEC on June 30, 2008 (SES Solar Two, LLC 2008). A supplement to the AFC was filed on 12 June 12, 2009 (SES Solar Two, LLC 2009) that addressed changes to the water and hydrogen 13 supply. The hydrogen supply for the project was changed from off-site reformation of natural gas 14 to on-site production from electrolysis, which would reduce environmental impacts of hydrogen 15 tank deliveries. In its application, the developer proposed to meet its water needs by using treated 16 water from a nearby raw water canal. An estimated 33 ac-ft/yr (40 million m3/yr) of water would 17 be needed for mirror washing and drinking water. In the first set of data requests, the CEC asked 18 for more information on the reliability of the proposed water supply and the source of backup 19 water. In response to the data request, the CEC was provided with a supplement, which changed 20 the primary water source to reclaimed water from a water treatment facility.75 21 22 23
F.2.5.3 Engineering Parameters and Resource Requirements for Dish Engine 24 Facilities 25
26 The engineering parameters and environmental resource requirements of the proposed 27 Imperial Valley facility include the following (Note: changes to project parameters that were 28 provided in the June 2009 supplement to the AFC are reflected in brackets and italics, e.g., 29 [300 MW]): 30 31
• Nominal capacity: 750 MWe developed in two phases (300 MW Phase 1 and 32 450 MW Phase 2) 33
34 • Total land area: 6,500 acres (26.3 km2) 35
36 • On-site roads (maintenance access, paved): 25.2 mi (42.6 km); 138 acres 37
(0.56 km2) 38 39
• On-site roads (perimeter roads, unpaved): 11.2 mi (18 km); 16.2 acres 40 (0.07 km2) 41
42
74 Project approved. Updated information will be included in the Final PEIS.
75 The complete AFC and documents related to CEC’s review are available at http://www.energy.ca.gov/ sitingcases/solartwo/documents/applicant/afc/index.php. Accessed Jan. 5, 2009.
Draft Solar PEIS F-53 December 2010
• Main industrial area: 14.4 acres (0.058 km2) 1 2
• Additional buildings: 14.4 acres (0.058 km2) 3 4 • Main electrical substation: 5.2 acres (0.02 km2) 5
6 • Construction 7
Laydown areas (2): 100 acres (0.4 km2) and 11 acres (0.045 km2) 8 Period (both phases): 40 months 9 Dish engine foundations: metal pipe, hydraulically driven into the ground 10
or set in concrete, depending on extant soil and subsurface conditions 11 Workforce: varies from 101 to a maximum of 731 individuals 12
13 • Solar concentrator dish and engine 14
25-kW capacity each 15 38 ft (11.6 m) high, 40 ft (12.2 m) wide 16 Sunlight-to-electricity conversion efficiency: 31.25% 17 12,000 solar dish engines in Phase 1 18 18,000 solar dish engines in Phase 2 19
20 • Employment (fully developed 750-MW facility): 164 full-time individuals 21
22 • Water 23
Source: nearby canal [reclaimed water from a wastewater treatment 24 facility] 25
Demands (mirror washing, miscellaneous industrial processes) [hydrogen 26 production]: 33 ac-ft/yr (40,706 m3/yr) 27
On-site storage (raw water for firefighting and industrial uses): 28 175,000 gal (662 m3) 29
30 • Dielectric oil (transformers, switches, other electrical equipment): 50,000 gal 31
(189 m3) 32 33
• Lubricating oil (present in each Stirling engine, site-wide total): 108,333 gal 34 (410 m3) 35
36 • Hydrogen (present in each Stirling engine, site-wide total): 50,000 ft3 37
(1,416 m3) (On-site hydrogen generation system (by electrolysis) with 38 distribution to each Stirling Engine [1,065 cf/h]) 39
40 • Ethylene glycol coolant (present in each Stirling engine, site-wide total): 41
110,000 gal (416 m3) 42 43
• Gasoline (storage tank for refueling on-site maintenance vehicles): 5,000 gal 44 (19 m3) 45
46 • Diesel fuel (storage tank for emergency generator): 5,000 gal (19 m3) 47
48
Draft Solar PEIS F-54 December 2010
F.3 PHOTOVOLTAIC (PV) TECHNOLOGIES 1 2 3 F.3.1 Overview of PV Technologies 4 5 6
F.3.1.1 PV Effect, Semiconductors, and the Solar Cell 7 8 PV technologies are fundamentally different from other technologies currently being used 9 to produce electricity. The heart of PV technology is the solar cell that is capable of generating 10 electricity by a physical process known as the photovoltaic effect. French physicist Edmund 11 Becquerel discovered the photovoltaic effect in 1839 when, during experiments with electrolytic 12 cells, he noticed that certain materials were capable of generating small amounts of electric 13 current when exposed to sunlight. Materials exhibiting these unique properties are known as 14 semiconductors. An overview of how semiconductors work is provided below to aid in 15 understanding the function of solar cells and the overall design and power-generating capacity 16 of PV systems. 17 18 Metals like copper and iron share a unique physical property: in their solid form, the 19 bonding electrons (electrons in each atom’s outermost shells) that hold the atoms together are 20 relatively free to move about in the metallic crystalline lattice and are easily displaced by other 21 electrons introduced into the lattice. Because electricity is the flow of electrons, this property 22 allows metals to act as excellent conductors of electrical current. Atoms such as carbon, silicon, 23 and germanium in their pure crystalline forms hold all their bonding electrons tightly in covalent 24 bonds and resist or impede the flow of electrical current, acting instead as insulators. However, 25 introducing minute amounts of impurities (called dopants) can result in dramatic changes in 26 behavior. Silicon, the earth’s second most abundant material (after oxygen), was one of the first 27 materials used to manufacture semiconductors and still predominates as one of the major 28 constituents of semiconductors produced today. 29 30 Two types of dopants can be introduced to create semiconductors: negative-type (N-type) 31 and positive-type (P-type). Atoms such as phosphorus or arsenic have five electrons in their 32 outmost shell. Crystallizing a mixture of silicon with a few atoms of phosphorus or arsenic 33 results in a crystal lattice in which one bonding electron of each phosphorus or arsenic atom 34 has nothing to bond with and is thus relatively free to be displaced. Because electrons have a 35 negative charge, the material is known as an N-type semiconductor. Unlike pure silicon, this 36 material conducts electricity, although not as efficiently as would a pure metal; thus it is referred 37 to as a “semiconductor.” Doping silicon with atoms having only three electrons in their 38 outermost shell (e.g., boron or gallium) results in “holes” in the crystalline lattice (i.e., spaces 39 that are deficient in electrons). Resulting materials are also capable of acting as semiconductors, 40 not by being a source of electrons, but by accepting electrons introduced from outside the 41 crystalline lattice. Such materials are identified as P-type semiconductors. 42 43 By themselves, neither N-type nor P-type semiconductors are very remarkable or have 44 much practical application. However, in combination, they can produce electric current. The 45 simplest configuration of a solar cell combines an N-type semiconductor with a P-type 46
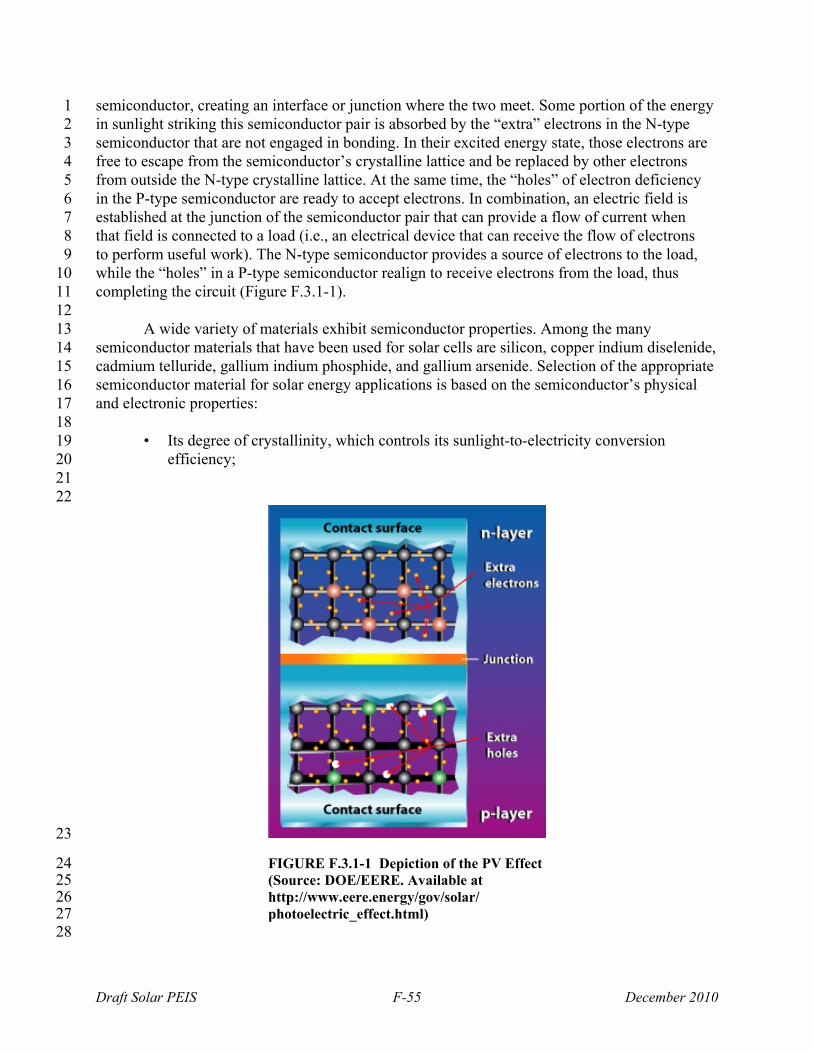
Draft Solar PEIS F-55 December 2010
semiconductor, creating an interface or junction where the two meet. Some portion of the energy 1 in sunlight striking this semiconductor pair is absorbed by the “extra” electrons in the N-type 2 semiconductor that are not engaged in bonding. In their excited energy state, those electrons are 3 free to escape from the semiconductor’s crystalline lattice and be replaced by other electrons 4 from outside the N-type crystalline lattice. At the same time, the “holes” of electron deficiency 5 in the P-type semiconductor are ready to accept electrons. In combination, an electric field is 6 established at the junction of the semiconductor pair that can provide a flow of current when 7 that field is connected to a load (i.e., an electrical device that can receive the flow of electrons 8 to perform useful work). The N-type semiconductor provides a source of electrons to the load, 9 while the “holes” in a P-type semiconductor realign to receive electrons from the load, thus 10 completing the circuit (Figure F.3.1-1). 11 12 A wide variety of materials exhibit semiconductor properties. Among the many 13 semiconductor materials that have been used for solar cells are silicon, copper indium diselenide, 14 cadmium telluride, gallium indium phosphide, and gallium arsenide. Selection of the appropriate 15 semiconductor material for solar energy applications is based on the semiconductor’s physical 16 and electronic properties: 17 18
• Its degree of crystallinity, which controls its sunlight-to-electricity conversion 19 efficiency; 20
21 22
23
FIGURE F.3.1-1 Depiction of the PV Effect 24 (Source: DOE/EERE. Available at 25 http://www.eere.energy/gov/solar/ 26 photoelectric_effect.html) 27
28
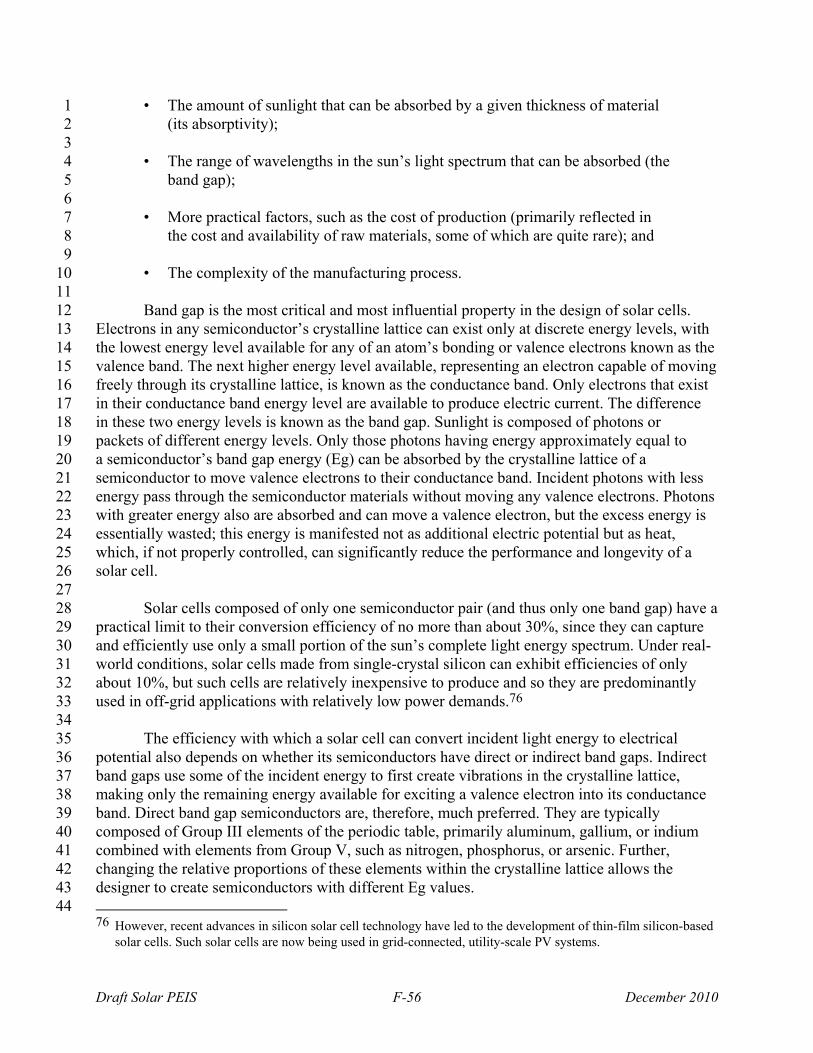
Draft Solar PEIS F-56 December 2010
• The amount of sunlight that can be absorbed by a given thickness of material 1 (its absorptivity); 2
3 • The range of wavelengths in the sun’s light spectrum that can be absorbed (the 4
band gap); 5 6
• More practical factors, such as the cost of production (primarily reflected in 7 the cost and availability of raw materials, some of which are quite rare); and 8
9 • The complexity of the manufacturing process. 10
11 Band gap is the most critical and most influential property in the design of solar cells. 12 Electrons in any semiconductor’s crystalline lattice can exist only at discrete energy levels, with 13 the lowest energy level available for any of an atom’s bonding or valence electrons known as the 14 valence band. The next higher energy level available, representing an electron capable of moving 15 freely through its crystalline lattice, is known as the conductance band. Only electrons that exist 16 in their conductance band energy level are available to produce electric current. The difference 17 in these two energy levels is known as the band gap. Sunlight is composed of photons or 18 packets of different energy levels. Only those photons having energy approximately equal to 19 a semiconductor’s band gap energy (Eg) can be absorbed by the crystalline lattice of a 20 semiconductor to move valence electrons to their conductance band. Incident photons with less 21 energy pass through the semiconductor materials without moving any valence electrons. Photons 22 with greater energy also are absorbed and can move a valence electron, but the excess energy is 23 essentially wasted; this energy is manifested not as additional electric potential but as heat, 24 which, if not properly controlled, can significantly reduce the performance and longevity of a 25 solar cell. 26 27 Solar cells composed of only one semiconductor pair (and thus only one band gap) have a 28 practical limit to their conversion efficiency of no more than about 30%, since they can capture 29 and efficiently use only a small portion of the sun’s complete light energy spectrum. Under real-30 world conditions, solar cells made from single-crystal silicon can exhibit efficiencies of only 31 about 10%, but such cells are relatively inexpensive to produce and so they are predominantly 32 used in off-grid applications with relatively low power demands.76 33 34 The efficiency with which a solar cell can convert incident light energy to electrical 35 potential also depends on whether its semiconductors have direct or indirect band gaps. Indirect 36 band gaps use some of the incident energy to first create vibrations in the crystalline lattice, 37 making only the remaining energy available for exciting a valence electron into its conductance 38 band. Direct band gap semiconductors are, therefore, much preferred. They are typically 39 composed of Group III elements of the periodic table, primarily aluminum, gallium, or indium 40 combined with elements from Group V, such as nitrogen, phosphorus, or arsenic. Further, 41 changing the relative proportions of these elements within the crystalline lattice allows the 42 designer to create semiconductors with different Eg values. 43
44 76 However, recent advances in silicon solar cell technology have led to the development of thin-film silicon-based
solar cells. Such solar cells are now being used in grid-connected, utility-scale PV systems.
Draft Solar PEIS F-57 December 2010
The challenge for designers of utility-scale PV systems is to create a solar cell that 1 absorbs the maximum amount of incident sunlight and converts it most efficiently to electrical 2 potential. This is typically done by stacking semiconductors responsive to photons of different 3 energy together in a multijunction solar cell “sandwich,” installing conductive metal grids 4 above and below to carry current from and to the solar cell, and encasing the entire assembly 5 in glass or transparent plastic to prevent contamination (e.g., from airborne dusts, oxygen, 6 humidity), limit deterioration due to weather, and protect against incidental damage. In a typical 7 arrangement, the semiconductor pair having the highest Eg is uppermost in the sandwich, 8 followed by semiconductors with decreasing Eg values. In some cases, especially where the 9 uppermost semiconductor is highly reflective (e.g., crystalline silicon), an antireflective coating 10 is applied to the top of the cell to minimize reflection of incident light, which can reduce overall 11 cell efficiency. 12 13 Solar cells composed of two semiconductors can theoretically capture as much as 50% 14 of the incident solar flux (Wu et al. 2002). Researchers at DOE’s Lawrence Berkeley National 15 Laboratory have identified a family of semiconductors composed of gallium indium and 16 nitrogen, differing only in relative proportions of each element, that are photoelectronically 17 active throughout the entire solar spectrum. A solar cell composed of all these semiconductors 18 could theoretically capture as much as 86% of solar energy. 19 20 Although it is hypothetically possible to capture 100% of the sun’s light energy by 21 simply stacking enough semiconductors together with Eg values collectively spanning the 22 entire electromagnetic spectrum of sunlight, in practice 23 there are limits. The reduced opacity of multijunction 24 cells, optical losses due to reflection or refraction, as well 25 as the complexity and cost of production have limited 26 multijunction solar cells to a maximum of three or four 27 semiconductor pairs and a real-world efficiency limit of 28 70%. Even so, multijunction solar cells greatly increase the 29 overall energy-producing efficiency of a solar cell and are 30 ultimately the choice for utility-scale PV systems. An 31 example of a multijunction solar cell is depicted in 32 Figure F.3.1-2. 33 34 35
F.3.1.2 Solar Cell Fabrication 36 37 Fabrication of solar cells involves a variety of 38 complex processes, each requiring precisely controlled, 39 scrupulously clean environments. Although fabrication 40 activities are outside the scope of this PEIS because they 41 would occur at remote manufacturing locations and not at 42 the PV installations being considered, some background 43 information is given here to assist in understanding the 44 design and performance of PV facilities. 45 46
FIGURE F.3.1-2 Multijunction Solar Cell (Source: NREL. Available at http://www.nrel.gov/ docs/legosti/old/16319.pdf)
Draft Solar PEIS F-58 December 2010
Solar cell fabrication is a major cost item for PV technologies. Semiconductors can be 1 constructed of single crystals, semicrystals, polycrystals, or even amorphous materials and thin 2 films. Each type offers unique advantages and disadvantages in both manufacturing and 3 performance. In single-crystal semiconductors, all the atoms in the electrically active portion are 4 precisely aligned. Although growing single-crystal cells is a delicate process,77 their electrical 5 performance is generally excellent. Semicrystalline or polycrystalline cells have active portions 6 composed of many single crystals or grains, randomly arranged. Although such cells are less 7 expensive to produce, this random arrangement of atoms creates potential for a reduction in 8 electrical performance. In amorphous solar cells, atoms exist in totally random arrangements. 9 Careful control of fabrication conditions can result in amorphous solar cells with good solar 10 energy conversion efficiencies. Nevertheless, most amorphous solar cells, typically composed 11 of silicon, have been used in low-power devices, and until recently, amorphous solar cells 12 have not been considered for utility-scale PV systems. Now, many operating utility-scale 13 PV facilities utilize amorphous thin-film silicon PV materials. Likewise, utility-scale PV 14 facilities proposed for the United States would likely use thin-film amorphous silicon PV 15 materials. (See Sections F.3.2.4 and F.3.3 for additional information on the types of solar cells 16 being used or proposed for utility-scale PV facilities.) 17 18 Recent electronics industry advances have resulted in the production of thin-film 19 semiconductors that also have PV applications. Thin-film solar cells comprise exceedingly thin 20 layers of semiconductors stacked on top of each other. They can be made from a wide variety 21 of semiconducting materials in both polycrystalline and amorphous forms. Production costs 22 are dramatically reduced for thin-film solar cells. Because the entire thin film behaves 23 monolithically, fabrication is substantially simplified over conventional solar panels that 24 comprise many individual cells that must be precisely aligned and electrically interconnected to 25 form a panel. The manufacturing process for thin-film solar cells is readily adaptable to creating 26 thin films of various sizes and even building thin-film solar cells on flexible substrates such as 27 thin plastic. 28 29 30
F.3.1.3 PV System Design Considerations 31 32 Regardless of their solar energy conversion efficiencies, individual solar cells (excluding 33 thin-film solar cells) are quite small in their active area (i.e., the photoelectrically active portion 34 exposed to sunlight) and produce minimal amounts of electricity (on the order of one or two 35 watts at most). Consequently, applications of PV technology necessarily involve the use of many 36 interconnected solar cells in a module. Various modules combine to make a solar panel, and 37 panels are combined to create subarrays or arrays (Figure F.3.1-3). Modular design allows many 38 arrangements of solar panels and relatively straightforward expansions of a PV facility’s 39 capacity. The nature of the solar cell used and the manner in which individual solar cells are 40 interconnected allow the designer to attain critical electrical performance targets. Each solar cell 41 produces only DC power. Connecting crystalline solar cells in series allows for the voltages 42
77 Single crystals are typically grown in cylindrical shapes that are sliced to create wafers of various thickness
(semiconductor material with poor absorptivity requires a thicker wafer to perform adequately), which may be further shaped into squares to allow for more efficient packing in a solar panel.
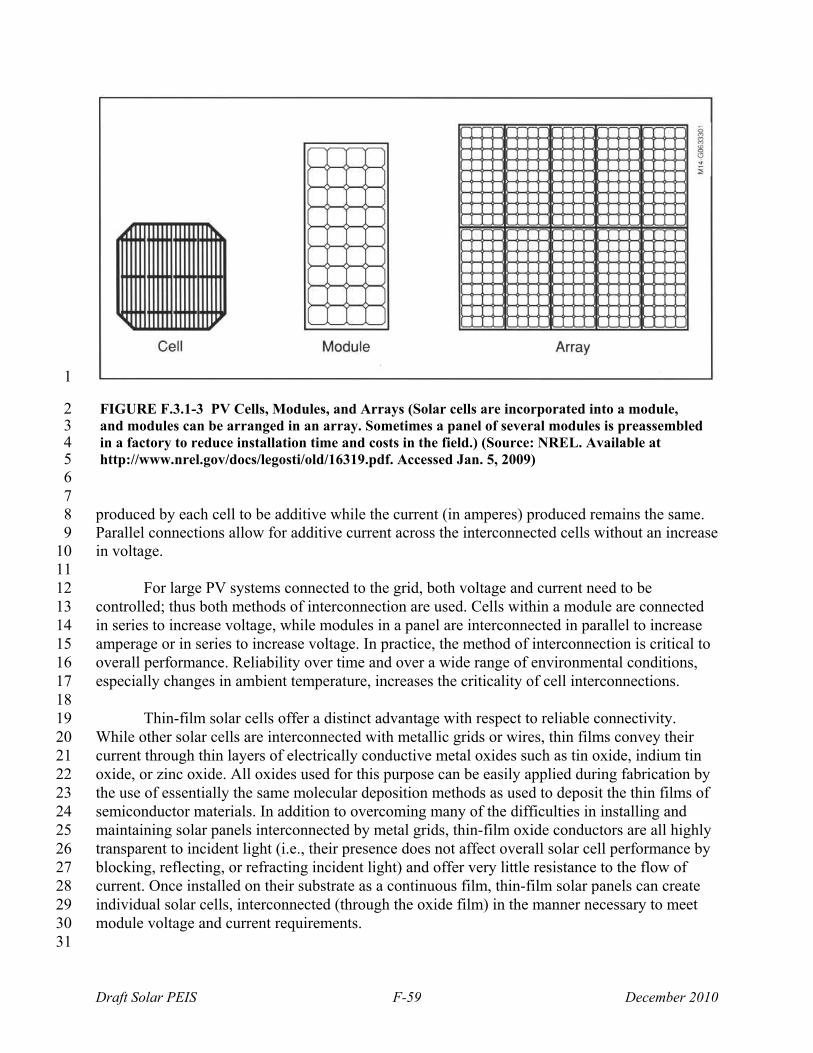
Draft Solar PEIS F-59 December 2010
1
FIGURE F.3.1-3 PV Cells, Modules, and Arrays (Solar cells are incorporated into a module, 2 and modules can be arranged in an array. Sometimes a panel of several modules is preassembled 3 in a factory to reduce installation time and costs in the field.) (Source: NREL. Available at 4 http://www.nrel.gov/docs/legosti/old/16319.pdf. Accessed Jan. 5, 2009) 5
6 7 produced by each cell to be additive while the current (in amperes) produced remains the same. 8 Parallel connections allow for additive current across the interconnected cells without an increase 9 in voltage. 10 11 For large PV systems connected to the grid, both voltage and current need to be 12 controlled; thus both methods of interconnection are used. Cells within a module are connected 13 in series to increase voltage, while modules in a panel are interconnected in parallel to increase 14 amperage or in series to increase voltage. In practice, the method of interconnection is critical to 15 overall performance. Reliability over time and over a wide range of environmental conditions, 16 especially changes in ambient temperature, increases the criticality of cell interconnections. 17 18 Thin-film solar cells offer a distinct advantage with respect to reliable connectivity. 19 While other solar cells are interconnected with metallic grids or wires, thin films convey their 20 current through thin layers of electrically conductive metal oxides such as tin oxide, indium tin 21 oxide, or zinc oxide. All oxides used for this purpose can be easily applied during fabrication by 22 the use of essentially the same molecular deposition methods as used to deposit the thin films of 23 semiconductor materials. In addition to overcoming many of the difficulties in installing and 24 maintaining solar panels interconnected by metal grids, thin-film oxide conductors are all highly 25 transparent to incident light (i.e., their presence does not affect overall solar cell performance by 26 blocking, reflecting, or refracting incident light) and offer very little resistance to the flow of 27 current. Once installed on their substrate as a continuous film, thin-film solar panels can create 28 individual solar cells, interconnected (through the oxide film) in the manner necessary to meet 29 module voltage and current requirements. 30 31
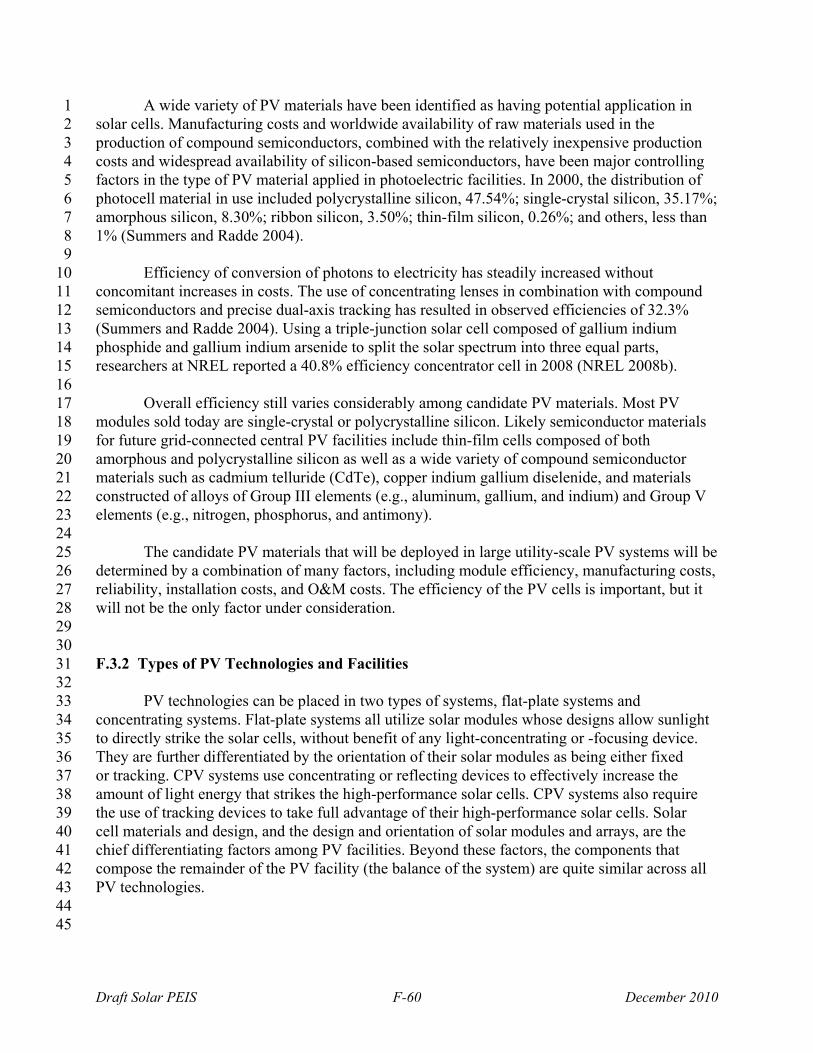
Draft Solar PEIS F-60 December 2010
A wide variety of PV materials have been identified as having potential application in 1 solar cells. Manufacturing costs and worldwide availability of raw materials used in the 2 production of compound semiconductors, combined with the relatively inexpensive production 3 costs and widespread availability of silicon-based semiconductors, have been major controlling 4 factors in the type of PV material applied in photoelectric facilities. In 2000, the distribution of 5 photocell material in use included polycrystalline silicon, 47.54%; single-crystal silicon, 35.17%; 6 amorphous silicon, 8.30%; ribbon silicon, 3.50%; thin-film silicon, 0.26%; and others, less than 7 1% (Summers and Radde 2004). 8 9 Efficiency of conversion of photons to electricity has steadily increased without 10 concomitant increases in costs. The use of concentrating lenses in combination with compound 11 semiconductors and precise dual-axis tracking has resulted in observed efficiencies of 32.3% 12 (Summers and Radde 2004). Using a triple-junction solar cell composed of gallium indium 13 phosphide and gallium indium arsenide to split the solar spectrum into three equal parts, 14 researchers at NREL reported a 40.8% efficiency concentrator cell in 2008 (NREL 2008b). 15 16 Overall efficiency still varies considerably among candidate PV materials. Most PV 17 modules sold today are single-crystal or polycrystalline silicon. Likely semiconductor materials 18 for future grid-connected central PV facilities include thin-film cells composed of both 19 amorphous and polycrystalline silicon as well as a wide variety of compound semiconductor 20 materials such as cadmium telluride (CdTe), copper indium gallium diselenide, and materials 21 constructed of alloys of Group III elements (e.g., aluminum, gallium, and indium) and Group V 22 elements (e.g., nitrogen, phosphorus, and antimony). 23 24 The candidate PV materials that will be deployed in large utility-scale PV systems will be 25 determined by a combination of many factors, including module efficiency, manufacturing costs, 26 reliability, installation costs, and O&M costs. The efficiency of the PV cells is important, but it 27 will not be the only factor under consideration. 28 29 30 F.3.2 Types of PV Technologies and Facilities 31 32 PV technologies can be placed in two types of systems, flat-plate systems and 33 concentrating systems. Flat-plate systems all utilize solar modules whose designs allow sunlight 34 to directly strike the solar cells, without benefit of any light-concentrating or -focusing device. 35 They are further differentiated by the orientation of their solar modules as being either fixed 36 or tracking. CPV systems use concentrating or reflecting devices to effectively increase the 37 amount of light energy that strikes the high-performance solar cells. CPV systems also require 38 the use of tracking devices to take full advantage of their high-performance solar cells. Solar 39 cell materials and design, and the design and orientation of solar modules and arrays, are the 40 chief differentiating factors among PV facilities. Beyond these factors, the components that 41 compose the remainder of the PV facility (the balance of the system) are quite similar across all 42 PV technologies. 43 44 45
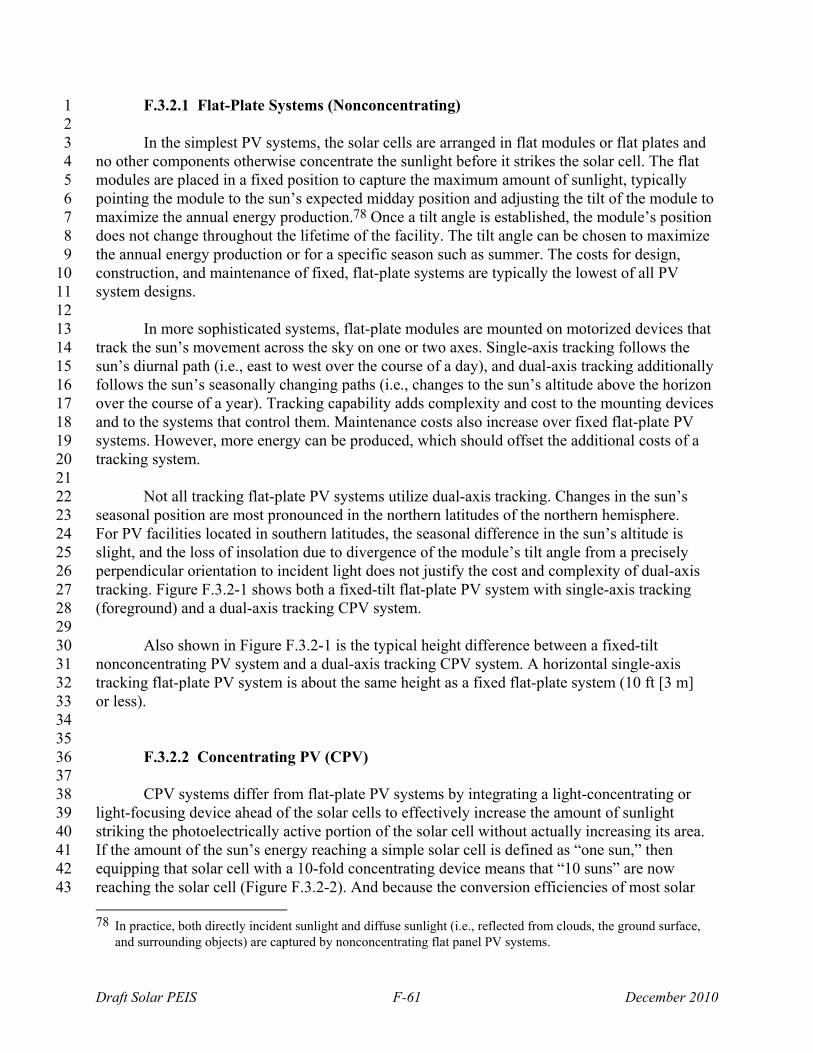
Draft Solar PEIS F-61 December 2010
F.3.2.1 Flat-Plate Systems (Nonconcentrating) 1 2 In the simplest PV systems, the solar cells are arranged in flat modules or flat plates and 3 no other components otherwise concentrate the sunlight before it strikes the solar cell. The flat 4 modules are placed in a fixed position to capture the maximum amount of sunlight, typically 5 pointing the module to the sun’s expected midday position and adjusting the tilt of the module to 6 maximize the annual energy production.78 Once a tilt angle is established, the module’s position 7 does not change throughout the lifetime of the facility. The tilt angle can be chosen to maximize 8 the annual energy production or for a specific season such as summer. The costs for design, 9 construction, and maintenance of fixed, flat-plate systems are typically the lowest of all PV 10 system designs. 11 12 In more sophisticated systems, flat-plate modules are mounted on motorized devices that 13 track the sun’s movement across the sky on one or two axes. Single-axis tracking follows the 14 sun’s diurnal path (i.e., east to west over the course of a day), and dual-axis tracking additionally 15 follows the sun’s seasonally changing paths (i.e., changes to the sun’s altitude above the horizon 16 over the course of a year). Tracking capability adds complexity and cost to the mounting devices 17 and to the systems that control them. Maintenance costs also increase over fixed flat-plate PV 18 systems. However, more energy can be produced, which should offset the additional costs of a 19 tracking system. 20 21 Not all tracking flat-plate PV systems utilize dual-axis tracking. Changes in the sun’s 22 seasonal position are most pronounced in the northern latitudes of the northern hemisphere. 23 For PV facilities located in southern latitudes, the seasonal difference in the sun’s altitude is 24 slight, and the loss of insolation due to divergence of the module’s tilt angle from a precisely 25 perpendicular orientation to incident light does not justify the cost and complexity of dual-axis 26 tracking. Figure F.3.2-1 shows both a fixed-tilt flat-plate PV system with single-axis tracking 27 (foreground) and a dual-axis tracking CPV system. 28 29 Also shown in Figure F.3.2-1 is the typical height difference between a fixed-tilt 30 nonconcentrating PV system and a dual-axis tracking CPV system. A horizontal single-axis 31 tracking flat-plate PV system is about the same height as a fixed flat-plate system (10 ft [3 m] 32 or less). 33 34 35
F.3.2.2 Concentrating PV (CPV) 36 37 CPV systems differ from flat-plate PV systems by integrating a light-concentrating or 38 light-focusing device ahead of the solar cells to effectively increase the amount of sunlight 39 striking the photoelectrically active portion of the solar cell without actually increasing its area. 40 If the amount of the sun’s energy reaching a simple solar cell is defined as “one sun,” then 41 equipping that solar cell with a 10-fold concentrating device means that “10 suns” are now 42 reaching the solar cell (Figure F.3.2-2). And because the conversion efficiencies of most solar 43 78 In practice, both directly incident sunlight and diffuse sunlight (i.e., reflected from clouds, the ground surface,
and surrounding objects) are captured by nonconcentrating flat panel PV systems.
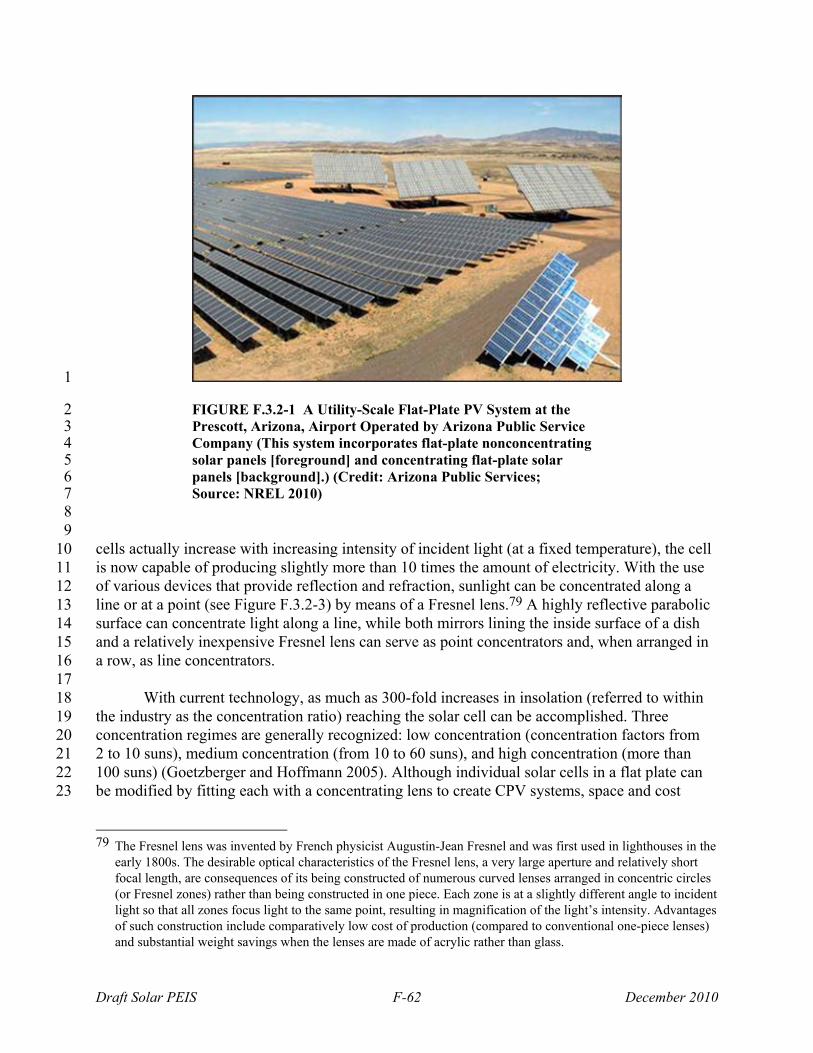
Draft Solar PEIS F-62 December 2010
1
FIGURE F.3.2-1 A Utility-Scale Flat-Plate PV System at the 2 Prescott, Arizona, Airport Operated by Arizona Public Service 3 Company (This system incorporates flat-plate nonconcentrating 4 solar panels [foreground] and concentrating flat-plate solar 5 panels [background].) (Credit: Arizona Public Services; 6 Source: NREL 2010) 7
8 9 cells actually increase with increasing intensity of incident light (at a fixed temperature), the cell 10 is now capable of producing slightly more than 10 times the amount of electricity. With the use 11 of various devices that provide reflection and refraction, sunlight can be concentrated along a 12 line or at a point (see Figure F.3.2-3) by means of a Fresnel lens.79 A highly reflective parabolic 13 surface can concentrate light along a line, while both mirrors lining the inside surface of a dish 14 and a relatively inexpensive Fresnel lens can serve as point concentrators and, when arranged in 15 a row, as line concentrators. 16 17 With current technology, as much as 300-fold increases in insolation (referred to within 18 the industry as the concentration ratio) reaching the solar cell can be accomplished. Three 19 concentration regimes are generally recognized: low concentration (concentration factors from 20 2 to 10 suns), medium concentration (from 10 to 60 suns), and high concentration (more than 21 100 suns) (Goetzberger and Hoffmann 2005). Although individual solar cells in a flat plate can 22 be modified by fitting each with a concentrating lens to create CPV systems, space and cost 23
79 The Fresnel lens was invented by French physicist Augustin-Jean Fresnel and was first used in lighthouses in the
early 1800s. The desirable optical characteristics of the Fresnel lens, a very large aperture and relatively short focal length, are consequences of its being constructed of numerous curved lenses arranged in concentric circles (or Fresnel zones) rather than being constructed in one piece. Each zone is at a slightly different angle to incident light so that all zones focus light to the same point, resulting in magnification of the light’s intensity. Advantages of such construction include comparatively low cost of production (compared to conventional one-piece lenses) and substantial weight savings when the lenses are made of acrylic rather than glass.
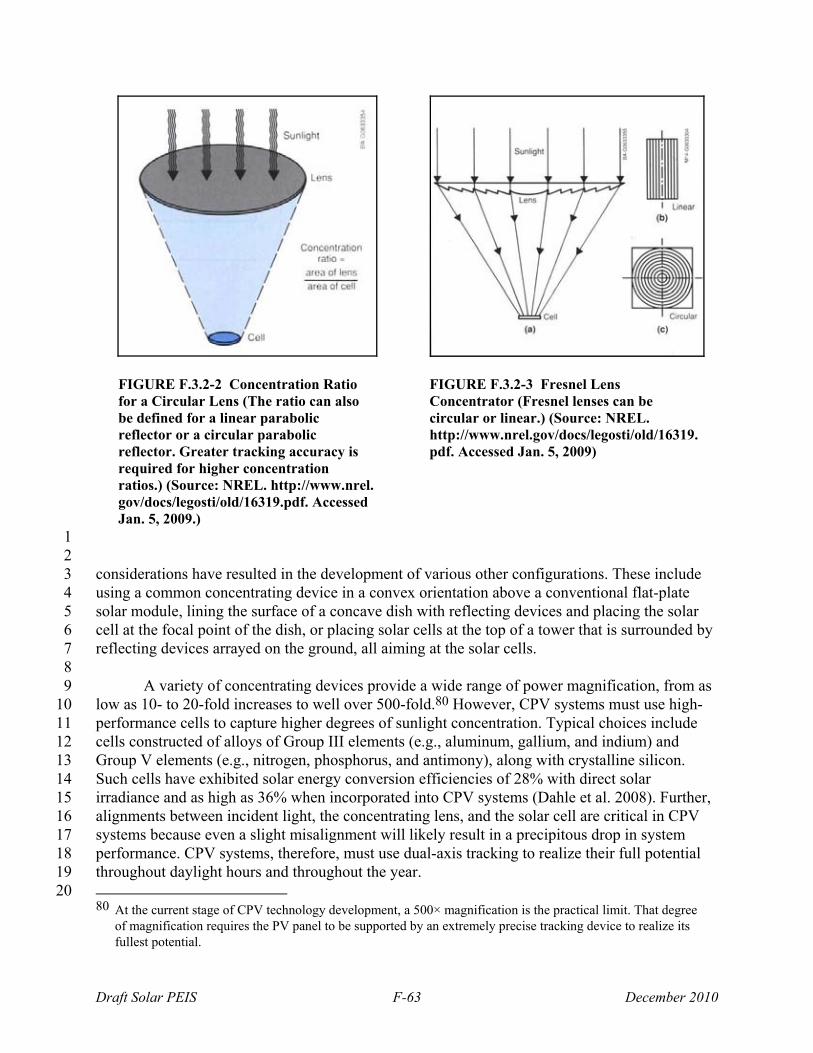
Draft Solar PEIS F-63 December 2010
FIGURE F.3.2-2 Concentration Ratio for a Circular Lens (The ratio can also be defined for a linear parabolic reflector or a circular parabolic reflector. Greater tracking accuracy is required for higher concentration ratios.) (Source: NREL. http://www.nrel. gov/docs/legosti/old/16319.pdf. Accessed Jan. 5, 2009.)
FIGURE F.3.2-3 Fresnel Lens Concentrator (Fresnel lenses can be circular or linear.) (Source: NREL. http://www.nrel.gov/docs/legosti/old/16319.pdf. Accessed Jan. 5, 2009)
1 2 considerations have resulted in the development of various other configurations. These include 3 using a common concentrating device in a convex orientation above a conventional flat-plate 4 solar module, lining the surface of a concave dish with reflecting devices and placing the solar 5 cell at the focal point of the dish, or placing solar cells at the top of a tower that is surrounded by 6 reflecting devices arrayed on the ground, all aiming at the solar cells. 7 8 A variety of concentrating devices provide a wide range of power magnification, from as 9 low as 10- to 20-fold increases to well over 500-fold.80 However, CPV systems must use high-10 performance cells to capture higher degrees of sunlight concentration. Typical choices include 11 cells constructed of alloys of Group III elements (e.g., aluminum, gallium, and indium) and 12 Group V elements (e.g., nitrogen, phosphorus, and antimony), along with crystalline silicon. 13 Such cells have exhibited solar energy conversion efficiencies of 28% with direct solar 14 irradiance and as high as 36% when incorporated into CPV systems (Dahle et al. 2008). Further, 15 alignments between incident light, the concentrating lens, and the solar cell are critical in CPV 16 systems because even a slight misalignment will likely result in a precipitous drop in system 17 performance. CPV systems, therefore, must use dual-axis tracking to realize their full potential 18 throughout daylight hours and throughout the year. 19
20 80 At the current stage of CPV technology development, a 500× magnification is the practical limit. That degree
of magnification requires the PV panel to be supported by an extremely precise tracking device to realize its fullest potential.
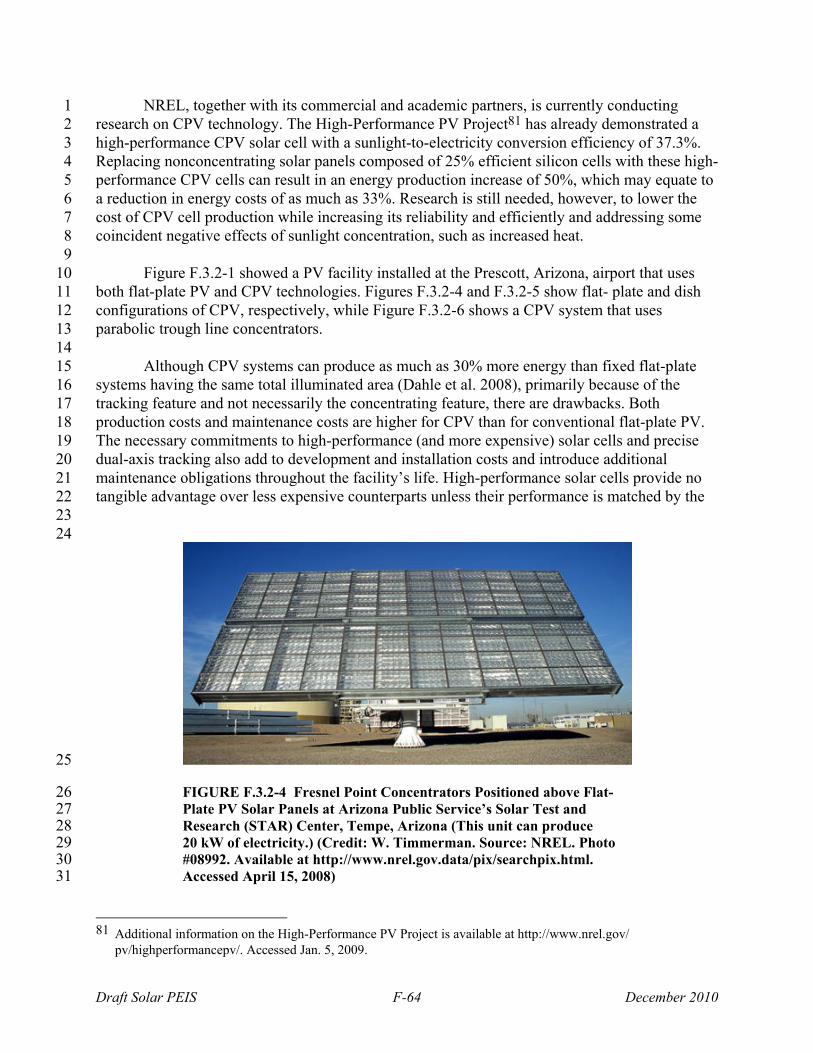
Draft Solar PEIS F-64 December 2010
NREL, together with its commercial and academic partners, is currently conducting 1 research on CPV technology. The High-Performance PV Project81 has already demonstrated a 2 high-performance CPV solar cell with a sunlight-to-electricity conversion efficiency of 37.3%. 3 Replacing nonconcentrating solar panels composed of 25% efficient silicon cells with these high-4 performance CPV cells can result in an energy production increase of 50%, which may equate to 5 a reduction in energy costs of as much as 33%. Research is still needed, however, to lower the 6 cost of CPV cell production while increasing its reliability and efficiently and addressing some 7 coincident negative effects of sunlight concentration, such as increased heat. 8 9 Figure F.3.2-1 showed a PV facility installed at the Prescott, Arizona, airport that uses 10 both flat-plate PV and CPV technologies. Figures F.3.2-4 and F.3.2-5 show flat- plate and dish 11 configurations of CPV, respectively, while Figure F.3.2-6 shows a CPV system that uses 12 parabolic trough line concentrators. 13 14 Although CPV systems can produce as much as 30% more energy than fixed flat-plate 15 systems having the same total illuminated area (Dahle et al. 2008), primarily because of the 16 tracking feature and not necessarily the concentrating feature, there are drawbacks. Both 17 production costs and maintenance costs are higher for CPV than for conventional flat-plate PV. 18 The necessary commitments to high-performance (and more expensive) solar cells and precise 19 dual-axis tracking also add to development and installation costs and introduce additional 20 maintenance obligations throughout the facility’s life. High-performance solar cells provide no 21 tangible advantage over less expensive counterparts unless their performance is matched by the 22 23 24
25
FIGURE F.3.2-4 Fresnel Point Concentrators Positioned above Flat-26 Plate PV Solar Panels at Arizona Public Service’s Solar Test and 27 Research (STAR) Center, Tempe, Arizona (This unit can produce 28 20 kW of electricity.) (Credit: W. Timmerman. Source: NREL. Photo 29 #08992. Available at http://www.nrel.gov.data/pix/searchpix.html. 30 Accessed April 15, 2008) 31
81 Additional information on the High-Performance PV Project is available at http://www.nrel.gov/
pv/highperformancepv/. Accessed Jan. 5, 2009.
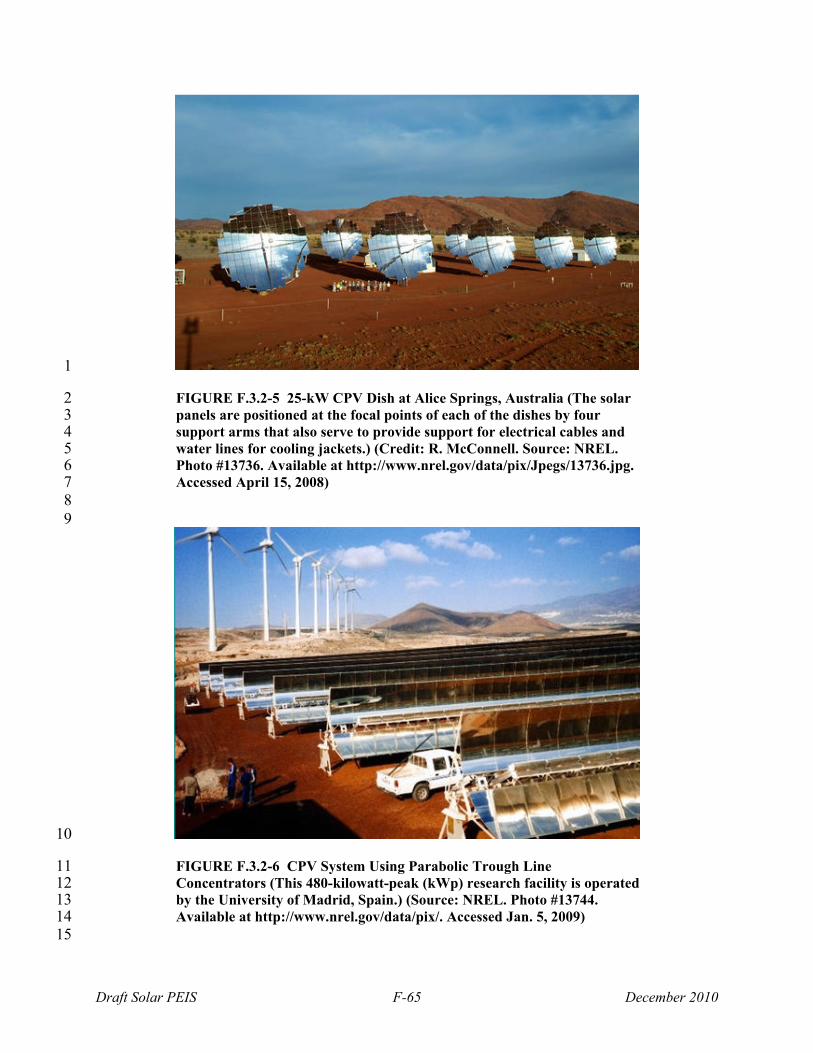
Draft Solar PEIS F-65 December 2010
1
FIGURE F.3.2-5 25-kW CPV Dish at Alice Springs, Australia (The solar 2 panels are positioned at the focal points of each of the dishes by four 3 support arms that also serve to provide support for electrical cables and 4 water lines for cooling jackets.) (Credit: R. McConnell. Source: NREL. 5 Photo #13736. Available at http://www.nrel.gov/data/pix/Jpegs/13736.jpg. 6 Accessed April 15, 2008) 7
8 9
10
FIGURE F.3.2-6 CPV System Using Parabolic Trough Line 11 Concentrators (This 480-kilowatt-peak (kWp) research facility is operated 12 by the University of Madrid, Spain.) (Source: NREL. Photo #13744. 13 Available at http://www.nrel.gov/data/pix/. Accessed Jan. 5, 2009) 14
15
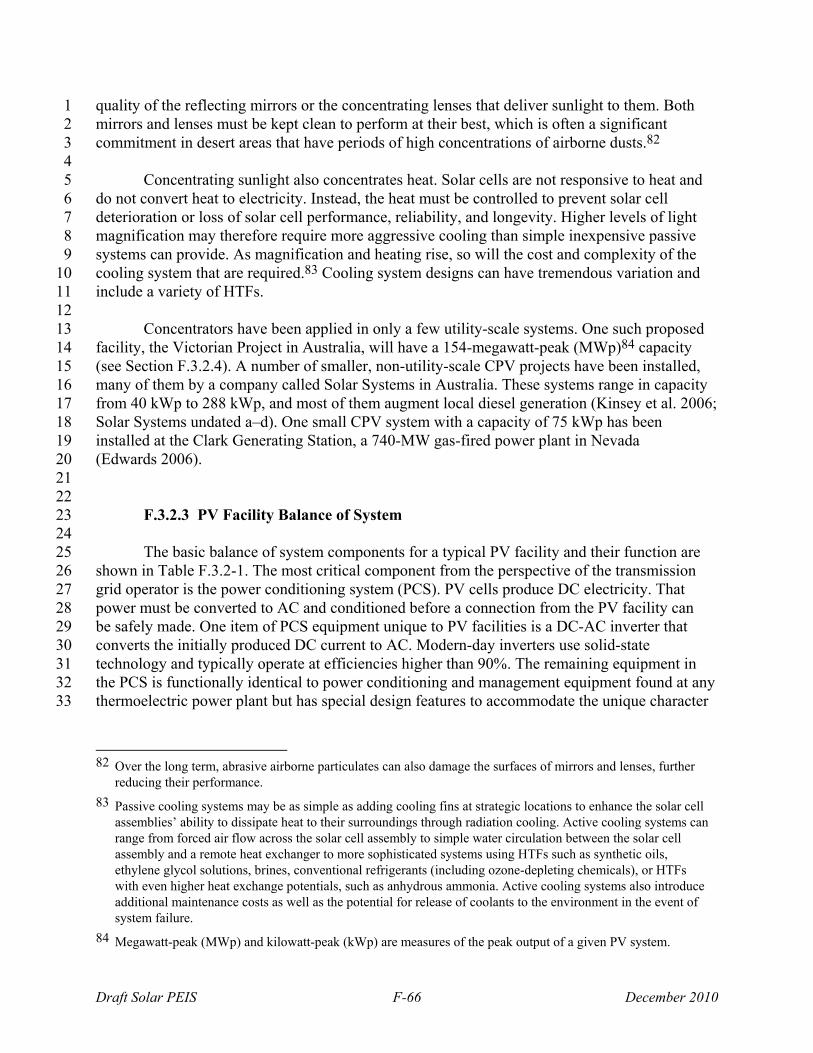
Draft Solar PEIS F-66 December 2010
quality of the reflecting mirrors or the concentrating lenses that deliver sunlight to them. Both 1 mirrors and lenses must be kept clean to perform at their best, which is often a significant 2 commitment in desert areas that have periods of high concentrations of airborne dusts.82 3 4 Concentrating sunlight also concentrates heat. Solar cells are not responsive to heat and 5 do not convert heat to electricity. Instead, the heat must be controlled to prevent solar cell 6 deterioration or loss of solar cell performance, reliability, and longevity. Higher levels of light 7 magnification may therefore require more aggressive cooling than simple inexpensive passive 8 systems can provide. As magnification and heating rise, so will the cost and complexity of the 9 cooling system that are required.83 Cooling system designs can have tremendous variation and 10 include a variety of HTFs. 11 12
Concentrators have been applied in only a few utility-scale systems. One such proposed 13 facility, the Victorian Project in Australia, will have a 154-megawatt-peak (MWp)84 capacity 14 (see Section F.3.2.4). A number of smaller, non-utility-scale CPV projects have been installed, 15 many of them by a company called Solar Systems in Australia. These systems range in capacity 16 from 40 kWp to 288 kWp, and most of them augment local diesel generation (Kinsey et al. 2006; 17 Solar Systems undated a–d). One small CPV system with a capacity of 75 kWp has been 18 installed at the Clark Generating Station, a 740-MW gas-fired power plant in Nevada 19 (Edwards 2006). 20 21 22
F.3.2.3 PV Facility Balance of System 23 24 The basic balance of system components for a typical PV facility and their function are 25 shown in Table F.3.2-1. The most critical component from the perspective of the transmission 26 grid operator is the power conditioning system (PCS). PV cells produce DC electricity. That 27 power must be converted to AC and conditioned before a connection from the PV facility can 28 be safely made. One item of PCS equipment unique to PV facilities is a DC-AC inverter that 29 converts the initially produced DC current to AC. Modern-day inverters use solid-state 30 technology and typically operate at efficiencies higher than 90%. The remaining equipment in 31 the PCS is functionally identical to power conditioning and management equipment found at any 32 thermoelectric power plant but has special design features to accommodate the unique character 33
82 Over the long term, abrasive airborne particulates can also damage the surfaces of mirrors and lenses, further
reducing their performance.
83 Passive cooling systems may be as simple as adding cooling fins at strategic locations to enhance the solar cell assemblies’ ability to dissipate heat to their surroundings through radiation cooling. Active cooling systems can range from forced air flow across the solar cell assembly to simple water circulation between the solar cell assembly and a remote heat exchanger to more sophisticated systems using HTFs such as synthetic oils, ethylene glycol solutions, brines, conventional refrigerants (including ozone-depleting chemicals), or HTFs with even higher heat exchange potentials, such as anhydrous ammonia. Active cooling systems also introduce additional maintenance costs as well as the potential for release of coolants to the environment in the event of system failure.
84 Megawatt-peak (MWp) and kilowatt-peak (kWp) are measures of the peak output of a given PV system.
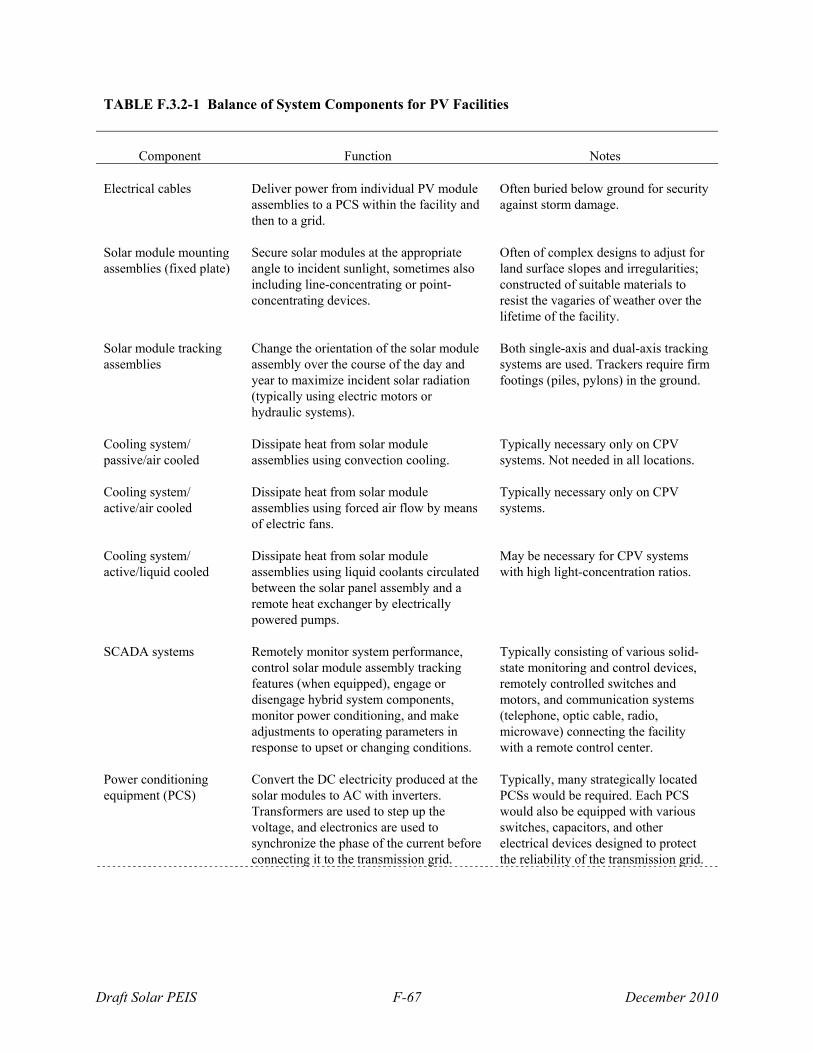
Draft Solar PEIS F-67 December 2010
TABLE F.3.2-1 Balance of System Components for PV Facilities
Component
Function
Notes
Electrical cables Deliver power from individual PV module
assemblies to a PCS within the facility and then to a grid.
Often buried below ground for security against storm damage.
Solar module mounting assemblies (fixed plate)
Secure solar modules at the appropriate angle to incident sunlight, sometimes also including line-concentrating or point-concentrating devices.
Often of complex designs to adjust for land surface slopes and irregularities; constructed of suitable materials to resist the vagaries of weather over the lifetime of the facility.
Solar module tracking assemblies
Change the orientation of the solar module assembly over the course of the day and year to maximize incident solar radiation (typically using electric motors or hydraulic systems).
Both single-axis and dual-axis tracking systems are used. Trackers require firm footings (piles, pylons) in the ground.
Cooling system/ passive/air cooled
Dissipate heat from solar module assemblies using convection cooling.
Typically necessary only on CPV systems. Not needed in all locations.
Cooling system/ active/air cooled
Dissipate heat from solar module assemblies using forced air flow by means of electric fans.
Typically necessary only on CPV systems.
Cooling system/ active/liquid cooled
Dissipate heat from solar module assemblies using liquid coolants circulated between the solar panel assembly and a remote heat exchanger by electrically powered pumps.
May be necessary for CPV systems with high light-concentration ratios.
SCADA systems Remotely monitor system performance,
control solar module assembly tracking features (when equipped), engage or disengage hybrid system components, monitor power conditioning, and make adjustments to operating parameters in response to upset or changing conditions.
Typically consisting of various solid-state monitoring and control devices, remotely controlled switches and motors, and communication systems (telephone, optic cable, radio, microwave) connecting the facility with a remote control center.
Power conditioning equipment (PCS)
Convert the DC electricity produced at the solar modules to AC with inverters. Transformers are used to step up the voltage, and electronics are used to synchronize the phase of the current before connecting it to the transmission grid.
Typically, many strategically located PCSs would be required. Each PCS would also be equipped with various switches, capacitors, and other electrical devices designed to protect the reliability of the transmission grid.
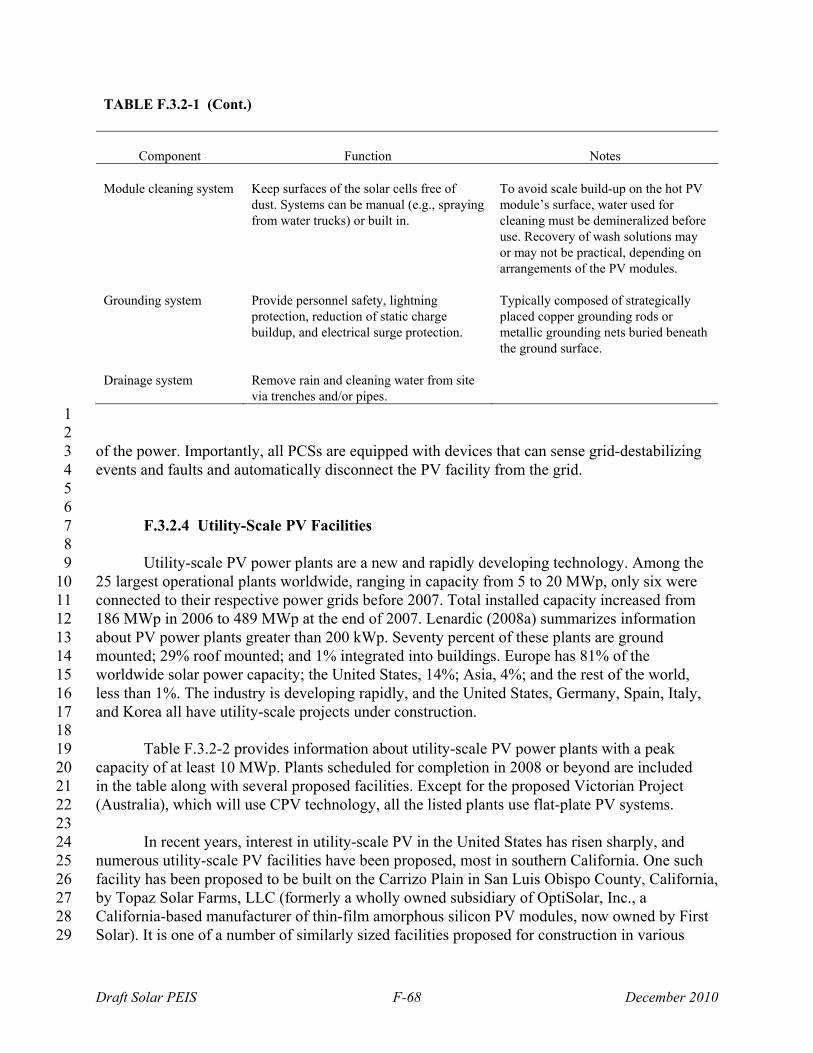
Draft Solar PEIS F-68 December 2010
TABLE F.3.2-1 (Cont.)
Component
Function
Notes
Module cleaning system Keep surfaces of the solar cells free of
dust. Systems can be manual (e.g., spraying from water trucks) or built in.
To avoid scale build-up on the hot PV module’s surface, water used for cleaning must be demineralized before use. Recovery of wash solutions may or may not be practical, depending on arrangements of the PV modules.
Grounding system Provide personnel safety, lightning
protection, reduction of static charge buildup, and electrical surge protection.
Typically composed of strategically placed copper grounding rods or metallic grounding nets buried beneath the ground surface.
Drainage system Remove rain and cleaning water from site
via trenches and/or pipes.
1 2 of the power. Importantly, all PCSs are equipped with devices that can sense grid-destabilizing 3 events and faults and automatically disconnect the PV facility from the grid. 4 5 6
F.3.2.4 Utility-Scale PV Facilities 7 8 Utility-scale PV power plants are a new and rapidly developing technology. Among the 9 25 largest operational plants worldwide, ranging in capacity from 5 to 20 MWp, only six were 10 connected to their respective power grids before 2007. Total installed capacity increased from 11 186 MWp in 2006 to 489 MWp at the end of 2007. Lenardic (2008a) summarizes information 12 about PV power plants greater than 200 kWp. Seventy percent of these plants are ground 13 mounted; 29% roof mounted; and 1% integrated into buildings. Europe has 81% of the 14 worldwide solar power capacity; the United States, 14%; Asia, 4%; and the rest of the world, 15 less than 1%. The industry is developing rapidly, and the United States, Germany, Spain, Italy, 16 and Korea all have utility-scale projects under construction. 17 18 Table F.3.2-2 provides information about utility-scale PV power plants with a peak 19 capacity of at least 10 MWp. Plants scheduled for completion in 2008 or beyond are included 20 in the table along with several proposed facilities. Except for the proposed Victorian Project 21 (Australia), which will use CPV technology, all the listed plants use flat-plate PV systems. 22 23 In recent years, interest in utility-scale PV in the United States has risen sharply, and 24 numerous utility-scale PV facilities have been proposed, most in southern California. One such 25 facility has been proposed to be built on the Carrizo Plain in San Luis Obispo County, California, 26 by Topaz Solar Farms, LLC (formerly a wholly owned subsidiary of OptiSolar, Inc., a 27 California-based manufacturer of thin-film amorphous silicon PV modules, now owned by First 28 Solar). It is one of a number of similarly sized facilities proposed for construction in various29
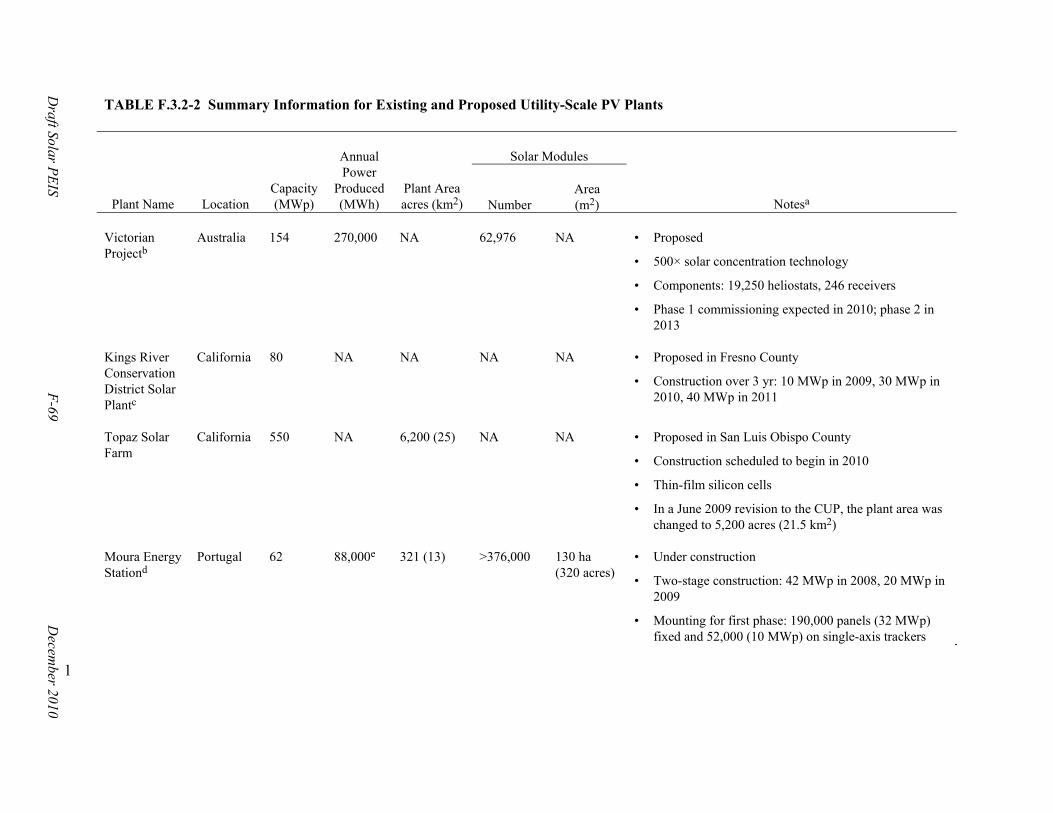
Draft Solar P
EIS
F-69
Decem
ber 2010
TABLE F.3.2-2 Summary Information for Existing and Proposed Utility-Scale PV Plants
Plant Name
Location
Capacity (MWp)
Annual Power
Produced (MWh)
Plant Area acres (km2)
Solar Modules
Notesa
Number
Area (m2)
Victorian Projectb
Australia 154 270,000 NA 62,976 NA • Proposed
• 500× solar concentration technology
• Components: 19,250 heliostats, 246 receivers
• Phase 1 commissioning expected in 2010; phase 2 in 2013
Kings River Conservation District Solar Plantc
California 80 NA NA NA NA • Proposed in Fresno County
• Construction over 3 yr: 10 MWp in 2009, 30 MWp in 2010, 40 MWp in 2011
Topaz Solar Farm
California 550 NA 6,200 (25) NA NA • Proposed in San Luis Obispo County
• Construction scheduled to begin in 2010
• Thin-film silicon cells
• In a June 2009 revision to the CUP, the plant area was changed to 5,200 acres (21.5 km2)
Moura Energy Stationd
Portugal 62 88,000e 321 (13) >376,000 130 ha (320 acres)
• Under construction
• Two-stage construction: 42 MWp in 2008, 20 MWp in 2009
• Mounting for first phase: 190,000 panels (32 MWp) fixed and 52,000 (10 MWp) on single-axis trackers
1
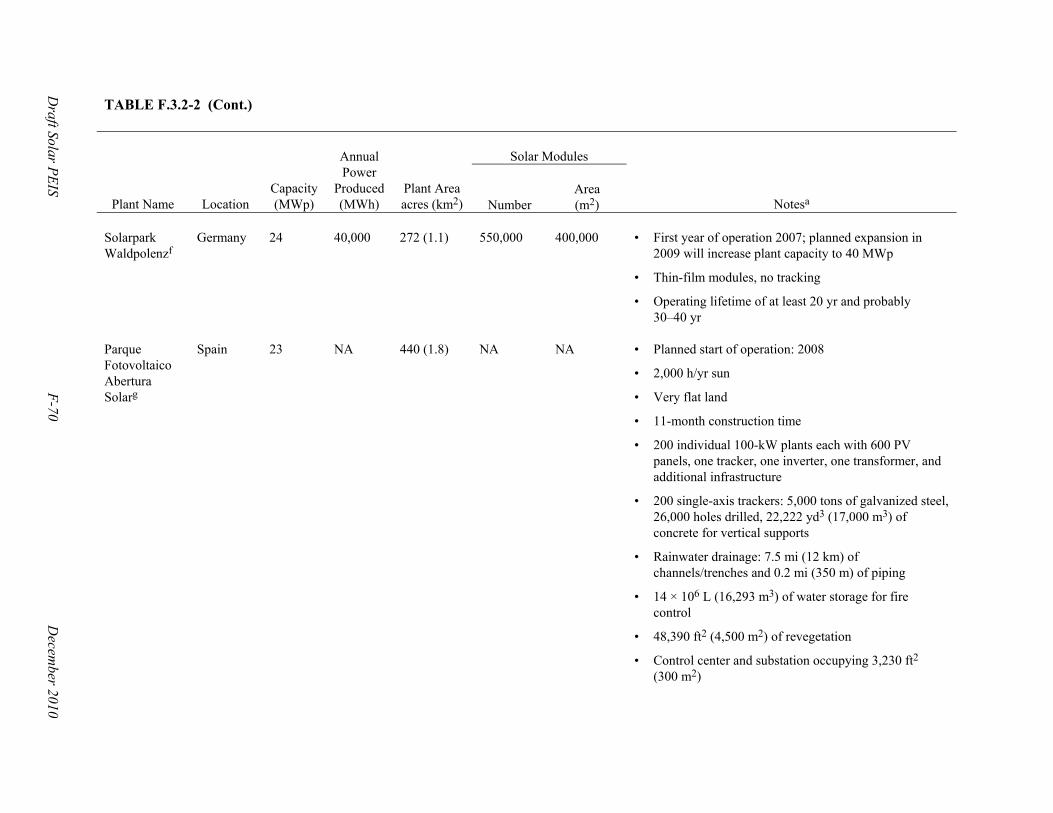
Draft Solar P
EIS
F-70
Decem
ber 2010
TABLE F.3.2-2 (Cont.)
Plant Name
Location
Capacity (MWp)
Annual Power
Produced (MWh)
Plant Area acres (km2)
Solar Modules
Notesa
Number
Area (m2)
Solarpark Waldpolenzf
Germany 24 40,000 272 (1.1) 550,000 400,000 • First year of operation 2007; planned expansion in 2009 will increase plant capacity to 40 MWp
• Thin-film modules, no tracking
• Operating lifetime of at least 20 yr and probably 30–40 yr
Parque Fotovoltaico Abertura Solarg
Spain 23 NA 440 (1.8) NA NA • Planned start of operation: 2008
• 2,000 h/yr sun
• Very flat land
• 11-month construction time
• 200 individual 100-kW plants each with 600 PV panels, one tracker, one inverter, one transformer, and additional infrastructure
• 200 single-axis trackers: 5,000 tons of galvanized steel, 26,000 holes drilled, 22,222 yd3 (17,000 m3) of concrete for vertical supports
• Rainwater drainage: 7.5 mi (12 km) of channels/trenches and 0.2 mi (350 m) of piping
• 14 × 106 L (16,293 m3) of water storage for fire control
• 48,390 ft2 (4,500 m2) of revegetation
• Control center and substation occupying 3,230 ft2 (300 m2)
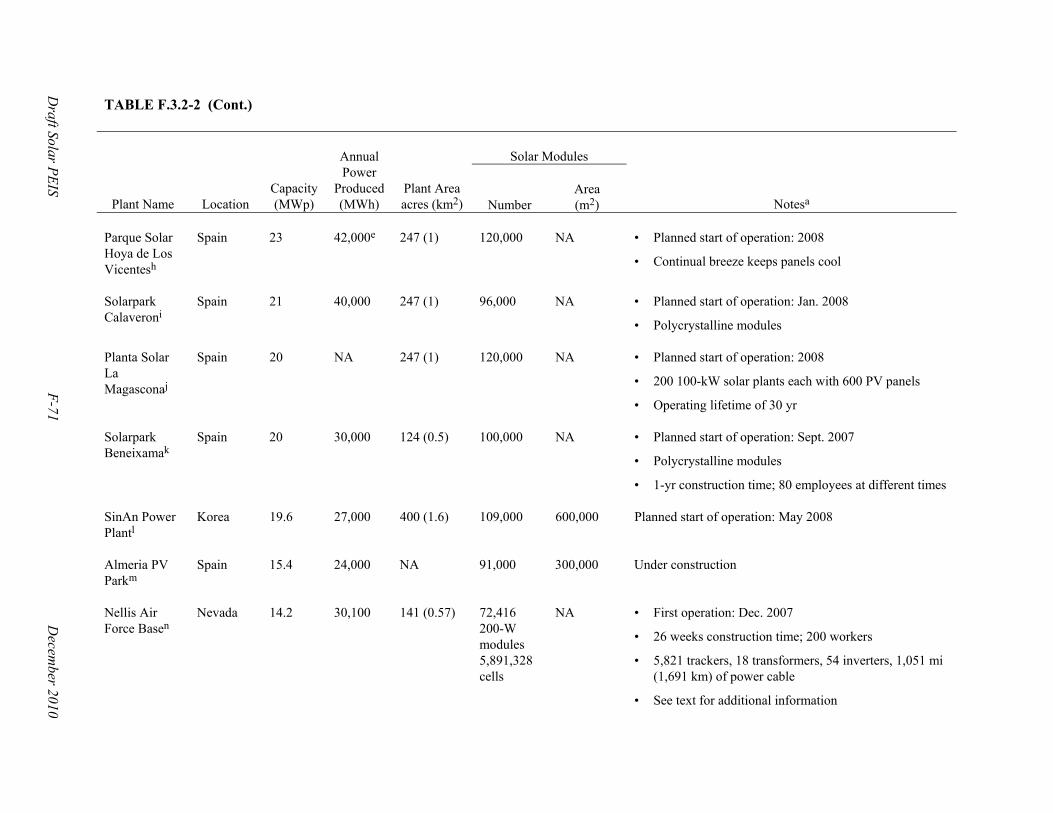
Draft Solar P
EIS
F-71
Decem
ber 2010
TABLE F.3.2-2 (Cont.)
Plant Name
Location
Capacity (MWp)
Annual Power
Produced (MWh)
Plant Area acres (km2)
Solar Modules
Notesa
Number
Area (m2)
Parque Solar Hoya de Los Vicentesh
Spain 23 42,000e 247 (1) 120,000 NA • Planned start of operation: 2008
• Continual breeze keeps panels cool
Solarpark Calaveroni
Spain 21 40,000 247 (1) 96,000 NA • Planned start of operation: Jan. 2008
• Polycrystalline modules Planta Solar La Magasconaj
Spain 20 NA 247 (1) 120,000 NA • Planned start of operation: 2008
• 200 100-kW solar plants each with 600 PV panels
• Operating lifetime of 30 yr Solarpark Beneixamak
Spain 20 30,000 124 (0.5) 100,000 NA • Planned start of operation: Sept. 2007
• Polycrystalline modules
• 1-yr construction time; 80 employees at different times SinAn Power Plantl
Korea 19.6 27,000 400 (1.6) 109,000 600,000 Planned start of operation: May 2008
Almeria PV Parkm
Spain 15.4 24,000 NA 91,000 300,000 Under construction
Nellis Air Force Basen
Nevada 14.2 30,100 141 (0.57) 72,416 200-W modules 5,891,328 cells
NA • First operation: Dec. 2007
• 26 weeks construction time; 200 workers
• 5,821 trackers, 18 transformers, 54 inverters, 1,051 mi (1,691 km) of power cable
• See text for additional information
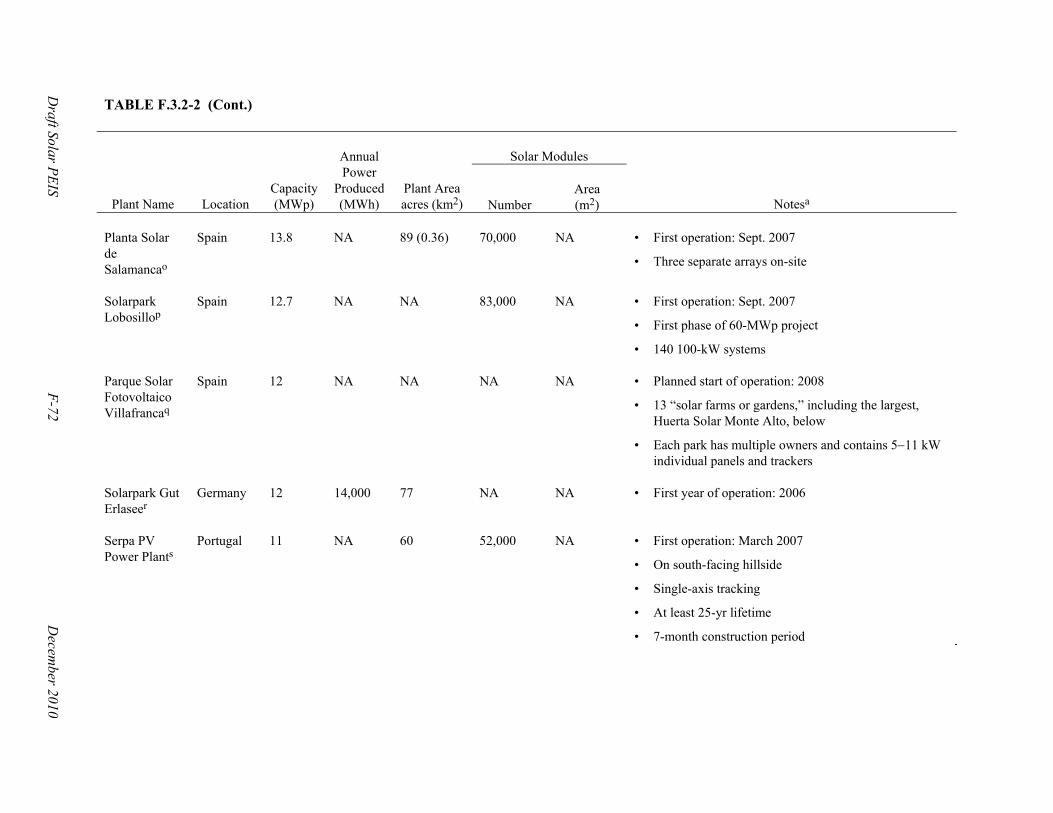
Draft Solar P
EIS
F-72
Decem
ber 2010
TABLE F.3.2-2 (Cont.)
Plant Name
Location
Capacity (MWp)
Annual Power
Produced (MWh)
Plant Area acres (km2)
Solar Modules
Notesa
Number
Area (m2)
Planta Solar de Salamancao
Spain 13.8 NA 89 (0.36) 70,000 NA • First operation: Sept. 2007
• Three separate arrays on-site
Solarpark Lobosillop
Spain 12.7 NA NA 83,000 NA • First operation: Sept. 2007
• First phase of 60-MWp project
• 140 100-kW systems Parque Solar Fotovoltaico Villafrancaq
Spain 12 NA NA NA NA • Planned start of operation: 2008
• 13 “solar farms or gardens,” including the largest, Huerta Solar Monte Alto, below
• Each park has multiple owners and contains 511 kW individual panels and trackers
Solarpark Gut Erlaseer
Germany 12 14,000 77 NA NA • First year of operation: 2006
Serpa PV Power Plants
Portugal 11 NA 60 52,000 NA • First operation: March 2007
• On south-facing hillside
• Single-axis tracking
• At least 25-yr lifetime
• 7-month construction period
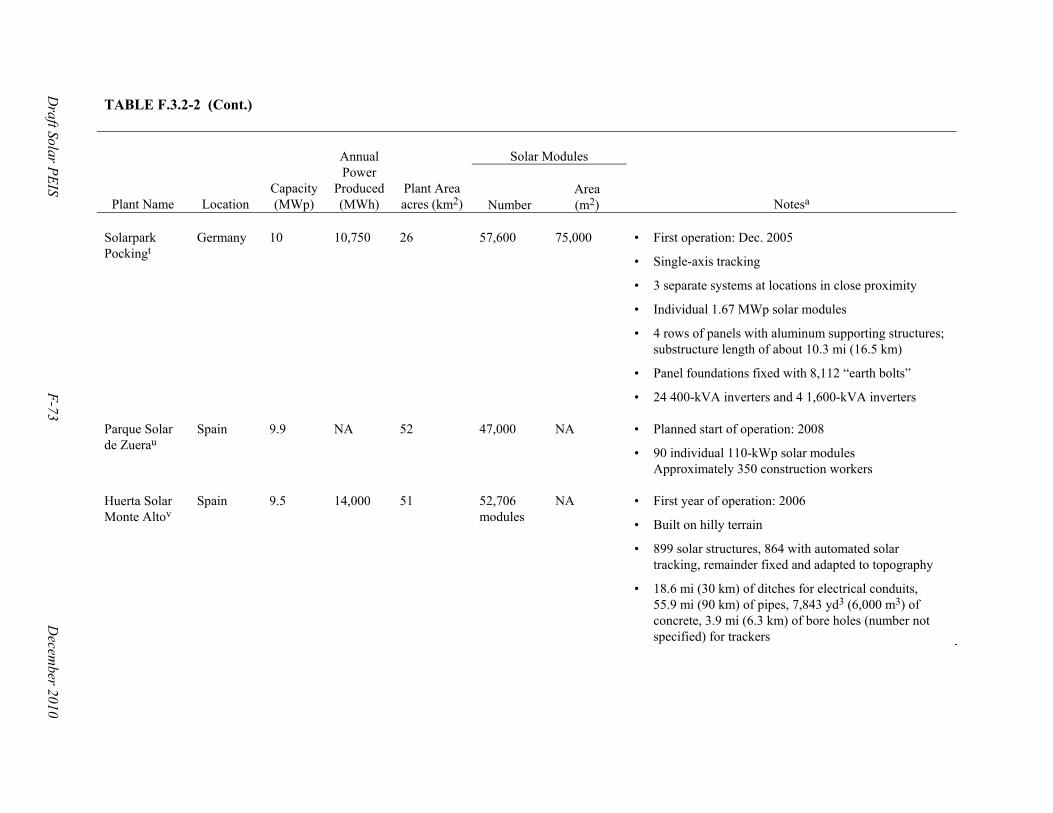
Draft Solar P
EIS
F-73
Decem
ber 2010
TABLE F.3.2-2 (Cont.)
Plant Name
Location
Capacity (MWp)
Annual Power
Produced (MWh)
Plant Area acres (km2)
Solar Modules
Notesa
Number
Area (m2)
Solarpark Pockingt
Germany 10 10,750 26 57,600 75,000 • First operation: Dec. 2005
• Single-axis tracking
• 3 separate systems at locations in close proximity
• Individual 1.67 MWp solar modules
• 4 rows of panels with aluminum supporting structures; substructure length of about 10.3 mi (16.5 km)
• Panel foundations fixed with 8,112 “earth bolts”
• 24 400-kVA inverters and 4 1,600-kVA inverters Parque Solar de Zuerau
Spain 9.9 NA 52 47,000 NA • Planned start of operation: 2008
• 90 individual 110-kWp solar modules Approximately 350 construction workers
Huerta Solar Monte Altov
Spain 9.5 14,000 51 52,706 modules
NA • First year of operation: 2006
• Built on hilly terrain
• 899 solar structures, 864 with automated solar tracking, remainder fixed and adapted to topography
• 18.6 mi (30 km) of ditches for electrical conduits, 55.9 mi (90 km) of pipes, 7,843 yd3 (6,000 m3) of concrete, 3.9 mi (6.3 km) of bore holes (number not specified) for trackers
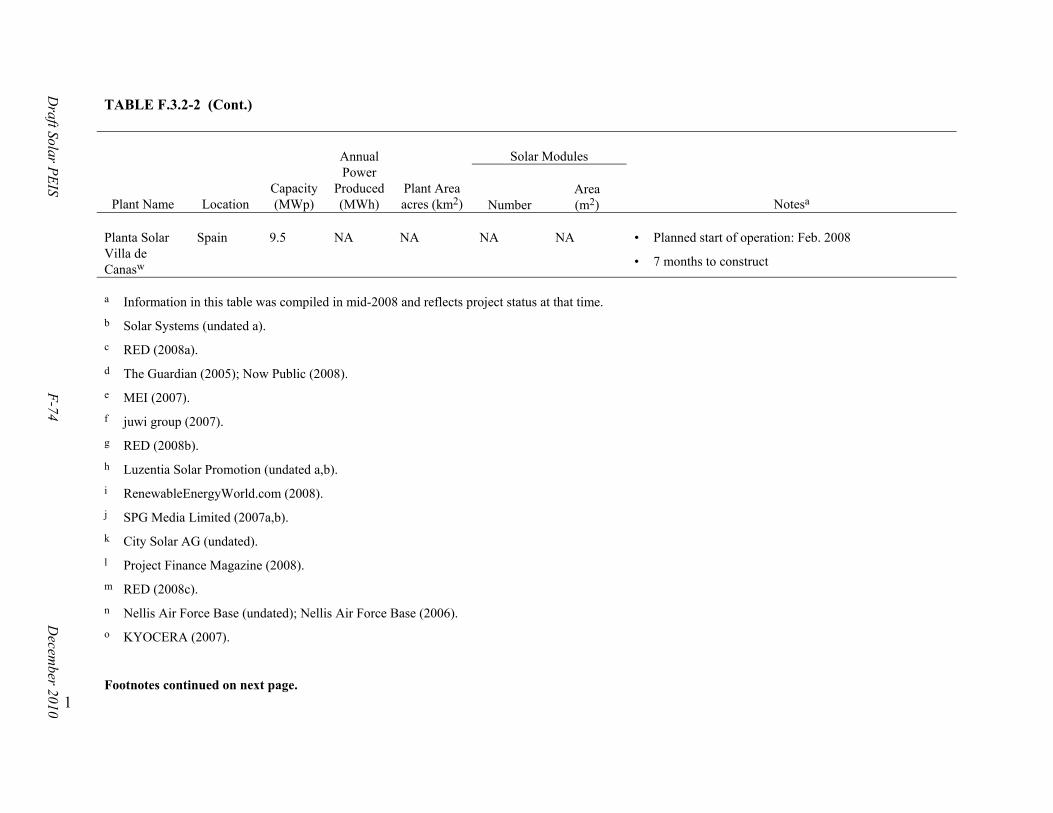
Draft Solar P
EIS
F-74
Decem
ber 2010
TABLE F.3.2-2 (Cont.)
Plant Name
Location
Capacity (MWp)
Annual Power
Produced (MWh)
Plant Area acres (km2)
Solar Modules
Notesa
Number
Area (m2)
Planta Solar Villa de Canasw
Spain 9.5 NA NA NA NA • Planned start of operation: Feb. 2008
• 7 months to construct
a Information in this table was compiled in mid-2008 and reflects project status at that time.
b Solar Systems (undated a).
c RED (2008a).
d The Guardian (2005); Now Public (2008).
e MEI (2007).
f juwi group (2007).
g RED (2008b).
h Luzentia Solar Promotion (undated a,b).
i RenewableEnergyWorld.com (2008).
j SPG Media Limited (2007a,b).
k City Solar AG (undated).
l Project Finance Magazine (2008).
m RED (2008c).
n Nellis Air Force Base (undated); Nellis Air Force Base (2006).
o KYOCERA (2007).
Footnotes continued on next page. 1
Draft Solar P
EIS
F-75
Decem
ber 2010
TABLE F.3.2-2 (Cont.)
p Ecostream (2006).
q Lenardic (2008b).
r The Solarserver (2007).
s Marsden (2007); SPG Media Limited (2008a).
t SPG Media Limited (2008b); PowerLight (2005); The Solarserver (2008).
u Foro-Industrial (2008).
v Professor of ESO (2007); Lenardic (2008b).
w RED (2008a).
Source: Lenardic (2008b).
NA = not available. 1 2

Draft Solar PEIS F-76 December 2010
areas of southern California and is likely representative of utility-scale PV facilities that will be 1 built within the next 20 years. 2 3 Because PV technologies are not thermoelectric facilities and do not require water to 4 support a steam cycle, operators proposing such facilities in California are not required to obtain 5 an AFC from the CEC regardless of nameplate power rating; such facilities are instead required 6 to obtain a conditional use permit (CUP) from the county in which they are located. On July 18, 7 2008, Topaz Solar Farms submitted an application for a CUP (DRC2008-00009) to San Luis 8 Obispo County (Topaz Solar Farms, LLC 2008).85 In April 2009, Optisolar, Inc. merged with 9 First Solar, Inc. and the applicant switched its proposed PV technology to thin-film solar 10 modules manufactured by First Solar. On June 25, 2009, Topaz Solar Farms, LLC submitted a 11 revised CUP application that supersedes the July 18, 2008, application (Topaz Solar Farms, LLC 12 2009).86 Changes to project parameters from the technology shift include reduced water 13 requirements and decreased land area. 14 15 16
F.3.2.5 Hybrid PV Systems 17 18 Various options are available for constructing hybrid facilities involving PV technology. 19 As was shown in Figure F.3.2-1, combining flat-plate PV systems with CPV systems is already 20 being practiced. Likewise, the use of modules composed of different solar materials and different 21 PV flat-plate designs in the same facility is equally feasible. However, while such options may 22 improve overall operability or power-producing capacity, they do nothing to improve the 23 “dispatchability” of the facility’s power and thus do not significantly improve the value of the 24 facility as a utility-scale power source. Because PV technologies do not produce steam, their 25 hybridization with conventional thermoelectric technologies is not easily or efficiently 26 accomplished. While it is possible to co-locate PV solar with conventional thermoelectric 27 generation, except for the physical juxtaposition, there is really no “integration” of the two 28 technologies. Also, because PV is not a thermal-based technology, including TES systems with 29 PV facilities is not feasible. However, PV technologies would be suited for hybridization with 30 energy storage in batteries for delayed delivery to the grid.87 PV could also be adapted to 31 generate alternative energy supplies (e.g., hydrogen through the electrolysis of water). To date, 32 no such PV hybrids have been proposed for utility-scale PV facilities. 33 34 35
36
85 The entire CUP application can be viewed at http://www.slocounty.ca.gov/planning/environmental/
EnvironmentalNotices/optisoloar/Optisolar_App_Submit.htm. Accessed July 14, 2009.
86 The entire revised CUP application can be viewed at http://www.slocounty.ca.gov/planning/ environmental/EnvironmentalNotices/optisoloar/topaz6-09.htm. Accessed December 1, 2009.
87 Although batteries have been used in conjunction with small-scale distributed PV systems (DOE 2008), the technology is not considered viable for utility-scale systems at this time.
Draft Solar PEIS F-77 December 2010
F.3.2.6 Water Demands of Utility-Scale PV Facilities 1 2 PV facilities are fundamentally different in their approach to producing electricity than 3 CSP plants. All CSP plants produce steam to drive a conventional STG and, as a consequence, 4 require substantial amounts of water to condense that steam so that it can be recycled. There are 5 additional miscellaneous water demands associated with the operation of a CSP plant to support 6 activities such as routine washing of reflectors and/or concentrators and various routine plant 7 maintenance and cleaning activities. PV plants have similar water demands for activities such as 8 solar panel washing and routine plant cleaning and maintenance. However, because they do not 9 produce steam, the water demands for PV plants are substantially less than those for CSP plants 10 of equivalent power capacity. 11 12 Although solar cells interact with the sun’s photons of light energy and not its heat, they 13 do nevertheless get hot from their exposure to the sun. Although heat can cause deterioration of a 14 solar cell, reducing its performance and shortening its useful life, most solar cell applications are 15 able to adequately control heat by simple convection cooling of the panels. Recent developments 16 of concentrating devices to increase the effective area of the solar cells have introduced the 17 potential need to install more aggressive heat rejection features. Although there is no expectation 18 that wet closed-loop cooling systems would ever be required, any of the dry or wet/dry cooling 19 hybrids discussed in Sections F.2.4.2.2 and F.2.4.2.3 could be adapted to CPV facilities. Less 20 elaborate variants of those cooling technologies that could provide adequate levels of heat 21 rejection might include forced-air cooling of individual panels or installation of completely 22 closed cooling systems that reject heat by blowing an ambient air stream across a radiator. 23 Such closed systems would be similar to automobile cooling systems and utilize the same 24 glycol-based aqueous coolants. Even so, such closed systems would require only a fraction of 25 the water required by wet closed-loop cooling systems, and the water would need only infrequent 26 replacement to control corrosion of the cooling system’s components. In areas where even 27 this relatively small amount of water would be difficult to obtain, closed cooling systems 28 recirculating organic-based HTFs similar to those used in ORC turbines might also be used. 29 30 31 F.3.3 Engineering Parameters and Resource Requirements for PV Facilities 32 33 To support an environmental impact analysis of utility-scale PV facilities, it is necessary 34 to define representative engineering parameters and resource requirements. This section presents 35 those data for the proposed Topaz Solar Farm facility described in Section F.3.2.4. The data 36 presented were extracted from that facility’s application for a CUP.88 They are considered 37 representative of similarly sized utility-scale PV facilities, although they may not anticipate 38 parameters and requirements for future proposed facilities. 39 40
88 Topaz Solar Farms, LLC, submitted a revised CUP Application in June 2009. The entire revised application
can be viewed at http://www.slocounty.ca.gov/planning/environmental/EnvironmentalNotices/optisoloar/ topaz6-09.htm. Accessed December 1, 2009.
Draft Solar PEIS F-78 December 2010
The critical engineering dimensions and resource needs for the Topaz Solar Farm PV 1 facility include the following (Note: changes to project parameters associated with the revised 2 CUP application are reflected in brackets and italics below): 3 4
• Nominal power capacity: 550 MW total (210 MW Phase 1, 340 MW Phase 2, 5 construction initiated 4 years after Phase 1 completed) 6
7 • Project size: 6,200 acres (25.1 km2) (5,300-acre [21.5-km2] study area; 8
4,200-acre [17-km2] ultimate project perimeter), including four [two] 10-acre 9 (0.041-km2) [6-acre (0.024-km2] temporary material staging areas to support 10 construction, all within facility boundaries 11
12 • Expected project life: 30 years 13
14 • Technology: Thin-film amorphous silicon PV [thin-film PV modules] 15 16 • Solar field 17
12 PV modules/block, 5 acres (0.02 km2)/block, 500 kW(AC)/block 18 Each PV block served by pad-mounted inverter and transformer, 19
20 ft × 10 ft × 8 ft high (6 m × 3 m × 2.4 m) (1,100 devices for the entire 20 facility) 21
Each module 3.28 ft × 1.64 ft (1 m × 0.5 m), 15º tilt, maximum elevation 22 3 ft (0.9 m) above grade 23
Module rows separated by 5 ft (1.5 m) to prevent shading and provide 24 access for maintenance 25
[550 1-MW arrays, consisting of groups of modules called tables] 26 [45 modules per table; 6.5 acres (0.026 km2) per table] 27 [10 tables per MW] 28 [Each table 6 ft × 60 ft (1.83 m × 18.29 m), 1.5 ft (0.46 m) high at front 29
end, 5 ft (1.52 m) high at rear end] 30 [Arrays will be separated by 20-ft (6.1-m) access corridors] 31
32 • Central electrical substation: 5acres (0.020 km2) [6 acres (0.024 km2)], 8-ft 33
(1.5-m) high perimeter fence 34 35
• Two-acre O&M facility (two double-wide trailers) and employee parking 36 37
• Water sources and requirements 38 Sources: on-site wells 39 Requirements, construction phase 40
o Fugitive dust control: 7,200 gal/day (27.2 m3/day), 8.0 ac-ft/yr (9.868 m3/yr) 41 o Concrete manufacturing (temporary on-site batch plant at each of four 42
construction staging areas, 300,000 yd3 [229,500 m3]) total: 12,000 gal/day 43 (45.4 m3/day), 13.4 ac-ft/yr (16,036 m3/yr) 44
o Sanitary uses: 3,750 gal/day (14.2 m3/day), 4.2 ac-ft/yr (5,026 m3/yr) 45
Draft Solar PEIS F-79 December 2010
o Other (initial PV panel washing): 960 gal/day (3.63 m3/day), 1.1 ac-ft/yr 1 (1,316 m3/yr) 2
o Total, construction: 23,910 gal/day (90.5 m3/day), 26.7 ac-ft/yr 3 (31,951 m3/yr) [expected to use 20 ac-ft/yr, a maximum of 43,000 gal/day 4 (163 m3/day)] 5
Requirements, operations phase 6 o Sanitary uses: 160 gal/day (0.61 m3/day), 0.2 ac-ft/yr (247 m3/yr) [less than 7
100 gal/day (0.38 m3/day)] 8 o Panel washing (once/year): 2,900 gal/day (11 m3/day), 3.3 ac-ft/yr 9
(4,070 m3/yr) (requires no water for electricity generation or for cleaning 10 modules) 11
o [35 gal/day (0.13 m3/day) for Solar Energy Learning Center] 12 o Total, operations: 3,060 gal/day (11.58 m3/day), 3.5 ac-ft/yr (4,317 m3/yr) 13
[135 gal/day (0.51 m3/day)] 14 15
• Wastewater: on-site septic system, <1,500 gal/day (5.7 m3/day) during 16 construction, 50 gal/day (0.2 m3/day) [135 gal/day (0.51 m3/day)] during 17 operation 18
19 • Workforce: 20
Construction: 250 [400] workers (daily average over a 3-year construction 21 period) 22
Operation 10 [15] workers (daytime shift only, 24-h security presence) 23 24
• Transportation impacts, 3-year construction period: 25 60 [58] vehicle trips/day for workforce commute 26
o Shuttle buses for workers (10 [18] @ 20 workers each) 27 o 50 [40] individual worker vehicles 28
Deliveries: 85 vehicle trips/day 29 Construction vehicles: 135 [420] will remain on-site throughout 30
construction period, none operated on public roads 31 32
• Transportation impacts, 30-year operation period: 33 8 [13] vehicles/day with 1.5 [approximately 1] workers/car for workforce 34
commute 35 Deliveries, 4 [7] vehicles/day 36
37 38 F.4 TRANSMISSION LINES AND GRID INTERCONNECTIONS 39 40 41 F.4.1 General Information Regarding the Transmission Grid 42 43
This PEIS addresses the potential impacts of the construction and operation of 44 transmission lines to connect solar energy facilities to the main high-voltage electric transmission 45 grid. It is assumed that the maximum distance of transmission line construction required for any 46
Draft Solar PEIS F-80 December 2010
individual solar facility would be 25 mi (40 km). This section provides additional information 1 on the major components of high-voltage transmission lines and the potential environmental 2 impacts associated with their construction and operation. The primary factors influencing the 3 design and performance of transmission lines are also briefly discussed. Site-specific impacts 4 of transmission lines (e.g., impacts on specific species and habitats) are not addressed in 5 this section. 6 7
Information presented here was taken primarily from a Technical Memorandum 8 published by Argonne National Laboratory (Argonne 2007) and from the recently published 9 Final Programmatic Environmental Impact Statement, Designation of Energy Corridors on 10 Federal Land in the 11 Western States (DOE and DOI 2008b). Those documents, both of which 11 are available electronically at http://corridoreis.anl.gov, provide more in-depth information on 12 these topics. 13 14
The North American electric system includes power generation, storage, transmission, 15 and distribution facilities in Canada, United States, and northern Mexico (Baja Norte). The 16 high-voltage transmission grid comprises three main interconnected regions: the Eastern 17 Interconnection, Western Interconnection, and Electric Reliability Council of Texas (ERCOT) 18 Interconnection. The Western Interconnection serves 12 western states (including all six states 19 within the scope of this PEIS), the Canadian provinces of Alberta and British Columbia, and 20 Baja Norte, Mexico. 21 22
Within each interconnection, all electric utilities are interconnected and operate 23 synchronously; that is, the generators are operated such that the peak voltage from all generators 24 occurs simultaneously. Voltage from AC generators varies over time following a sine wave, 25 reaching a peak or a minimum 60 times per second (60 Hz). If all the power contributions from 26 generators were not “in phase,” the voltage from one would cancel some of the voltage from 27 others. Ensuring synchronicity is essential to the transmission grid’s reliability and function. 28 Consequently, each line segment connecting a generating facility to the transmission grid 29 is supported by substations located either at the generator’s facility or at the “point of injection” 30 (or both) that accomplish the necessary power modifications. In addition to ensuring proper 31 phase, transformers are present to adjust voltage to match the grid or to provide for efficient 32 transfer of power to the point of injection. Circuit breakers are present to disconnect the facility 33 should upset conditions occur, and at solar PV facilities inverters are present to convert the direct 34 current produced at the solar panels to alternating current. 35 36 37
F.4.2 Providing for Transmission Grid Reliability and Stability 38 39
The Federal Energy Regulatory Commission (FERC) is the primary federal regulatory 40 authority overseeing electric transmission and is responsible for ensuring the reliability of the 41 electricity transmission grid. To further ensure system reliability, the Energy Policy Act of 2005 42 authorized the creation of an independent, international Electric Reliability Organization (ERO) 43 and directed FERC to establish rules for EROs as well as a process for certification. In 44
Draft Solar PEIS F-81 December 2010
July 2006, FERC approved the North American Electric Reliability Corporation (NERC) as the 1 authorized ERO for the United States.89 2
3 NERC’s mission is to promote reliability of the bulk electricity transmission systems 4
(i.e., electricity transmitted at 100 kV or greater) that serve North America. To achieve that and 5 in collaboration with all segments of the electric power industry, NERC develops and enforces 6 FERC-approved reliability standards; monitors the bulk power system; assesses future adequacy; 7 audits owners, operators, and users for preparedness; and educates and trains industry personnel. 8 Reliability standards provide for the reliable performance of the North American bulk electric 9 systems without causing undue restrictions or adverse impacts on competitive electricity 10 markets.90 To ensure consistency in the manner in which individual generating facilities are 11 granted access to the transmission grid and to ensure that such interconnections do not jeopardize 12 the stability of the grid, FERC has also developed a generator interconnection procedure and 13 published a model interconnection agreement, both required to be used for generating facilities 14 with nameplate ratings greater than 20 MW.91 15 16
NERC is composed of Regional Reliability Councils (RRCs), each responsible for bulk 17 transmission within its assigned geographic area. The transmission grid segments within the six 18 states addressed in this PEIS are under the control of the Western Electricity Coordinating 19 Council (WECC). WECC is authorized to promulgate regional reliability standards (that must be 20 approved by NERC and FERC)92 to develop regional reliability criteria or planning standards 21 that complement the NERC reliability and planning standards, or to establish consistent 22 procedures for ensuring compliance with NERC standards among all WECC transmission 23 system participants. Together, the NERC and WECC reliability standards dictate the design and 24 capabilities of transmission system components, the dimensions and conditions of rights-of-way 25 (ROWs), the configurations and capabilities of switchyards and substations, and the monitoring 26 and operating parameters and controls of transmission line segments and interconnections. 27 28 29 F.4.3 Transmission Line Components 30 31
As discussed above, reliability standards, together with the characteristics and amount of 32 power expected to be delivered, control every aspect of a solar facility’s interconnection to the 33
89 More information on NERC can be found at the NERC Web site, available athttp://www.nerc.com.
90 Currently, there are 94 FERC standards and 185 NERC standards addressing reliability of all facets of bulk electricity transmission, including design, planning, operations, infrastructure and cyber security, communication, coordination, and operational safety. All NERC reliability standards can be accessed electronically at http://www.nerc.com/files/Reliability_Standards_Complete_Set_2009Feb25.pdf.
91 Both the interconnection procedure and agreement can be found at the FERC Web site, available at http://www.ferc.gov/industries/electric/indus-act/gi/stnd-gen.asp). See also, FERC Order No. 2003, issued March 5, 2004, available electronically at http://www.ferc.gov/industries/electric/indus-act/gi/stnd-gen/order2003-a.pdf.
92 As of January 2009, FERC has approved eight WECC reliability standards, which can be accessed electronically at http://www.ferc.gov/industries/electric/indus-act/reliability/WEC-standards.asp.
Draft Solar PEIS F-82 December 2010
grid, from the type and size of the electrical devices and controls required at substations, to the 1 design, configuration, and dimensions of line components, to the width of the ROW and the 2 manner in which it is maintained. The more critical components of interconnections are 3 discussed below. 4 5 6
F.4.3.1 Tower Specifications and Construction 7 8 The towers support the conductors and provide physical and electrical isolation for 9 energized lines. Voltage; the type, number, weight, and size of conductors (wires) to be 10 supported (typically, three conductors for each circuit present); as well as the safe separation 11 distances that must be maintained among energized conductors, towers, and ground obstructions 12 to prevent faulting, combine to dictate tower specifications with respect to size, geometry, 13 construction materials, and tower spacing. ROW circumstantial factors such as ground slope, 14 surface and subsurface conditions, wind loading, and weather extremes such as snow and ice 15 can impose additional requirements on the specifications of towers, their spacing, and their 16 foundation requirements. At 500 kV, the material of construction is generally steel, although 17 aluminum and hybrid construction, which uses both steel and aluminum, have also been used.93 18 The weight of the tower varies substantially with height, duty (e.g., straight run or change in 19 direction, river crossing), material, number of circuits, and geometry, and can range from 20 8,500 to 235,000 lb (3,856 to 106,594 kg). The basic function of the tower is to isolate 21 conductors from their surroundings, including controlling the extent of their sag and slope over 22 the expected operating temperature range. Clearances are specified for phase-to-tower, phase-to-23 ground, and phase-to-phase. For example, phase-to-tower clearance for 500 kV ranges from 24 about 10 to 17 ft (3 to 5 m), with 13 ft (4 m) being the most common specification. These 25 distances are maintained by insulator strings and must take into account possible swaying of the 26 conductors. The typical phase-to-ground clearance is 30 to 40 ft (9 to 12 m). This clearance is 27 maintained by setting the tower height, controlling the line temperature to limit sag, and 28 controlling vegetation and structures in the ROW. Typical phase-to-phase separation is also 29 30 to 40 ft (9 to 12 m) and is controlled by tower geometry and line motion suppression.94 30 31 Myriad designs exist for towers, all of which can be placed into one of two general 32 categories: lattice type or monopole. Regardless of their appearance, towers must safely support 33 energized conductors. The voltages at which the conductors are maintained dictate the clearances 34 that must be maintained between each conductor and other conductors, the tower, and ground 35
93 Solar facilities with capacities in the hundreds of megawatts (as is the case with the majority of existing and
proposed facilities) could be served by a transmission interconnection operating at substantially less voltage (even as low as 40 kV or 69 kV), and it is likely that solar facility interconnections will operate at such lower voltages. The discussion references requirements and dimensions for a 500-kV line (the highest voltage of any existing segment within the six-state study area) as a way of demonstrating a worst-case condition that could exist for a transmission line interconnection.
94 Other factors critical to tower and transmission line performance, such as insulator design, lightning protection, and conductor motion suppression, do not introduce additional environmental impact factors and are not discussed here.
Draft Solar PEIS F-83 December 2010
obstructions. Those clearances dictate the physical dimensions of the towers and the necessary 1 minimum dimensions of the operating ROW. 2 3
Tower erection involves clearing the construction area (typically as much as 80,000 ft2 4 [7,432 m2] and an adjacent tower assembly area (100 by 200 ft [30 by 61 m]) of vegetation. 5 Creating level ground for lifting equipment is required. In general, construction ROW widths can 6 be as much as twice the ROW width needed for safe operation. Excavation, concrete pouring, 7 and pile driving are required to establish foundations, some of which can extend as deep as 40 ft 8 (12 m). Each foundation may require as much as 10 yd3 (8 m3) of reinforced concrete. In most 9 instances, ready-mixed concrete is delivered to the site by commercial vendors; however, at 10 particularly remote or rugged sites, special tactics may be employed such as delivery of the 11 concrete by helicopter or creation of a temporary concrete batch plant near the ROW. Monopole 12 towers utilize a single reinforced-concrete foundation, formed either as a solid cylinder or in the 13 shape of a donut. Lattice-type towers require somewhat less substantial foundations for each of 14 their four legs. 15 16 Towers can reach to heights of 150 ft (46 m) and widths of 75 ft (23 m). To ensure 17 adequate clearances of conductors to ground interferences, operating ROW widths could 18 approximate twice the width of the tower. Tower spacing on level ground without special 19 concerns for wind or ice loading on power cables would be 1,000 to 1,200 ft (305 to 366 m) for 20 lattice towers and 800 ft (244 m) for monopole towers. Radical changes in grade (e.g., crossing 21 a deep valley or hilly terrain) or anticipated wind and ice can greatly reduce tower spacing or 22 require the installation of exceptionally tall towers to maintain acceptable slope of the conductors 23 between towers or clearances of conductors to ground. 24 25
Tower erection also involves the creation of access roads with specifications (grade, 26 turning radius, width, and weight limits) sufficient to handle large, heavy tower components, 27 earthmoving equipment, tower erection equipment, and maintenance equipment. Laydown areas 28 would also be created for temporary storage of tower components (typically 3 acres [0.01 km2] 29 in size and roughly every 10 mi [16 km] along the ROW). Tower construction can result in the 30 loss of some vegetation, increased potential for wind- and water-induced soil erosion, impacts 31 on surface waters from increased sediment loads, and possible impacts on groundwater from 32 exceptionally deep foundation excavations. Most tower construction-related impacts are of short 33 duration, however, and best management practices have been developed to minimize, if not 34 completely mitigate, most impacts. Additional ROWs established for construction are typically 35 returned to their natural state once construction is complete. 36 37 38
F.4.3.2 Conductor Specification and Installation 39 40
Transmitting electrical power over a long distance is not an efficient proposition. Even 41 materials considered excellent conductors of electrical current offer some resistance to current 42 flow. Resistance is typically manifested as heat.95 Power losses as high as 10% can result. 43 95 Some power is also lost due to corona discharge, the ionization of oxygen molecules in the ambient air
surrounding a high-voltage conductor.
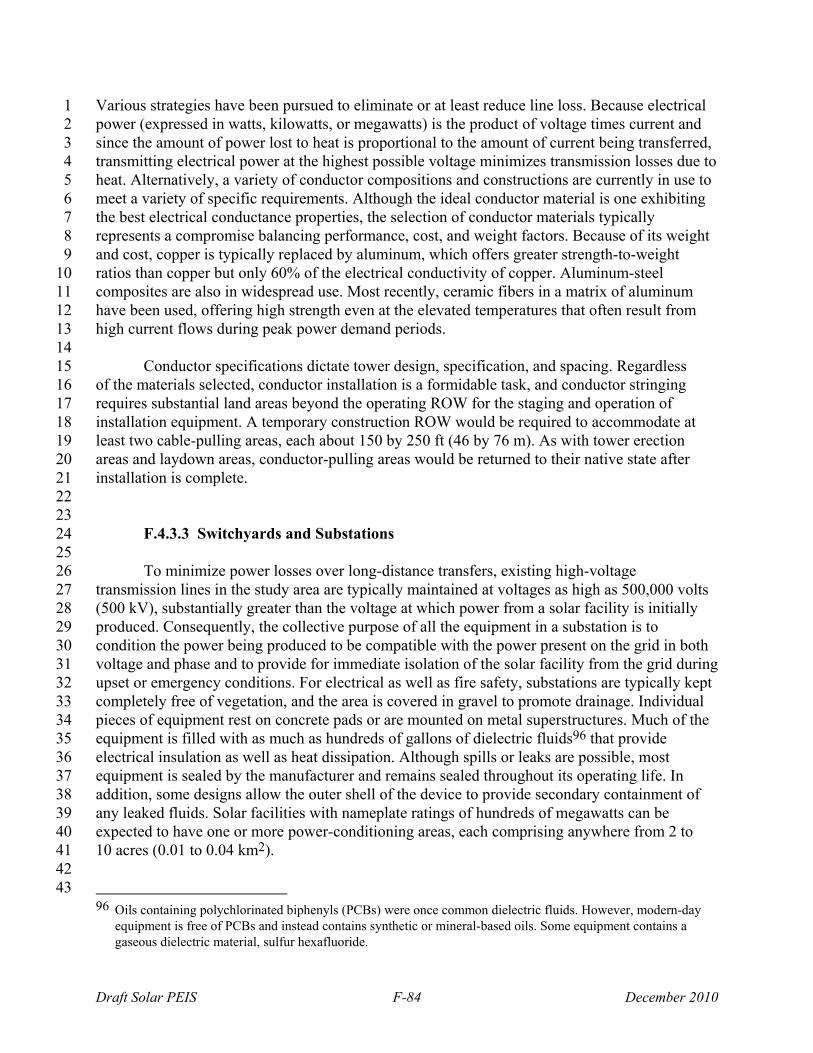
Draft Solar PEIS F-84 December 2010
Various strategies have been pursued to eliminate or at least reduce line loss. Because electrical 1 power (expressed in watts, kilowatts, or megawatts) is the product of voltage times current and 2 since the amount of power lost to heat is proportional to the amount of current being transferred, 3 transmitting electrical power at the highest possible voltage minimizes transmission losses due to 4 heat. Alternatively, a variety of conductor compositions and constructions are currently in use to 5 meet a variety of specific requirements. Although the ideal conductor material is one exhibiting 6 the best electrical conductance properties, the selection of conductor materials typically 7 represents a compromise balancing performance, cost, and weight factors. Because of its weight 8 and cost, copper is typically replaced by aluminum, which offers greater strength-to-weight 9 ratios than copper but only 60% of the electrical conductivity of copper. Aluminum-steel 10 composites are also in widespread use. Most recently, ceramic fibers in a matrix of aluminum 11 have been used, offering high strength even at the elevated temperatures that often result from 12 high current flows during peak power demand periods. 13 14
Conductor specifications dictate tower design, specification, and spacing. Regardless 15 of the materials selected, conductor installation is a formidable task, and conductor stringing 16 requires substantial land areas beyond the operating ROW for the staging and operation of 17 installation equipment. A temporary construction ROW would be required to accommodate at 18 least two cable-pulling areas, each about 150 by 250 ft (46 by 76 m). As with tower erection 19 areas and laydown areas, conductor-pulling areas would be returned to their native state after 20 installation is complete. 21 22 23
F.4.3.3 Switchyards and Substations 24 25
To minimize power losses over long-distance transfers, existing high-voltage 26 transmission lines in the study area are typically maintained at voltages as high as 500,000 volts 27 (500 kV), substantially greater than the voltage at which power from a solar facility is initially 28 produced. Consequently, the collective purpose of all the equipment in a substation is to 29 condition the power being produced to be compatible with the power present on the grid in both 30 voltage and phase and to provide for immediate isolation of the solar facility from the grid during 31 upset or emergency conditions. For electrical as well as fire safety, substations are typically kept 32 completely free of vegetation, and the area is covered in gravel to promote drainage. Individual 33 pieces of equipment rest on concrete pads or are mounted on metal superstructures. Much of the 34 equipment is filled with as much as hundreds of gallons of dielectric fluids96 that provide 35 electrical insulation as well as heat dissipation. Although spills or leaks are possible, most 36 equipment is sealed by the manufacturer and remains sealed throughout its operating life. In 37 addition, some designs allow the outer shell of the device to provide secondary containment of 38 any leaked fluids. Solar facilities with nameplate ratings of hundreds of megawatts can be 39 expected to have one or more power-conditioning areas, each comprising anywhere from 2 to 40 10 acres (0.01 to 0.04 km2). 41 42
43 96 Oils containing polychlorinated biphenyls (PCBs) were once common dielectric fluids. However, modern-day
equipment is free of PCBs and instead contains synthetic or mineral-based oils. Some equipment contains a gaseous dielectric material, sulfur hexafluoride.
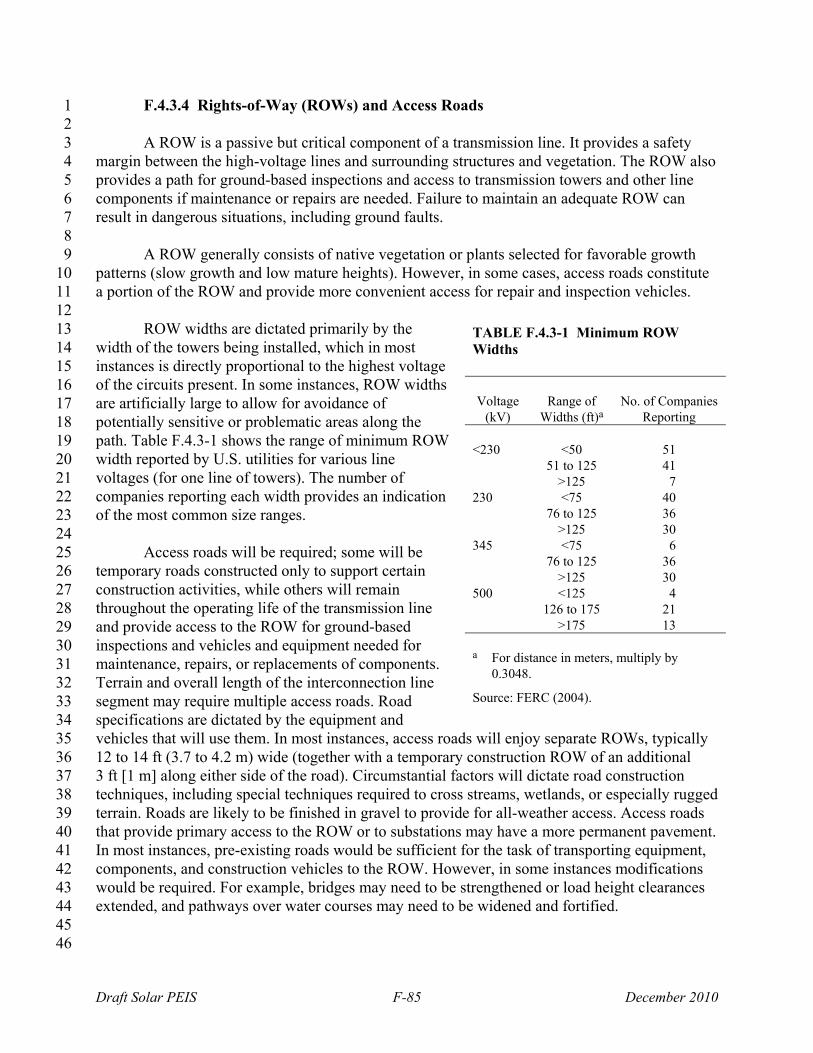
Draft Solar PEIS F-85 December 2010
F.4.3.4 Rights-of-Way (ROWs) and Access Roads 1 2
A ROW is a passive but critical component of a transmission line. It provides a safety 3 margin between the high-voltage lines and surrounding structures and vegetation. The ROW also 4 provides a path for ground-based inspections and access to transmission towers and other line 5 components if maintenance or repairs are needed. Failure to maintain an adequate ROW can 6 result in dangerous situations, including ground faults. 7 8
A ROW generally consists of native vegetation or plants selected for favorable growth 9 patterns (slow growth and low mature heights). However, in some cases, access roads constitute 10 a portion of the ROW and provide more convenient access for repair and inspection vehicles. 11 12
ROW widths are dictated primarily by the 13 width of the towers being installed, which in most 14 instances is directly proportional to the highest voltage 15 of the circuits present. In some instances, ROW widths 16 are artificially large to allow for avoidance of 17 potentially sensitive or problematic areas along the 18 path. Table F.4.3-1 shows the range of minimum ROW 19 width reported by U.S. utilities for various line 20 voltages (for one line of towers). The number of 21 companies reporting each width provides an indication 22 of the most common size ranges. 23 24 Access roads will be required; some will be 25 temporary roads constructed only to support certain 26 construction activities, while others will remain 27 throughout the operating life of the transmission line 28 and provide access to the ROW for ground-based 29 inspections and vehicles and equipment needed for 30 maintenance, repairs, or replacements of components. 31 Terrain and overall length of the interconnection line 32 segment may require multiple access roads. Road 33 specifications are dictated by the equipment and 34 vehicles that will use them. In most instances, access roads will enjoy separate ROWs, typically 35 12 to 14 ft (3.7 to 4.2 m) wide (together with a temporary construction ROW of an additional 36 3 ft [1 m] along either side of the road). Circumstantial factors will dictate road construction 37 techniques, including special techniques required to cross streams, wetlands, or especially rugged 38 terrain. Roads are likely to be finished in gravel to provide for all-weather access. Access roads 39 that provide primary access to the ROW or to substations may have a more permanent pavement. 40 In most instances, pre-existing roads would be sufficient for the task of transporting equipment, 41 components, and construction vehicles to the ROW. However, in some instances modifications 42 would be required. For example, bridges may need to be strengthened or load height clearances 43 extended, and pathways over water courses may need to be widened and fortified. 44 45 46
TABLE F.4.3-1 Minimum ROW Widths
Voltage
(kV)
Range of
Widths (ft)a No. of Companies
Reporting <230 <50 51 51 to 125 41 >125 7 230 <75 40 76 to 125 36 >125 30 345 <75 6 76 to 125 36 >125 30 500 <125 4 126 to 175 21 >175 13 a For distance in meters, multiply by
0.3048.
Source: FERC (2004).
Draft Solar PEIS F-86 December 2010
F.4.3.5 Additional Structures 1 2 For some long-distance transmission line construction projects, additional facilities such 3 as maintenance or repair facilities, material storage areas, administrative buildings, and 4 operational control centers would also be constructed. However, it is not likely that any such 5 facilities would be necessary for the grid interconnection segments being discussed here, and if 6 they are, they would likely be the responsibility of the transmission system operator and not the 7 solar facility operator.97 It is more likely that at some point along its route, the transmission 8 interconnection segment from a solar facility would share the ROW with a similar segment from 9 another solar facility. Multiple, independent transmission lines sharing a ROW create some 10 unique issues associated both with construction and with operation. Designs would be amended 11 to provide adequate spacing between lines to prevent interferences or emergencies on one line 12 from cascading to the second line. Agreements would be required among the parties involved to 13 establish liability limits and assign responsibility for each aspect of ROW maintenance. 14 Coordination of construction- and operation-related activities would also be addressed to prevent 15 adverse impacts on safe operation of either line. 16 17 18
F.4.3.6 Hazardous Materials and Wastes 19 20
The hazardous materials used during construction of transmission lines consist primarily 21 of fluids (lubricating oils, hydraulic fluids, glycol-based coolants, and battery electrolytes) 22 needed to perform primary maintenance on construction vehicles and equipment. Most such 23 materials would be present in portable containers of 55-gal (208-L) capacity or less. Some 24 equipment cannot be easily moved (e.g., exceptionally large lifting cranes that are transported in 25 pieces and assembled on-site, or bulldozers used for initial clearing), which may require the 26 establishment of temporary fueling facilities consisting of portable aboveground tanks holding 27 diesel fuel and/or gasoline. 28 29
Compressed gas cylinders of welding and cutting gases such as oxygen and acetylene 30 and modest amounts of cleaning solvents, paints, and corrosion control coatings would also 31 be present. Portable sanitary facilities would also be brought to the construction site. Finally, 32 pesticides used for initial clearing of construction areas, and later in the ongoing maintenance of 33 the ROW, may be present. At associated substations, much of the electrical equipment would be 34 filled with dielectric fluids or gases. However, except in the case of major malfunctions that 35 result in arcing or leaks, these dielectric materials would not be expected to require replacement, 36 and no waste dielectrics typically result from routine operation. At the decommissioning of the 37 97 The best solar resources are concentrated in relatively small geographic areas; some of these areas, however, are
remote and devoid of existing high-voltage transmission line infrastructure. Nevertheless, for the purpose of this discussion, it is assumed that interconnection transmission line segments would be no more than 25 mi (40 km) in length. This assumption is supported by the existence of state initiatives, such as the Renewable Energy Transmission Initiative (RETI) in California, that seek to facilitate development of renewable energy resources in remote areas by establishing the necessary transmission infrastructure in those areas. Additional details on RETI can be found on the California Energy Commission’s Web site at http://www.energy.ca.gov/reti/ documents/index.html. It is further expected that similar initiatives may be pursued in other states within the study area where concentrations of renewable resources exist.
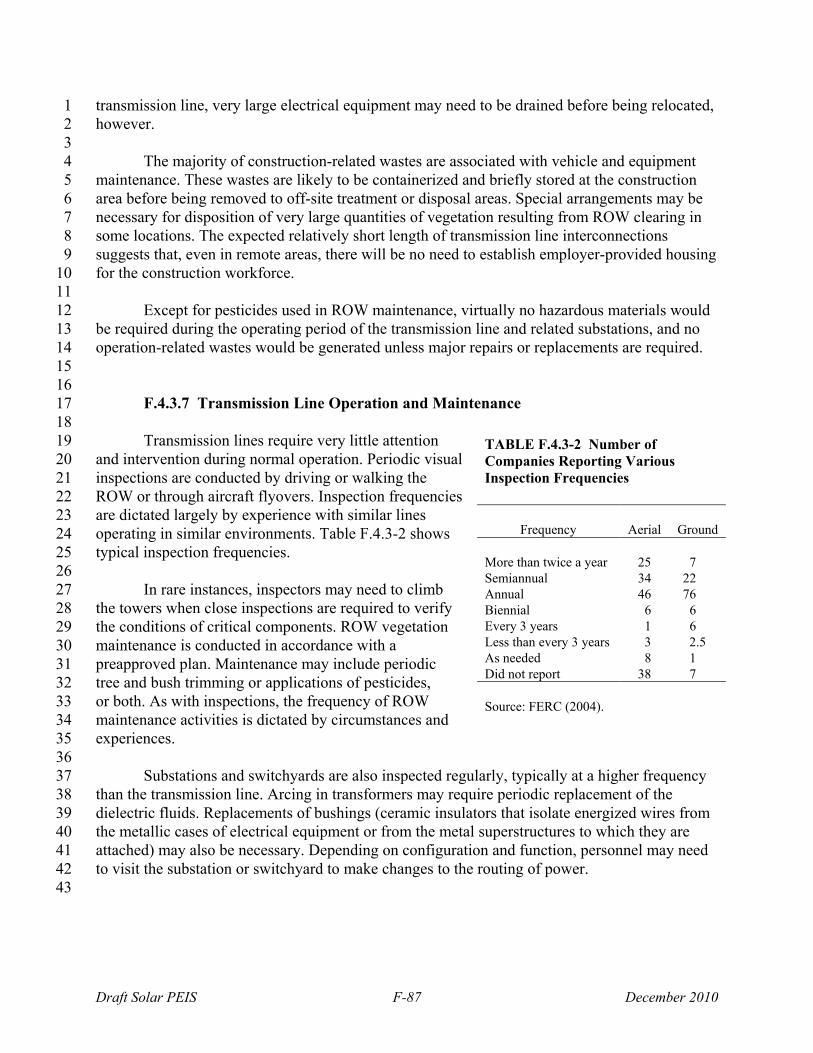
Draft Solar PEIS F-87 December 2010
transmission line, very large electrical equipment may need to be drained before being relocated, 1 however. 2 3
The majority of construction-related wastes are associated with vehicle and equipment 4 maintenance. These wastes are likely to be containerized and briefly stored at the construction 5 area before being removed to off-site treatment or disposal areas. Special arrangements may be 6 necessary for disposition of very large quantities of vegetation resulting from ROW clearing in 7 some locations. The expected relatively short length of transmission line interconnections 8 suggests that, even in remote areas, there will be no need to establish employer-provided housing 9 for the construction workforce. 10 11
Except for pesticides used in ROW maintenance, virtually no hazardous materials would 12 be required during the operating period of the transmission line and related substations, and no 13 operation-related wastes would be generated unless major repairs or replacements are required. 14 15 16
F.4.3.7 Transmission Line Operation and Maintenance 17 18
Transmission lines require very little attention 19 and intervention during normal operation. Periodic visual 20 inspections are conducted by driving or walking the 21 ROW or through aircraft flyovers. Inspection frequencies 22 are dictated largely by experience with similar lines 23 operating in similar environments. Table F.4.3-2 shows 24 typical inspection frequencies. 25 26
In rare instances, inspectors may need to climb 27 the towers when close inspections are required to verify 28 the conditions of critical components. ROW vegetation 29 maintenance is conducted in accordance with a 30 preapproved plan. Maintenance may include periodic 31 tree and bush trimming or applications of pesticides, 32 or both. As with inspections, the frequency of ROW 33 maintenance activities is dictated by circumstances and 34 experiences. 35 36
Substations and switchyards are also inspected regularly, typically at a higher frequency 37 than the transmission line. Arcing in transformers may require periodic replacement of the 38 dielectric fluids. Replacements of bushings (ceramic insulators that isolate energized wires from 39 the metallic cases of electrical equipment or from the metal superstructures to which they are 40 attached) may also be necessary. Depending on configuration and function, personnel may need 41 to visit the substation or switchyard to make changes to the routing of power. 42 43
TABLE F.4.3-2 Number of Companies Reporting Various Inspection Frequencies
Frequency Aerial Ground
More than twice a year 25 7 Semiannual 34 22 Annual 46 76 Biennial 6 6 Every 3 years 1 6 Less than every 3 years 3 2.5 As needed 8 1 Did not report 38 7 Source: FERC (2004).
Draft Solar PEIS F-88 December 2010
During the expected operating lifetime of a transmission line, voltage upgrades, 1 introductions of additional circuits or “double circuits,”98 repairs, or replacements of conductor 2 segments or insulators may all require the reintroduction of heavy equipment of the type used 3 for initial construction. Depending on where such activity occurs, original construction access 4 roads and clearings that were remediated after completion of construction may need to be 5 re-established (together with the necessary amendments to the ROW lease). The impacts of 6 such repairs, upgrades, or refurbishments would be similar to those incurred during initial 7 construction. Likewise, upgrades may also involve replacements of equipment at substations 8 or switchyards. 9 10 11
F.4.3.8 Transmission Line Decommissioning 12 13
The expected lifetime of a transmission line is indefinite. It is more likely that the line 14 will undergo upgrades (including replacements of conductors or towers, or both) or the 15 introduction of additional circuits than be abandoned. However, in the event a transmission line 16 segment is abandoned, decommissioning would involve removal of all permanent structures. On 17 the other hand, subsurface foundations may be allowed to remain if their removal would create 18 more disruption than their retention. Virtually all major components, towers, and conductors are 19 likely to remain serviceable and could be reconditioned for similar application on another 20 transmission line segment. Equipment at substations or switchyards is also likely to be 21 appropriate for reinstallation in other parts of the transmission grid or have recycling options. 22 Some large pieces of equipment may need to be drained of their dielectric fluids before removal 23 and transport. Failing that, recycling options would likely exist for all major components. In 24 most areas of the ROW, remediation involves simply allowing native vegetation to re-establish 25 itself. Where all-weather access roads have been removed or where decommissioning activities 26 have resulted in bare soil, fast-growing, noninvasive species may be planted to provide interim 27 erosion control until native vegetation can be re-established. 28 29 30
31
98 Rather than the addition of a new, independent circuit, a double circuit may be installed. New conductors having
electrical continuity with existing conductors would be installed adjacent to those conductors. This doubling of conductors allows for the transfer of the same or even greater amounts of current without causing any of the conductors to exceed their thermal limits. Double circuits are often installed when the existing circuit is at its current carrying capacity (i.e., at the thermal limits of the conductors); the circuit’s capacity, however, may still be insufficient to meet forecasted peak load demands.
Draft Solar PEIS F-89 December 2010
F.5 REFERENCES 1 2 Note to Reader: This list of references identifies Web pages and associated URLs where 3 reference data were obtained for the analyses presented in this PEIS. It is likely that at the time 4 of publication of this PEIS, some of these Web pages may no longer be available or their URL 5 addresses may have changed. The original information has been retained and is available through 6 the Public Information Docket for this PEIS. 7 8 Acciona SA, 2008, ACCIONA’s Nevada Solar One™—Demonstrating the Commercial 9 Competitiveness of Solar Energy. Available at http://www.nevadasolarone.net/the-plant. 10 Accessed Sept. 25, 2008. 11 12 Argonne (Argonne National Laboratory), 2007, The Design, Construction, and Operation of 13 Long-Distance High-Voltage Electricity Transmission Technologies, ANL/EVS/TM/08-4. 14 Available at http://corridoreis.anl.gov/documents/index.cfm. Accessed March 9, 2009. 15 16 Beacon Solar, LLC, 2008, “Application for Certification, Beacon Solar Energy Project,” 17 submitted to the California Energy Commission, March. Available at http://www.energy.ca.gov/ 18 sitingcases/beacon/documents/index.html. Accessed Dec. 8, 2008. 19 20 BrightSource Energy, Inc., 2007, “Application for Certification Seeking Four Separate 21 Certifications to Construct and Operate Ivanpah-1, Ivanpah-2, Ivanpah-3, and Their Shared 22 Facilities,” submitted to the California Energy Commission, Aug. 28. Available at 23 http://www.energy.ca.gov/sitingcases/ivanpah/documents/index.html. Accessed Nov. 14, 2008. 24 25 Carrizo Energy, LLC, 2007, “Application for Certification, Carrizo Energy Solar Farm,” 26 submitted to the California Energy Commission, October. Available at http://www.energy. 27 ca.gov/sitingcases/carrizo/documents/index.html. Accessed July 15, 2008. 28 29 CEC (California Energy Commission), 2002, Comparison of Alternate Cooling Technologies 30 for California Power Plants: Economic, Environmental and Other Tradeoffs, Public Interest 31 Energy Research (PIER) Report, Consultant Report 500-02-079F, February. Available at 32 http://www.energy.ca.gov/reports/2002-07-09_500-02-079F.PDF. Accessed June 17, 2008. 33 34 CEC, 2009a, Final Staff Assessment, Beacon Solar Energy Project Application for Certification. 35 August. Available at http://www.energy.ca.gov/sitingcases/beacon/documents/index.html. 36 Accessed November 20, 2009. 37 38 CEC, 2009b, Final Staff Assessment and Draft Environmental Impact Statement and Draft 39 California Desert Conservation Area Plan Amendment, Ivanpah Solar Electric Generating 40 System Application for Certification. October. Available at http://www.energy.ca.gov/ 41 2008publications/CEC-700-2008-013/FSA. Accessed November 20, 2009. 42 43 CEC, 2010, Final Staff Assessment Addendum for the Ivanpah Solar Electric Generating System. 44 Available at http://www.energy.ca.gov/2008publications/CEC-700-2008-013/CEC-700-2008-45 013-FSA-AD.PDF. Accessed June 29, 2010. 46
47
Draft Solar PEIS F-90 December 2010
City Solar AG, undated, Solar Park of the Superlative. Available at http://www.city-solar-1 ag.com/index.php?id=191. Accessed July 15, 2008. 2 3 Dahle, D., et al., 2008, Assessing the Potential for Renewable Energy Development on DOE 4 Legacy Management Lands, DOE/GO 102008-2435, U.S. Department of Energy, National 5 Renewable Energy Laboratory, Golden, Colo. Available at http://www.nrel.gov/docs/fy08osti/ 6 41673.pdf. Accessed June 19, 2008. 7 8 DOE (U.S. Department of Energy), 2008, PV Systems with Battery Storage, Energy Efficiency 9 and Renewable Energy (EERE) Solar Energy Technologies Program, Jan. 5. Available at 10 http://www1.eere.energy.gov/solar/pv_batteries.html. Accessed June 21, 2008. 11 12 DOE and DOI (U.S. Department of the Interior), 2008, Final Programmatic Environmental 13 Impact Statement, Designation of Energy Corridors on Federal Land in the 11 Western States, 14 DOE/EIS-0386, Nov. Available at http://corridoreis.anl.gov/eis/guide/index.cfm. Accessed 15 March 9, 2009. 16 17 DOE, 2009, Concentrating Solar Power Commercial Application Study: Reducing Water 18 Consumption of Concentrating Solar Power Electricity Generation, Report to Congress, Jan. 13. 19 20 Eck, M., and W.-D. Steinmann, 2002, “Direct Steam Generation in Parabolic Troughs: First 21 Results of the DISS Project,” Transactions of the ASME, Journal of Solar Energy Engineering 22 124:134–139, May. Available at http://scitation.aip.org/getpdf/servlet/GetPDFServlet?filetype= 23 pdf&id=JSEEDO000124000002000134000001&idtype=cvips&prog=normal. Accessed 24 June 16, 2008. 25 26 Ecostream, 2006, Globasol PV-system, Murcia, July 18. Available at http://www.ecostream.es/ 27 index.php?option=com_content&task=view&id=793&Itemid=2908&lang=en. Accessed 28 June 30, 2008. 29 30 Edwards, J.G., 2006, “Taking a Turn for ‘Green’—Some 75 Kilowatts of Solar Power Added,” 31 Las Vegas Review-Journal, April 14. Available at http://www.reviewjournal.com/lvrj_home/ 32 2006/Apr-14-Fri-2006/business/6860405.html. Accessed July 18, 2008. 33 34 EPRI (Electric Power Research Institute), 2004a, Comparison of Alternate Cooling 35 Technologies for U.S. Power Plants, Economic, Environmental and Other Tradeoffs, 36 Technical Report 1005358, August. Available at http://www.epriweb.com/public/ 37 000000000001005358.pdf. Accessed July 16, 2008. 38 39 EPRI, 2004b, The Formation and Fate of Trihalomethanes in Power Plant Cooling Water 40 Systems, consultant report prepared for the California Energy Commission, Public Interest 41 Energy Research Program, Palo Alto, Calif. Available at http://www.energy.ca.gov/reports/ 42 2004-05-26_500-04-035.PDF. Accessed July 15, 2008. 43 44
Draft Solar PEIS F-91 December 2010
FERC (Federal Energy Regulatory Commission), 2004, Utility Vegetation Management and Bulk 1 Electric Reliability Report from the Federal Energy Regulatory Commission, Washington, D.C., 2 Sept. 7. 3 4 Foro-Industrial.com, 2008, Elecnor: Park Solar Zuera – Zaragoza, Aragon, March 27. Available 5 at http://translate.google.com/translate?hl=en&sl=es&u=http://www.foro-industrial.com/2008/ 6 03/elecnor-parque-solar-de-zuera-zaragoza-aragon/&sa=X&oi=translate&resnum=1&ct= 7 result&prev=/search%3Fq%3Dzuera%2Belecnor%26hl%3Den%26client%3Dfirefox-a%26rls% 8 3Dorg.mozilla:en-US:official%26sa%3DG. Accessed July 1, 2008. 9 10 Goetzberger, A., and V.U. Hoffmann, 2005, Photovoltaic Solar Energy Generation, Springer 11 Series in Optical Sciences, Springer-Verlag, Berlin. 12 13 Inland Energy, Inc., 2007, “Application for Certification, Victorville 2 Hybrid Power Project,” 14 submitted on behalf of the City of Victorville to the California Energy Commission, Feb. 15 Available at http://www.energy.ca.gov/sitingcases/victorville2/documents/applicant/afc/. 16 Accessed July 21, 2008. 17 18 juwi group, 2007, World’s Largest Solar Power Plant Being Built in Eastern Germany, Feb. 19 Available at http://international.juwi.de/information/press/PR_Solar_Power_Plant_ 20 Brandis_2007_02_eng.pdf. Accessed June 14, 2008. 21 22 Kearney, D., et al., 2004, “Engineering Aspects of a Molten Salt Heat Transfer Fluid in a Trough 23 Solar Field,” Energy 29:861–870. Available at http://www.sciencedirect.com. Accessed July 2, 24 2008. 25 26 Kelly, B., 2006a, Nexant Parabolic Trough Solar Power Plant Systems Analysis Task 1: 27 Preferred Plant Size January 20, 2005–December 31, 2005, NREL/SR-550-40162, 28 San Francisco, Calif., July. Available at http://www.nrel.gov/docs/fy06osti/40162.pdf. Accessed 29 July 16, 2008. 30 31 Kelly, B., 2006b, Nexant Parabolic Trough Solar Power Plant Systems Analysis, Task 2: 32 Comparison of Wet and Dry Rankine Cycle Heat Rejection, January 20, 2005–December 31, 33 2005, NREL/SR-550-40163, San Francisco, Calif., July. Available at http://www.nrel.gov/ 34 csp/troughnet/pdfs/40163.pdf. Accessed July 29, 2008. 35 36 Kinsey, G.S., et al., 2006, “Multijunction Solar Cells for Dense-Array Concentrators,” 37 Conference Record of the 2006 IEEE 4th World Conference on Photovoltaic Energy Conversion, 38 1:625–627, May. Available at http://ieeexplore.ieee.org/iel5/4059527/4059528/04059705. 39 pdf?isnumber=4059528&prod=CNF&arnumber=4059705&arSt=625&ared=627&arAuthor= 40 Geoffrey+S.+Kinsey%3B+Raed+A.+Sherif%3B+Hector+L.+Cotal%3B+Peichen+Pien%3B+ 41 Richard+R.+King%3B+Randolph+J.+Brandt%3B+William+G.+Wise%3B+Eduardo+L.+ 42 Labios%3B+Kam+F.+Wan%3B+Moran+Haddad%3B+Jonathon+M.+Lacey%3B+Christopher+43 M.+Fetzer%3B+Pierre+Verlinden%3B+John+Lasich%3B+Nasser+H.+Karam. Accessed 44 July 8, 2008. 45 46
Draft Solar PEIS F-92 December 2010
Kutscher, C., et al., 2006, Hybrid Wet/Dry Cooling for Power Plants, Parabolic Trough 1 Workshop, Incline Village, Nev., NREL/PR-550-40026, U.S. Department of Energy, National 2 Renewable Energy Laboratory, Golden, Colo., Feb. 14. Available at http://www.nrel.gov/ 3 docs/fy06osti/40026.pdf. Accessed June 19, 2008. 4 5 KYOCERA, 2007, Kyocera PV Modules Power 13.8.-Megawatt Solar Electric Plant in 6 Salamanca, Spain, Sept. 12. Available at http://global.kyocera.com/news/2007/0901.html. 7 Accessed June 30, 2008. 8 9 Lenardic, D., 2008a, Large-Scale Photovoltaic Power Plants, pvresources.com Annual 10 Report 2007, Revised Edition, April. Available at http://www.pvresources.com/download/ 11 AnnualReport2007.pdf. Accessed June 22, 2008. 12 13 Lenardic, D., 2008b, Large-scale Photovoltaic Power Plants, Range 1-50, updated May 5. 14 Available at http://www.pvresources.com/en/top50pv.php. Accessed June 24, 2008. 15 16 Luzentia Solar Promotion, undated a, Developments—La Hoya de los Vicentes. Available at 17 http://www.luzentia.es/en/Promociones/. Accessed July 14, 2008. 18 19 Luzentia Solar Promotion, undated b, La Hoya de los Vicentes—Site. Available at 20 http://www.luzentia.es/en/Promociones/Hoya_Vicentes/Localizacion.asp. Accessed 21 July 14, 2008. 22 23 Mancini, T.R., 1997, Solar-Electric Dish Stirling System Development, Sandia National 24 Laboratory, Albuquerque, N.M., Dec. 1. Available at http://www.osti.gov/bridge/servlets/purl/ 25 622476-XoKR4o/webviewable/. 26 27 Marsden, A., 2007, “Serpa Solar Photovoltaic Plant, Portugal,” European Sustainable Energy 28 Review 1(1):34–38. Available at http://www.geenergyfinancialservices.com/press_room/ 29 press_releases/eser107_34-38.pdf. Accessed June 24, 2008. 30 31 Maulbetsch, J., and M. DiFilippo, 2006, Cost and Value of Water Use at Combined Cycle Power 32 Plants, Public Interest Energy Research (PIER) Program Final Project Report, CEC-500-2006-33 034, prepared for the California Energy Commission, April. Available at http://www.energy. 34 ca.gov/2006publications/CEC-500-2006-034/CEC-500-2006-034.PDF. Accessed July 29, 2008. 35 36 MEI (Ministerio da Economia e da Inovacao), 2007, Renewable Energy in Portugal. Available at 37 http://www.min-economia.pt/document/Energias_Renov_PT.pdf. Accessed July 28, 2008. 38 39 Moens, L., and D.M. Blake, 2005, “Advanced Heat Transfer and Thermal Storage Fluids,” 40 NREL/CP-510-37083, presented at the 2004 DOE Solar Energy Technologies Program Review 41 Meeting, Oct. 25–28, 2004, National Renewable Energy Laboratory, Golden, Colo. 42 43 Moens, L., and D.M. Blake, 2008, Mechanism of Hydrogen Formation in Solar Parabolic 44 Trough Receivers, NREL/TP-510-42468, National Renewable Energy Laboratory, Golden, 45 Colo., Feb. 46
Draft Solar PEIS F-93 December 2010
Moens, L., et al., 2003, “Advanced Thermal Storage Fluids for Solar Parabolic Trough Systems,” 1 Transactions of the ASME, vol. 125, Feb. Available at http://scitation.aip.org/getabs/ 2 servlet/GetabsServlet?prog=normal&id=JSEEDO000125000001000112000001&idtype= 3 cvips&gifs=yes. Accessed July 24, 2008. 4 5 Nellis Air Force Base, undated, Nellis Air Force Base Solar Power System. Available at 6 http://www.nellis.af.mil/shared/media/document/AFD-080117-043.pdf. Accessed July 9, 2008. 7 8 Nellis Air Force Base, 2006, Final Environmental Assessment for Leasing Nellis Air Force Base 9 Land for Construction and Operation of a Solar Photovoltaic System, Clark County, Nevada, 10 Aug. Available at http://www.nellis.af.mil/shared/media/document/AFD-070424-018.pdf. 11 Accessed July 9, 2008. 12 13 Now Public, 2008, Moura Photovoltaic Power Station. Available at http://www.nowpublic.com/ 14 environment/moura-photovoltaic-power-station. Accessed July 28, 2008. 15 16 NREL (National Renewable Energy Laboratory), 2004, Engineering Evaluation of a Molten Salt 17 HTF in a Parabolic Trough Solar Field, NREL Contract NAA-1-30441-04. Available at 18 http://www.p2pays.org/ref/22/21024.pdf. Accessed July 2, 2008. 19 20 NREL, 2008a, Troughnet: Parabolic Trough Thermal Energy Storage Technology. Available at 21 http://www.nrel.gov/csp/troughnet/thermal_energy_storage.html. Accessed Sept. 24, 2008. 22 23 NREL, 2008b, NREL Solar Cell Sets World Efficiency Record at 40.8 Percent. Available at 24 http://www/nrel.gov/news/press/2008/625.html. Accessed Nov. 18, 2008. 25 26 NREL, 2010, Photographic Information eXchange, NREL, Photo # 13739. Available at 27 http://www.nrel.gov/data/pix/searchpix.php?getrec=01701&display_type=verbose&search_ 28 reverse=1. Accessed July 26, 2010. 29 30 PowerLight, 2005, The Bavaria Solarpark. Available at http://www.scribd.com/doc/ 31 338243/Bavaria-Solarpark. Accessed June 25, 2008. 32 33 Professor of ESO, 2007, Acciona Opens in Miracle (Navarra) the Installation of Photovoltaic 34 Higher Global Production, March 19. Available at http://translate.google.com/translate?hl= 35 en&sl=es&u=http://profesordeeso.blogspot.com/2007/03/acciona-inaugura-en-milagro-navarra-36 la.html&`sa=X&oi=translate&resnum=10&ct=result&prev=/search%3Fq%3Dmilagro%2Baccio37 na%26hl%3Den%26client%3Dfirefox-a%26rls%3Dorg.mozilla:en-US:official%26sa%3DG. 38 Accessed July 1, 2008. 39 40 Project Finance Magazine, 2008, “The Case for Change,” June. Available at http://www. 41 projectfinancemagazine.com/default.asp?Page=20&PUB=157&ISS=24148&SID=693876. 42 Accessed June 24, 2008. 43 44
Draft Solar PEIS F-94 December 2010
RED (Renewable Energy Development), 2008a, Solar Energy, Solar Villar De Canas 2 Project, 1 April 9. Available at http://renewableenergydev.com/red/solar-energy-solar-villar-de-canas-2-2 project/. Accessed June 30, 2008. 3 4 RED, 2008b, Solar Energy, Abertura FV Solar Photovoltaic Plant, April 8. Available at 5 http://renewableenergydev.com/red/solar-energy-abertura-fv-solar-photovoltaic-plant/. Accessed 6 June 24, 2008. 7 8 RED, 2008c, Solar Energy: Almeria Photovoltaic Park, April 4. Available at 9 http://renewableenergydev.com/red/solar-energy-almeria-photovoltaic-park. Accessed 10 Nov. 19, 2008. 11 12 RenewableEnergyWorld.com, 2008, Epuron Sells 21-MW Solar Plan, June 20. Available at 13 http://www.renewableenergyworld.com/rea/news/story?id=52836. Accessed June 24, 2008. 14 15 SDRREG (San Diego Regional Renewable Energy Group), 2005, Potential for Renewable 16 Energy in the San Diego Region, Aug. Available at http://www.renewablesg.org. Accessed 17 July 28, 2008. 18 19 SES (Stirling Energy Systems) Solar Two, LLC, 2008, “Application for Certification,” submitted 20 to the Bureau of Land Management, El Centro, Calif., and the California Energy Commission, 21 Sacramento, Calif., June. Available at http://www.energy.ca.gov/sitingcases/solartwo/ 22 documents/applicant/afc/index.php. Accessed Oct. 1, 2008. 23 24 SES Solar Two, LLC, 2009, “Supplement to Application for Certification,” submitted to the 25 Bureau of Land Management, El Centro, Calif., and the California Energy Commission, 26 Sacramento, Calif., June. Available at http://www.energy.ca.gov/sitingcases/ 27 solartwo/documents/applicant/2009-06-12_Reclaimed_Water+Hydrogen_System_ 28 Supplement_to_AFC_TN-51973.PDF. Accessed November 20, 2009. 29 30 Solar Systems, undated a, Solar Systems’ HCPV Technology Fact Sheet. Available at 31 http://www.solarsystems.com.au/HCPV_Technology.html. Accessed June 25, 2008. 32 33 Solar Systems, undated b, Hermannsburg : Yuendumu : Lajamanu Case Study. Available at 34 http://www.solarsystems.com.au/SPSA%20case%20study.pdf. Accessed July 8, 2008. 35 36 Solar Systems, undated c, Umuwa Case Study. Available at http://www.solarsystems.com.au/ 37 Umuwa%20case%20study.pdf. Accessed July 8, 2008. 38 39 Solar Systems, undated d, White Cliffs Case Study. Available at http://www.solarsystems. 40 com.au/White%20Cliffs%20case%20study.pdf. Accessed July 8, 2008. 41 42 SPG Media Limited, 2007a, Elecnor Starts 20MW PV Project, Spain. Available at 43 http://www.power-technology.com/projects/trujillo/. Accessed June 24, 2008. 44 45
Draft Solar PEIS F-95 December 2010
SPG Media Limited, 2007b, Specifications-Elecnor Starts 20MW PV Project, Spain. Available at 1 http://www.power-technology.com/projects/trujillo/specs.html. Accessed June 24, 2008. 2 3 SPG Media Limited, 2008a, Serpa Solar Power Plant, Portugal. Available at http://www.power-4 technology.com/projects/Serpa. Accessed July 1, 2008. 5 6 SPG Media Limited, 2008b, Bavaria Solarpark, World’s Largest PV Project, Bavaria, Germany. 7 Available at http://www.power-technology.com/projects/bavaria. Accessed June 25, 2008. 8 9 Stine, W., and R. Diver, 1994, A Compendium of Solar Dish/Stirling Technology, SAND93-7026 10 UC-236, California State Polytechnic University, Pomona, Calif., and U.S. Department of 11 Energy, Sandia National Laboratories, Albuquerque, N.M., Jan. 12 13 Summers, K., and J. Radde, 2004, Potential Health and Environmental Impacts Associated with 14 the Manufacture and Use of Photovoltaic Cells, Publication P500-04-053, Public Interest Energy 15 Research Program (PIER) Final Project Report, Prepared by Tetra Tech, Inc., Lafayette, Calif., 16 for the California Energy Commission and the Electric Power Research Institute, Aug. Available 17 at http://www.energy.ca.gov/reports/500-04-053.PDF. Accessed Aug. 4, 2008. 18 19 The Guardian, 2005, Portugal Plans Biggest Solar Station, Sept. 15. Available at 20 http://www.guardian.co.uk/environment/2005/sep/15/energy/energy.renewableenergy. Accessed 21 June 23, 2008. 22 23 The Solarserver, 2007, From 1,408 Solar Photovoltaic Power Plants: Good Erlasee Solar Park 24 Is Currently the World’s Largest PV System, July 5. Available at http://translate.google.com/ 25 translate?hl=en&sl=de&u=http://www.solarserver.de/solarmagazin/anlagenovember2006. 26 html&sa=X&oi=translate&resnum=10&ct=result&prev=/search%3Fq%3Dsolarpark%2Bgut 27 %2Berlasee%26hl%3Den%26client%3Dfirefox-a%26rls%3Dorg.mozilla:en-US:official 28 %26sa%3DX. Accessed July 1, 2008. 29 30 The Solarserver, 2008, The World’s Largest Photovoltaic Solar Power Plant Is in Pocking, 31 June 25. Available at http://www.solarserver.de/solarmagazin/anlage_0606_e.html. Accessed 32 June 25, 2008. 33 34 Topaz Solar Farms, LLC, 2008, “Conditional Use Permit Application, Topaz Solar Farm,” 35 submitted to the San Luis Obispo Planning and Building Department, San Luis Obispo County, 36 Calif., July 18. Available at http://www.slocounty.ca.gov/planning/environmental/ 37 EnvironmentalNotices/optisoloar/Optisolar_App_Submit.htm. Accessed July 14, 2009. 38 39 Topaz Solar Farms, LLC, 2009, “Revised Conditional Use Permit Application, Topaz Solar 40 Farm,” submitted to the San Luis Obispo Planning and Building Department, San Luis Obispo 41 County, Calif. June 25. Available at http://www.slocounty.ca.gov/planning/environmental/ 42 EnvironmentalNotices/optisoloar/topaz6-09.htm. Accessed Dec. 1, 2009. 43 44 Wu, J., et al., 2002, “Unusual Properties of the Fundamental Band Gap of InN,” Applied Physics 45 Letters 80:3967–3969. 46
47
Draft Solar PEIS F-96 December 2010
Valenzuela, L., et al., 2004, “Direct Steam Generation in Solar Boilers,” IEEE Control Systems 1 Magazine, pp. 15–29, April. Available at http://ieeexplore.ieee.org/iel5/37/28539/01275429.pdf. 2 Accessed June 16, 2008. 3 4 Zarza, E., et al., 2002, “The DISS Project: Direct Steam Generation in Parabolic Trough 5 Systems. Operation and Maintenance Experience and Update on Project Status,” Transactions 6 of the ASME, Journal of Solar Energy Engineering 124:126–133, May. Available at 7 http://scitation.aip.org/getpdf/servlet/GetPDFServlet?filetype=pdf&id=JSEEDO00012400000208 00126000001&idtype=cvips&prog=normal. Accessed June 16, 2008. 9 10 11